")
Back to Journals » Cancer Management and Research » Volume 13
Value of Nomogram Incorporated Preoperative Tumor Volume and the Number of Postoperative Pathologically Lymph Node Metastasis Regions on Predicting the Prognosis of Thoracic Esophageal Squamous Cell Carcinoma
Authors Guo XW , Zhang H, Xu L , Zhou S, Zhou J , Liu Y, Ji S
Received 21 February 2021
Accepted for publication 17 May 2021
Published 10 June 2021 Volume 2021:13 Pages 4619—4631
DOI https://doi.org/10.2147/CMAR.S307764
Checked for plagiarism Yes
Review by Single anonymous peer review
Peer reviewer comments 2
Editor who approved publication: Dr Eileen O'Reilly
Xinwei Guo,1,* Han Zhang,2,* Liben Xu,3,* Shaobing Zhou,1 juying Zhou,4 yangchen Liu,1 Shengjun Ji5
1Department of Radiation Oncology, Affiliated Taixing People’s Hospital of Yangzhou University, Taixing, People’s Republic of China; 2School of Mathematical Science and Application, Nanjing Normal University, Taizhou College, Taizhou, People’s Republic of China; 3Department of Radiotherapy, Jiangsu University Affiliated People’s Hospital, Zhenjiang, People’s Republic of China; 4Department of Radiation Oncology, The First Affiliated Hospital of Soochow University, Suzhou, People’s Republic of China; 5Department of Radiotherapy and Oncology, The Affiliated Suzhou Hospital of Nanjing Medical University, Gusu School, Nanjing Medical University, Suzhou, People’s Republic of China
*These authors contributed equally to this work
Correspondence: yangchen Liu
Department of Radiation Oncology, Affiliated Taixing People’s Hospital of Yangzhou University, Taixing, 225400, People’s Republic of China
Tel +86 13961001669
Email [email protected]
Shengjun Ji
Department of Radiotherapy and Oncology, The Affiliated Suzhou Hospital of Nanjing Medical University, Gusu School, Nanjing Medical University, Suzhou, 215002, People’s Republic of China
Tel +86 18914087033
Email [email protected]
Background: The aim of this study was to explore the influence of preoperative tumor volume, length, maximum diameter and the number of postoperative pathologically lymph node metastasis (LNM) regions on survival prognosis of esophageal squamous cell carcinoma (ESCC) patients.
Methods: A total of 296 patients with ESCC treated by standard curative esophagectomy were retrospectively analyzed. These patients were grouped for further analysis according to the optimal threshold of preoperative tumor volume, length, maximum diameter and the number of postoperative pathologically LNM regions. Kaplan–Meier method was used to calculate survival rate and survival comparison was performed by Log rank test. The Cox proportional hazards model was used to carry out univariate and multivariate analyses. Nomogram model was established by integrating statistically significant clinicopathological parameters, and the predictive value was further verified by calibration curve, concordance index (C-index) and decision curve.
Results: The univariate and multivariate Cox regression analysis all showed that differentiation grade, TNM stage, adjuvant therapy, preoperative tumor volume and the number of post operative pathologically LNM regions were independent prognostic factors for PFS and OS (all P< 0.05). The C-indexes of PFS and OS by nomograms were predicted to be 0.747 (95% CI: 0.717– 0.777) and 0.732 (95% CI: 0.697– 0.767), respectively, which were significantly higher than the 7th AJCC TNM stage, the C-indexes 0.612 (95% CI: 0.574– 0.650) and 0.633 (95% CI: 0.595– 0.671), separately. In addition, the calibration curves of nomogram models were highly consistent with actual observation for the five-year PFS and OS rate, and the decision curve analysis also showed that nomogram models had higher clinical application potentials than TNM staging model in predicting survival prognosis of thoracic ESCC after surgery.
Conclusion: The nomograms incorporated preoperative tumor volume and the number of postoperative pathologically LNM areas are of great value in predicting survival prognosis of patients with thoracic ESCC.
Keywords: esophageal neoplasm/post-operation, tumor volume, the number of lymph node metastasis areas, nomograms, prognosis
Introduction
Esophageal cancer (EC) is one of the most aggressive gastrointestinal tumors, which is the seventh leading cancer type for males in the United States.1 According to cancer statistics in 2020, there were approximately 18,440 new cases of EC and 16,170 deaths from EC, while there were about 17,650 new cases of ECin 2019.2,3 It is evaluated that the global incidence and mortality rate of EC will increase in the future years, particularly in Asia.4 The two main types of EC are adenocarcinoma (AC) and squamous cell carcinoma (SCC), of which esophageal SCC (ESCC) accounts for more than 90% in China.5,6 Despite the management and treatment is improved with the progress of science and technology in recent years, the prognosis in patients with ESCC is still poor. Therefore, the detection and prediction of methods for patients with ESCC become more and more essential.
Currently, the TNM staging system is considered to be the most extensively used system for prognostic evaluation and clinical treatment of cancer patients. It contains tumor invasive depth, regional lymph node involvement and distant metastasis, however, in clinical practice, it is often found that patients in the same TNM stage, receiving similar adjuvant therapy, there are still a huge difference in survival prognosis. The reason may be that the establishment of TNM staging system of esophageal cancer mainly depends on the Caucasian population, and its main pathological type is adenocarcinoma, but in the Asian population, esophageal squamous cell carcinoma is the dominant type, resulting in that the TNM staging system cannot thoroughly predict the prognosis of ESCC patients.
Consequently, it is critical to find other clinicopathological factors that may affect the prognosis of ESCC patients besides TNM staging. The main purpose of this study is to explore the influence of preoperative tumor volume, length, maximum diameter and the number of postoperative pathologically lymph node metastasis (LNM) regions on survival prognosis for patients with thoracic ESCC, and to evaluate the predictive survival rate of clinicopathological variables with statistical significance visually and individually by establishing nomogram model.7
Patients and Methods
Patients
From January 2011 to December 2014, 296 consecutive ESCC cases who underwent esophagectomy and lymph node dissections at the Department of Thoracic Surgery, The Affiliated Taixing People’s Hospital of Yangzhou University, were retrospectively analyzed. Patients according to the following inclusion criteria were included in the current study: (1) patients were pathologically diagnosed with ESCC, (2) patients in stage TNM I–III with radical resection were conducted, (3) patients received no preoperative treatments, (4) patients were included without any other tumors or distant metastases, (5) Preoperative detailed imaging data were acquired, including pneumobarium double contrast examination, a comprehensive assessment of computed tomography (CT) scans, and detailed records of esophagoscopy; (6) The number of postoperative pathologically lymph node metastasis regions was recorded in detail; This study was conducted in accordance with the Declaration of Helsinki and was approved by the ethics committee of The Affiliated Taixing People’s Hospital of Yangzhou University. The written informed consents were acquired from all patients for the use and publication of their information.
Measurement of Preoperative Tumor Volume, Length and Maximum Diameter and Determination of Optimal Cut-Off Value
All patients underwent enhanced CT scan of the chest before operation, with a slice thickness of 3 mm. The CT images were transmitted to TPS through the network. After image reconstruction, the gross tumor volume of esophagus was delineated by two or more attending physicians. The value of tumor volume was automatically measured by the system. The tumor diameter was the largest slice diameter on CT image, and the tumor length mainly depended on the lesion length of esophagoscopy, with reference to imaging data.
X-tile is an optimal cutpoint analysis software, particularly in regard to parsing continuous data, which was established by Yale University, and its principle is the minimum Pvalue method. With progression-free survival (PFS) as the research end point, according to X-tile analysis, the optimal cut-off values of preoperative tumor volume, tumor length and maximum diameter were 28 cm3 and 64 cm3, 3 cm and 5 cm, 2.5 cm and 3.5 cm, respectively. All patients were divided into three groups according to the cut-off values.
When overall survival (OS) was the research end point, according to X-tile analysis, the optimal cut-off values of preoperative tumor volume, tumor length and maximum diameter were 32 cm3 and 72 cm3, 3 cm and 5 cm, 2.5 cm and 3.5 cm, respectively. All patients were also divided into three groups according to the cut-off values.
Definition of the Number of Postoperative Pathologically Lymph Node Metastasis (LNM) Regions
According to the lymph node classification criteria of American Thoracic Association8 and the number of regional lymph node metastasis recorded in postoperative pathology, this study defined no lymph node metastasis as non-regional lymph node metastasis (non-regional LNM), 1–2 regional lymph node metastasis as oligo-regional lymph node metastasis (oligo-regional LNM), and ≥3 regional lymph node metastasis as multi-regional lymph node metastasis (multi-regional LNM).
Treatment and Follow-Up
In the current study, McKeown or Ivor Lewis procedure with two-field lymphadenectomy was the main surgical resection for patients with ESCC. McKeown and Ivor Lewis are commonly used procedures of esophagectomy for surgeons because they can make adequate lymph nodes dissection. According to the poor prognostic factors, cancer metastasis or recurrence, in the present study, the adjuvant radiotherapy (45–50.4 Gy) and/or chemotherapy (based on fluoropyrimidine and cisplatin) were conducted after operation.
In our hospital, patients were generally followed up every 3 months in the first two years, every 6 months for the next three years, and once a year after five years. The follow-up results were obtained from our medical records. The last follow-up was completed in December 2019.
Statistical Analysis
According to X-tile analysis, the optimal cut-off values of preoperative tumor volume, tumor length and maximum diameter were determined and all patients were divided into three groups. Kaplan-Meier method was used to calculate survival rate and survival comparison was performed by Log rank test. The univariate and multivariate Cox models were used to analyze the relationship between clinical variables and survival prognosis. ROC curves were also plotted to verify the accuracy of preoperative tumor volume and the number of postoperative pathologically LNM regions for PFS and OS prediction. A 2-tailed P-value≤0.05 was considered statistically significant. Statistical analyses were performed using the Statistical Package for Social Sciences version 25.0 (SPSS Inc., Chicago, IL, USA).
Finally, the nomogram model8 was established by integrating statistically significant clinicopathological parameters using the rms package in R version 2.14.1 (http://www.r-project.org/), and the predictive value of this model was further verified by calibration curve, concordance index (C-index) and decision curve.
Results
Patient Characteristics
In the present study, there were 239 males and 57 females with the median age of 63 years (range: 45–81 years). The distribution of pathological TNM stages was as follows: TNM I 17 patients (5.7%); TNM II 132 patients (44.6%); and TNM III 147 patients (49.7%). In stage III or lymph node-positive stage II–III ESCC patients receiving postoperative chemoradiation; According to these criteria, in our cohort, 127 (42.9%) underwent esophagectomy alone, 169 (57.1%) received postoperative chemotherapy or radiotherapy. The basic characteristics of the enrolled patients are shown in Table 1.
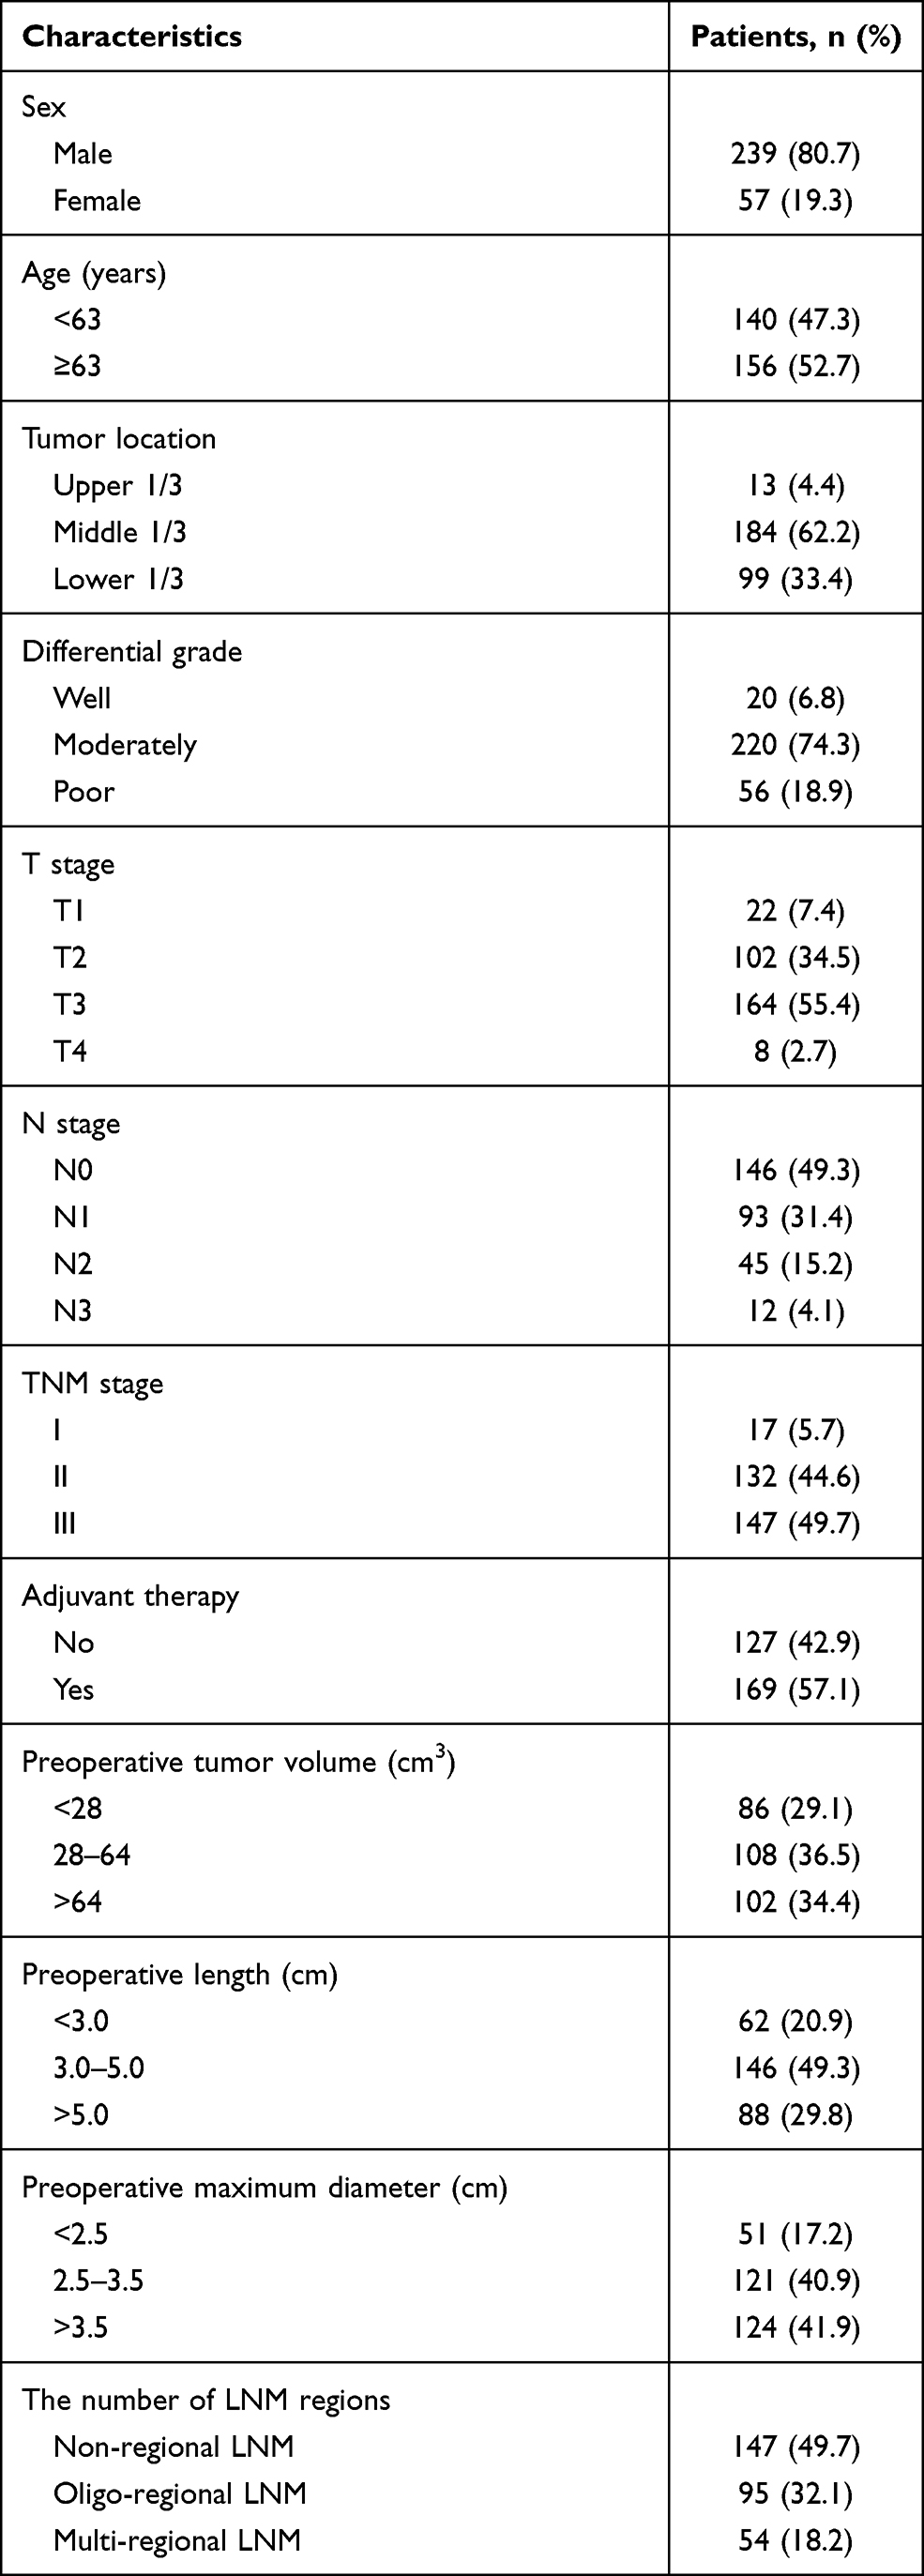 |
Table 1 Clinicopathological Characteristics of 296 Patients with Esophageal Squamous Cell Carcinoma Receiving Surgery |
Effect of Preoperative Tumor Volume, Length and Maximum Diameter Combined with the Number of Postoperative Pathologically LNM Regions on PFS
Among the 296 patients, the median PFS time was 17.0 months (95CI: 13.312–20.688); The PFS rates at the 1-, 3- and 5-year period were 60.5%, 26.7% and 23.0%, respectively; As is shown in Figure 1, in the preoperative tumor volume <28 cm3 group, the 1-, 3-, and 5-year PFS rates were 89.5%, 54.7% and 47.7% separately; In the 28–64 cm3 group, the 1 -, 3 - and 5-year PFS rates were 52.8%, 23.1% and 19.4%; while in the >64 cm3 group, the 1 -, 3 - and 5-year PFS rates were 44.1%, 6.9% and 5.9%, respectively (see Figure 1A, χ2=67.328, P<0.001). In the preoperative tumor length <3 cm group, the 1-, 3-, and 5-year PFS rates were 80.6%, 56.5% and 46.8%; In the 3–5 cm group, the 1-, 3-, and 5-year PFS rates were 59.6%, 24.7% and 21.9%; while in the >5 cm group, the PFS rates were 42.0%, 9.1% and 8.0%, respectively (see Figure 1B, χ2=49.507, P<0.001). In the preoperative maximum diameter <2.5 cm group, the 1-, 3-, and 5-year PFS rates were 90.2%, 60.8% and 54.9%; In the 2.5–3.5 cm group, the 1-, 3-, and 5-year PFS rates were 62.8%, 29.8% and 24.0%; In the >3.5 cm group, the PFS rates were 46.0%, 9.7% and 8.9%, respectively (see Figure 1C, χ2=55.502, P<0.001). Finally, in the patients of non-regional lymph node metastasis group, the PFS rates in 1-, 3- and 5-years were 68.7%, 34.0% and 29.3%, separately; In the patients of oligo-regional lymph node metastasis group, the 1-, 3- and 5-year PFS rates were 61.1%, 28.4% and 25.3%, respectively; In the patients of multi-regional lymph node metastasis group, the 1-, 3- and 5-year PFS rates were 37.0%, 3.7% and 1.9%, separately, (see Figure 1D, χ2=18.257, P<0.001).
 |
Figure 1 Kaplan–Meier survival curves for progression-free survival (PFS) in patients with ESCC receiving surgery. (A) 1-, 3-, and 5-year PFS of patients with preoperative tumor volume <28 cm3 were longer than those with 28–64 cm3 group or >64 cm3 group. (P< 0.001, log-rank). (B) 1-, 3-, and 5-year PFS of patients with preoperative tumor length <3 cm were obvious different from those with 3–5 cm group or >5 cm group. (P < 0.001, log-rank). (C) 1-, 3-, and 5-year PFS of patients with preoperative maximum diameter <2.5 cm group were obviously improved compared with patients of 2.5–3.5 cm group or >3.5 cm group. (P < 0.001, log-rank). (D) 1-, 3-, and 5-year PFS of patients with non-regional lymph node metastasis group were longer than those with oligo or multiple-regional lymph node metastasis group. (P< 0.001, log-rank). |
Effect of Preoperative Tumor Volume, Length and Maximum Diameter Combined with the Number of Postoperative Pathologically LNM Regions on OS
The median overall survival (OS) time was 37 months for the 296 patients, and the OS rates in 1-, 3- and 5-year were 97.6%, 50.4% and 33.4%, respectively. Among the patients whose tumor volume was <32 cm3, the 1 -, 3 - and 5-year survival rates were 100%, 84.0% and 68.1%; In the 32–72 cm3 group, the 1 -, 3 - and 5-year survival rates were 98.3%, 42.4% and 24.6%; In the >72 cm3 group, the 1 -, 3 - and 5-year survival rates were 94.0%, 25.0 and 7.1% (see Figure 2A, χ2 = 86.639, P< 0.001). The patients with tumor length < 3.0 cm, the 1 -, 3 -, and 5-year OS rates were 100.0%, 87.1% and 69.4%; In the 3.0–5.0 cm group, the 1 -, 3 -, and 5-year OS rates were 98.6%, 47.9% and 30.1%; In the >5.0 cm group, the 1 -, 3 -, and 5-year OS rates were 94.3%, 29.5%, 13.6%, respectively (see Figure 2B, χ2 = 53.607, P< 0.001). The 1, 3 and 5-year OS rates were 99.5%, 84.3% and 74.5% in the maximum diameter < 2.5cm group; the 1-, 3- and 5-year survival rates were 98.3%, 57.0% and 36.4% in the 2.5–3.5cm group; the 1, 3 and 5-year survival rates were 96.0%, 29.0% and 13.7% in the maximum diameter > 3.5cm group (see Figure 2C, χ2 = 62.109, P < 0.001). In the patients of non-regional lymph node metastasis group, the OS rates in 1-, 3- and 5-years were 99.1%, 61.9% and 44.9%, separately; In the patients of oligo-regional lymph node metastasis group, the 1-, 3- and 5-year OS rates were 95.8%, 51.6% and 33.7%, respectively; In the patients of multi-regional lymph node metastasis group, the 1-, 3- and 5-year OS rates were 96.3%, 18.5% and 1.9%, separately, (see Figure 2D, χ2=57.208, P<0.001).
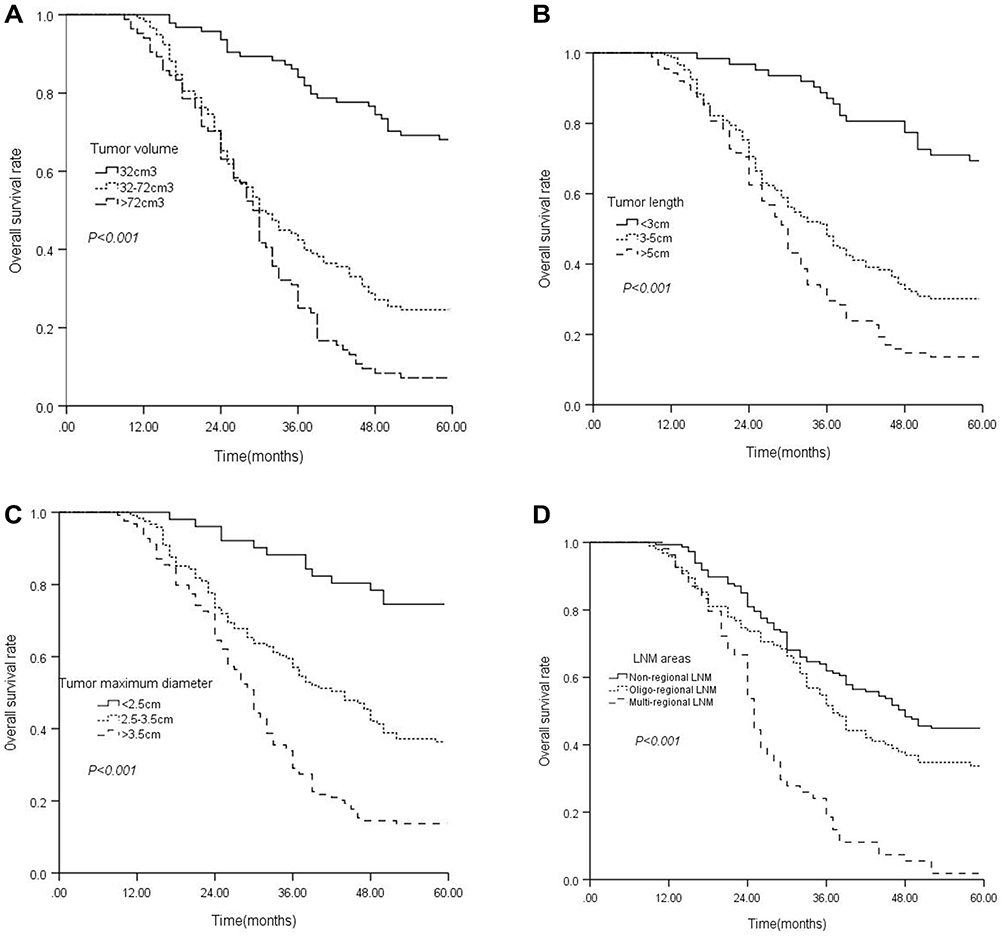 |
Figure 2 Kaplan–Meier survival curves for overall survival (OS) in patients with ESCC after surgery. (A) 1-, 3-, and 5-year OS of patients with preoperative tumor volume <32 cm3 were longer than those with 32–72 cm3 group or >72 cm3 group. (P< 0.001, log-rank). (B) 1-, 3-, and 5-year OS of patients with preoperative tumor length <3 cm were obvious different from those with 3–5 cm group or >5 cm group. (P < 0.001, log-rank). (C) 1-, 3-, and 5-year OS of patients with preoperative maximum diameter <2.5 cm group were obviously improved compared with patients of 2.5–3.5 cm group or >3.5 cm group. (P < 0.001, log-rank). (D) 1-, 3-, and 5-year OS of patients with non-regional lymph node metastasis group were longer than those with oligo or multiple-regional lymph node metastasis group. (P< 0.001, log-rank). |
Univariate and Multivariate Survival Analyses
The results of univariate analysis of the factors related to PFS and OS are shown in Table 2. In univariate analysis, the following factors were significantly associated with PFS and OS: differentiation grade, T stage, N stage, TNM stage, adjuvant therapy, preoperative tumor volume, length, maximum diameter and the number of postoperative pathologically LNM regions (all P<0.05, see Table 2). Furthermore, multivariate Cox regression analysis showed that differentiation grade, TNM stage, adjuvant therapy, preoperative tumor volume and the number of postoperative pathologically LNM regions were independent prognostic factors for PFS and OS in ESCC patients following surgery (all P<0.05, see Table 3).
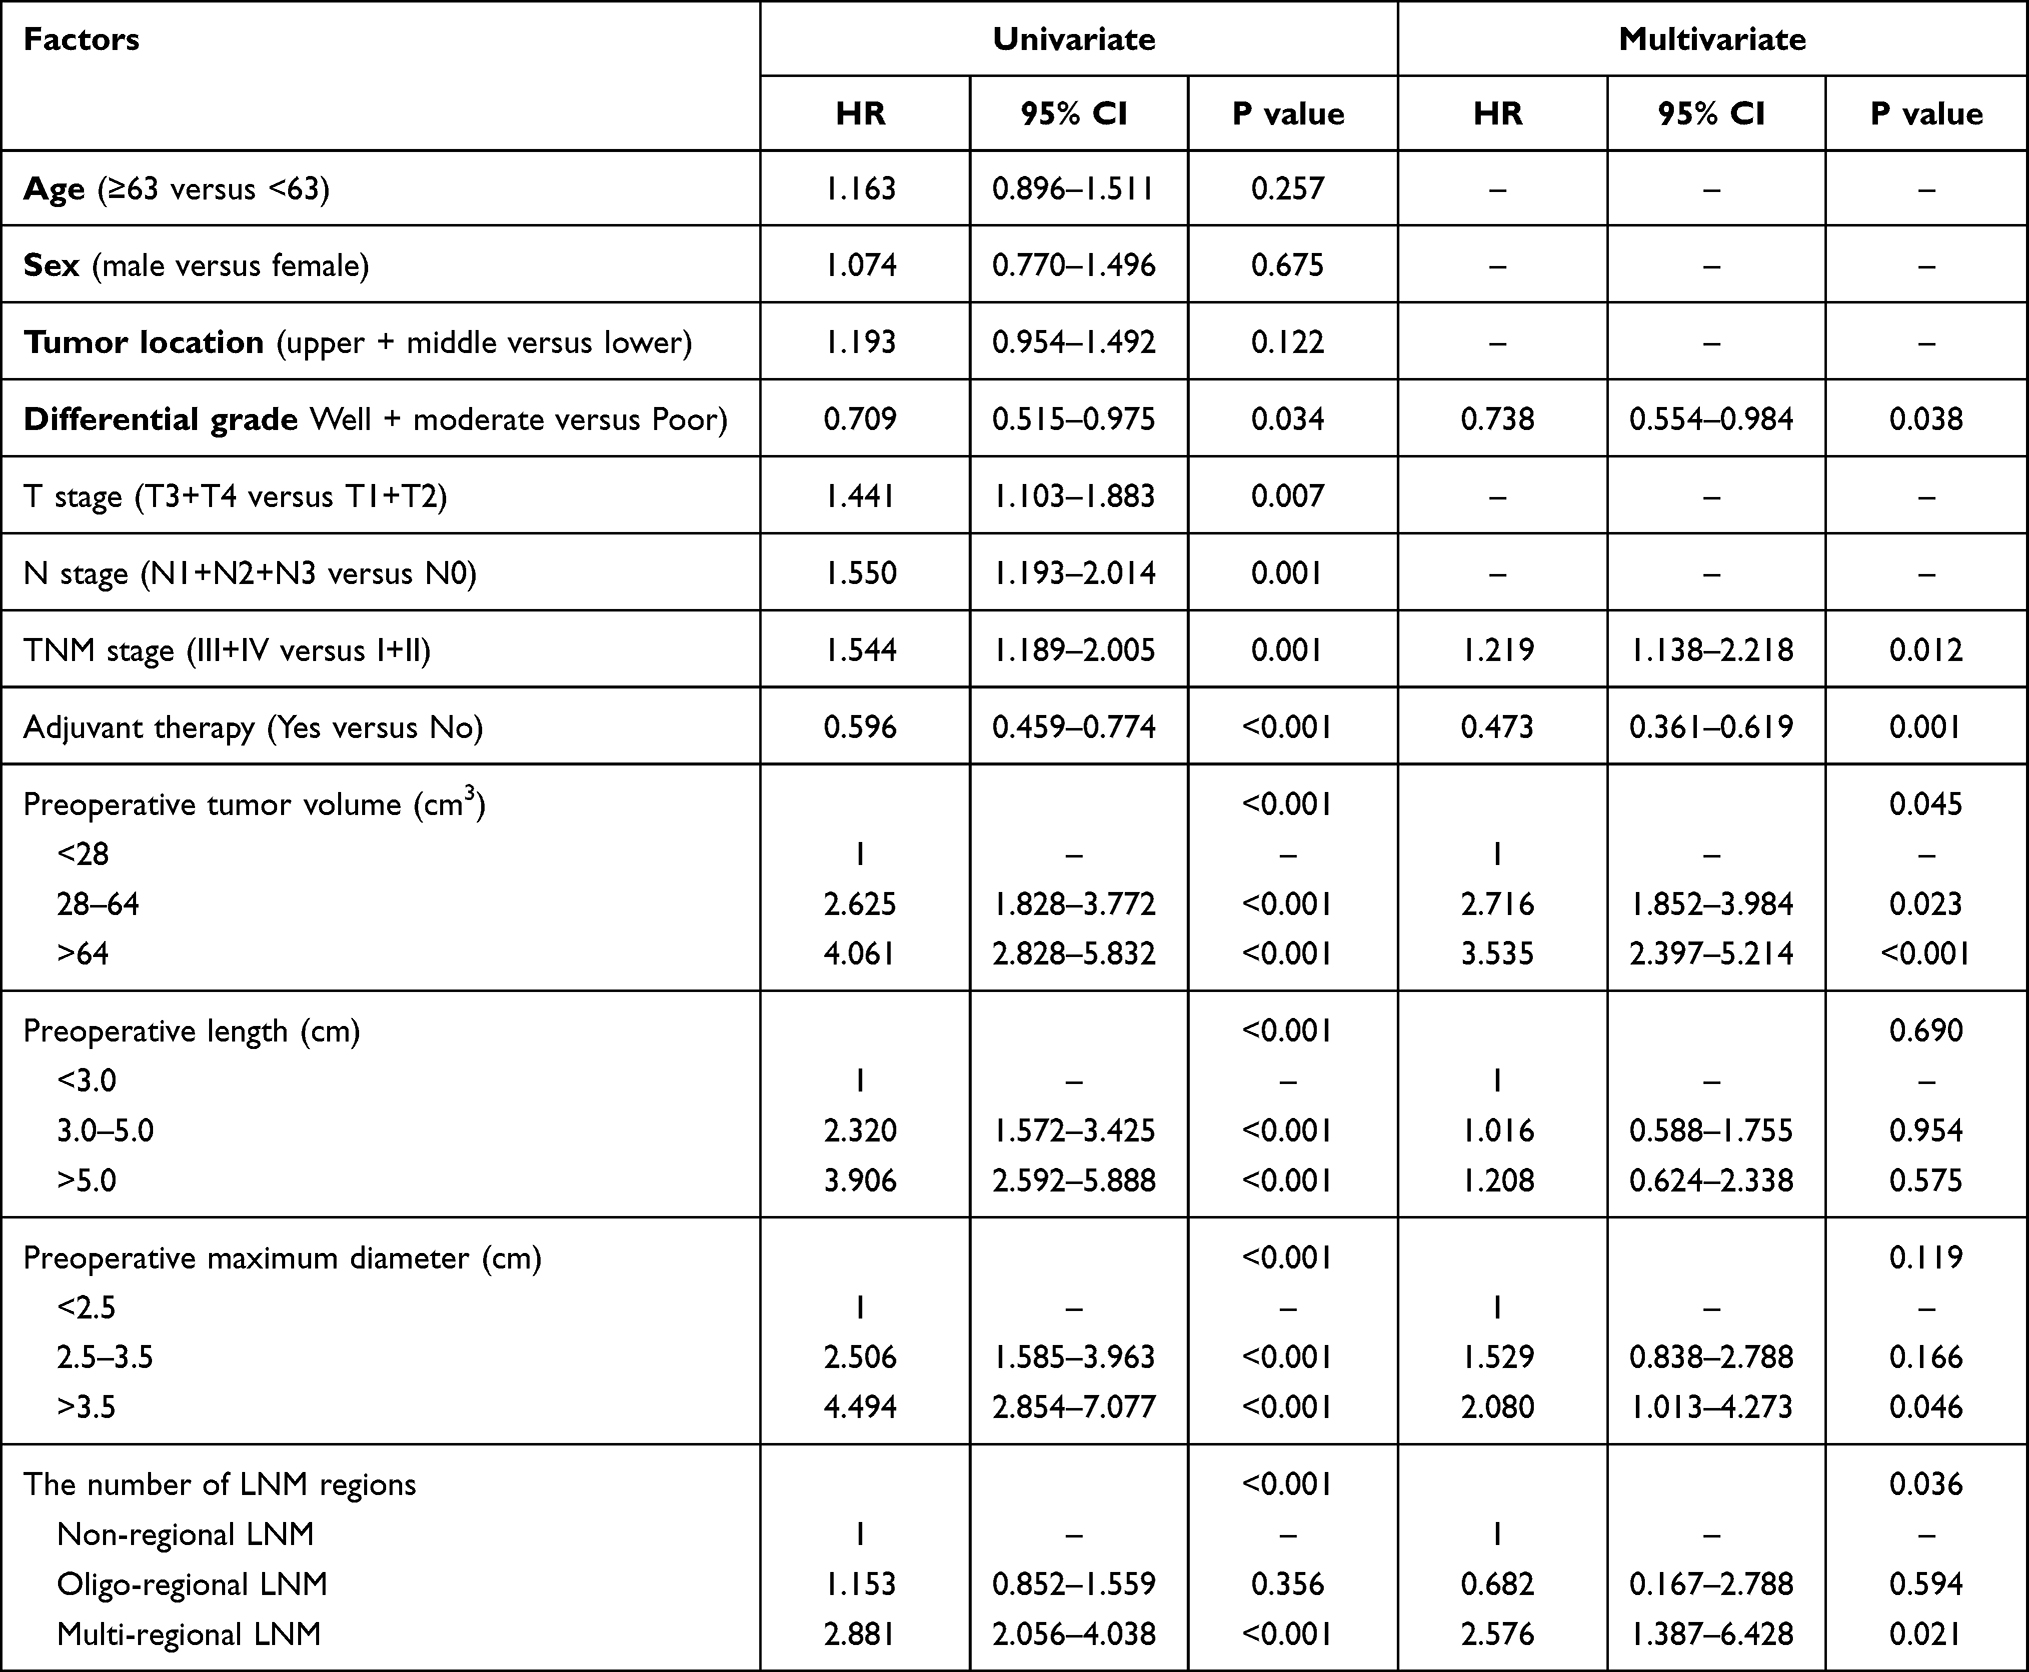 |
Table 2 Univariate and Multivariate Analysis for PFS in 296 Esophageal Squamous Cell Carcinoma Treated by Surgery |
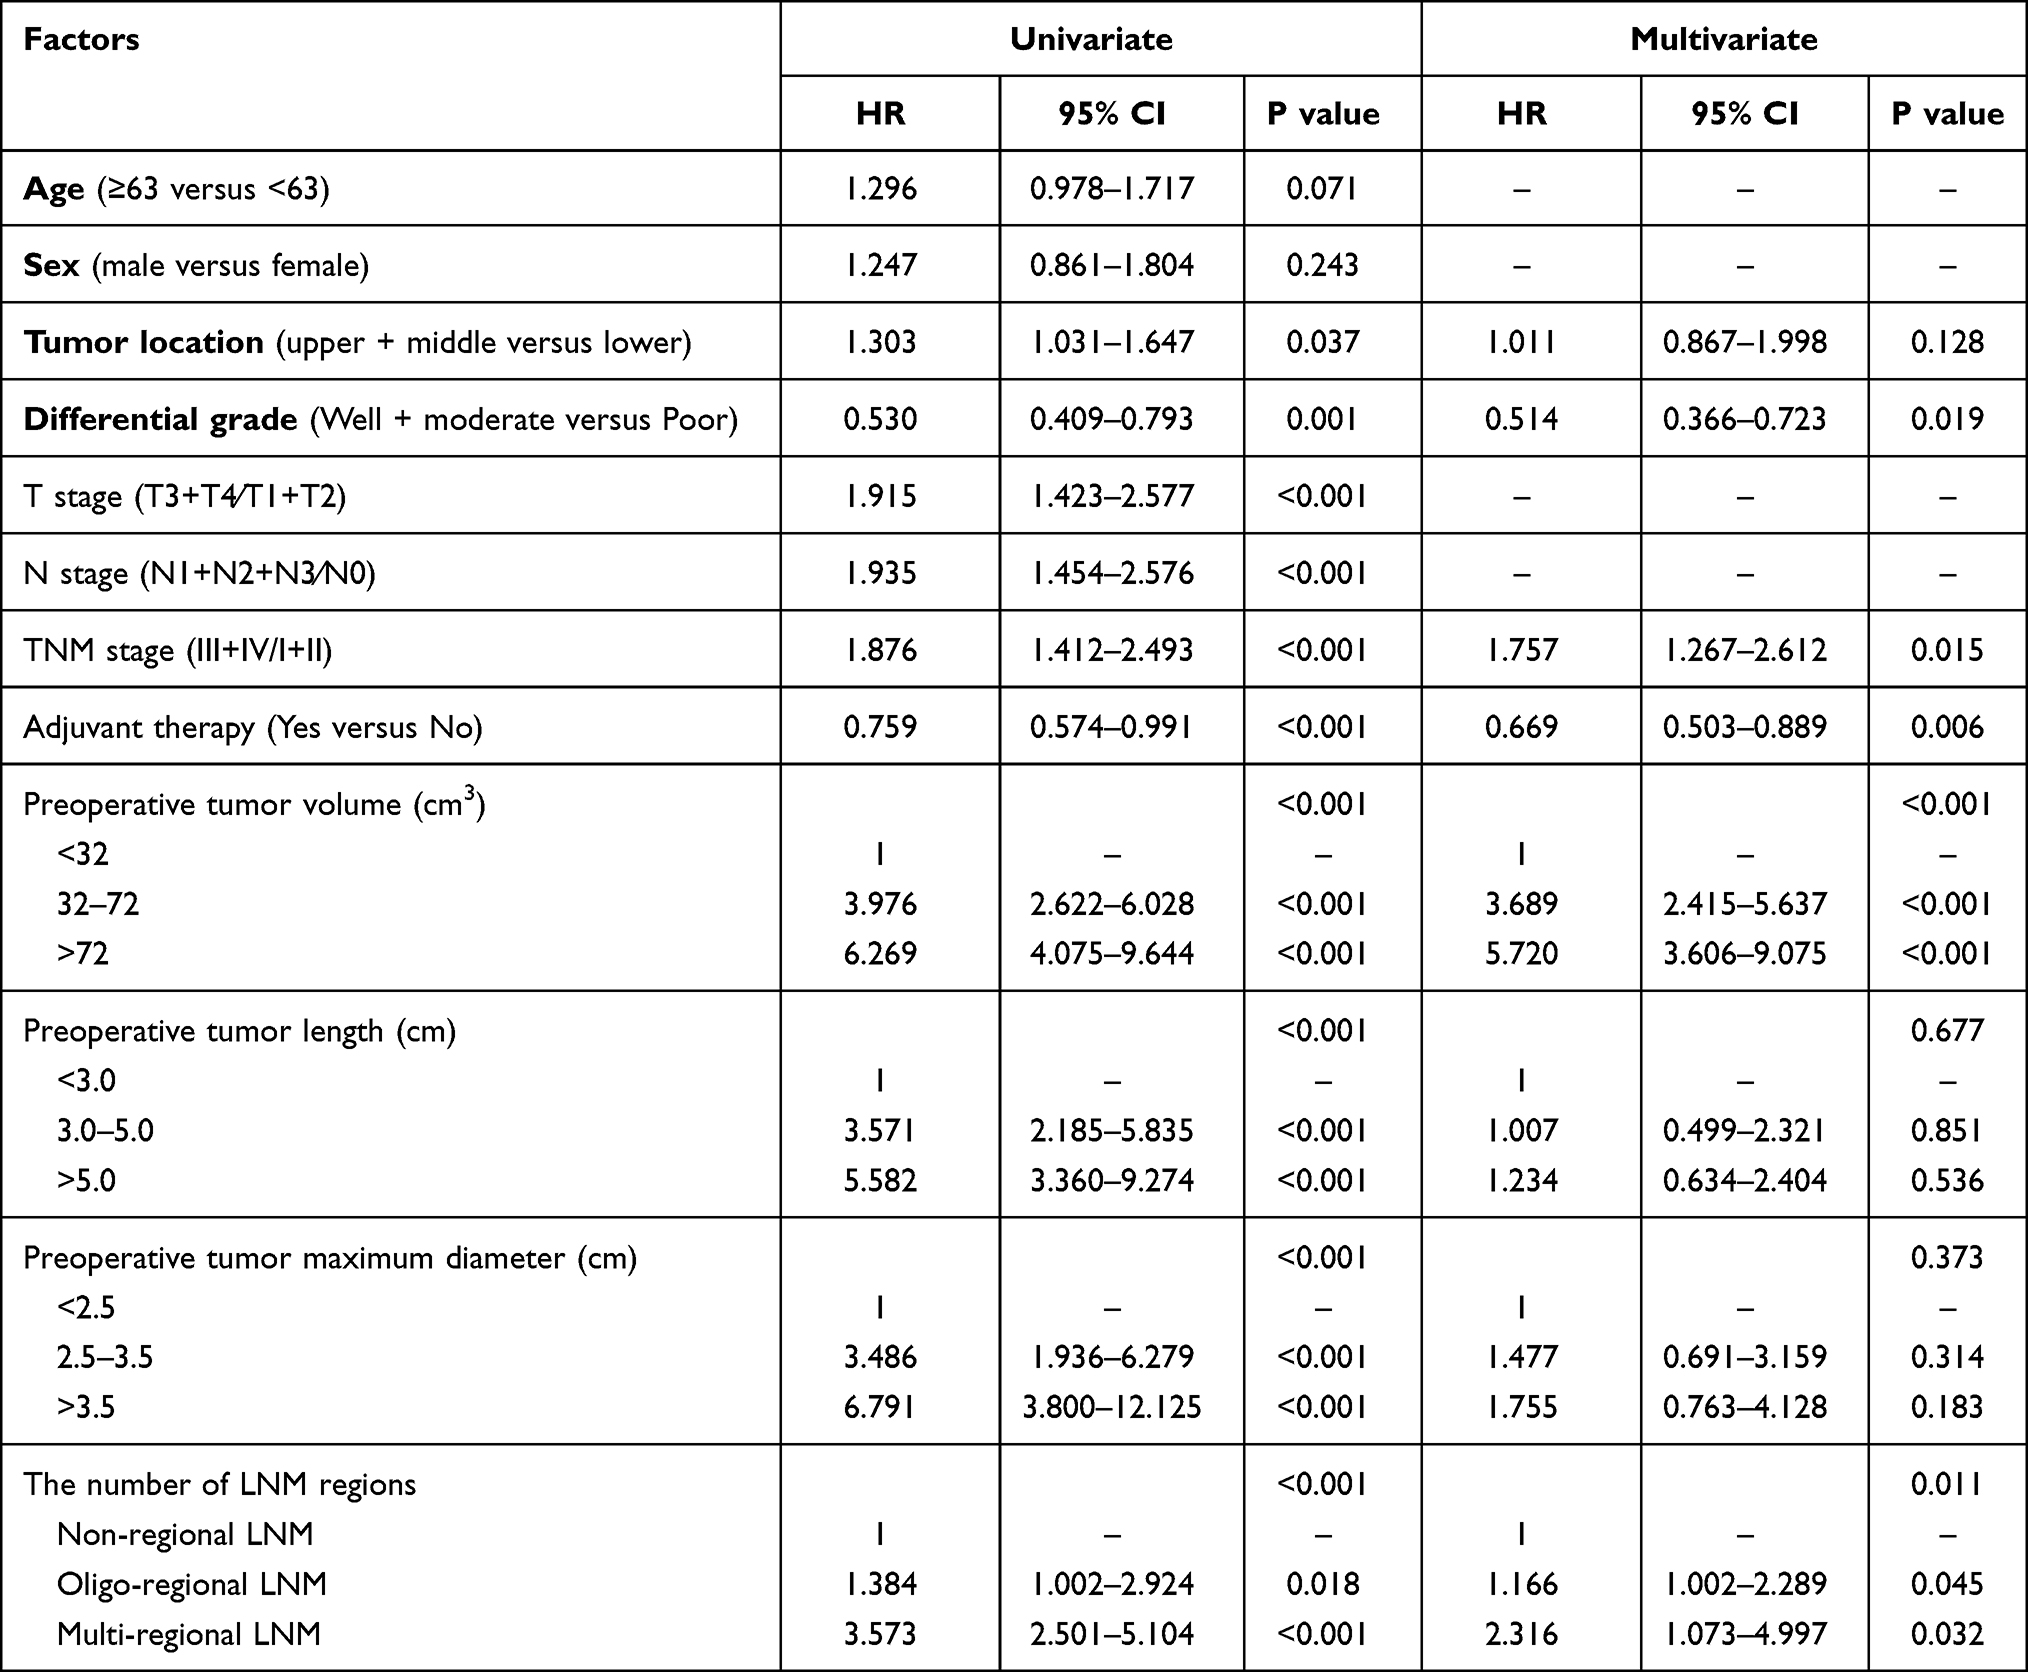 |
Table 3 Univariate and Multivariate Analysis for OS in 296 Esophageal Squamous Cell Carcinoma Followed by Surgery |
ROC Curve for Survival Prediction
Figure 3 shows the ROC curve analysis of preoperative tumor volume and the number of postoperative pathologically LNM regions for PFS prediction. As shown in Figure 3A, the area under the curve (AUC) for preoperative tumor volume and the number of postoperative pathologically LNM regions was 0.751 (95% CI: 0.687–0.815, P<0.001) and 0.627 (95% CI: 0.559–0.695, P= 0.002), respectively. The results indicated that preoperative tumor volume was superior to the number of postoperative pathologically LNM regions as a predictive factor for PFS in patients with ESCC receiving surgery.
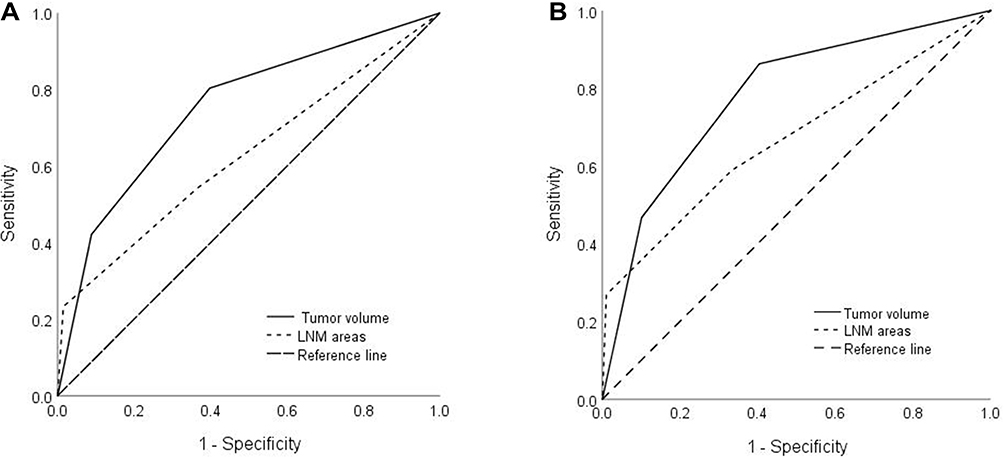 |
Figure 3 ROC curve for survival prediction. (A) ROC curves of preoperative tumor volume and the number of postoperative pathologically LNM regions for predicting PFS. (B) ROC curves of preoperative tumor volume and the number of postoperative pathologically LNM regions for predicting OS. |
ROC curves for OS were also plotted. As shown in Figure 3B, the AUC was 0.780 (95% CI: 0.724–0.836, P<0.001) for preoperative tumor volume and 0.670 (95% CI: 0.609–0.730, P<0.001) for the number of postoperative pathologically LNM areas, indicating that preoperative tumor volume was also superior to the number of postoperative pathologically LNM regions as a predictive factor for OS in patients with ESCC after surgery.
Prediction Nomogram for PFS and OS
The multivariate COX regression analysis identified differentiation grade, TNM stage, adjuvant therapy, preoperative tumor volume and the number of postoperative pathologically LNM regions were independent prognostic factors for PFS (see Table 3). The model that incorporated the above independent predictors was developed and presented as the nomogram (Figure 4A). The C-index for the prediction nomogram was 0.747 (95% CI: 0.717–0.777) by internal bootstrapping validation, which was significantly higher than the 7th AJCC TNM stage, the C-index 0.612 (95% CI: 0.574–0.650); The calibration curve of the nomogram for the 5-year PFS demonstrated good agreement between prediction and observation in the primary cohort (Figure 4B); The decision curve analysis for the 5-year PFS nomogram model is presented in Figure 4C. The decision curve showed that if the threshold probability >30%, using the nomogram model to predict the 5-year PFS could add more benefit than TNM staging-based model.
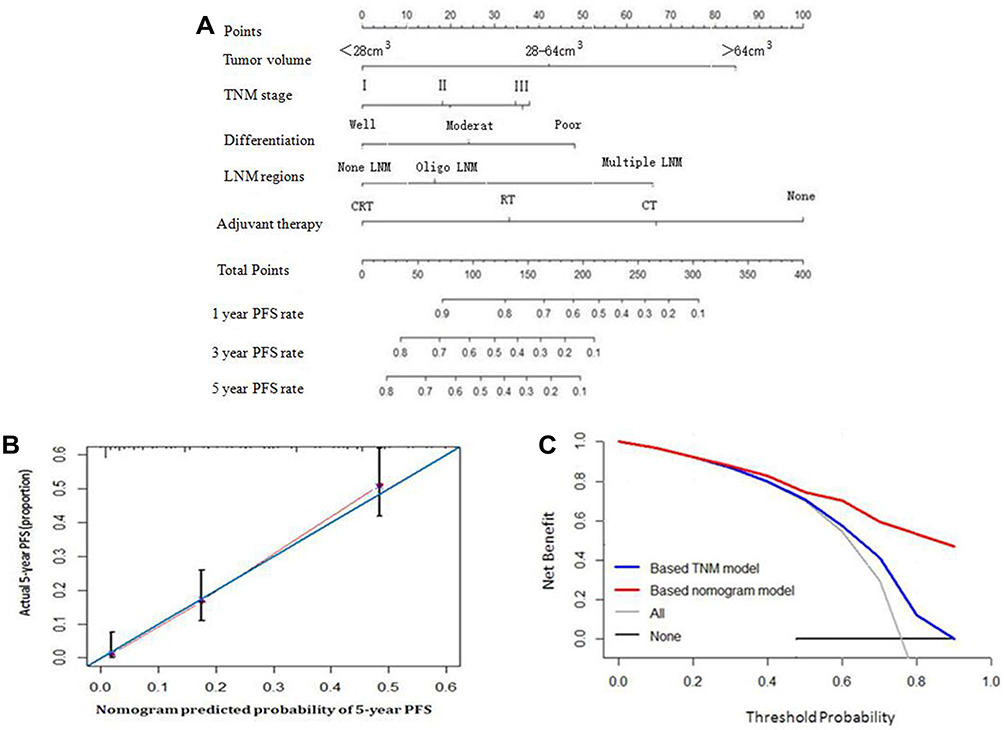 |
Figure 4 Prediction Nomogram for PFS. (A) The model that incorporated differentiation grade, TNM stage, adjuvant therapy, preoperative tumor volume and the number of postoperative pathologically LNM regions was developed and presented as the nomogram; (B) The calibration curve of the nomogram for the 5-year PFS; (C) The decision curve analysis of the nomogram for the PFS. |
The prognostic nomogram that integrated all significant independent factors for OS in the primary cohort is shown in Figure 5A. By internal bootstrapping validation, the C-index for OS prediction was 0.732 (95% CI: 0.697–0.767), which was significantly higher than the 7th AJCC TNM stage, the C-index 0.633 (95% CI: 0.595–0.671). The calibration plot for the probability of OS at 5 year after surgery showed an optimal agreement between the prediction by nomogram and actual observation (see Figure 5B). In the decision curve analysis, the nomogram model demonstrated high potential of clinical application because it ensured better net benefits throughout the entire range of threshold probabilities for 5 years OS compared with the TNM staging systems (see Figure 5C). These results suggest that our nomogram model has better performance for predicting OS than the 7th AJCC TNM classifications.
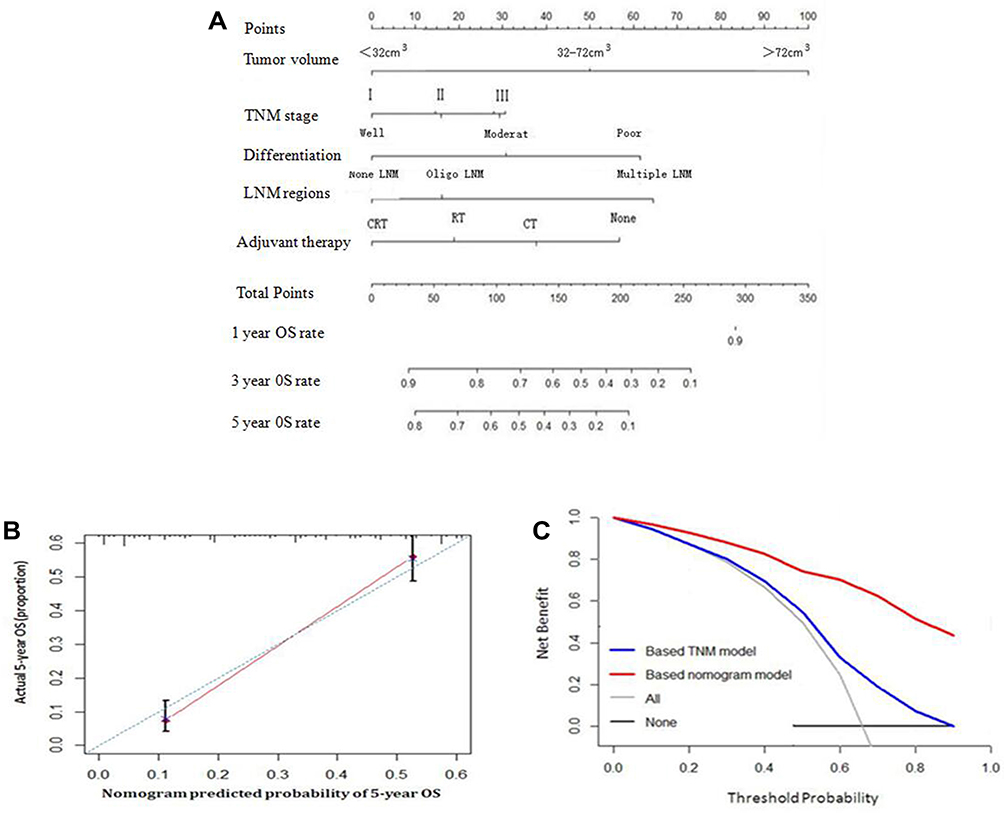 |
Figure 5 Prediction Nomogram for OS. (A) The model that integrated all significant independent factors for OS was shown as the nomogram; (B) The calibration curve of the nomogram for the 5-year OS; (C) The decision curve analysis of the nomogram for the OS. |
Correlations Among Preoperative Tumor Volume, Length, and Maximum Diameter
Univariate analysis showed that preoperative tumor volume, length, and maximum diameter were all associated with survival outcome; Furthermore, the correlations of preoperative tumor volume, length, and maximum diameter were examined using Pearson correlation analysis (see Figure 6). The results showed that there were moderate correlations among preoperative tumor volume and length, preoperative tumor volume and maximum diameter, and preoperative tumor length and maximum diameter (correlation coefficient R2 = 0.655, 0.684 and 0.440, respectively).
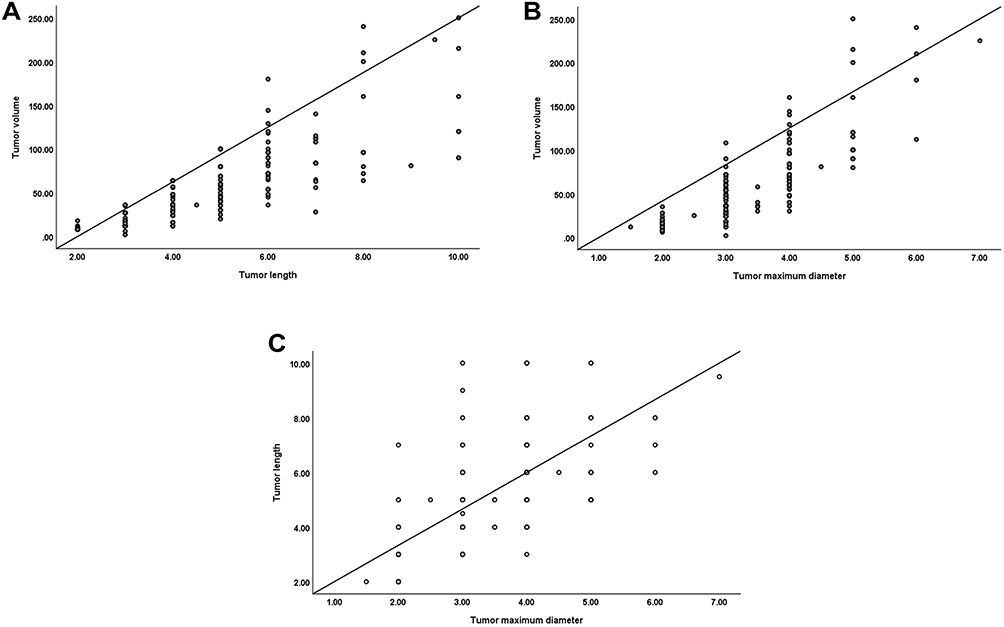 |
Figure 6 Correlations among preoperative tumor volume, length, and maximum diameter. (A) Correlation chart between preoperative tumor volume and length (regression line: Y=−39.458+19.612×X, correlation coefficient: R2 =0.655, P<0.001). (B) Correlation chart between preoperative tumor volume and maximum diameter (regression line: Y= −66.700+37.334×X, correlation coefficient: R2 =0.684, P<0.001). (C) Correlation chart between preoperative tumor length and maximum diameter (regression line: Y= 0.697+1.236×X, correlation coefficient: R2 =0.440, P<0.001). |
Discussion
To the best of our knowledge, this is the first report to demonstrate the clinical significance of preoperative tumor volume, length, maximum diameter and the number of postoperative pathologically LNM regions on survival prognosis of ESCC patients. In this present study, the univariate and multivariate analysis all showed that preoperative tumor volume and the number of postoperative pathologically LNM regions were independent prognostic factors for PFS and OS in ESCC patients following surgery. We further integrated these factors into the nomogram model to forecast probabilities of OS and PFS in 5 years, which demonstrated high accuracy of this nomogram through internal validation. Compared with the TNM stage, the nomogram was more predictive, guiding the prognosis evaluation of thoracic ESCC patients receiving surgery in terms of visualization and individualization.
In addition to histology, depth of invasion, and number of positive nodes, which are currently reflected in the American Joint Committee on Cancer (AJCC) staging system, other factors such as preoperative tumor volume, length, maximum diameter and the number of postoperative pathologically LNM regions have been examined and are significant prognostic variables in esophageal cancer. With the advent of 3D CT-based treatment planning for radiotherapy, we now have the ability to routinely evaluate tumor volume as a predictor of response and outcome. The importance of tumor volume as a prognostic factor has been established in many disease sites, including non-small cell lung cancer (NSCLC) and head and neck cancer,9–11 Tumor volume as a prognostic factor in esophageal cancer has been examined in patients receiving surgery alone for squamous cell carcinoma12 and adenocarcinoma,13 as well as for squamous cell carcinoma treated with radiotherapy alone.14 In the present study, the delineation of preoperative tumor volume is determined on the basis of CT images combined with comprehensive evaluation of lesion length shown by esophageal barium meal examination and esophagoscopy. The advantages of the three examinations complement each other making the tumor volume of esophageal cancer delineation closer to the actual tumor situation. The cut-off value of preoperative tumor volume is finally determined according to the analysis of X-tile software developed by Yale University; Univariate and multivariate analysis all showed that preoperative tumor volume had important value in predicting survival prognosis.
At present, the tumor length is still controversial for the prognosis of esophageal cancer. Bollschweiler et al15 showed that length of tumor correlated with pT/ypT-category (P<0.01). Univariate but not multivariate analysis showed better survival for tumors <3 cm (P<0.05) in patients with esophageal carcinoma, while Zhang et al16 found that the tumor length was found to be an important prognostic factor for ESCC patients without receiving neoadjuvant therapy. The modification of EC staging system may consider tumor length to better predict ESCC survival and identify higher risk patients for postoperative therapy. The reasons for the controversy may be as follows: Firstly, most of the studies were retrospective studies, and the sample size was different, which affected the reliability of the conclusions; Secondly, there were both squamous cell carcinoma and adenocarcinoma in the enrolled patients, which are two diseases with different biological behaviors in the current research, and analysis together would affect the authenticity of the conclusion; Finally, the methods to measure the tumor length were different, and the determination of optimal cut-off value was also quite different. In this research, the recruited targets were all operable thoracic ESCC patients, and the tumor length mainly depended on the lesion length of esophagoscopy, with reference to imaging data. The univariate analysis demonstrated that the preoperative tumor length was a risk factor for survival prognosis, but the multivariate analysis did not reach statistical significance.
At present, studies have proved that the esophageal mucosa and submucosal lymphatic vessels are rich. Once the tumor invades the submucosa, the degree of regional lymph node metastasis will increase significantly. The deeper the tumor invades, the more chances the tumor cells enter the lymphatic vessels, and the higher regional lymph node metastases.17 The maximum diameter of esophageal cancer indirectly reflects the degree of tumor invasion, and it can affect T stage and predict the prognosis of patients to a certain extent.18 In this study, the tumor maximum diameter was the largest slice diameter on CT images. The survival curve showed that the maximum diameter of the tumor divided into <2.5 cm group, 2.5–3.5 cm group and >3.5 cm group, the 1 -, 3 -, and 5-year survival rates were significantly different; However, in multivariate analysis, it was found that the survival prognosis of thoracic ESCC patients was not statistically significant.
As an important part of TNM staging, lymph node metastasis is also one of the main factors affecting the prognosis of esophageal cancer patients. The seventh edition AJCC-TNM staging published in 2009 only included the number of lymph node metastasis into the staging system,19 but the number of lymph node metastasis regions was not considered. Xu et al20 reported that N-classification of esophageal carcinoma depending on the extent of LN metastasis, rather than by number alone, might be a better means of staging that could subgroup patients more effectively and result in different rates of survival. In this study, according to the American Thoracic Association of lymph node classification criteria and the number of LNM areas, the patients were divided into non-regional LNM group, oligo-regionalLNM group and multi-regional LNM group, in the univariate and multivariate COX analysis, the results showed that the number of LNM areas was independent prognostic factors for PFS and OS for patients with ESCC after radical resection.
In view of the advantages of visualization and individualization of medical nomogram in predicting the survival rate of patients, many malignant tumors have developed corresponding nomogram models, whose predictive value is better than the traditional TNM staging model. Some experts suggest that it should be used as an alternative, or even become a new standard.21 In this paper, the clinicopathological parameters with statistical significance, such as differentiation grade, TNM stage, adjuvant therapy, preoperative tumor volume and the number of postoperative pathologically LNM regions, were included in the nomogram model, and the C-indexes of PFS and OS were predicted to be 0.747 and 0.732, respectively, which were significantly higher than the 7th AJCC TNM stage, the C-indexes 0.612 and 0.633, separately. In addition, the calibration curves of nomograms model were highly consistent with actual observation for the five-year PFS and OS rate, and the decision curve analysis also showed that nomograms model had higher clinical application potentials than TNM staging model in predicting survival prognosis of thoracic ESCC after surgery.
The study has some limitations. Firstly, this study was limited due to a single-center study in small sample with the retrospective character. Secondly, the cut-off values for preoperative tumor volume, length and maximum diameter were identified from a single center, which may pose some influences to the results of our study; Thirdly, the validation of nomogram was limited to cases in our research center, and the validation of external data was not strictly performed. Therefore, the validity of nomogram needs to be expected with more large-sample, double-blinded, randomized prospective trials in the future.
In conclusion, the results of this study found that the nomograms incorporated the preoperative tumor volume and the number of postoperative pathologically LNM areas have important value in predicting PFS and OS time for patients with thoracic ESCC. However, considering the retrospective nature of this study, large-scale prospective trials are still warranted to verify our results.
Funding
This work was supported by the grant from Suzhou Cancer Clinical Medical Center (Grant No. Szzx201506).
Disclosure
The authors declare no competing financial interests.
References
1. Feng RM, Zong YN, Cao SM, Xu RH. Current cancer situation in China: good or bad news from the 2018 global cancer statistics? Cancer Commun (Lond). 2019;39(1):22. doi:10.1186/s40880-019-0368-6
2. Siegel RL, Miller KD, Jemal A. Cancer statistics, 2019. CA Cancer J Clin. 2019;69(1):7–34. doi:10.3322/caac.21551
3. Siegel RL, Miller KD, Jemal A. Cancer statistics, 2020. CA Cancer J Clin. 2020;70(1):7–30. doi:10.3322/caac.21590
4. Malhotra GK, Yanala U, Ravipati A, Follet M, Vijayakumar M, Are C. Global trends in esophageal cancer. J Surg Oncol. 2017;115(5):564–579. doi:10.1002/jso.24592
5. Lin Y, Totsuka Y, He Y, et al. Epidemiology of esophageal cancer in Japan and China. J Epidemiol. 2013;23(3):233–242. doi:10.2188/jea.JE20120162
6. Chen W, Zheng R, Baade PD, et al. Cancer statistics in China, 2015. CA Cancer J Clin. 2016;66(2):115–132. doi:10.3322/caac.21338
7. Balachandran VP, Gonen M, Smith JJ. Nomograms in oncology: more than meets the eye. Lancet Oncol. 2015;16(4):e173–80. doi:10.1016/S1470-2045(14)71116-7
8. Casson AG, Rusch VW, Ginsberg RJ, Zankowicz N, Finley RJ. Lymph node mapping of esophageal cancer. Ann Thorac Surg. 1994;58(5):1569–1570. doi:10.1016/0003-4975(94)91986-0
9. Chen NB, Li QW, Zhu ZF, et al. Developing and validating an integrated gross tumor volume (GTV)-TNM stratification system for supplementing unresectable locally advanced non-small cell lung cancer treated with concurrent chemoradiotherapy. Radiat Oncol. 2020;15(1):260. doi:10.1186/s13014-020-01704-2
10. Romesser PB, Qureshi MM, Subramaniam RM, Sakai O, Jalisi S, Truong MT. A prognostic volumetric threshold of gross tumor volume in head and neck cancer patients treated with radiotherapy. Am J Clin Oncol. 2014;37(2):154–161. doi:10.1097/COC.0b013e31826e04d6
11. Carpén T, Saarilahti K, Haglund C, et al. Tumor volume as a prognostic marker in p16-positive and p16-negative oropharyngeal cancer patients treated with definitive intensity-modulated radiotherapy. Strahlenther Onkol. 2018;194(8):759–770. doi:10.1007/s00066-018-1309-z
12. Li H, Chen TW, Li ZL, et al. Tumour size of resectable oesophageal squamous cell carcinoma measured with multidetector computed tomography for predicting regional lymph node metastasis and N stage. Eur Radiol. 2012;22(11):2487–2493. doi:10.1007/s00330-012-2512-4
13. Li R, Chen TW, Hu J, et al. Tumor volume of resectable adenocarcinoma of the esophagogastric junction at multidetector CT: association with regional lymph node metastasis and N stage. Radiology. 2013;269:130–138. doi:10.1148/radiol.13122269
14. Chen CZ, Chen JZ, Li DR, et al. Long-term outcomes and prognostic factors for patients with esophageal cancer following radiotherapy. World J Gastroenterol. 2013;19:1639–1644. doi:10.3748/wjg.v19.i10.1639
15. Bollschweiler E, Baldus SE, Schröder W, et al. Staging of esophageal carcinoma: length of tumor and number of involved regional lymph nodes. Are these independent prognostic factors? J Surg Oncol. 2006;94:355–363. doi:10.1002/jso.20569
16. Zhang X, Wang Y, Li C, et al. The prognostic value of tumor length to resectable esophageal squamous cell carcinoma: a retrospective study. PeerJ. 2017;5:e2943. doi:10.7717/peerj.2943
17. Tachibana M, Dhar DK, Kinugasa S, et al. Esophageal cancer with distant lymph node metastasis: prognostic significance of metastatic lymph node ratio. J Clin Gastroenterol. 2000;31(4):318–322. doi:10.1097/00004836-200012000-00010
18. Cai W, Lu JJ, Xu R, et al. Survival based radiographic-grouping for esophageal squamous cell carcinoma may impact clinical T stage. Oncotarget. 2018;9(10):9512–9530. doi:10.18632/oncotarget.24056
19. Rice TW, Blackstone EH, Rusch VW. 7th edition of the AJCC Cancer Staging Manual: esophagus and esophagogastric junction. Ann Surg Oncol. 2010;17(7):1721–1724. doi:10.1245/s10434-010-1024-1
20. Xu QR, Zhuge XP, Zhang HL, et al. The N-classification for esophageal cancer staging: should it be based on number, distance, or extent of the lymph node metastasis? World J Surg. 2011;35(6):1303–1310. doi:10.1007/s00268-011-1015-9
21. Graesslin O, Abdulkarim BS, Coutant C, et al. Nomogram to predict subsequent brain metastasis in patients with metastatic breast cancer. J Clin Oncol. 2010;28(12):2032–2037. doi:10.1200/JCO.2009.24.6314
 © 2021 The Author(s). This work is published and licensed by Dove Medical Press Limited. The full terms of this license are available at https://www.dovepress.com/terms.php and incorporate the Creative Commons Attribution - Non Commercial (unported, v3.0) License.
By accessing the work you hereby accept the Terms. Non-commercial uses of the work are permitted without any further permission from Dove Medical Press Limited, provided the work is properly attributed. For permission for commercial use of this work, please see paragraphs 4.2 and 5 of our Terms.
© 2021 The Author(s). This work is published and licensed by Dove Medical Press Limited. The full terms of this license are available at https://www.dovepress.com/terms.php and incorporate the Creative Commons Attribution - Non Commercial (unported, v3.0) License.
By accessing the work you hereby accept the Terms. Non-commercial uses of the work are permitted without any further permission from Dove Medical Press Limited, provided the work is properly attributed. For permission for commercial use of this work, please see paragraphs 4.2 and 5 of our Terms.