")
Back to Journals » Cancer Management and Research » Volume 13
Value of Intra-Perinodular Textural Transition Features from MRI in Distinguishing Between Benign and Malignant Testicular Lesions
Authors Zhang P , Min X , Feng Z, Kang Z, Li B, Cai W, Fan C, Yin X, Xie J, Lv W, Wang L
Received 27 October 2020
Accepted for publication 13 January 2021
Published 28 January 2021 Volume 2021:13 Pages 839—847
DOI https://doi.org/10.2147/CMAR.S288378
Checked for plagiarism Yes
Review by Single anonymous peer review
Peer reviewer comments 3
Editor who approved publication: Dr Eileen O'Reilly
Peipei Zhang,1,* Xiangde Min,1,* Zhaoyan Feng,1 Zhen Kang,1 Basen Li,1 Wei Cai,1 Chanyuan Fan,1 Xi Yin,1 Jinke Xie,1 Wenzhi Lv,2 Liang Wang1
1Department of Radiology, Tongji Hospital, Tongji Medical College, Huazhong University of Science and Technology, Wuhan 430030, People’s Republic of China; 2Department of Artificial Intelligence, Julei Technology Company, Wuhan 430030, People’s Republic of China
*These authors contributed equally to this work
Correspondence: Liang Wang
Department of Radiology, Tongji Hospital, Tongji Medical College, Huazhong University of Science and Technology, No. 1095 Jie Fang Avenue, Qiaokou, Wuhan 430030, People’s Republic of China
Tel +86-27-83663737
Email [email protected]
Purpose: To compare the performance of histogram analysis and intra-perinodular textural transition (Ipris) for distinguishing between benign and malignant testicular lesions.
Patients and Methods: This retrospective study included 76 patients with 80 pathologically confirmed testicular lesions (55 malignant, 25 benign). All patients underwent preoperative T2-weighted imaging (T2WI) on a 3.0T MR scanner. All testicular lesions were manually segmented on axial T2WI, and histogram and Ipris features were extracted. Thirty enrolled patients were randomly selected to estimate the robustness of the features. We used intraclass correlation coefficients (ICCs) to evaluate intra- and interobserver agreement of features, independent t-test or Mann–Whitney U-test to compare features between benign and malignant lesions, and receiver operating characteristic curve analysis to evaluate the diagnostic performance of features.
Results: Eighteen histogram features and forty-eight Ipris features were extracted from T2WI of each lesion. Most (60/66) histogram and Ipris features had good robustness (ICC of both intra- and interobserver variabilities > 0.6). Three histogram and nine Ipris features were significantly different between the benign and malignant groups. The area under the curve values for Energy, TotalEnergy, and Ipris_shell1_id_std were 0.807, 0.808, and 0.708, respectively, which were relatively higher than those of other features.
Conclusion: Ipris features may be useful for identifying benign and malignant testicular tumors but have no significant advantage over conventional histogram features.
Keywords: magnetic resonance imaging, testicular disease, Ipris, texture analysis
Introduction
Testicular cancer accounts for 1% of all male tumors worldwide, but it is the most common malignant tumor in men aged 14–24 years.1,2 Orchiectomy is the gold standard of surgical treatment for malignant testicular tumors. Clinically, some benign testicular tumors may be misdiagnosed as malignant tumors and undergo unnecessary radical orchiectomy, or some patients with benign testicular tumors may undergo radical orchiectomy because of concerns regarding the risk of malignancy, thereby leading to overtreatment.3 Accurate preoperative characterization of testicular lesions is essential for choosing the best treatment. Differentiation of benign and malignant tumors may change the surgical plan. For some patients with benign tumors, enucleation may be used instead of radical orchiectomy.4,5 In few countries, biopsy is sometimes used to assess the histopathology of testicular lesions.6,7 However, biopsy is an invasive examination, and the major hurdle in the practice of biopsy for testicular lesions is the fear of tumor seeding along the needle tract, which has led to testicular biopsy not being widely used in clinical practice.6,7 Therefore, a noninvasive method is urgently needed to distinguish between benign and malignant testicular lesions.
Ultrasonography is the preferred imaging method for the evaluation of testicular disease, but it relies on the operator’s experience and provides limited information.8 Magnetic resonance imaging (MRI) can provide more anatomical and functional information and has been used for the diagnosis of testicular diseases, especially for those with unclear ultrasound diagnosis.9–11 At present, diagnoses via testicular MRI scans are mainly based on visual assessments by the naked eye, which rely on differences in the signal intensities of the lesions. However, the diagnostic method lacks quantitative and in-depth information.
Quantitative analysis methods, such as texture analysis, which may reflect the structure and characteristics of lesions that are invisible to the naked eye, have been successfully applied to many diseases.12–14 Texture analysis technology can efficiently provide spatial information about changes in gray distribution and the relationship between voxels of lesions.15 Histogram analysis is a commonly used texture extraction method for quantitative analysis of medical images, which can provide more complete and useful information regarding the lesion than the mean value, which is routinely used. Until now, few previous studies have evaluated the histogram features for the diagnosis and characterization of testicular disease.16,17
Histogram analysis for lesion characterization only involves features pertaining to the lesion itself. Recently, there has been new interest in the quantitative analysis of the peritumoral region, the area immediately surrounding the tumor parenchyma and reflecting the tumor microenvironment, which is involved in immune infiltration, vascular and lymphatic networks, and stromal inflammation.18 Intra-perinodular textural transition (Ipris), a new imaging texture analysis method, represents a set of features that reflect the heterogeneity of the transition zone from the inside to the outside of the lesion.19 Ipris was first proposed by Alilou et al in 2017 and was first applied to the differential diagnosis of benign and malignant pulmonary nodules using lung computed tomography scans.19 The results of that study showed that Ipris features are superior to shape and textural features and expert human readers.
We speculate that Ipris features may improve the diagnostic efficacy of testicular lesions. Therefore, here we explore the diagnostic value of Ipris in discriminating between benign and malignant testicular lesions and then compare the results with the commonly used histogram analysis.
Patients and Methods
Patients
This study was approved by the Institutional Review Board of Tongji Hospital of Huazhong University of Science and Technology and informed patient consent requirement was waived due to its retrospective nature. Our study was performed in compliance with the Declaration of Helsinki. We abided by patient information confidentiality and all patient identifiers were removed prior to the analysis. From February 2014 to October 2019, patients who underwent a 3.0T testicular MRI examination were included. Patients underwent testicular MRI because of scrotal discomfort, testicular lesions on ultrasound, or testicular abnormality suspected by a clinician. A flow chart of the enrolled patients for this study is shown in Figure 1. Finally, a total of 80 lesions (55 malignant lesions and 25 benign lesions) from 76 patients (age range, 8–74 years; median age, 30 years) were included in the analysis.
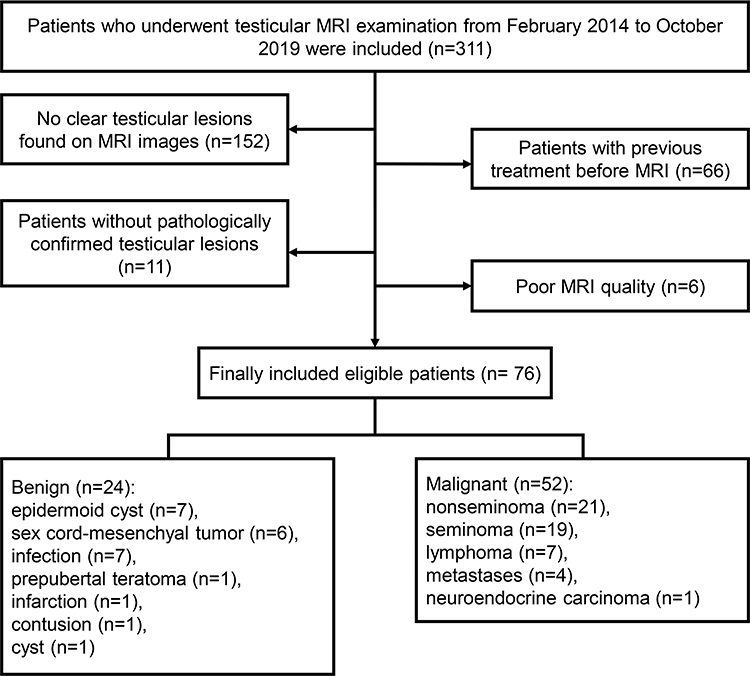 |
Figure 1 Flowchart for patient selection. |
MRI Scanning Protocol
All patients underwent preoperative testicular MRI scans in the supine position on a 3.0-T scanner (MAGNETOM Skyra, Germany Siemens Healthcare) using an 18-element body matrix coil combined with a 32-channel spine coil. Our protocol for testicular MRI examination is summarized in Table 1.
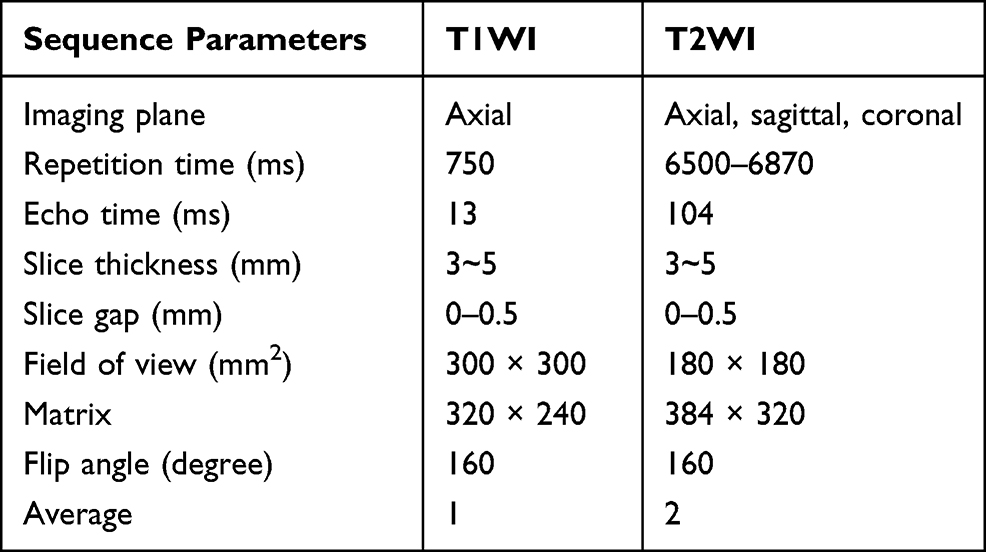 |
Table 1 MRI Protocol for Testicular Examination |
Imaging Analysis
In this study, the transverse T2-weighted imaging (T2WI) sequence, an essential component of testicular MRI, was included for analysis. An overview of the image processing is shown in Figure 2. We used ITK-SNAP software for manual segmentation of preoperative transverse T2WI images. The volume of interest of the whole lesion was obtained by mapping the region of interest (ROI) across contiguous slices along the edge of the lesion of all patients by a urogenital radiologist with 6 years of experience in interpreting testicular MRI scans (Reader 1). Then, 30 patients were randomly selected from the enrolled patients to estimate the robustness of the features. A second segmentation of these 30 patients was performed by Reader 1 to assess the intra-observer reproducibility 1 month later. Another radiologist with 4 years of experience (Reader 2) independently delineated the testicular lesions of these 30 patients for assessment of the inter-observer reproducibility. The histogram features were extracted using IF software (Intelligence Foundry 2.1, GE Healthcare, Shanghai, China). The Ipris features were extracted using Python (version 3.7.0) based on a method used in a previous study.19 Two radiologists with 4 (Reviewer 1) and 6 (Reviewer 2) years of experience in MRI of the scrotum performed image interpretation on the conventional T1-weighted imaging and T2WI sequences of testicular MRI. These radiologists did not have knowledge of the histopathologic findings.
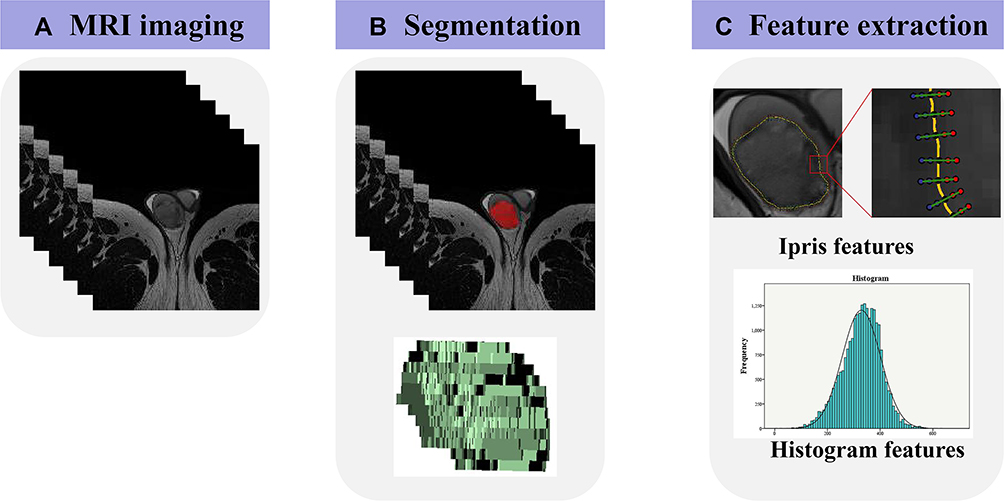 |
Figure 2 Flowchart of feature extraction. (A) All patients underwent preoperative magnetic resonance imaging. (B) Testicular lesions were delineated by stacking regions of interest (ROI) slice-by-slice on the transverse T2-weighted images. (C) The Ipris and histogram features were extracted from T2WI by Python software and IF software, respectively. |
Statistical Analysis
Based on the manual segmentation data of the 30 randomly selected patients, intra- and interobserver agreement of features were evaluated by calculating intraclass correlation coefficients (ICCs) (0–0.4, poor agreement; 0.4–0.6, moderate agreement; 0.6–0.8, good agreement; and 0.81, excellent agreement). Features with good or excellent agreement were considered to be robust against intra- and interobserver variabilities and selected for further analysis. We compared the features with ICC ≥0.6 between benign and malignant lesions using the Mann–Whitney U-test for non-normally distributed features or the independent t-test for normally distributed features. Receiver operating characteristic (ROC) curve analysis was used to assess the diagnostic performance of the features and radiologists. The optimal threshold was determined by the maximum Youden index, and the corresponding sensitivity and specificity were calculated. The statistical analyses were performed using R (http://www.Rproject.org, version 3.3.4). The threshold for statistical significance was set at two-sided p ≤0.05.
Results
A total of 66 features (18 histogram features and 48 Ipris features) were initially extracted from the T2WI images of each lesion. Most of the histogram and Ipris features showed good to excellent intra- and interobserver agreements. The distributions of the intra- and interobserver agreements are shown in Figure 3. Fifty-eight features with both intra- and interobserver ICCs higher than 0.6 were selected for further statistical analyses.
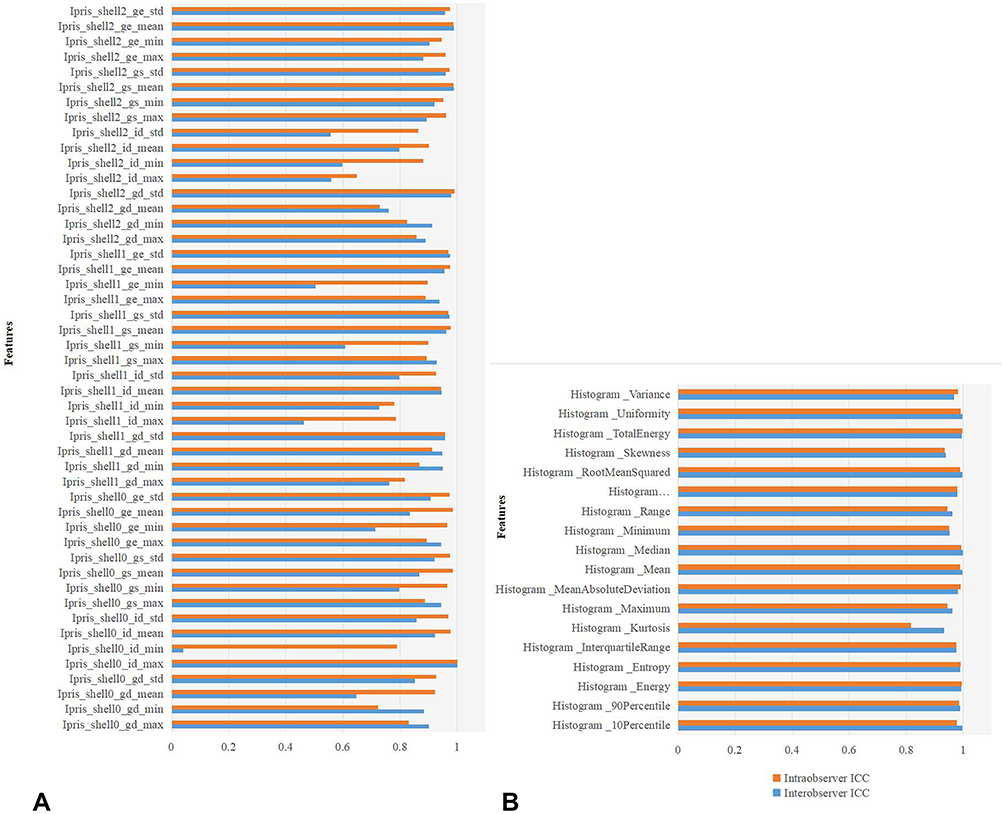 |
Figure 3 The distribution of intra- and interobserver intraclass correlation coefficients (ICCs) values for all the Ipris and histogram features (A and B). |
The univariate analysis showed that 12 features (3 histogram features and 9 Ipris features) were significantly different between the benign and malignant groups. The results of the receiver operating characteristic (ROC) analysis of the 12 significant features are shown in Table 2. Among the 3 histogram features, Energy and TotalEnergy performed similarly and had relatively higher area under the ROC curve (AUC) values than Histogram_Range. Among the 9 Ipris features, Ipris_shell1_id had relativity higher AUCs than other features. The AUCs of the three relatively higher AUC features are shown in Figure 4. The energy, TotalEnergy, and Ipris_shell1_id_std showed moderate to good diagnostic performance in differentiating benign from malignant lesions with an AUC of 0.807 (95% confidence interval [CI], 0.704–0.887), 0.808 (95% CI, 0.705–0.888), and 0.708 (95% CI, 0.595–0.804), yielding sensitivities of 74.6%, 50.9%, and 65.5%, respectively, and specificities of 72.0%, 96.0%, and 76.0%, respectively. The AUC values of both Energy and TotalEnergy were not significantly different from that of Ipris_shell1_id_std. The AUC, sensitivity, and specificity of radiologist reviewer 1 in identifying benign and malignant testicular lesions were 0.653 (95% CI, 0.538–0.756), 94.6%, and 36.0%, and those of reviewer 2 were 0.695 (95% CI, 0.582–0.793), 90.9% and, 48.0%, respectively.
 |
Table 2 Diagnostic Performance of the 12 Selected Features |
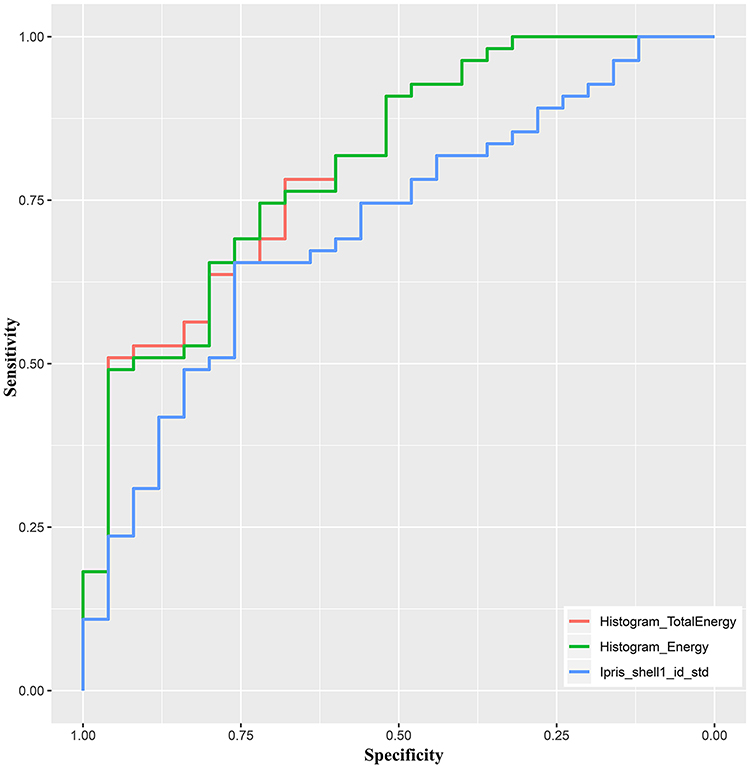 |
Figure 4 Receiver operating characteristic curves of the top three features for distinguishing between benign and malignant testicular lesions. |
Discussion
Preoperative characterization of testicular disease is crucial for optimal treatment, including resection planning to avoid unnecessary orchiectomy. In this study, we evaluated the intra- and interobserver agreements of histogram and Ipris features. We also applied the histogram and Ipris features for the differential diagnosis of benign and malignant testicular lesions. Our results demonstrated that both histogram and Ipris features have certain value in the diagnosis of testicular diseases. Furthermore, most of the histogram and Ipris features have good robustness (60/66 features showed ICCs higher than 0.6).
MRI can be used to quantify the spatial variation in the architecture and function of tumors through many methods.20 Quantitative imaging features may non-invasively express comprehensive intra-tumor, inter-tumor, and peri-tumor information.21 Texture analysis can provide a series of parameters that can reflect tissue characteristics and has been successfully used in the diagnosis and evaluation of various diseases.22,23 Min et al demonstrated that apparent diffusion coefficient histogram parameters are significantly different between seminomas and nonseminomas.16 Similarly, our study showed that the histogram features Energy and TotalEnergy of malignant lesions were significantly higher than those of benign lesions. Energy is a feature used to measure the uniformity of the intensity level distribution, and a higher energy value indicates a narrower distribution of intensity levels.24 Our result is concordant with another previous study, which revealed that increased energy is a predictor for metastatic lymph nodes.25
Ipris is a new analysis method, and there has only been one report on it.19 The Ipris features provide the texture transition information obtained from the interior voxels to the exterior voxels of an interface voxel. Brambilla E. showed that lymphocyte infiltration in the perinodular space of malignant lung nodules seems to result in differences in the texture characteristics adjacent to the nodule.26 Hence, by quantitatively capturing the textural attributes from the interior through to the exterior of the lesion, we may be able to distinguish malignant from benign testicular lesions. This study showed that the commonly used visual assessment method has high sensitivity and relatively low specificity; in other words, some benign lesions may be misdiagnosed as malignant, leading to overtreatment or even unnecessary orchiectomy. In contrast, texture analysis features provided better diagnostic performance than visual assessment.
In our study, some Ipris features do have a certain differential value for benign and malignant testicular lesions. Among all Ipris features, Ipris_shell1_id_std has the highest diagnostic performance with an AUC of 0.708. This suggests that the evolution and infiltration of the transition zones of benign and malignant lesions in the testicle may lead to differences in Ipris features. Our study shows that the diagnostic efficiency of Ipris features in differentiating benign and malignant testicular lesions is inferior to that of features used to identify benign and malignant lung nodules (AUC=0.83).19 The reason may be that most of the benign and malignant testicular lesions have clear boundaries on T2WI, and the difference in heterogeneity and infiltration characteristics in the marginal area between benign and malignant lesions are less obvious, resulting in a lack of obvious evolution from the inside to the outside of the lesion.
In addition, our results show that the performance of the Ipris features is inferior to the histogram feature Energy for discriminating between benign and malignant testicular lesions, which suggests that the internal features of the whole lesion may be more conducive to reflecting the benign and malignant properties of the lesion. In this study, Ipris features did not show outstanding performance for the differential diagnosis of benign and malignant testicular lesions. However, considering the good performance of Ipris features in previous studies, it is necessary to explore the potential value of Ipris features in the diagnosis and evaluation of other diseases in future research.
The identification of stable features is an important prerequisite prior to conducting texture analyses because features with low fidelity will likely lead to spurious findings and unrepeatable results. In this study, intra- and interobserver ICCs showed that all histogram features and most Ipris features (42 of 48) had an ICC higher than 0.6, indicating that both histogram features and Ipris features based on ROI segmentations have good repeatability and stability. This may be attributed to the uniformity of MRI devices, relatively fixed scan parameters, and the clear boundaries of benign and malignant lesions in T2WIs in this study. The stable features identified in our study could be applied to a feature selection pipeline for future radiomic analyses.
Texture analysis provides an objective, quantitative method for disease evaluation as a computer-aided diagnostic tool. At present, texture analysis has been successfully used in many diseases.22,23,27–29 Although it has shown good performance, texture analysis is not yet widespread in routine clinical practice. One of the possible reasons is that quite a number of texture analysis studies were performed using proprietary or non-commercial software packages, which are not open source and are therefore inaccessible to other researchers. In addition, texture features vary according to the imaging devices used, image acquisition parameters, and so on. In recent years, some open-source tools or even advanced automated systems for texture analysis have been proposed, which makes it more available and convenient in clinical practice. Some studies have been devoted to evaluating the effects of a variety of factors on the texture results. Those fundamental work will pave the way for the clinical use of texture analysis, and it is expected that texture analysis will become increasingly available in clinical practice. We expect that computers will automatically provide a fast and accurate disease prediction based on texture analysis or other intelligent analysis method after patients undergo imaging examinations in routine clinical practice. In fact, this is true for certain situations, such as the detection of pulmonary nodules based on chest CT.
Our study has some limitations. First, the sample size was still small due to the low morbidity of testicular tumors. The small sample size led to the absence of a test set. Therefore, further large-scale and multicenter datasets are warranted to validate and verify our preliminary results. Second, diffusion-weighted imaging (DWI) and dynamic contrast-enhanced (DCE) sequences were not analyzed in this study, mainly due to the limited number of patients who underwent DWI and DCE sequences. T2WI is an essential and valuable sequence for the evaluation of testicular lesions, so only T2WI was included in the analysis. Third, the literature on Ipris is limited to one study, and further Ipris-related research may help to validate our results.
Conclusion
In conclusion, both histogram and Ipris features have good stability and may be useful in the diagnosis of testicular diseases. The new Ipris features have no significant advantage over conventional histogram features.
Acknowledgments
This work was supported by the National Natural Science Foundation of China (81671656, 81801668).
Disclosure
The authors report no conflicts of interest in this work.
References
1. Cheng L, Albers P, Berney DM, et al. Testicular cancer. Nat Rev Dis Primers. 2018;4(1):29.
2. Batool A, Karimi N, Wu XN, Chen SR, Liu YX. Testicular germ cell tumor: a comprehensive review. Cell Mol Life Sci. 2019;76(9):1713–1727.
3. Song G, Xiong GY, Fan Y, et al. The role of tumor size, ultrasonographic findings, and serum tumor markers in predicting the likelihood of malignant testicular histology. Asian J Androl. 2019;21(2):196–200. doi:10.4103/aja.aja_119_18
4. Haas GP, Shumaker BP, Cerny JC. The high incidence of benign testicular tumors. J Urol. 1986;136(6):1219–1220. doi:10.1016/S0022-5347(17)45288-8
5. Mohrs OK, Thoms H, Egner T, et al. MRI of patients with suspected scrotal or testicular lesions: diagnostic value in daily practice. AJR Am J Roentgenol. 2012;199(3):609–615. doi:10.2214/AJR.11.7349
6. Ramanathan S, Dogra V. Current status of percutaneous testicular biopsy for focal lesions. Abdom Radiol (NY). 2018;43(11):3125–3131. doi:10.1007/s00261-018-1560-x
7. Dieckmann KP, Kulejewski M, Heinemann V, Loy V. Testicular biopsy for early cancer detection – objectives, technique and controversies. Int J Androl. 2011;34(4 Pt 2):e7–13. doi:10.1111/j.1365-2605.2011.01152.x
8. Albers P, Albrecht W, Algaba F, et al. Guidelines on testicular cancer: 2015 update. Eur Urol. 2015;68(6):1054–1068. doi:10.1016/j.eururo.2015.07.044
9. Tsili AC, Bertolotto M, Turgut AT, et al. MRI of the scrotum: recommendations of the ESUR scrotal and penile imaging working group. Eur Radiol. 2018;28(1):31–43. doi:10.1007/s00330-017-4944-3
10. Tsili AC, Sofikitis N, Stiliara E, Argyropoulou MI. MRI of testicular malignancies. Abdom Radiol (NY). 2019;44(3):1070–1082. doi:10.1007/s00261-018-1816-5
11. Parenti GC, Feletti F, Carnevale A, Uccelli L, Giganti M. Imaging of the scrotum: beyond sonography. Insights Imaging. 2018;9(2):137–148. doi:10.1007/s13244-017-0592-z
12. Bahl G, Cruite I, Wolfson T, et al. Noninvasive classification of hepatic fibrosis based on texture parameters from double contrast-enhanced magnetic resonance images. J Magn Reson Imaging. 2012;36(5):1154–1161. doi:10.1002/jmri.23759
13. Yan L, Liu Z, Wang G, et al. Angiomyolipoma with minimal fat: differentiation from clear cell renal cell carcinoma and papillary renal cell carcinoma by texture analysis on CT images. Acad Radiol. 2015;22(9):1115–1121. doi:10.1016/j.acra.2015.04.004
14. Castellano G, Bonilha L, Li LM, Cendes F. Texture analysis of medical images. Clin Radiol. 2004;59(12):1061–1069. doi:10.1016/j.crad.2004.07.008
15. Reischauer C, Patzwahl R, Koh DM, Froehlich JM, Gutzeit A. Texture analysis of apparent diffusion coefficient maps for treatment response assessment in prostate cancer bone metastases – a pilot study. Eur J Radiol. 2018;101:184–190. doi:10.1016/j.ejrad.2018.02.024
16. Min X, Feng Z, Wang L, et al. Characterization of testicular germ cell tumors: whole-lesion histogram analysis of the apparent diffusion coefficient at 3T. Eur J Radiol. 2018;98:25–31. doi:10.1016/j.ejrad.2017.10.030
17. Fan C, Min X, Feng Z, et al. Discrimination between benign and malignant testicular lesions using volumetric apparent diffusion coefficient histogram analysis. Eur J Radiol. 2020;126:108939. doi:10.1016/j.ejrad.2020.108939
18. Tunali I, Hall LO, Napel S, et al. Stability and reproducibility of computed tomography radiomic features extracted from peritumoral regions of lung cancer lesions. Med Phys. 2019;46(11):5075–5085. doi:10.1002/mp.13808
19. Alilou M, Orooji M, Madabhushi A. Intra-perinodular textural transition (Ipris): a 3D descriptor for nodule diagnosis on lung CT. Med Image Comput Comput Assist Interv. 2017;2017:647–655. doi:10.1007/978-3-319-66179-7_74
20. O’Connor JP, Rose CJ, Waterton JC, Carano RA, Parker GJ, Jackson A. Imaging intratumor heterogeneity: role in therapy response, resistance, and clinical outcome. Clin Cancer Res. 2015;21(2):249–257. doi:10.1158/1078-0432.CCR-14-0990
21. Bai HX, Lee AM, Yang L, et al. Imaging genomics in cancer research: limitations and promises. Br J Radiol. 2016;89(1061):20151030. doi:10.1259/bjr.20151030
22. Guan Y, Shi H, Chen Y, et al. Whole-lesion histogram analysis of apparent diffusion coefficient for the assessment of cervical cancer. J Comput Assist Tomogr. 2016;40(2):212–217. doi:10.1097/RCT.0000000000000349
23. Cho SH, Kim GC, Jang YJ, et al. Locally advanced rectal cancer: post-chemoradiotherapy ADC histogram analysis for predicting a complete response. Acta Radiol. 2015;56(9):1042–1050. doi:10.1177/0284185114550193
24. Yang L, Liu D, Fang X, et al. Rectal cancer: can T2WI histogram of the primary tumor help predict the existence of lymph node metastasis? Eur Radiol. 2019;29(12):6469–6476. doi:10.1007/s00330-019-06328-z
25. Park JH, Bae YJ, Choi BS, et al. Texture analysis of multi-shot echo-planar diffusion-weighted imaging in head and neck squamous cell carcinoma: the diagnostic value for nodal metastasis. J Clin Med. 2019;8(11):1767. doi:10.3390/jcm8111767
26. Brambilla E, Le Teuff G, Marguet S, et al. Prognostic effect of tumor lymphocytic infiltration in resectable non-small-cell lung cancer. J Clin Oncol. 2016;34(11):1223–1230. doi:10.1200/JCO.2015.63.0970
27. Giganti F, Antunes S, Salerno A, et al. Gastric cancer: texture analysis from multidetector computed tomography as a potential preoperative prognostic biomarker. Eur Radiol. 2017;27(5):1831–1839. doi:10.1007/s00330-016-4540-y
28. Fan TW, Malhi H, Varghese B, et al. Computed tomography-based texture analysis of bladder cancer: differentiating urothelial carcinoma from micropapillary carcinoma. Abdom Radiol (NY). 2019;44(1):201–208. doi:10.1007/s00261-018-1694-x
29. Khanna M, Abualruz AR, Yadav SK, et al. Diagnostic performance of multi-parametric MRI to differentiate benign sex cord stromal tumors from malignant (non-stromal and stromal) testicular neoplasms. [published online ahead of print, 2020 Jun 22]. Abdom Radiol (NY). 2020. doi:10.1007/s00261-020-02621-4
 © 2021 The Author(s). This work is published and licensed by Dove Medical Press Limited. The full terms of this license are available at https://www.dovepress.com/terms.php and incorporate the Creative Commons Attribution - Non Commercial (unported, v3.0) License.
By accessing the work you hereby accept the Terms. Non-commercial uses of the work are permitted without any further permission from Dove Medical Press Limited, provided the work is properly attributed. For permission for commercial use of this work, please see paragraphs 4.2 and 5 of our Terms.
© 2021 The Author(s). This work is published and licensed by Dove Medical Press Limited. The full terms of this license are available at https://www.dovepress.com/terms.php and incorporate the Creative Commons Attribution - Non Commercial (unported, v3.0) License.
By accessing the work you hereby accept the Terms. Non-commercial uses of the work are permitted without any further permission from Dove Medical Press Limited, provided the work is properly attributed. For permission for commercial use of this work, please see paragraphs 4.2 and 5 of our Terms.