")
Back to Journals » Cancer Management and Research » Volume 14
Value of Histogram of Gray-Scale Ultrasound Image in Differential Diagnosis of Small Triple Negative Breast Invasive Ductal Carcinoma and Fibroadenoma
Authors Xu M, Li F, Yu S, Zeng S, Weng G, Teng P, Yang H, Li X, Liu G
Received 8 February 2022
Accepted for publication 12 April 2022
Published 21 April 2022 Volume 2022:14 Pages 1515—1524
DOI https://doi.org/10.2147/CMAR.S359986
Checked for plagiarism Yes
Review by Single anonymous peer review
Peer reviewer comments 2
Editor who approved publication: Dr Sanjeev K. Srivastava
Maolin Xu,1,* Fang Li,2,* Shaonan Yu,1,* Shue Zeng,2,* Gaolong Weng,2 Peihong Teng,1 Huimin Yang,1 Xuefeng Li,3 Guifeng Liu1
1Department of Radiology, China-Japan Union Hospital of Jilin University, Changchun, People’s Republic of China; 2Department of Ultrasound, Hubei Cancer Hospital, Tongji Medical College, Huazhong University of Science and Technology, Wuhan, People’s Republic of China; 3Department of Anesthesiology, China-Japan Union Hospital of Jilin University, Changchun, People’s Republic of China
*These authors contributed equally to this work
Correspondence: Xuefeng Li, Department of Anesthesiology, China-Japan Union Hospital of Jilin University, Xiantai Street, Changchun, 130033, People’s Republic of China, Email [email protected] Guifeng Liu, Department of Radiology, China-Japan Union Hospital of Jilin University, Xiantai Street, Changchun, 130033, People’s Republic of China, Email [email protected]
Objective: To investigate the value of gray-scale ultrasound (US) image histogram in the differential diagnosis between small (≤ 2.00 cm), oval, or round triple negative breast invasive ductal carcinoma (TN-IDC) and fibroadenoma (FA).
Methods: Fifty-five cases of triple negative breast invasive ductal carcinoma (TN-IDC group) and 57 cases of breast fibroadenoma (FA group) confirmed by pathology in Hubei cancer hospital from September 2017 to September 2021 were analyzed retrospectively. The gray-scale US images were analyzed by histogram analysis method, from which some parameters (including mean, variance, skewness, kurtosis and 1st, 10th, 50th, 90th and 99th percentile) can be obtained. Intraclass correlation coefficient (ICC) was used to evaluate the inter observer reliability of histogram parameters. Histogram parameters between the TN-IDC and FA groups were compared using independent Student’s t-test or Mann-Whitney U-test, respectively. In addition, the receiver operating characteristic (ROC) curve analysis was used for the significant parameters to calculate the differential diagnosis efficiency.
Results: All the histogram parameters showed excellent inter-reader consistency, with the ICC values ranged from 0.883 to 0.999. The mean value, 1st, 10th, 50th, 90th and 99th percentiles of TN-IDC group were significantly lower than those of FA group (P < 0.05). The area under ROC curve (AUC) values of mean and n percentiles were from 0.807 to 0.848. However, there were no significant differences in variance, skewness and kurtosis between the two groups (P > 0.05).
Conclusion: Histogram analysis of gray-scale US images can well distinguish small, oval, or round TN-IDC from FA.
Keywords: ultrasound, histogram, triple negative breast cancer, fibroadenoma
Introduction
Triple negative breast cancer (TNBC) is a unique subtype of breast cancer, while estrogen receptor (ER), progesterone receptor (PR) and human epidermal growth factor receptor 2 (HER-2) are negative.1,2 TNBC is the worst prognosis subtypes in breast cancer, the lesion of which increases rapidly and appears to be more aggressive than other subtypes of breast cancer.1–3 Accounting for approximately 12%~24% of invasive breast cancer,4 TNBC has no response to endocrine therapy or biotherapy based on HER-2, while most chemotherapeutics are not effective for TNBC therapy.5 The median overall survival of TNBC patients is about 13 months, with recurrence or metastasis often occurring within 3 years after operation.2 Therefore, early and accurate diagnosis of TNBC is particularly important.
The imaging features of breast cancer are increasingly emphasized according to the subtypes of breast cancer, while imaging features of TNBC on mammography, ultrasonography, and magnetic resonance imaging (MRI) have been extensively studied.1 Different from other imaging methods, US has the advantages of relatively low price, real-time, dynamic, high-resolution, radiation-free and repeatable operation, and is widely used in clinical work. Thus, some literatures believe that US is a reliable method to diagnose breast tumor.2,6 Compared with non-triple-negative breast cancer, TNBC is more likely to show benign features, such as oval or round, smooth edge, clear boundary, and unlikely to have an echo halo in traditional ultrasonography,1,2,7 which may lead to a certain overlap with the US findings of FA. The pathological basis may be that TNBC is an aggressive and rapidly proliferating tumor with pushing margins without any stromal reaction.2,8
Previous studies proposed that when FA and TNBC were hardly distinguishable by the naked eye, US texture analysis can help present substantial differences in the predicted probability of malignancy.9,10 Texture analysis can objectively provide information that cannot be observed by naked eye, and then quantitatively evaluate the heterogeneity of tumors.6 Histogram is a useful texture analysis method, which can provide quantitative information about image heterogeneity by evaluating the distribution of each pixel value in the image.11–13 There have been studies evaluating different diseases by histogram analysis of US, computed tomography (CT) or MRI,12–16 and these studies have obtained meaningful results. As far as we know, there have been few studies using histogram analysis based on US images to evaluate breast lesions,17 especially for the differential diagnosis of TNBC and FA. In recent years, because of the improvement of people’s health consciousness and the increase of breast cancer screening, the diagnosis rate of small tumor (≤2.00 cm) has increased.12 In addition, the most common histological type of TNBC is invasive ductal carcinoma (IDC).2 Therefore, the purpose of our study is to explore the value of a histogram analysis method for gray-scale US image in distinguishing small (≤2.00 cm), oval, or round TN-IDC from FA.
Methods
Patients
This retrospective study was conducted in accordance with the Declaration of Helsinki and approved by the ethics committee of the Hubei Cancer Hospital (No.: LLHBCH2021YN-001), and the requirement to obtain informed consent was waived. Two hundred and fifty-one female patients with 305 TN-IDCs and 272 female patients with 366 FAs at the Hubei Cancer Hospital (Wuhan, People’s Republic of China) between September 2017 to September 2021 were consecutive included in this study. The authors were able to obtain information that could identify individual participants during or after data collection. All patients underwent ultrasonic examination within 1 month before operation and were satisfied as the following inclusion criteria: (1) no biopsy or medical treatment before US examinations; (2) lesions were confirmed with complete histopathological and immunohistochemical data based on the specimens obtained from surgical resection. The exclusion criteria were as follows: (1) patients with multiple tumors (nTN-IDC= 36; nFA = 66), including bilateral breast tumors and ipsilateral breast with multifocal tumors; (2) masses with size larger than 2.00 cm in the longest diameter, or with irregular shape in US image (nTN-IDC= 151; nFA = 141); and (3) poor quality images (nTN-IDC= 9; nFA = 8). Finally, 55 patients with 55 TN-IDCs and 57 patients with 57 FAs were eligible in our study, which were single, oval or round, and less than 2.00 cm in the longest diameter. Figure 1 provides a flowchart of the patient selection process.
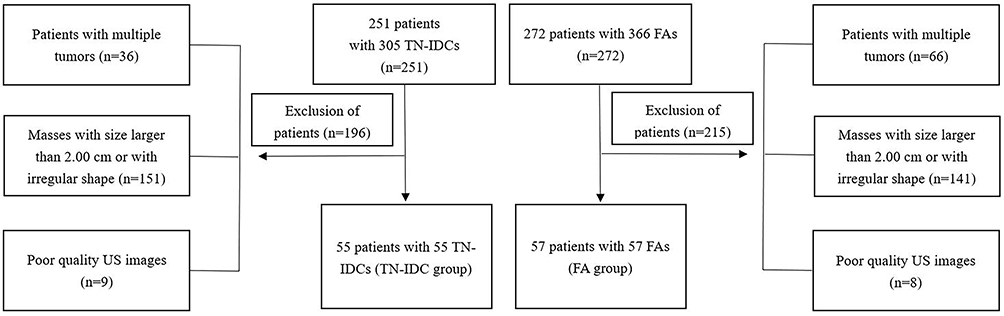 |
Figure 1 Flowchart of the patient selection process in current study. |
All patients underwent US examination using EPIQ5 and Affiniti 50 (Philips Ultrasound, Inc., Bothell, Washington, USA), and the linear-array transducer with the frequency of 5–12 MHz was used. After physical examination, the whole breast was systematically examined. All cases were evaluated in the supine position, with the upper arm abducted and the bilateral breast fully exposed at the same time. The characteristics of sonogram were observed by routine ultrasonic scanning. The clearest and most complete gray-scale US images were obtained and recorded. All examinations were performed by an experienced ultrasound physician in breast.
Image Processing and Histogram Analysis
Two ultrasound physicians (Shu’e Zeng and Fang Li, with 27 and 5 years of medical image diagnosis experience respectively), without knowing the patient’s clinicopathological information, reviewed and analyzed all US images on the picture archiving and communication system (PACS). When there are differences of opinion, the two doctors reach an agreement through discussion. Finally, the selected US images were exported from PACS in BMP format for histogram analysis. During the export process, all images were adjusted to have the consistent window width and window level.
Histogram characteristics of the tumors were analyzed based on the gray-scale US images, which were processed using the MaZda software (Version 4.6; www.eletel.p.lodz.pl/programy/mazda/). The software package ran stably in Windows 10. Two physicians (Maolin Xu and Fang Li, with 8 and 5 years of experience in breast imaging, respectively) were responsible for ROI (region of interest) drawing of images. Gray-level normalization of each ROI was performed, using the limitation of dynamics to μ±3σ (μ, gray-level mean; and σ, gray-level standard deviation). On the gray-scale US image, ROI was manually delineated along the edge of the maximum diameter area in the tumor, to calculate histogram parameters, including mean value, variance, skewness, kurtosis, and the 1st, 10th, 50th, 90th, and 99th percentile values12(Figures 2 and 3). Histogram parameters were defined according to previous studies12,13 as follows. Mean was defined as the average pixel value. Variance was defined as variation from the mean gray-level value. Skewness was defined as asymmetry of the histogram. Kurtosis was defined as flatness of the histogram. The nth percentile was defined as the point at which n% of the voxel values that formed the histogram were found to the left. All histogram parameter values were the average of the measured values of the two physicians.
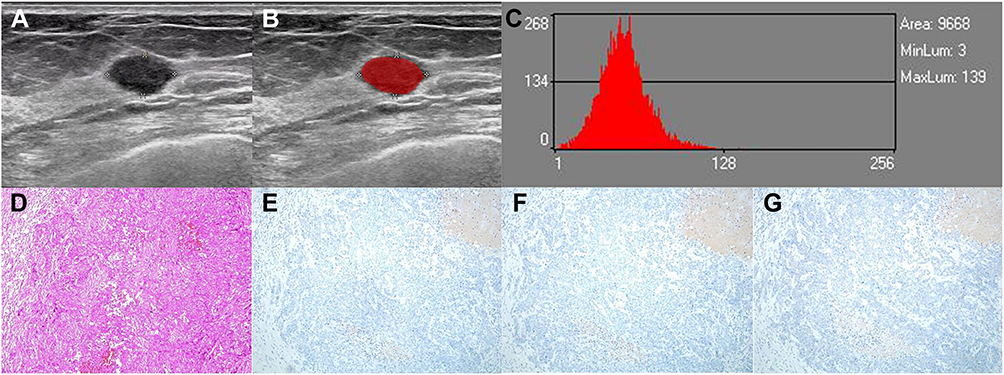 |
Figure 2 A 69-year-old woman with TN-IDC in the left breast. (A) and (B) An ROI for the oval hypoechoic mass in the grey-scale US image. (C) Grey-scale histogram of the tumor. The values of grey-scale histogram parameters are as follows: mean, 52.86; variance, 330.42; skewness, 0.48255; and kurtosis, 0.81965; 1st percentile, 13; 10th percentile, 31; 50th percentile, 52; 90th percentile, 76; and 99th percentile, 106. (D) HE staining showed obvious tumor cell atypia with hemorrhage and necrosis, vacuolar nuclear chromatin, obvious nucleolus, fibrous connective tissue reaction and inflammatory cell infiltration (HE×100). (E) Negative expression of ER in the tumor cells (IHC×100). (F) Negative expression of PR in the tumor cells (IHC × 100). (G) Negative expression of HER-2 in the tumor cells (IHC×100). Abbreviations: TN-IDC, triple negative breast invasive ductal carcinoma; ROI, region of interest; HE, hematoxylin and eosin; IHC, immunohistochemistry; ER, estrogen receptor; PR, progesterone receptor; HER-2, human epidermal growth factor receptor 2. |
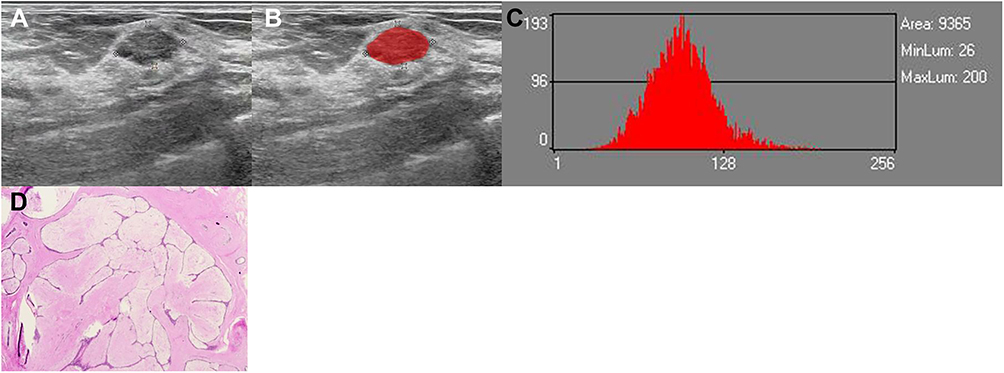 |
Figure 3 A 47-year-old woman with FA in the right breast. (A and B) An ROI for the oval hypoechoic mass in the grey-scale US image. (C) Grey-scale histogram of the tumor. The values of grey-scale histogram parameters are as follows: mean, 96.701; variance, 580.27; skewness, 0.40754; and kurtosis, 0.59665; 1st percentile, 46; 10th percentile, 67; 50th percentile, 96; 90th percentile, 126; and 99th percentile, 164. (D) Microscopically, spindle cells in the stroma are nodular hyperplasia with mucus degeneration, and the compressed duct is fissure (HE×100). Abbreviations: FA, fibroadenoma; ROI, region of interest; HE, hematoxylin and eosin. |
Histopathological Analysis
Fifty-five TN-IDCs and 57 FAs tumor specimens were surgically resected and the diagnosis of all cases were histopathologically confirmed. Moreover, 55 cases of TN-IDCs underwent axillary lymph node dissection. Nottingham combined histological grading system was used to determine the histological grade of TN-IDC.12 The expression levels of ER, PR, and HER-2 were measured through Immunohistochemical (IHC) analyses.12,18 ≤1% of carcinoma nuclei with positive staining indicated that ER and PR were negative.19 The IHC score was - or 1 +, indicating that HER-2 was negative, while 3+ indicating the positive expression of HER-2. IHC score was 2 +, and fluorescence in situ hybridization (FISH) was negative, which also showed that HER-2 was negative.12
Statistical Analysis
SPSS software package (version 22.0; Chicago, IL) and MedCalc (version 15.2; mariakerke, Belgium) were used for all statistical analyses. A package called ggplot2 (version 3.2.1) in R language was applied in drawing.
Chi square test was used to analyse the categorical variables. Quantitative variables were expressed as the mean ± standard deviation.
Kolmogorov–Smirnov test and Levene test were used to evaluate the normality and homovariance of quantitative variables, so as to determine whether to use independent samples t-test or Mann Whitney U-test.
Intraclass correlation coefficient (ICC) was used to evaluate the inter observer reliability of histogram parameters.
Receiver operating characteristic (ROC) analysis was used to evaluate the effectiveness of the histogram parameters in differentiating TN-IDC from FA.
The optimal threshold value for differentiating TN-IDC from FA was chosen at the maximum Youden index, which was used to calculate the area under the ROC curve (AUC).
The method developed by DeLong et al20 was used to compare different AUC values, and Bonferroni correction was applied for multiple testing.
Results
Clinicopathologic Characteristics in FA and TN-IDC Groups
The comparison of clinicopathologic characteristics in FA and TN-IDC groups is shown in Table 1. All TN-IDCs (n = 55) and FAs (n = 57) were solitary tumors, histologically diagnosed by surgical specimens. As to TN-IDCs, 23 patients were with the histological grade of grade 3 (41.8%), while 18 patients (32.7%) had axillary node metastasis. The age of patients with FA was from 19 to 73 years old, while the age of patients with TN-IDC was from 26 to 71 years old. The tumor size of FA ranged from 0.61 cm to 1.86 cm, while that of TN-IDC ranged from 0.66 cm to 1.88 cm. In addition, 40.4% (23 of 57) of patients with FA and 47.3% (26 of 55) of patients with TN-IDC were accompanied by pain or palpable during clinical physical examination. However, there were no significant differences in age, tumor size, or clinical symptom between the two groups (all P > 0.05).
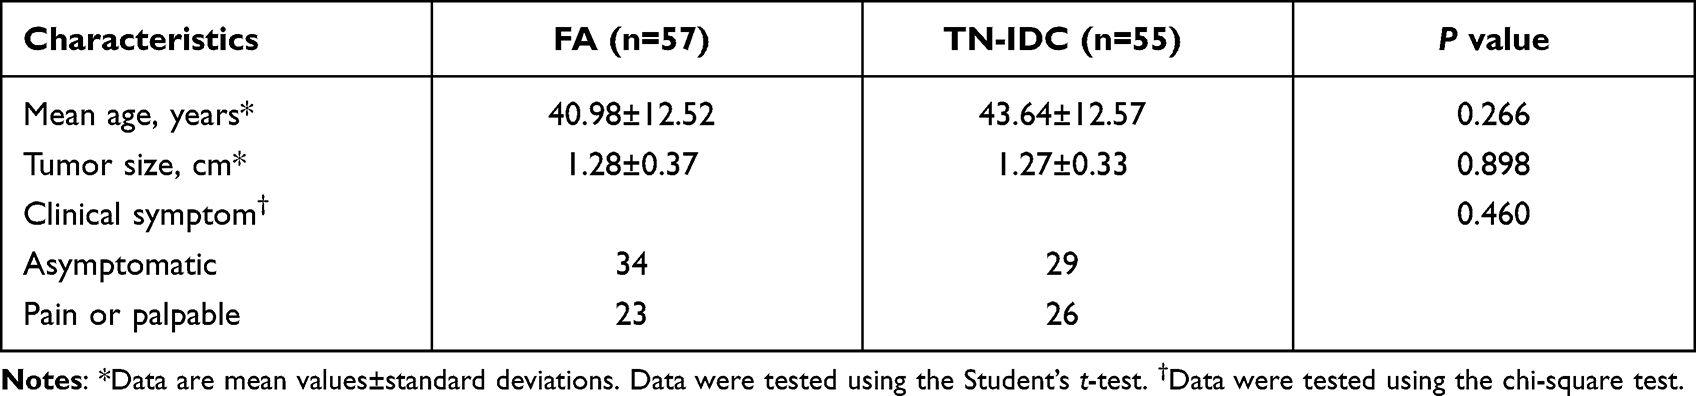 |
Table 1 Clinicopathologic Characteristics of 57 FAs and 55 TN-IDCs |
Interobserver Agreement Assessment
Table 2 summarizes the consistency of measured values of histogram parameters between the two readers. Measured values of all the histogram parameters showed excellent inter-reader consistency (ICC range, 0.883–0.999).
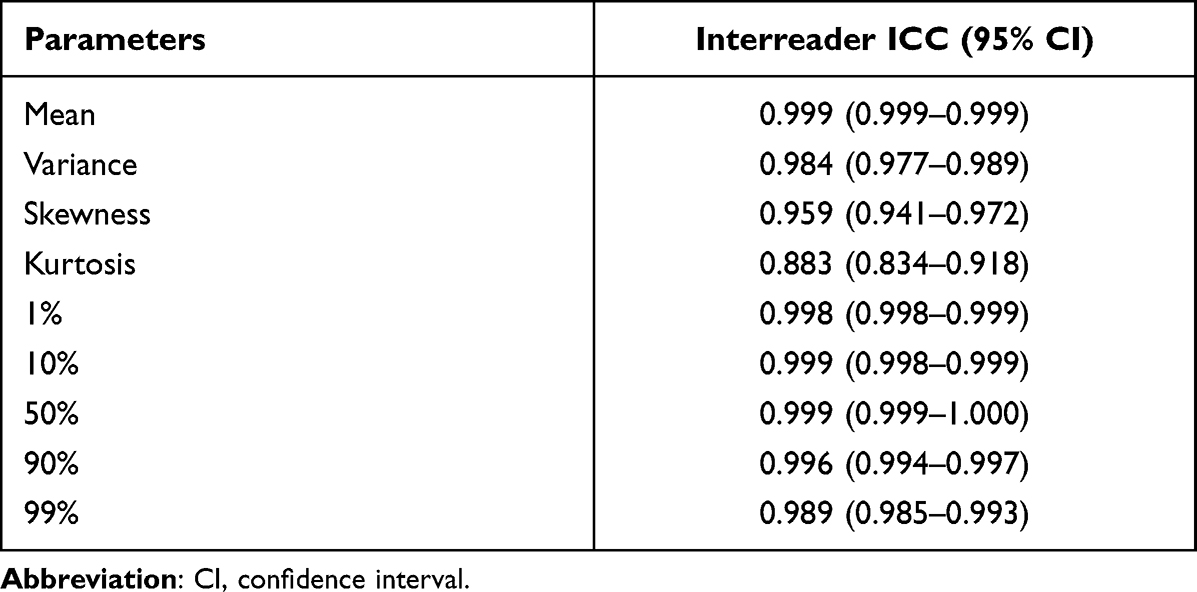 |
Table 2 Interreader ICC Values for the Measurements of Histogram Parameters Between Two Readers |
Histogram Parameters Between FA and TN-IDC Groups
The results of histogram parameters between FA and TN-IDC groups are shown in Table 3, respectively. The mean, nth percentiles between FA and TN-IDC groups were significantly different (all P < 0.05). Nevertheless, there were no significant differences in variance, skewness, or kurtosis between the two groups (P = 0.644, 0.110, and 0.926, respectively). Examples are shown in Figures 2 and 3.
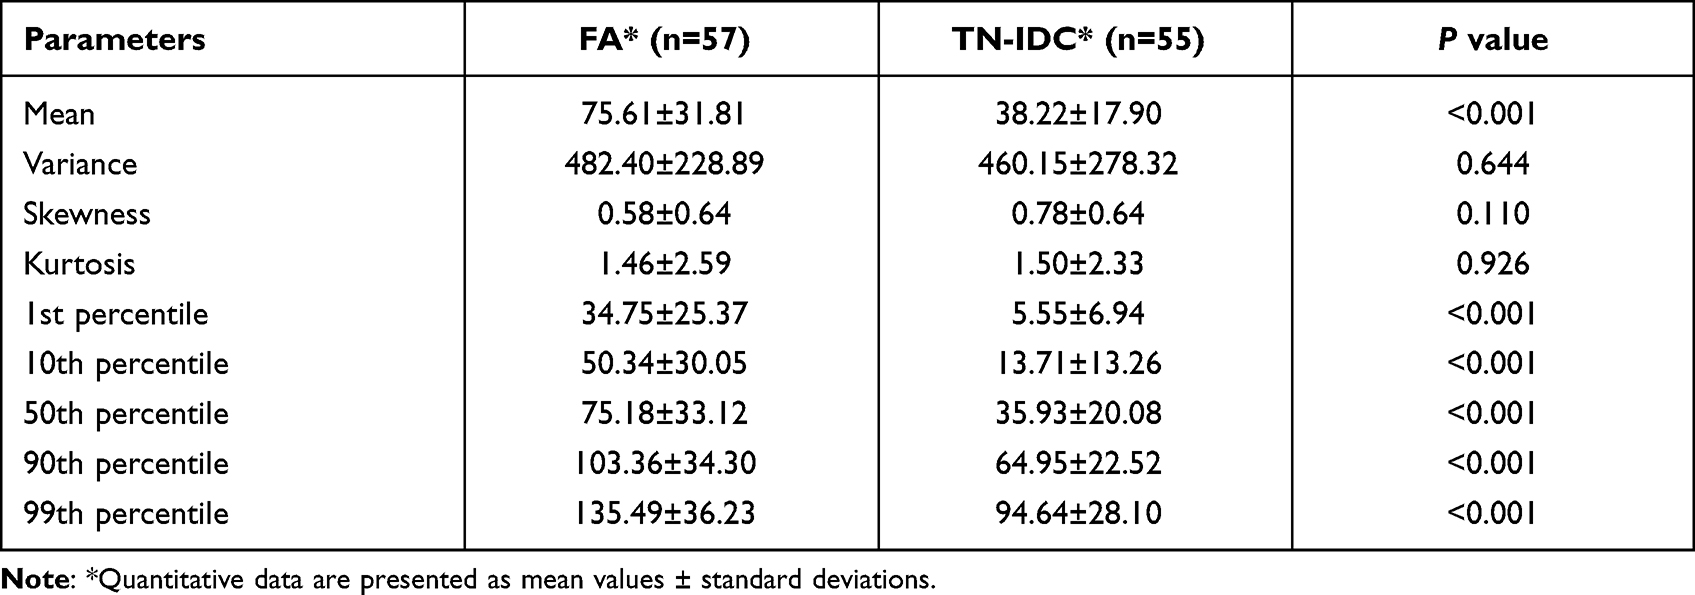 |
Table 3 Comparison of Histogram Parameters Between FA Group and TN-IDC Group |
ROC Analysis of Mean, nth Percentiles in Distinguishing TN-IDC from FA
Table 4 and Figure 4 show the ROC analysis results of mean, nth percentiles for distinguishing TN-IDC from FA. The AUC values of the mean, and the 1st, 10th, 50th, 90th, and 99th percentiles for the diagnosis of TN-IDC were ranged from 0.807 to 0.848, and the accuracy values were 78.57%, 83.93%, 83.04%, 79.46%, 75.89% and 74.11%, respectively. With the highest sensitivity of 100%, the 1st and 10th percentiles had higher AUC and accuracy values than any other individual parameter. Moreover, pairwise AUC value comparisons among the mean and nth percentiles were performed, thus the P-value of 0.05 was adjusted to 0.0033 according to Bonferroni correction. Using the method developed by DeLong et al, the pairwise AUC value comparisons among mean, nth percentiles showed no significant differences (all P > 0.0033).
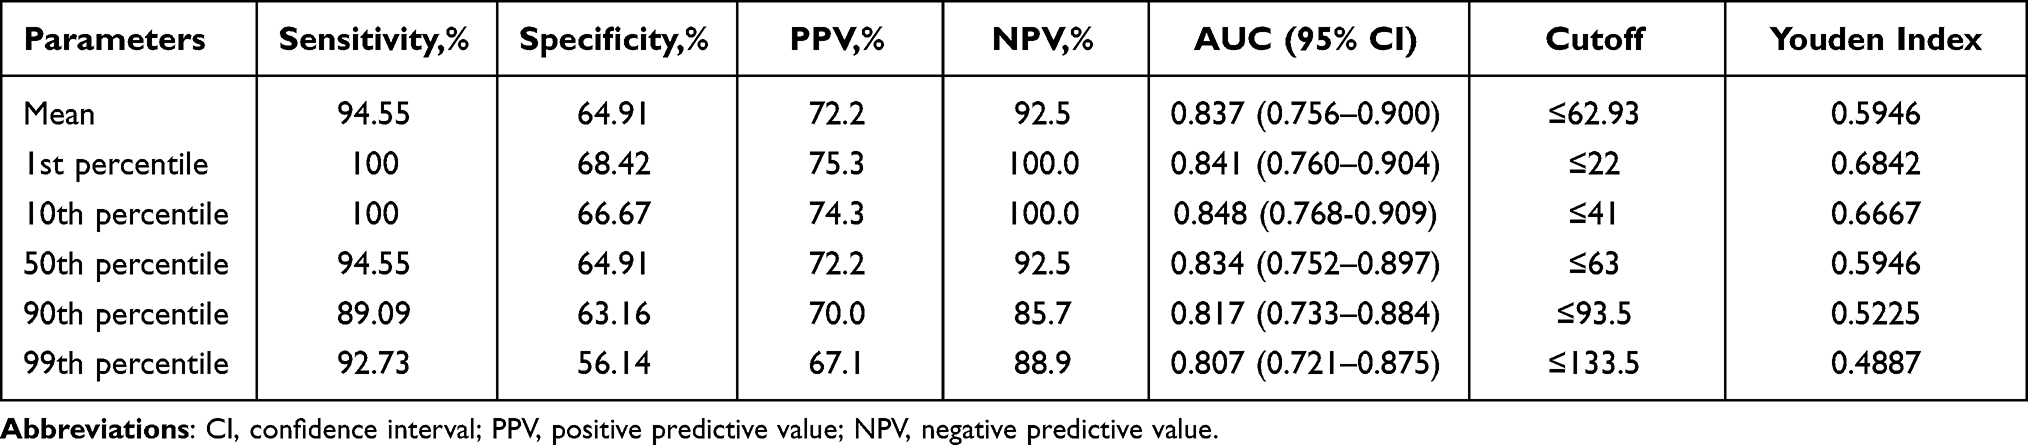 |
Table 4 ROC Analysis of Mean, Nth Percentiles for Distinguishing TN-IDC from FA |
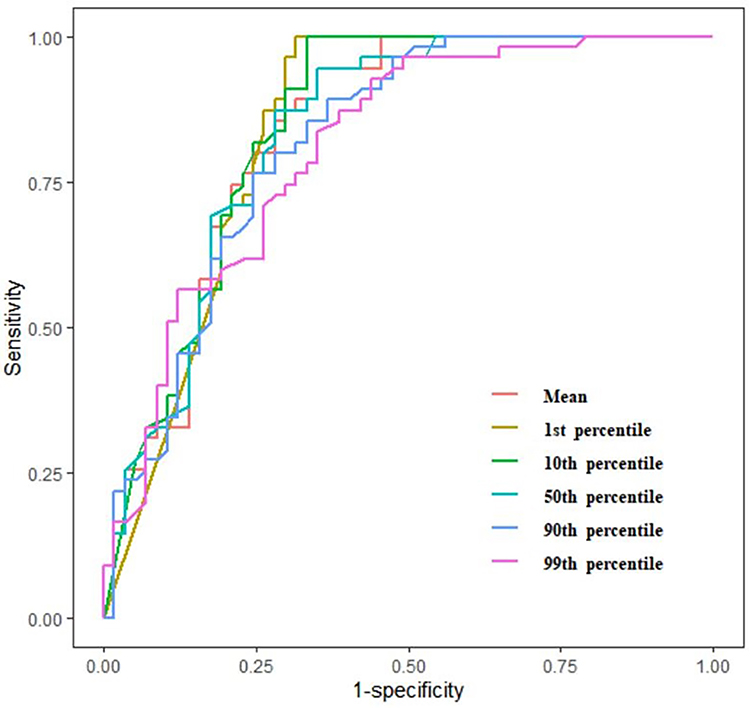 |
Figure 4 Receiver operating characteristic curves for mean, nth percentiles in distinguishing TN-IDC from FA. |
Discussion
Our research mainly focused on the multi-parameters derived from gray-scale US images for the differential diagnosis between NPM and BC. Except for variance, skewness and kurtosis, all the gray histogram parameters in FAs were significantly higher than those in TN-IDCs. The results of this study demonstrated that, with excellent inter-observer reproducibility (all ICCs >0.9), the mean, nth percentiles between TN-IDC and FA groups all have significant differences. And the AUC values and accuracies were ranged from 0.807 to 0.848, and 74.11% to 83.93%, respectively. Therefore, we propose that histogram analysis of gray-scale US images may have great potential as a predictor to distinguish small (≤2.00 cm), oval, or round TN-IDC from FA.
Compared with other molecular subtypes of breast carcinoma, TNBC is an aggressive breast cancer subtype with high mortality, and tends to occur in relatively young women.10,21,22 Similar with the study of Yoon et al,23 our study revealed that the age showed no significant difference between TN-IDC and FA groups, which was different with the study of Yeo et al1,23 Additionally, axillary lymph node metastasis may be associated with the disease-free survival rate (DFS) and overall survival rate (OS).21,24 In our study, the rate of lymph node metastasis (32.7%) and the proportion of histological grade 3 (41.8%) were lower than previous researches,21,24 which may be related to the fact that all TN-IDC cases in this study are single and small masses. Additionally, tumor size and clinical symptom of patients all showed no significant differences between TN-IDCs and FAs, which were consistent with the research result of Yeo et al.1
Previous studies had reported that elastography, color Doppler imaging, or contrast-enhanced ultrasound (CEUS) could be helpful to distinguish benign and malignant breast lesions.1,2,25,26 FAs could show enhanced vascular flow signals and penetrating vascular patterns similar to malignant tumors,1,27,28 thus color Doppler may have difficulty identifying FA from TNBC in some cases.1 Kanagaraju et at26 suggested elastography could be an effective adjunctive tool to B-mode US in differential diagnosis between FA and IDC. Similarly, Yeo et al1 thought elastography can help differentiate small, oval or round TNBC from FA. Unfortunately, lesion size, breast thickness and lesion depth may affect the elastography features and produce false result for lesions.29 Moreover, Basara et at30 found that elastography may not have a prominent contribution in the exact diagnosis of complex fibroadenoma (CFA). In CEUS, TNBC may have highly enhanced at the edge, and the range of lesion does not increase significantly after enhancement due to less interstitial reaction,2 which could help distinguish TNBC from FA. However, the cost of additional contrast-enhancement is higher and the examination time is longer.
In conventional gray-scale ultrasound image, echogenicity was usually less important for the differentiation of solid masses. Because the echogenicity parameter was not standardized, most tumors are hypoechoic compared with adjacent fibrous glands.31 Yeo et al1 revealed that most masses were with hypoechoic echo in small, oval, or round TNBC and FA groups, but no significant difference was found in the two groups. The consistency among three observers is poor for the judgement of echo pattern, as the ICC value was just 0.447 in their study. Partly different from the study of Yeo et al, Yoon et al23 thought that small TNBC tumors presented with a significant higher incidence of hypoechoic echotexture (59.1%) than that of FA tumors (54.1%). The reasonable explanation for the different results may be that TNBC is highly dedifferentiated and easy to lead to necrotic cyst, which is associated with hypoechoic performance.2,32 Additionally, TNBC tends to present without microcalcification,33 which may be associated with hyperechoic performance. In comparison, FA is composed of glandular epithelium and fibrous tissue, and cell necrosis or cystic foci is less common,34–37 contributing to relatively high echo than TN-IDC in most cases.22,23,31,38 But if the echo difference between TN-IDC and FA was not remarkable enough, the differential diagnosis could be difficult by subjective echogenicity evaluation with the naked eye, especially in small tumors.
Gray-scale histogram analysis of US images is a more objective method,39 which can quantitatively provide echogenicity information of lesions according to the echo intensity level in the gray range of 0 to 255.16,39,40 Thus, some subjective or operator-dependent features in conventional US evaluation can be effectively eliminated.39,40 To date, many literatures have reported that gray-scale ultrasound histogram is helpful to evaluate different lesions.11,15,16,39–41 For example, Kwon et al16 proposed that grey-scale US was an easily applicable and standard imaging modality used to evaluate thyroid nodules, and some grey-scale histogram parameters could be helpful for the discrimination between the subtypes of follicular variant of papillary thyroid carcinoma (FVPTC). Beyazal et al11 reported that, in comparison with the healthy control group, the mean value, variance, 50th percentile value and 90th percentile value of gray-scale ultrasonic histogram analysis in patients with chronic hepatitis B (CHB) increased significantly, while the skewness and kurtosis decreased significantly. These findings highlighted the potential contribution of the gray-scale US histogram analysis to the differential diagnosis of lesions. Because TNBC could often show as benign morphology in conventional US, some patients may not get early diagnosis and treatment.9 Thus, there are more and more studies on the differential diagnosis between TNBC and other breast tumors, including benign tumors.1,2,6,9,42 We assumed that histogram analysis of gray-scale US images could help for the differentiation between small, oval, or round TN-IDC and FA.
Mazda had been proved to be an effective and reliable quantitative image analysis tool.6,11–13 Through Mazda’s histogram analysis, the mean value and the nth percentiles can be used to reflect the average value and distribution range of gray scale.12,13 In our study, the mean and nth percentiles of TN-IDC were significantly lower than that of FA, and the AUCs of mean and nth percentiles were all higher than 0.8. Our result indicated that the overall echo of TN-IDC may be lower than that of FA. Previous studies had found that FA performed higher echo than TN-IDC in general.22,23,31,38 For example, Stavros et al believed that most FAs were isoechoic or mildly hypoechoic compared with fat, while about two-thirds of malignant tumors were markedly hypoechoic relative to fat.38 Li et al revealed that, compared with non-TNBCs, TNBCs showed a greater tendency to present as markedly hypo-echoic masses.22 In comparison to fibroadenomas, small TNBC tumors presented with a higher incidence of hypoechoic.23 These studies all had very similar views with our research and well supported our results. According to the consistency check in our study, mean and nth percentiles can reproducibly distinguish TN-IDC from FA with quantitative grey-scale values, whereas the consistency of subjective echogenicity evaluation was comparatively poor1 and unreliable in previous studies.31 The 1st and 10th percentiles had relative high AUC and accuracy values in distinguishing TN-IDC from FA, and the 1st and 10th percentiles may be associated with markly low echo, indicating that the low echo could appear more frequently in TN-IDCs than in FAs. However, the AUC values of mean and n percentiles had no significant difference in pairwise comparisons by DeLong test. Therefore, we firmly believe that mean and nth percentiles can reliably distinguish small, oval, or round TN-IDC from FA.
Skewness, kurtosis and variance can help describe the distribution symmetry of variable values, and refer to the variation from mean gray-level value.12,13 Previously, using greyscale ultrasound images, Kim et al41 revealed that standard deviation, skewness, and kurtosis derived from histogram parameters had certain value for the diagnosis of lymphocytic thyroiditis. Similiarly, Beyazal et al11 reported that, the skewness and kurtosis derived from gray-scale ultrasonic histogram analysis could help diagnosing chronic hepatitis B. However, Kwon et al16 applied histogram analysis of greyscale sonograms to differentiate between the subtypes of follicular variant of papillary thyroid cancer, whereas skewness and kurtosis were far from significant to differentiate the subtypes of FVPTC. In the present study, kurtosis and variance all had no significance for the differential diagnosis between FA and TN-IDC groups. In addition, there was a increasing trend in skewness across FA to TN-IDC groups, but the statistical analysis did not reach a significant level (P = 0.110). The possible reason may be associated with the relatively small sample size included in our study. Long-term follow-up studies including larger sample size would be required to detect the diagnostic role of skewness.
Our study has several limitations. Firstly, this work was a single center retrospective study and only included patients with lesion size larger than 0.60cm. In the future, smaller tumors will be included to increase the clinical practicability. Secondly, routine US (including tumor margin, orientation, posterior acoustic features, microcalcification and so on), elastography and CEUS features of breast tumors were not analyzed in this study, which will be added for multivariate analysis to improve the value of US in the differential diagnosis. Thirdly, the sample size of this study is small, the inclusion of more cases may help improve the differential diagnosis value of histogram analysis. Fourthly, except for analyzing the possible influence of inter-observer agreement on the histogram parameters, this study did not discuss the influence of other possible factors on the histogram parameters, which needs to be further explored. Finally, we manually delineated the maximum diameter level of the tumor as ROI, which may not accurately reflect the characteristics of the whole tumor. Previous studies had suggested that the final results of two-dimensional (2D) or three-dimensional (3D) ROI selection for a single lesion are very similar.43
In conclusion, histogram analysis of gray-scale US image can quantitatively evaluate breast tumors with excellent repeatability. In addition, the mean value and the nth percentiles of TN-IDC group tend to be lower than those of FA group, also indicating that TN-IDC tumors tend to have darker average pixel intensity than fibroadenoma in gray-scale US image. This histogram analysis method may be feasible and effective to distinguish small, oval, or round TN-IDC from FA. Further prospective research is needed to verify the superiority of gray-scale histogram method in clinical work.
Funding
This study was financially supported by Wu Jieping Medical Foundation (Project No. 320.6750.19089-40, Project No. 320.6750.19089-38, Project No. 320.6750.17386); Climbing Foundation Clinical Research Project of National Cancer Center (Project No. NCC201917B04).
Disclosure
The authors report no conflicts of interest in this work.
References
1. Yeo SH, Kim GR, Lee SH, Moon WK. Comparison of ultrasound elastography and color Doppler ultrasonography for distinguishing small triple-negative breast cancer from fibroadenoma. J Ultrasound Med. 2018;37(9):2135–2146. doi:10.1002/jum.14564
2. Luo YK. [Current situation and advances in diagnosing triple-negative breast cancer using ultrasound]. Zhongguo Yi Xue Ke Xue Yuan Xue Bao. 2021;43(3):309–313. Chinese. doi:10.3881/j.issn.1000-503X.13917
3. Zhang S, Ding Y, Zhou Q, Wang C, Wu P, Dong J. Correlation factors analysis of breast cancer tumor volume doubling time measured by 3D-ultrasound. Med Sci Monit. 2017;23:3147–3153. doi:10.12659/msm.901566
4. Adrada BE, Candelaria R, Moulder S, et al. Early ultrasound evaluation identifies excellent responders to neoadjuvant systemic therapy among patients with triple-negative breast cancer. Cancer-Am Cancer Soc. 2021;127(16):2880–2887. doi:10.1002/cncr.33604
5. Xu X, Zhang R, Yang X, et al. A honeycomb-like bismuth/manganese oxide nanoparticle with mutual reinforcement of internal and external response for triple-negative breast cancer targeted therapy. Adv Healthc Mater. 2021;10(18):e2100518. doi:10.1002/adhm.202100518
6. Chen Q, Xia J, Zhang J. Identify the triple-negative and non-triple-negative breast cancer by using texture features of medical ultrasonic image: a STROBE-compliant study. Medicine. 2021;100(22):e25878. doi:10.1097/MD.0000000000025878
7. Li JW, Zhang K, Shi ZT, et al. Triple-negative invasive breast carcinoma: the association between the sonographic appearances with clinicopathological feature. Sci Rep. 2018;8(1):9040. doi:10.1038/s41598-018-27222-6
8. Boisserie-Lacroix M, Macgrogan G, Debled M, et al. Triple-negative breast cancers: associations between imaging and pathological findings for triple-negative tumors compared with hormone receptor-positive/human epidermal growth factor receptor-2-negative breast cancers. Oncologist. 2013;18(7):802–811. doi:10.1634/theoncologist.2013-0380
9. Lee SE, Han K, Kwak JY, Lee E, Kim EK. Radiomics of US texture features in differential diagnosis between triple-negative breast cancer and fibroadenoma. Sci Rep. 2018;8(1):13546. doi:10.1038/s41598-018-31906-4
10. Moon WK, Huang YS, Lo CM, et al. Computer-aided diagnosis for distinguishing between triple-negative breast cancer and fibroadenomas based on ultrasound texture features. Med Phys. 2015;42(6):3024–3035. doi:10.1118/1.4921123
11. Beyazal M, Beyazal PH, Erturk A, Bedir R. Noninvasive assessment of liver parenchyma using gray-scale ultrasound-based histogram analysis in patients with chronic Hepatitis B infection. Ultrasound Q. 2020;36(1):69–73. doi:10.1097/RUQ.0000000000000438
12. Xu M, Tang Q, Li M, Liu Y, Li F. An analysis of Ki-67 expression in stage 1 invasive ductal breast carcinoma using apparent diffusion coefficient histograms. Quant Imaging Med Surg. 2021;11(4):1518–1531. doi:10.21037/qims-20-615
13. Liang HY, Huang YQ, Yang ZX, Ying-Ding ZMS, Rao SX. Potential of MR histogram analyses for prediction of response to chemotherapy in patients with colorectal hepatic metastases. Eur Radiol. 2016;26(7):2009–2018. doi:10.1007/s00330-015-4043-2
14. Lubner MG, Malecki K, Kloke J, Ganeshan B, Pickhardt PJ. Texture analysis of the liver at MDCT for assessing hepatic fibrosis. Abdom Radiol. 2017;42(8):2069–2078. doi:10.1007/s00261-017-1096-5
15. Xu Y, Ru T, Zhu L, et al. Ultrasonic histogram assessment of early response to concurrent chemo-radiotherapy in patients with locally advanced cervical cancer: a feasibility study. Clin Imaging. 2018;49:144–149. doi:10.1016/j.clinimag.2018.01.002
16. Kwon MR, Shin JH, Hahn SY, et al. Histogram analysis of greyscale sonograms to differentiate between the subtypes of follicular variant of papillary thyroid cancer. Clin Radiol. 2018;73(6):591. doi:10.1016/j.crad.2017.12.008
17. Erol B, Kara T, Gurses C, et al. Gray scale histogram analysis of solid breast lesions with ultrasonography: can lesion echogenicity ratio be used to differentiate the malignancy? Clin Imaging. 2013;37(5):871–875. doi:10.1016/j.clinimag.2013.04.007
18. Zhang F, Shi M, Liao Q, Zhou CM. [Clinicopathologic features of secretory breast carcinoma]. Zhonghua Zhong Liu Za Zhi. 2019;41(8):628–632. Chinese. doi:10.3760/cma.j.issn.0253-3766.2019.08.013
19. Hammond ME, Hayes DF, Dowsett M, et al. American Society of Clinical Oncology/College of American Pathologists guideline recommendations for immunohistochemical testing of estrogen and progesterone receptors in breast cancer. J Clin Oncol. 2010;28(16):2784–2795. doi:10.1200/JCO.2009.25.6529
20. DeLong ER, DeLong DM, Clarke-Pearson DL. Comparing the areas under two or more correlated receiver operating characteristic curves: a nonparametric approach. Biometrics. 1988;44(3):837–845. doi:10.2307/2531595
21. Yuan ZY, Wang SS, Gao Y, Su ZY, Luo WB, Guan ZZ. [Clinical characteristics and prognosis of triple-negative breast cancer: a report of 305 cases]. Ai Zheng. 2008;27(6):561–565. Chinese.
22. Li Z, Tian J, Wang X, et al. Differences in multi-modal ultrasound imaging between triple negative and non-triple negative breast cancer. Ultrasound Med Biol. 2016;42(4):882–980. doi:10.1016/j.ultrasmedbio.2015.12.003
23. Yoon GY, Cha JH, Kim HH, Shin HJ, Chae EY, Choi WJ. Sonographic features that can be used to differentiate between small triple-negative breast cancer and fibroadenoma. Ultrasonography. 2018;37(2):149–156. doi:10.14366/usg.17036
24. Li H, He Z, Yang Q, Wang J, Ling Y. Clinicopathologic features and prognosis of triple-negative breast cancer in China: a retrospective cohort study of patients under 35 years old. Int J Clin Exp Pathol. 2021;14(1):24–33.
25. Cho N, Jang M, Lyou CY, Park JS, Choi HY, Moon WK. Distinguishing benign from malignant masses at breast US: combined US elastography and color Doppler US–influence on radiologist accuracy. Radiology. 2012;262(1):80–90. doi:10.1148/radiol.11110886
26. Kanagaraju V, Dhivya B, Devanand B, Maheswaran V. Utility of ultrasound strain elastography to differentiate benign from malignant lesions of the breast. J Med Ultrasound. 2021;29(2):89–93. doi:10.4103/JMU.JMU_32_20
27. Holcombe C, Pugh N, Lyons K, Douglas-Jones A, Mansel RE, Horgan K. Blood flow in breast cancer and fibroadenoma estimated by colour Doppler ultrasonography. Br J Surg. 1995;82(6):787–788. doi:10.1002/bjs.1800820622
28. Cosgrove DO, Kedar RP, Bamber JC, et al. Breast diseases: color Doppler US in differential diagnosis. Radiology. 1993;189(1):99–104. doi:10.1148/radiology.189.1.8372225
29. Yoon JH, Jung HK, Lee JT, Ko KH. Shear-wave elastography in the diagnosis of solid breast masses: what leads to false-negative or false-positive results? Eur Radiol. 2013;23(9):2432–2440. doi:10.1007/s00330-013-2854-6
30. Basara AI, Ozgul HA, Guray DM, Balci P. Evaluation of elastographic features in complex fibroadenomas with radiologic-pathologic correlation. J Ultrasound Med. 2021;40(8):1709–1718. doi:10.1002/jum.15534
31. Skaane P, Engedal K. Analysis of sonographic features in the differentiation of fibroadenoma and invasive ductal carcinoma. AJR Am J Roentgenol. 1998;170(1):109–114. doi:10.2214/ajr.170.1.9423610
32. Nakashima K, Uematsu T, Takahashi K, et al. Does breast cancer growth rate really depend on tumor subtype? Measurement of tumor doubling time using serial ultrasonography between diagnosis and surgery. Breast Cancer-Tokyo. 2019;26(2):206–214. doi:10.1007/s12282-018-0914-0
33. Yang Q, Liu HY, Liu D, Song YQ. Ultrasonographic features of triple-negative breast cancer: a comparison with other breast cancer subtypes. Asian Pac J Cancer Prev. 2015;16(8):3229–3232. doi:10.7314/apjcp.2015.16.8.3229
34. Cole-Beuglet C, Soriano RZ, Kurtz AB, Goldberg BB. Fibroadenoma of the breast: sonomammography correlated with pathology in 122 patients. AJR Am J Roentgenol. 1983;140(2):369–375. doi:10.2214/ajr.140.2.369
35. Kuijper A, Mommers EC, van der Wall E, van Diest PJ. Histopathology of fibroadenoma of the breast. Am J Clin Pathol. 2001;115(5):736–742. doi:10.1309/F523-FMJV-W886-3J38
36. Hodges KB, Abdul-Karim FW, Wang M, et al. Evidence for transformation of fibroadenoma of the breast to malignant phyllodes tumor. Appl Immunohistochem Mol Morphol. 2009;17(4):345–350. doi:10.1097/PAI.0b013e318194d992
37. Yilmaz E, Sal S, Lebe B. Differentiation of phyllodes tumors versus fibroadenomas. Acta Radiol. 2002;43(1):34–39.
38. Stavros AT, Thickman D, Rapp CL, Dennis MA, Parker SH, Sisney GA. Solid breast nodules: use of sonography to distinguish between benign and malignant lesions. Radiology. 1995;196(1):123–134. doi:10.1148/radiology.196.1.7784555
39. Sezer I, Erdem TI, Yagci B, Erbasan F, Ayan A, Karasu U. The role of real-time tissue elastography and gray-scale ultrasound histogram analysis in the diagnosis of patients with sjogren’s syndrome. Arch Rheumatol. 2019;34(4):371–379. doi:10.5606/ArchRheumatol.2019.7120
40. Cekic B, Toslak IE, Sahinturk Y, et al. Differentiating transudative from exudative ascites using quantitative B-Mode gray-scale ultrasound histogram. AJR Am J Roentgenol. 2017;209(2):313–319. doi:10.2214/AJR.16.16509
41. Kim GR, Kim EK, Kim SJ, et al. Evaluation of underlying lymphocytic thyroiditis with histogram analysis using grayscale ultrasound images. J Ultrasound Med. 2016;35(3):519–526. doi:10.7863/ultra.15.04014
42. Kim MY, Choi N. Mammographic and ultrasonographic features of triple-negative breast cancer: a comparison with other breast cancer subtypes. Acta Radiol. 2013;54(8):889–894. doi:10.1177/0284185113488580
43. Ng F, Kozarski R, Ganeshan B, Goh V. Assessment of tumor heterogeneity by CT texture analysis: can the largest cross-sectional area be used as an alternative to whole tumor analysis? Eur J Radiol. 2013;82(2):342–348. doi:10.1016/j.ejrad.2012.10.023
 © 2022 The Author(s). This work is published and licensed by Dove Medical Press Limited. The full terms of this license are available at https://www.dovepress.com/terms.php and incorporate the Creative Commons Attribution - Non Commercial (unported, v3.0) License.
By accessing the work you hereby accept the Terms. Non-commercial uses of the work are permitted without any further permission from Dove Medical Press Limited, provided the work is properly attributed. For permission for commercial use of this work, please see paragraphs 4.2 and 5 of our Terms.
© 2022 The Author(s). This work is published and licensed by Dove Medical Press Limited. The full terms of this license are available at https://www.dovepress.com/terms.php and incorporate the Creative Commons Attribution - Non Commercial (unported, v3.0) License.
By accessing the work you hereby accept the Terms. Non-commercial uses of the work are permitted without any further permission from Dove Medical Press Limited, provided the work is properly attributed. For permission for commercial use of this work, please see paragraphs 4.2 and 5 of our Terms.