")
Back to Journals » Clinical Epidemiology » Volume 11
Validity of ICD-10 diagnoses of overweight and obesity in Danish hospitals
Authors Gribsholt SB , Pedersen L, Richelsen B, Thomsen RW
Received 8 May 2019
Accepted for publication 15 August 2019
Published 11 September 2019 Volume 2019:11 Pages 845—854
DOI https://doi.org/10.2147/CLEP.S214909
Checked for plagiarism Yes
Review by Single anonymous peer review
Peer reviewer comments 2
Editor who approved publication: Dr Eyal Cohen
Sigrid Bjerge Gribsholt,1,2 Lars Pedersen,1 Bjørn Richelsen,3 Reimar Wernich Thomsen1
1Department of Clinical Epidemiology, Aarhus University Hospital, Aarhus, Denmark; 2Department of Endocrinology and Internal Medicine, Aarhus University Hospital, Aarhus, Denmark; 3The Steno Diabetes Centre Aarhus, Aarhus University Hospital, Aarhus, Denmark
Correspondence: Sigrid Bjerge Gribsholt
Department of Clinical Epidemiology, Aarhus University Hospital, Olof Palmes Allé 43-45, Aarhus N 8200, Denmark
Tel +45 6 165 1148
Email [email protected]
Purpose: Health care databases may be a valuable source for epidemiological research in obesity, if diagnoses are valid. We examined the validity and completeness of International Classification of Diseases, 10th revision [ICD-10] diagnosis coding for overweight/obesity in Danish hospitals.
Patients and methods: We linked data from the Danish National Patient Registry on patients with a hospital diagnosis code of overweight/obesity (ICD-10 code E66) with computerized height and weight measurements made during hospital contacts in the Central Denmark Region Clinical Information System. We computed the positive predictive value (PPV) of the IDC-10 diagnosis of overweight/obesity, using a documented body mass index (BMI) ≥25 kg/m2 as gold standard. We also examined the completeness of obesity/overweight diagnosis coding among all patients recorded with BMI ≥25 kg/m2.
Results: Of all 19,672 patients registered with a first diagnosis code of overweight/obesity in the National Patient Registry, 17,351 patients (88.2%) had any BMI measurement recorded in the Central Denmark Region Clinical Information System, and 17,240 patients (87.6%) had a BMI ≥25 kg/m2, yielding a PPV of 87.6% (95% CI: 87.2–88.1). The PPV was slightly higher for primary diagnosis codes of overweight/obesity: 94.1% (95% CI: 93.3–94.8) than for secondary diagnosis codes: 86.1% (95% CI: 85.6–86.6). The PPV increased with higher patient age: from 75.3% (95% CI: 73.8–76.9) in those aged 18–29 years to 94.7% (95% CI: 92.6–96.9) in patients aged 80 years and above. Completeness of obesity/overweight diagnosis coding among patients recorded with BMI ≥25 kg/m2 was only 10.9% (95% CI: 10.8–11.0).
Conclusion: Our findings indicate a high validity of the ICD-10 code E66 for overweight/obesity when recorded; however, completeness of coding was low. Nonetheless, ICD-10 discharge codes may be a suitable source of data on overweight/obesity for epidemiological research.
Keywords: obesity, validation, diagnosis code
Introduction
Obesity is a globally increasing health problem and a risk factor for major diseases including diabetes,1 cardiovascular disease,2 cancer,3,4 and premature death.5–9 Obesity may also influence the clinical course of many medical diseases.10–20 Therefore, valid data on obesity are important in many epidemiological studies of risk and prognosis.
Hospital diagnosis codes for overweight and obesity exist in the ICD,4 and the prevalence of hospital contacts with diagnoses of overweight/obesity has increased in Denmark during the past decades.21,22 Use of hospital discharge registries can be a valuable and cost-effective source for epidemiological research in obesity, if diagnoses are valid. More than 20 years ago, Wolk et al validated the use of the ICD, version 8, diagnosis code for obesity (ICD-8 code 277) in the Swedish National Patient Register.3 They found a positive predictive value (PPV) of obesity diagnosis of 85% among women and 95% among men, when compared with the patients’ medical charts as gold standard.3 In the newer ICD-10 coding classification system, the diagnosis code for obesity (ICD-10 code E66) contains several subtypes, ranging from overweight (E660A) to morbid obesity (E660G and E660H). In the United Kingdom, Nicholson et al reported a high validity of overweight and overweight diagnosis codes, registered by general practitioners.23 On the other hand, not all patients with overweight/obesity may have information on BMI documented in their Electronic Health Record.24 To our knowledge, despite its potential importance, the ICD-10 hospital diagnosis of obesity has never been validated in a population-based health care system.25
We therefore examined the PPV of ICD-10 overweight and obesity diagnoses in the population-based Danish National Patient Registry (DNRP), using computerized BMI measurements from individual-level hospital contacts in the Central Denmark Region Clinical Information System (CDRCIS) as the reference. Second, we examined the completeness of overweight/obesity diagnosis coding among patients with a BMI measurement ≥25 kg/m2.
Materials and methods
Setting and data sources
The Danish National Board of Health and the five Danish administrative Regions provide unrestricted tax-supported health care to all 5.81 million Danish residents, including hospital care.26 The Central Denmark Region has a mixed rural and urban population of approximately 1.32 million persons. This Region has five hospitals, of which one is a university hospital and four are regional hospitals. The Danish Civil Registration System assigns a unique, central personal registration number (CPR number) to each resident, either at birth or upon immigration, which allows unambiguous individual-level linkage of health registries.26
The DNPR provides information on all non-psychiatric contacts at any hospital in Denmark.25 All inpatient hospital admissions have been tracked since 1977 and all visits at hospital outpatient clinics and emergency rooms have been recorded since 1995. All contacts are coded by treating physicians according to the ICD-10 system since 1994 and before that according to the ICD-8 (1977–1993). The DNPR compiles data on hospital, department, admission and discharge dates, one primary (first-listed) and up to 19 secondary diagnosis codes, and type of admission (elective inpatient/acute inpatient/outpatient).25 In recent years, for all hospitals in the Central Denmark Region, information on patients’ height, weight, and selected lifestyle risk factors have been registered in the computerized CDRCIS. At each individual patient contact with any hospital – either during an inpatient hospitalization course or at a hospital outpatient clinic visit – nurses or physicians can obtain data on height, weight and/or BMI through patient interview and examination, and then electronically record these data in the CDRCIS together with the contact date and the patient’s unique CPR number.22
Overweight and obesity diagnosis codes
For our validation study, we first identified all unique persons with one or more inpatient or outpatient hospital contacts at any hospital in the Central Denmark Region, 2012–2015 (n=755,656), using the DNPR (Figure 1, flow chart). Among these persons, we then identified those who had at least one primary or secondary ICD-10 discharge diagnosis code E66 (overweight or obesity) between 2012 and 2015. If persons had more than one diagnosis date with E66 coded during 2012–2015, we included the most recent registered E66 diagnosis date only. Furthermore, we examined subgroups within the E66 diagnosis code category, based on the most recent registered code 2012–2015: E660A: overweight, BMI 25–29.9 kg/m2, E660B: obesity, BMI 30–34.9 kg/m2, E660C: severe obesity, BMI 35–39.9 kg/m2, E660E: morbid obesity, BMI 40–44.9 kg/m2, E660F: morbid obesity, BMI 45–49.9 kg/m2, E660G: super obesity, BMI 50–54.9 kg/m2, E660H: super obesity, BMI ≥55 kg/m2 (Table 1).
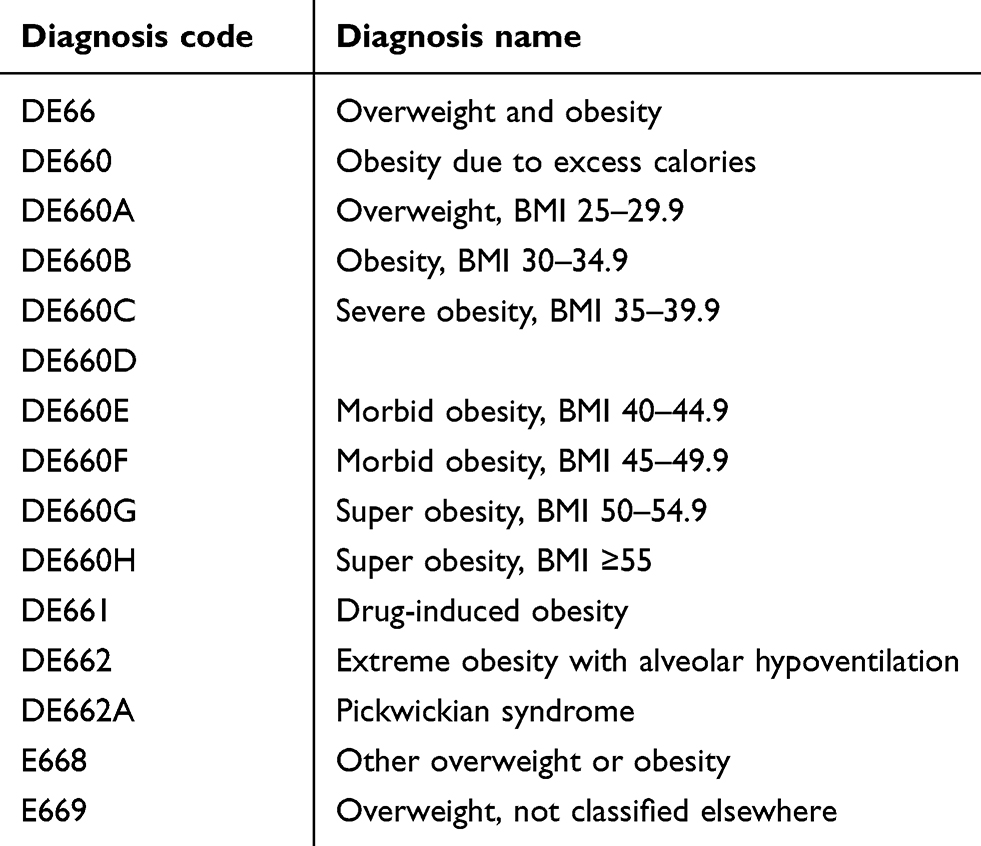 |
Table 1 List of overweight and obesity diagnosis codes, according to the International Classification of Diseases, 10th edition |
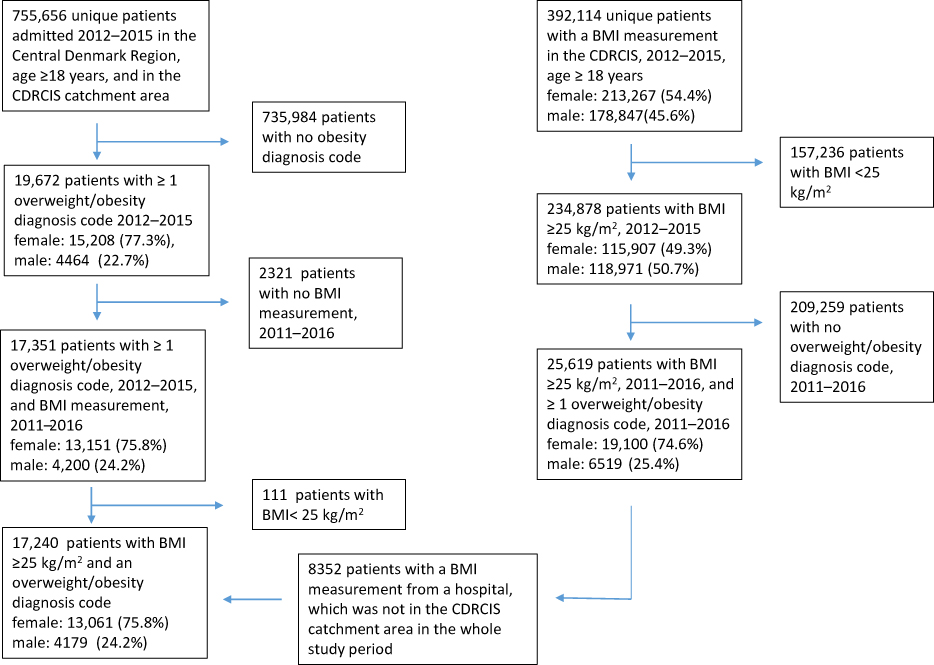 |
Figure 1 Flow chart: inclusion and exclusion of patients.Abbreviations: CDRCIS, Central Denmark Region Clinical Information System; BMI, body mass index. |
Validation of diagnoses by BMI
We used the CPR-number to link individual-level diagnosis data from the DNPR (overweight/obesity diagnosis codes and dates) with time-stamped height/weight/BMI data from the CDRCIS. For each patient with an overweight/obesity diagnosis code during 2012–2015, we assessed the presence of any records of height, weight and/or BMI in the CDRCIS during 2011–2016, to allow for 1 year of early or delayed electronic BMI recordings, respectively.
We calculated BMI from any registered height (during the whole study period, assuming stable height) and weight measurements registered in the CDRCIS. If a calculated BMI value was present for a patient in the CDRCIS, we used that value. We used a BMI ≥25 kg/m2 as gold standard and classified patients with a BMI ≥25 kg/m2 as having overweight or obesity in our main analysis, since both overweight and obesity are included in the E66 diagnosis code category and since some of the E66 subcategories include both conditions (E668: other overweight or obesity and E669: overweight not classified elsewhere).
Completeness of overweight/obesity coding among patients with a BMI measurement ≥25 kg/m2
Second, we focused on all patients with a BMI measurement in the CDRCIS, identifying all patients with a BMI measurement ≥25 kg/m2 2012–2015 as our starting point (N=234,878, Figure 1, flow chart). From the DNPR we thereafter identified any overweight/obesity diagnosis code given at any Danish hospital, including nationwide DNPR data in the period 2011–2016.
Due to structural changes in the Region’s health care system some hospitals were in the CDRCIS electronic data catchment area during the first years of study, 2011–2013, but not in the whole study period. BMI results from these hospitals were included in the analyses of false negative results, but not in the main analyses.27
Statistical analyses
The PPV was defined as the proportion of patients registered with an obesity diagnosis in the DNPR that was confirmed by a record of measured BMI ≥25 kg/m2, 2011–2016 (gold standard). We also performed a sensitivity analysis including only BMI measurements 1 year before/after the overweight/obesity diagnosis code. The numerator was a confirmed BMI ≥25 kg/m2 in the CDRCIS, and the denominator was the number of patients with an overweight/obesity code in the DNPR. The 95% CIs were calculated using Jeffrey´s method.28 Persons with an overweight/obesity diagnosis code may lack a confirmatory BMI ≥25 kg/m2 value, either when BMI was not measured and/or electronically documented (“missing BMI”), or when a BMI value was documented but was <25 kg/m2 (“BMI value not overweight/obese”). Our analysis was a “worst case analysis”, counting both persons with missing BMI and persons with BMI value not overweight/obese in the “overweight/obesity not confirmed” category (some overweight/obese patients likely had a BMI ≥25 kg/m2 measured in clinical care, which was just not entered into the electronic system for various reasons).
We stratified the PPV analysis by sex, age, admission type (acute inpatient admission/elective inpatient admission/hospital outpatient clinic visit), primary versus secondary diagnosis code, department type (medical, surgical, emergency, gynecological and obstetric, or any other department), and by hospital. In a secondary analysis, we assessed the completeness of E66 coding among patients with a BMI≥25 kg/m2 in the CDRCIS. Here, the numerator was the number of patients with an overweight/obesity code in the DNPR, and the denominator was a confirmed BMI ≥25 kg/m2 in the CDRCIS. Finally, we used multivariate logistic regression to examine predictors of diagnosis coding of overweight/obesity, using age group 18–29 years, female gender, hospital contact in the first year 2012, and residency in the Central Denmark Region as reference groups, expressed as odds ratios and adjusted odds ratios (aOR).
The study was approved by the Danish Data Protection Agency (Record Number KEA-2016-051-000001, 401). According to Danish legislation, purely registry-based studies do not require separate approval from the Danish Scientific Ethics Committee. All analyses were conducted using SAS statistical software (version 9.3).
Results
In total, we identified 19,672 patients who had one or more hospital contacts with an E66 overweight/obesity diagnosis code between 2012 and 2015. Among these, 17,351 patients (88.2%) had at least one measurement of BMI recorded 2011–2016 (main analysis). A total of 17,240 (87.6%) had a BMI ≥25 kg/m2, corresponding to an overall PPV for overweight/obesity of 87.6% (95% CI: 87.2–88.1) (Table 2).
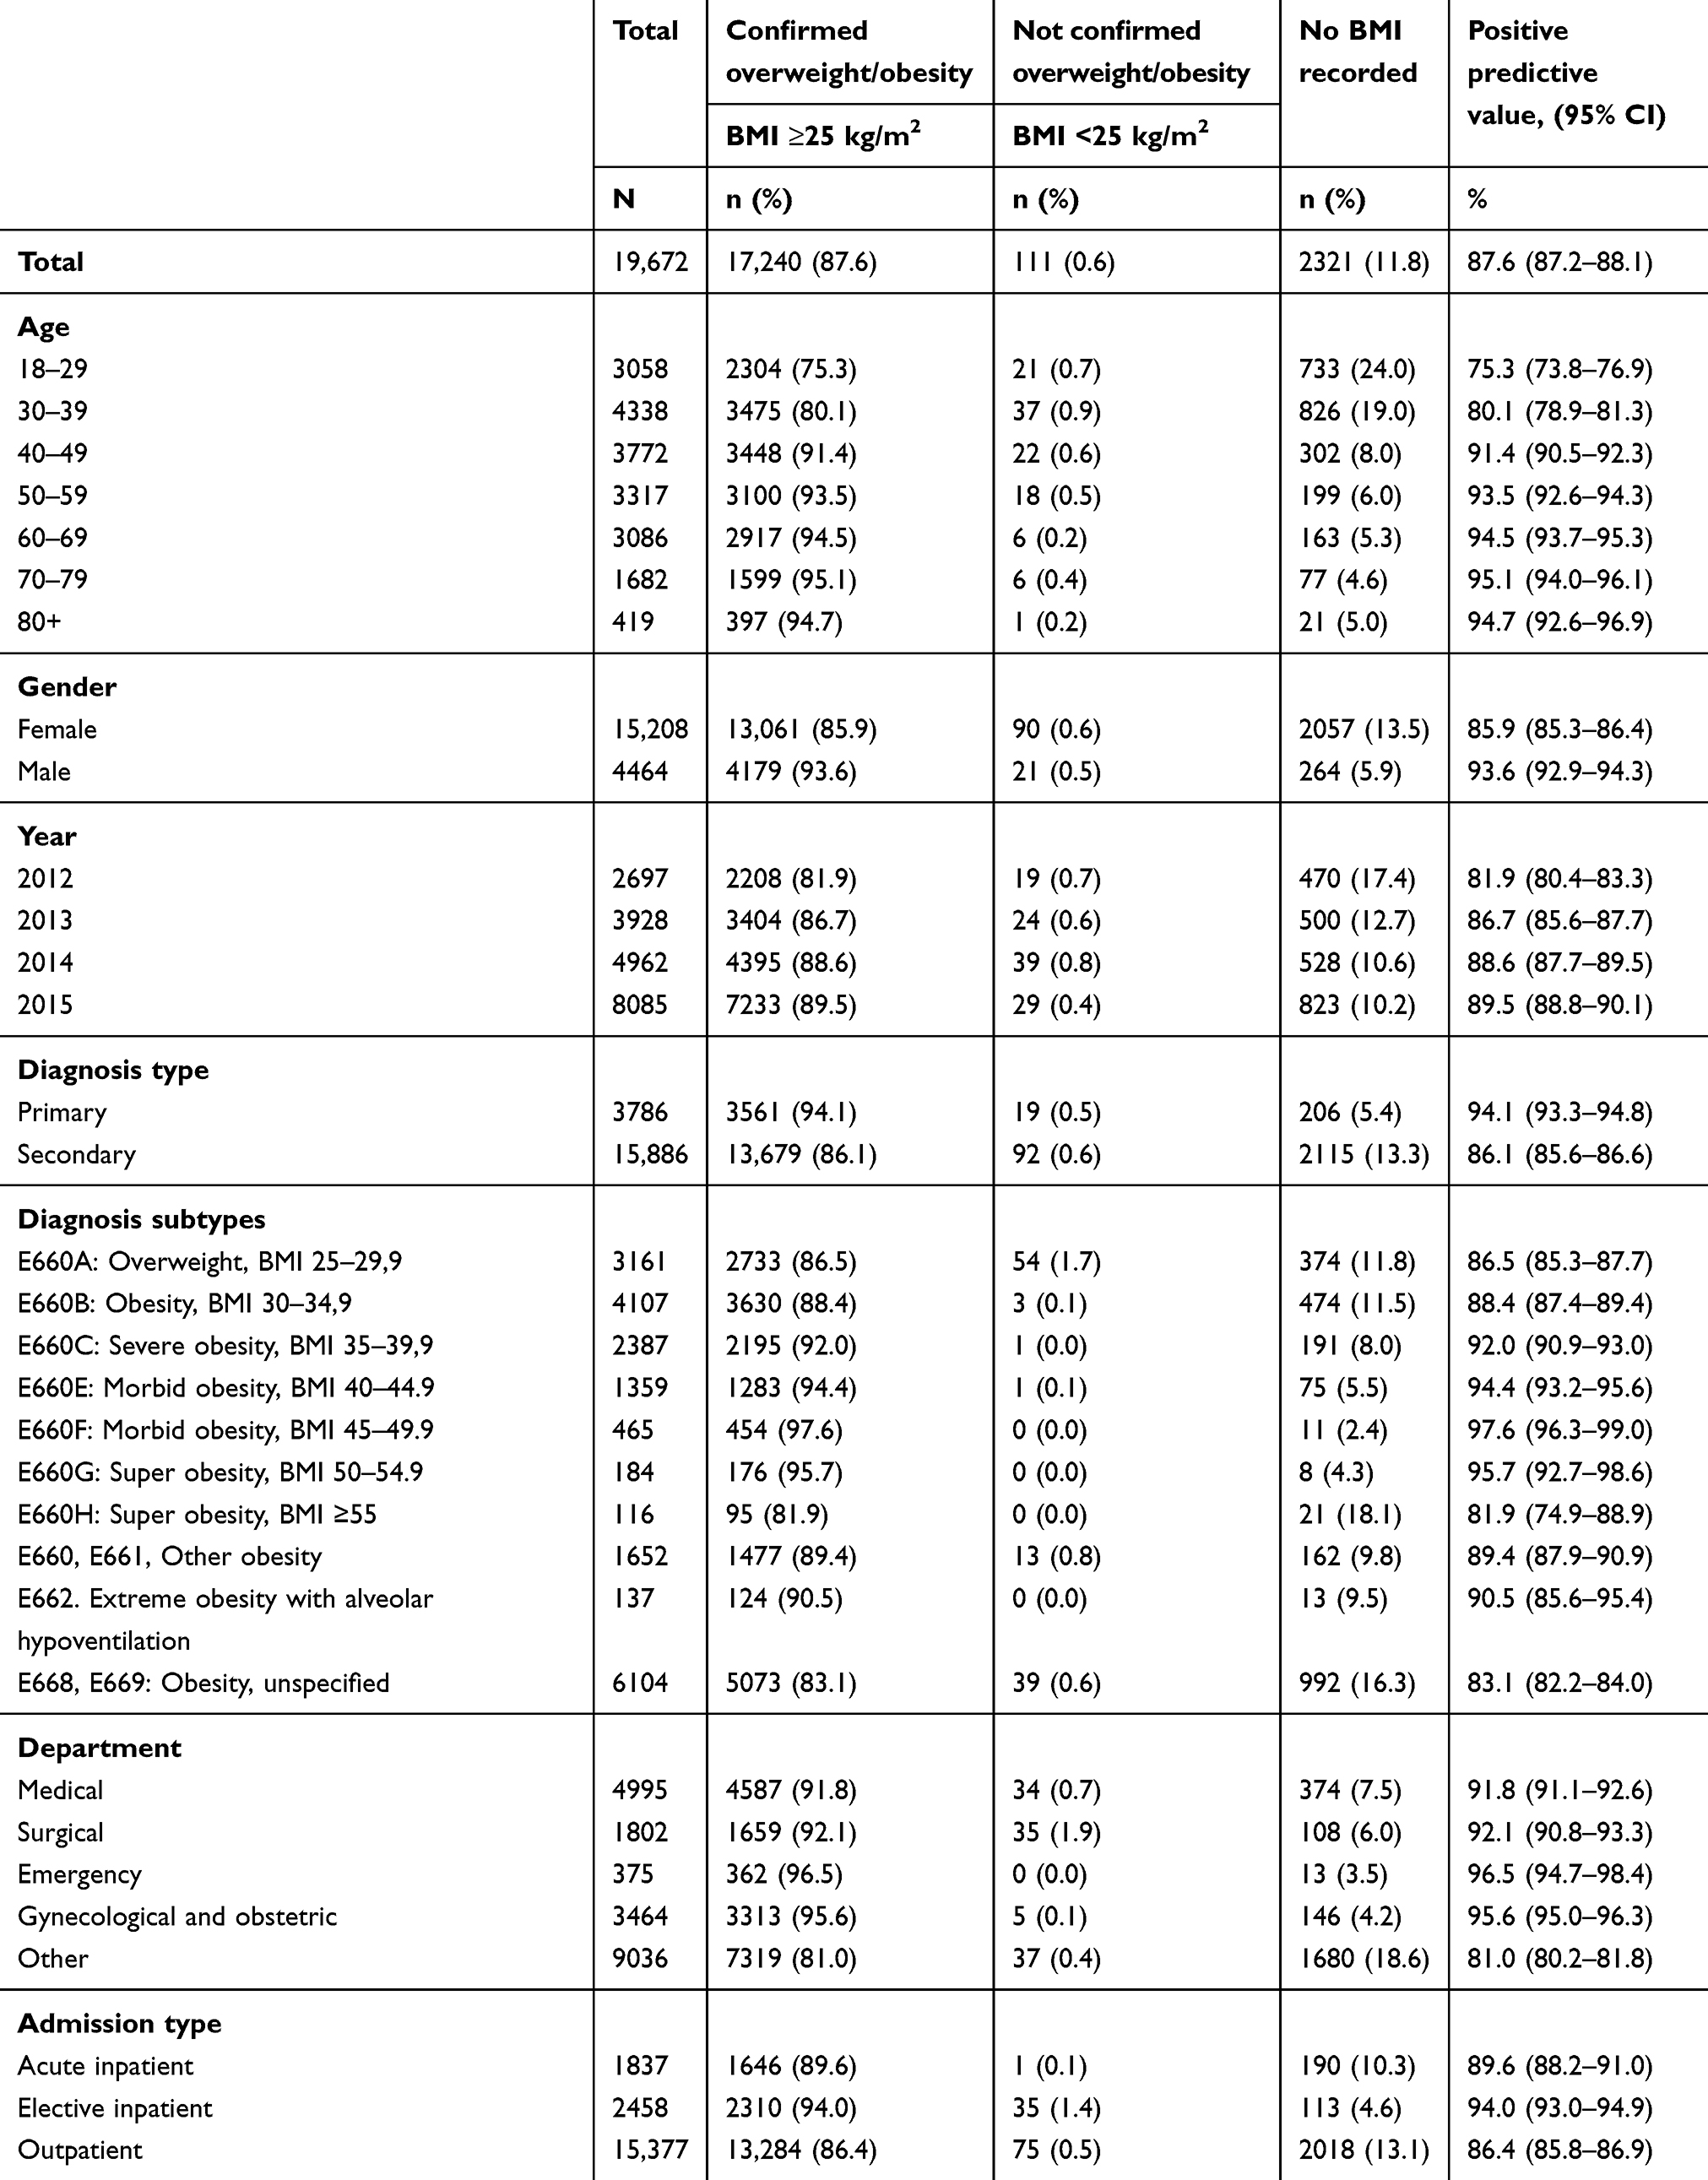 |
Table 2 Validity of ICD-10 codes for presence of overweight/obesity among 19,672 patients in the Central Denmark Region, 2012–2015, based on BMI measurements |
Most patients (15,856, 80.6%) had their BMI measured within 1 year before/after the overweight/obesity diagnosis: and 15,689 (79.8%) had a BMI ≥25 kg/m2, yielding a PPV of 79.8 (95% CI: 79.2–80.3) when focusing on BMI values within 1 year (Table 3). The following results are reported for BMI measurements available during the whole study period (Table 2); corresponding data for ±1 year BMI values only are shown in Table 3.
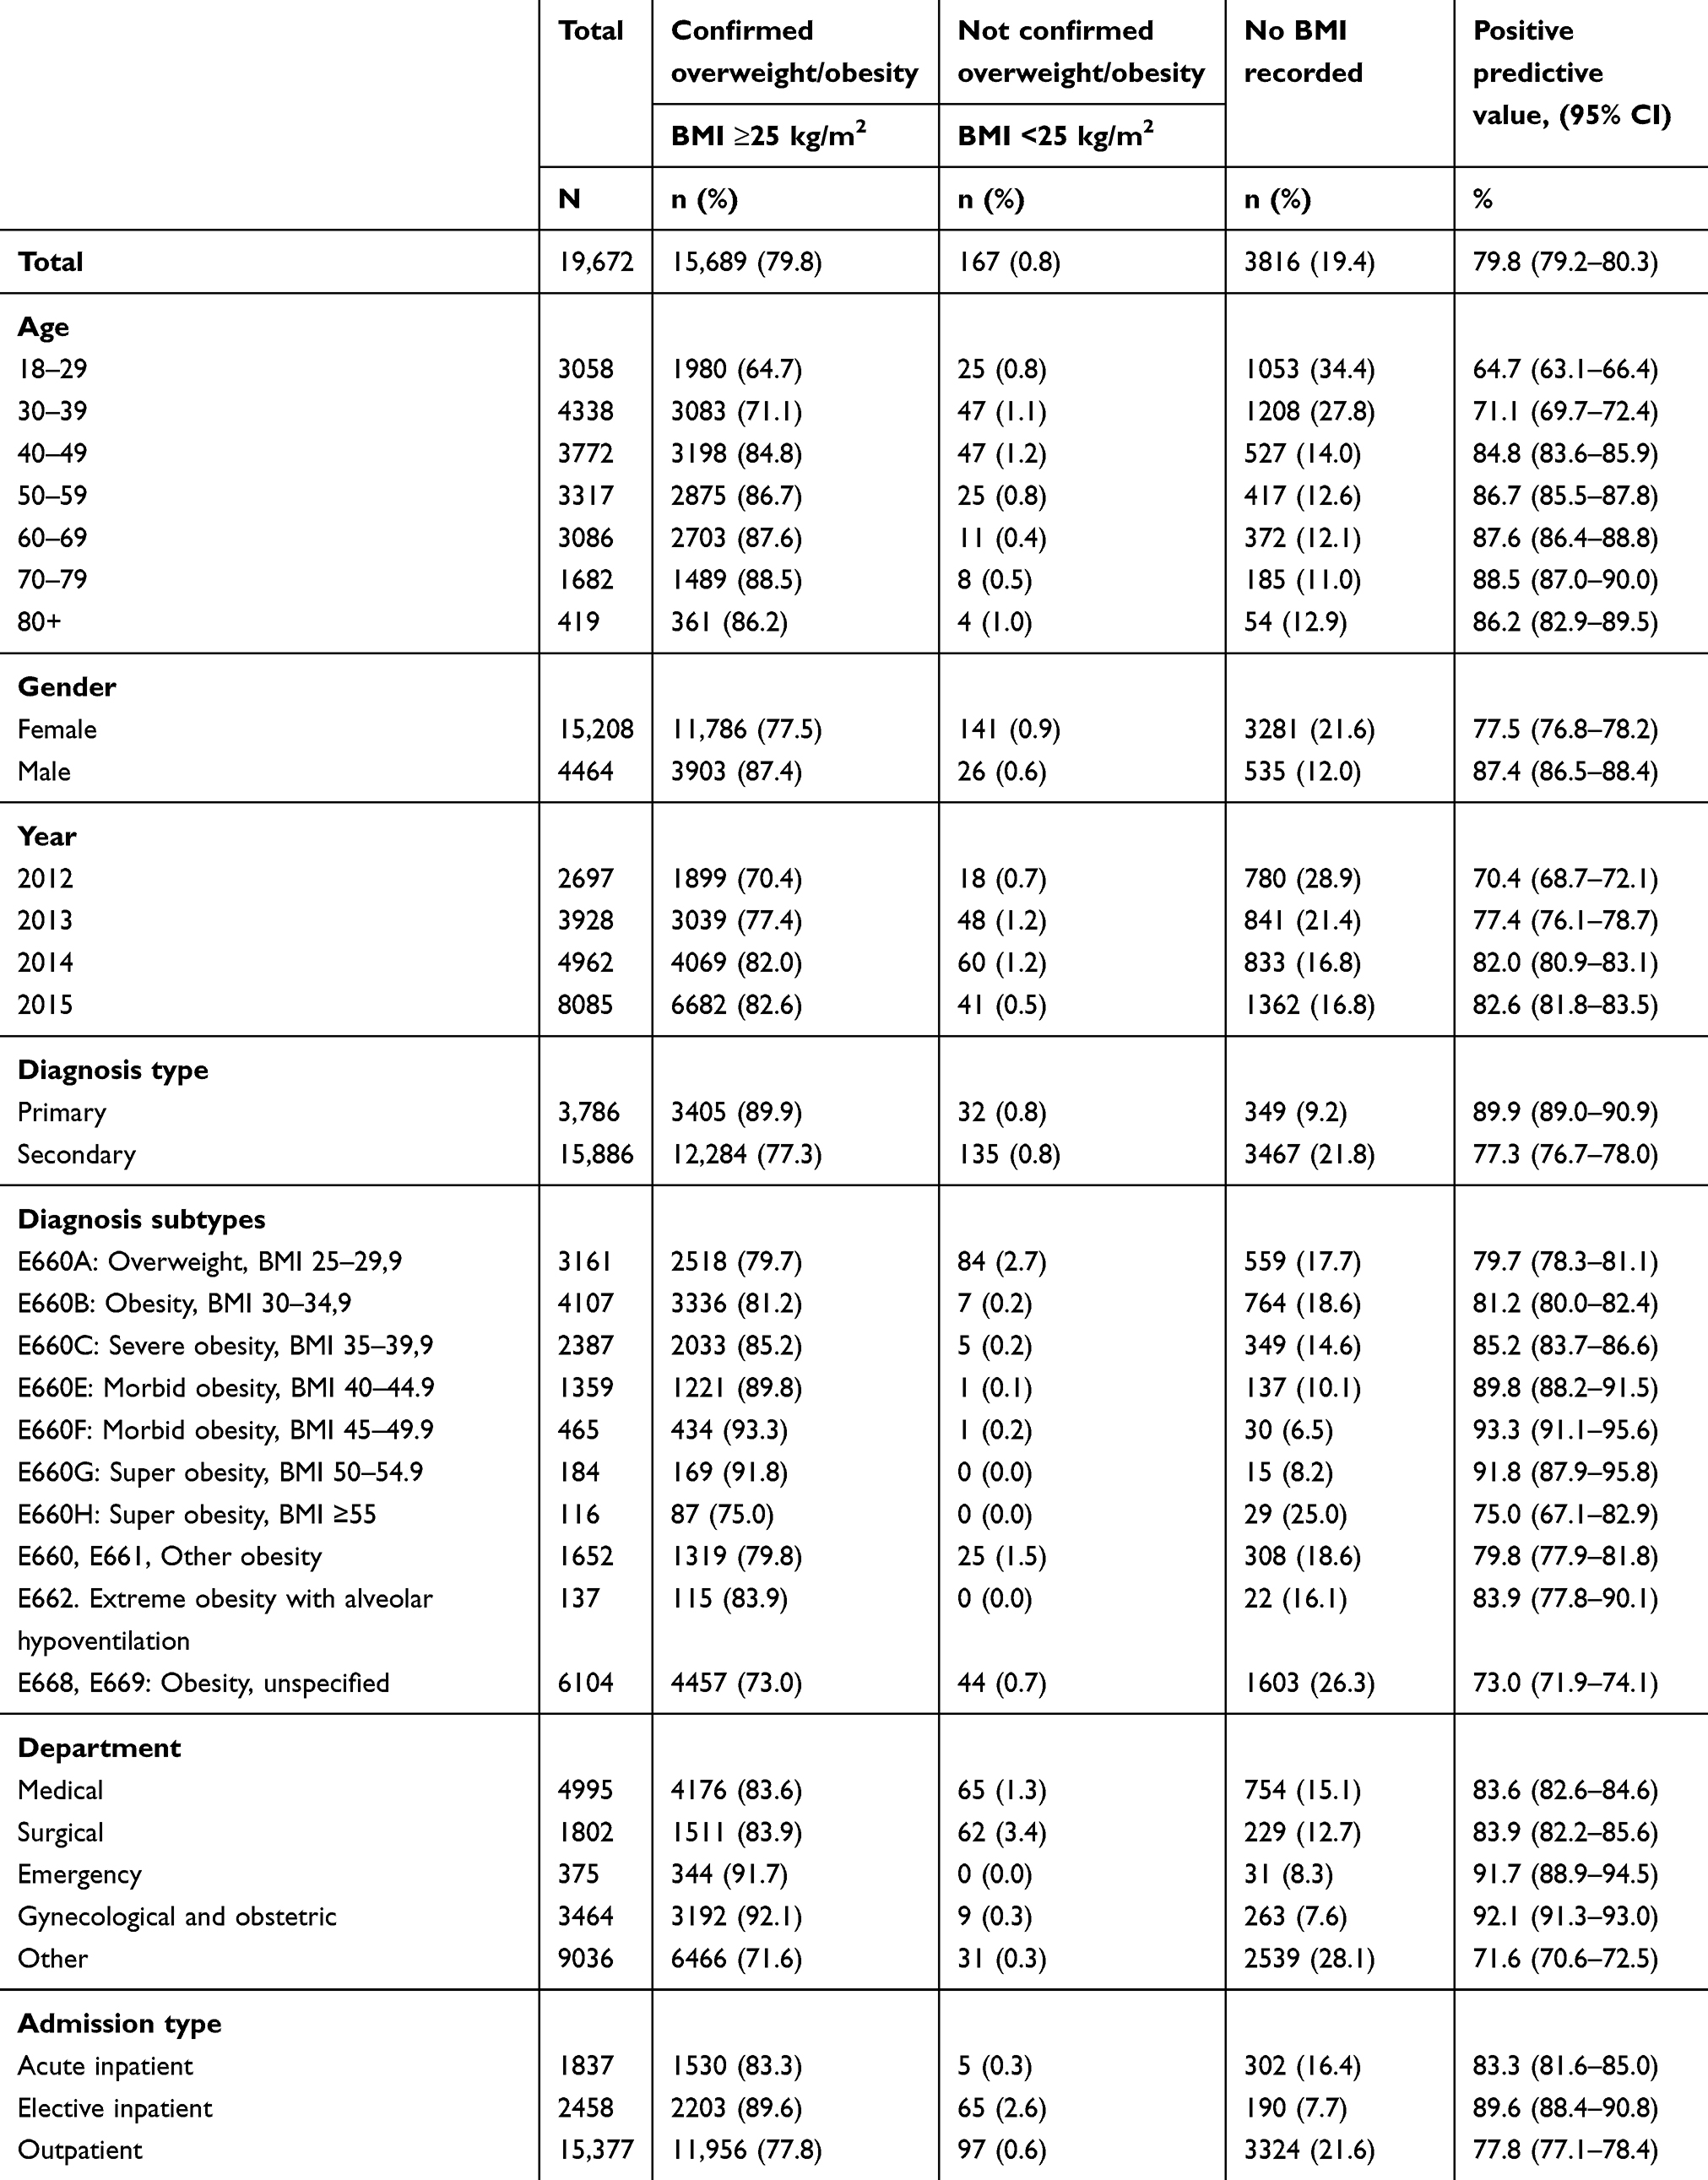 |
Table 3 Validity of ICD-10 codes for the presence of overweight/obesity among 19,672 patients in the Central Denmark Region, 2012–2015, based on BMI measurements 1 year before/after the diagnosis date |
The PPV was higher among men: 93.6% (95% CI: 92.9–94.3) than women: 85.9% (95% CI: 85.3–86.4), and the PPV increased with increasing patient age: it was 75.3% (95% CI: 73.8–76.9) in those aged 18–29 years versus 94.7 (95% CI: 92.6–96.9) in patients aged 80 years and above (Table 2). The PPV was higher for primary diagnosis codes: 94.1% (95% CI: 93.3–94.8) than secondary diagnosis codes: 86.1% (95% CI: 85.6–86.6).
Diagnosis subtype
The PPV for the presence of any overweight/obesity generally increased with increasing obesity category, up to a PPV of 97.6% (95% CI: 96.3–99.0) for patients coded with an E660F: morbid obesity diagnosis code. We found the highest proportion of missing BMIs among patient with a code for E660H: super obesity: 18.1% (Table 2).
Admission type
For acutely admitted patients, the PPV was 89.6 (95% CI: 88.2–91.0). For patients with an elective admission, the PPV was 94.0 (95% CI: 93.0–94.9), and for patients with a hospital outpatient clinic contact, the PPV was 86.4 (95% CI: 85.8–86.9).
Completeness of coding
In total, 234,878 patients had a BMI ≥25 kg/m2 registered in the CDRCIS, but only 25,619 had an overweight/obesity diagnosis codes registered during 2011–2016. Thus, completeness of diagnostic coding was only 10.9% (95% CI: 10.8–11.0), implying that 89.1% of patients with a hospital documented BMI≥25 kg/m2 were not given an overweight/obesity diagnosis code. These patients may be described as false negative overweight/obese when assessed through ICD-10 diagnoses only (Table 4). Diagnosis completeness improved with calendar time, and was clearly lower among men (5.5%) than women (16.5%), corresponding to an aOR in men of 0.30 (95% CI; 0.29–0.31). Completeness was highest among adults aged 30–39 years at 17.8% (aOR=1.21 (95% CI; 1.16–1.27) versus adults aged 20–29 years), and then decreased with increasing age, ie, diagnosis completeness at 80+ years 3.3% (aOR=0.20 (95% CI; 0.18–0.22)).
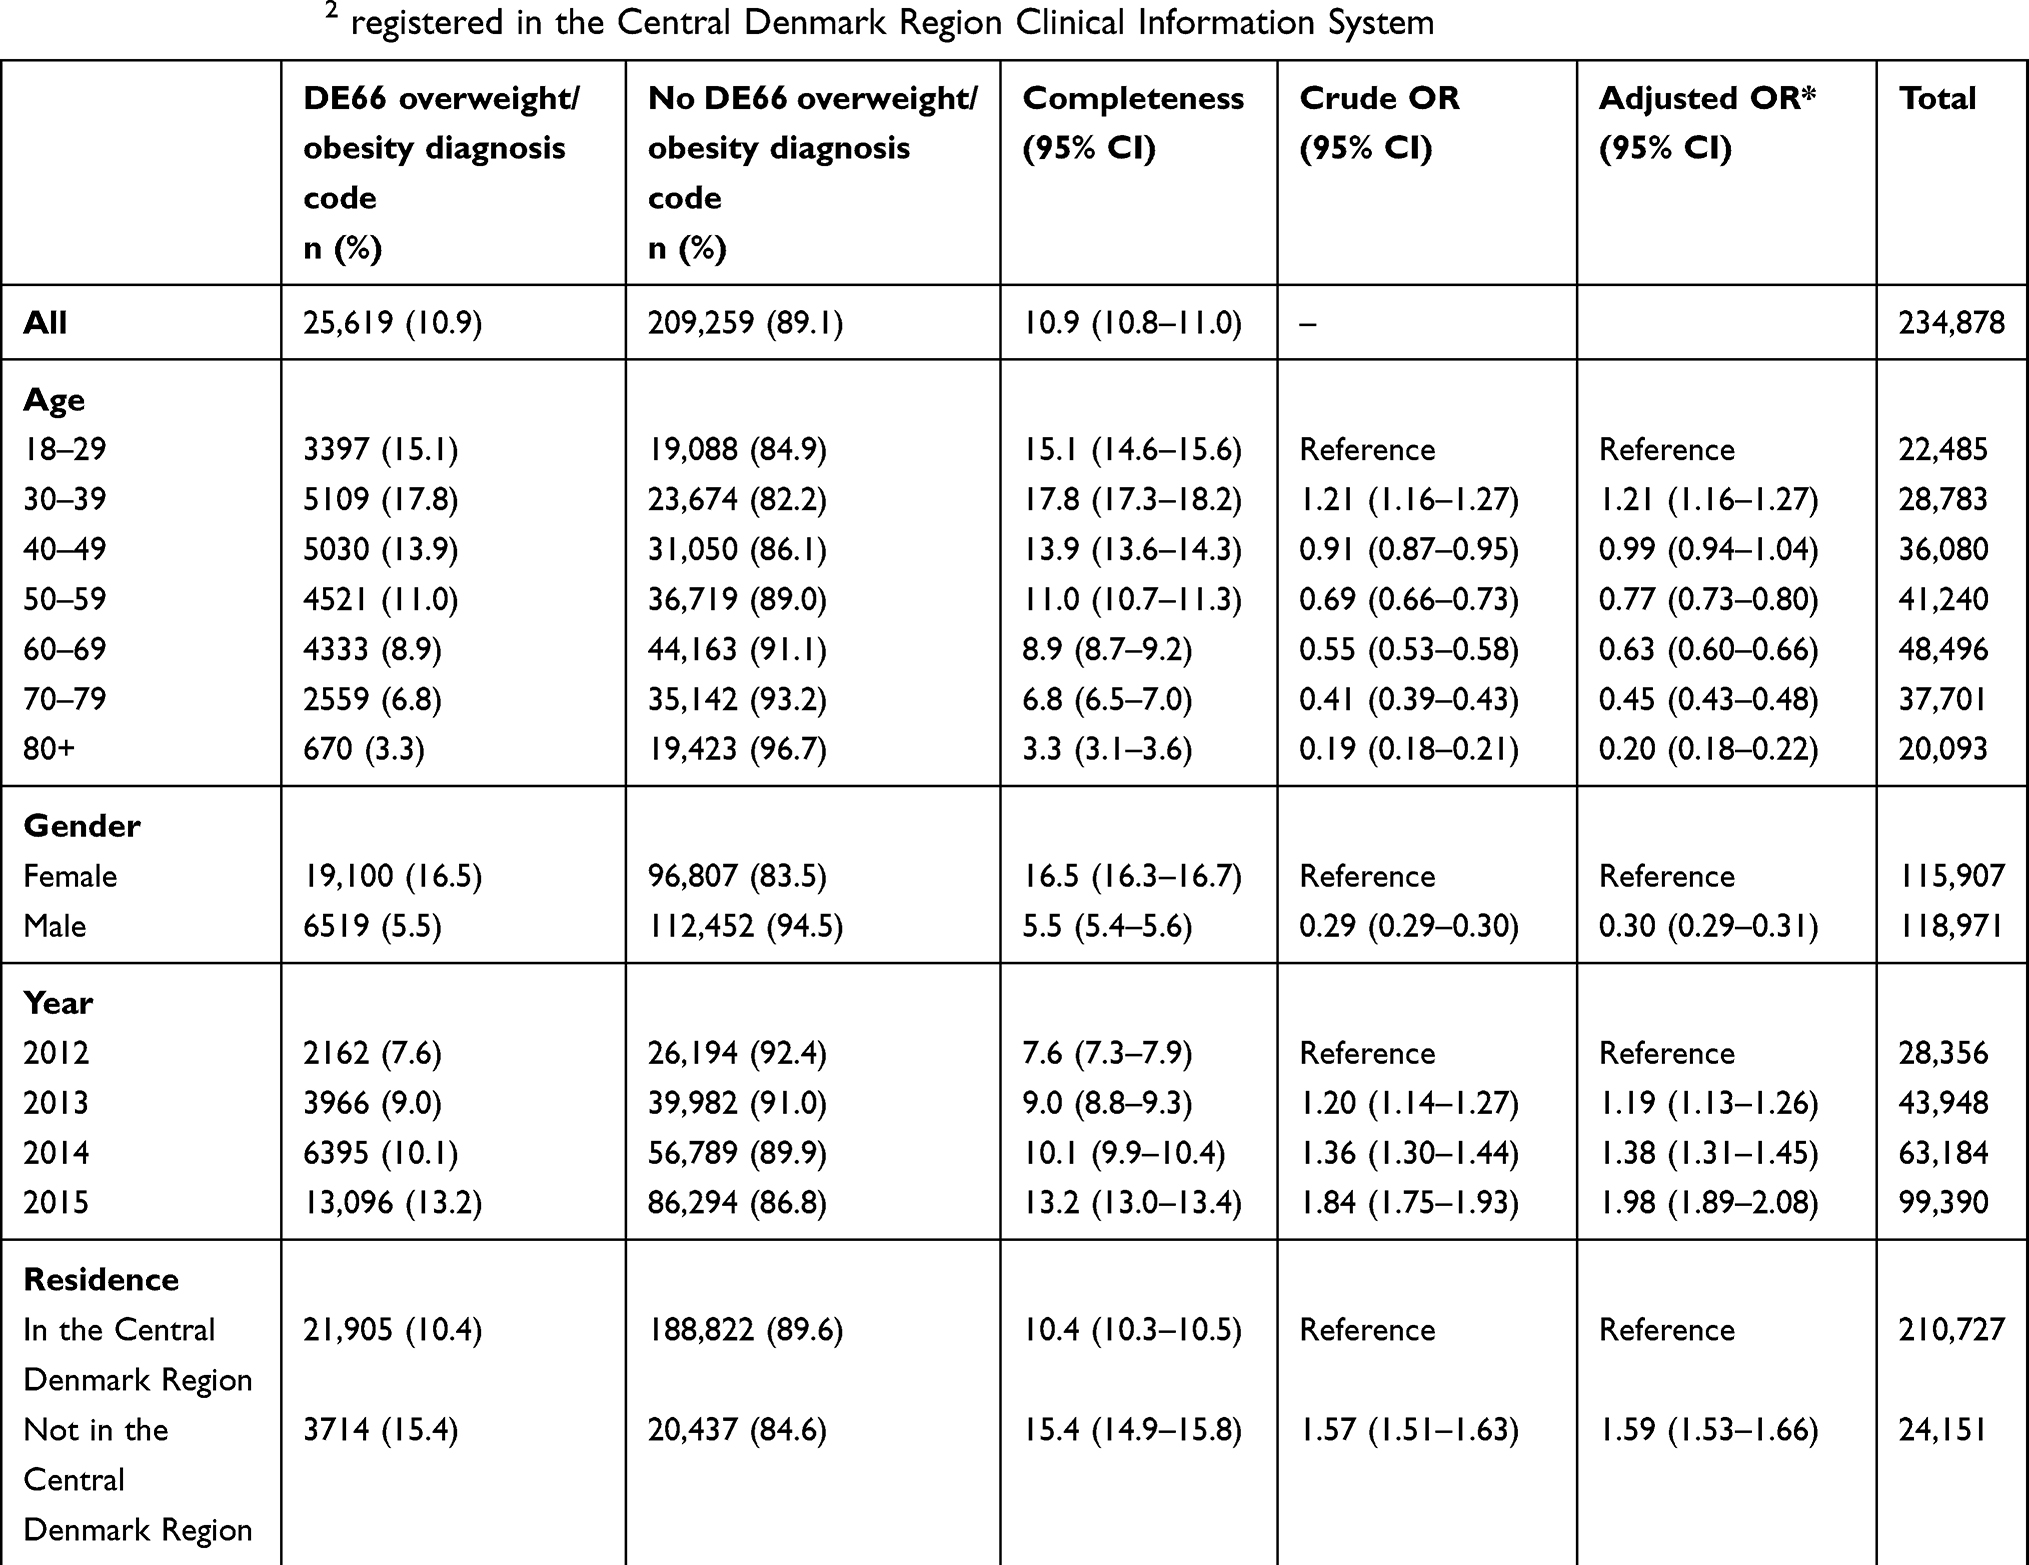 |
Table 4 Completeness of obesity/overweight diagnosis coding in the Danish National Patient Registry, 2012–2015, among patients with a BMI ≥25 kg/m2 registered in the Central Denmark Region Clinical Information System |
Discussion
To our knowledge, this is the first general hospital-based study validating hospital diagnosis codes for overweight and obesity in the ICD-10 system. We took advantage of a computerized clinical information system and found a high overall PPV indicating high validity of ICD-10 codes for overweight or obesity when compared to medical records of clinical weight/height or BMI measurements. This applied both to primary and secondary diagnosis codes of overweight/obesity. False positive diagnoses usually related to total absence of any available BMI records in the information system; when BMI values were available, they were almost always of correct value, ie, ≥25 kg/m2. On the other hand, completeness of ICD-10 diagnosis coding was low among patients with hospital documented BMI ≥25 kg/m2.
Our findings suggest that the use of overweight/obesity diagnosis codes in hospital diagnosis registries has a great potential in future epidemiological studies, when several considerations are taken into account. Due to the uniform structure of the Danish health care system, our results can be assumed generalizable within Denmark, as we examined hospitals including the whole Central Denmark Region.
Our findings of a high validity of overweight/obesity diagnosis codes corroborate previous results of Wolk et al and Nicholson et al.3,23 Barriers may be present among health care professionals, leading to avoidance of measuring BMI in some patients and underreporting of obesity.29 Although large weight changes may sometimes occur within months, eg, associated with severe illness, bariatric surgery, or strict diet, most people take years to obtain substantial changes in their body weight.30 In accordance, we found a high validity of overweight/obesity diagnoses, even when the assessment period for BMI values was extended to several years before and after the diagnosis.
Our results of a clearly higher PPV among men than women correspond to the findings of Wolk et al.3 Possibly, high body weight is a taboo to a higher degree among women than men.31 We speculate that health care professionals might have a lower propensity of weighing their female versus male patients and document their BMI, either due to their own or patient barriers; however, we have not been able to identify any studies on this topic. On the other hand, both Nicholson et al23 and we found that both the overall frequency of BMI measurements, and the related completeness of overweight/obesity diagnosis coding in those with increased BMI, was much higher among women than men. This may be related to the Danish pregnancy care program, by which it is mandatory to measure women's BMI during their pregnancy and report their habitual weight before pregnancy.32 Finally, in the DNPR, three of four contacts are registered for women, thus the gender difference in the amount of overweight/obesity diagnosis codes in our study may reflect the overall contact pattern regarding gender differences.
Among patients with super obesity ICD-10 diagnostic categories corresponding to BMI ≥55 kg/m2, we found decreasing PPVs due to missing BMI measurements in the CDRCIS. We suspect this may be due to everyday practical problems, as some hospital scales have a maximum weight which unable patients within the super-obese category to use them. In contrast, among patients with a BMI between 45.0 and 49.9 kg/m2, completeness was high, which to some extent may be explained by the fact that patients within this BMI range may be candidates for bariatric surgery, augmenting focus on exact BMI measurements.33
The PPV was also slightly higher for patients who were admitted acutely than those who were seen in hospital outpatient clinics. In the outpatient clinic, patients may have been followed for several years. If patients had their BMI measured early in their outpatient course, ie, before our data catchment period started in 2011, we did not have their BMI records available in the CDRCIS, whereas diagnosis codes of overweight/obesity may have been transferred to new contacts in the outpatient course after 2011.
In contrast to their rather high validity, we found large underreporting of overweight/obesity diagnoses, with only one of ten patients with BMI ≥25 kg/m2 actually receiving this diagnosis code. Obesity per se is rarely a primary cause of hospital admission, although it may be an important contributing factor to many acute admissions, eg, with cardiovascular events, gastrointestinal diseases, infections, etc.22 This likely explains much of the underreporting, as doctors are usually focused on principle (first-listed) diagnoses, ie, on the primary cause of admission when registering codes. Secondary listed diagnosis codes usually do not play a major role in government reimbursement of hospitals. Furthermore, BMI measurement is often performed by a nurse on the admission day, while diagnosis coding in Denmark is done by a doctor at the time of discharge, disconnecting in time the two registrations. In US primary care, Baer et al reported an overall completeness of any BMI registration of 66% in the Electronic Health Record,24 clearly higher than in our hospital-based setting. Patients are likely to consult their general practitioner with different issues than hospital specialist physicians, including more lifestyle issues. Baer et al also examined the completeness of overweight and obesity diagnostic coding among those with BMI ≥25 kg/m2 and found values of 17–30% in primary care, higher than our estimate of 10%. As in our study, female gender and younger age predicted higher completeness. Future epidemiological studies drawing on patients with ICD-10 overweight/obesity codes should take into account that included patients may be more likely to be young and female, as compared with the typical hospitalized patients with obesity.
A number of limitations have to be considered when interpreting our study results. Over 4 years, approximately one-third of Central Denmark’s population (1.32 million) experienced any hospital contact, and one of six got a BMI measurement recorded in the hospital system. Overall, our results suggest that 3% (19,672/755,656) of all patients with hospital contact in the Central Denmark Region received an overweight/obesity diagnosis, while 60% (234,878/392,114) of those with any measured BMI at hospitals had a BMI-value ≥25 kg/m2.
Though more than half of all persons with hospital contact (52%, 392,114/755,656) had their BMI registered in the CDRCIS, the true prevalence of overweight or obesity in Danish hospitals is unknown, as we do not have BMI values available on all hospitalized patients. A recent Danish general population survey found that 47.4% had BMI ≥25 kg/m2, including 14.1% with BMI ≥30 kg/m2.34 Thus, the proportion of patients with BMI ≥25 kg/m2 in the CDRCIS is similar to that of the general population, which makes it plausible to extrapolate the data to other Danish hospitals. In comparison, Sogaard et al reported that only 0.8% of all hospitalized patients in Denmark received an overweight/obesity diagnosis in the period 1999–2012.21 Thus, we experience an increasing use of overweight/obesity diagnosis codes over time.
We drew on electronic data from the CDRCIS, and did not retrieve any possible handwritten/manually available BMI measurements/charts that may not have been correctly computerized and reported in the CDRCIS, possibly underestimating the true PPV of the diagnoses. Furthermore, some patients may have had their BMI measured outside the hospital prior to admission, eg, at their general practitioner, and a hospital diagnosis of overweight/obesity may have been given based on such primary care BMI data, which we could not identify. Finally, we do not know to which extent our study findings are representative for other hospital systems outside Denmark, where both prevalence of overweight and obesity and diagnostic and coding strategies may be different.
Conclusion
This large hospital-based study provides evidence for a high validity of the ICD-10 code E66 for overweight or obesity, when compared with actual clinical weight and height measurements in computerized medical records in Denmark. Although the completeness of overweight/obesity coding among people with documented BMI ≥25 kg/m2 in hospitals is low, discharge codes for overweight/obesity may be a suitable data source for epidemiological research.
Acknowledgment
The authors would like to thank Professor Henrik Toft Sørensen for sharing his expertise, guidance, and encouragement. The study was supported by the Independent Research Council, Denmark, the Novo Nordisk Foundation, and the department of Clinical Epidemiology, Aarhus University, Denmark. The funding sources had no role in the design, conduct, analysis, or reporting of the study.
Data availability
Data are available as presented in the paper. According to Danish legislation, our own approvals to use the Danish data sources for the current study do not allow us to distribute or make patient data directly available to other parties. Interested researchers may apply for data access through the Research Service at the Danish Health Data Authority (e-mail: kd.atadsdehdnus@ecivresreksrof; phone: +45 3268 5116). Up-to-date information on data access is available online (http://sundhedsdatastyrelsen.dk/da/forskerservice). Access to data from the Danish Health Data Authority requires approval from the Danish Data Protection Agency (https://www.datatilsynet.dk/english/the-danish-data-protection-agency/introduction-to-the-danish-data-protection-agency/). The authors do not have special access privileges to these data.
Disclosure
The authors report no conflicts of interest in this work.
References
1. Bellou V, Belbasis L, Tzoulaki I, Evangelou E. Risk factors for type 2 diabetes mellitus: an exposure-wide umbrella review of meta-analyses. PLoS One. 2018;13(3):e0194127. doi:10.1371/journal.pone.0194127
2. Wilson PW, D’Agostino RB, Sullivan L, Parise H, Kannel WB. Overweight and obesity as determinants of cardiovascular risk: the Framingham experience. Arch Intern Med. 2002;162(16):1867–1872. doi:10.1001/archinte.162.16.1867
3. Wolk A, Gridley G, Svensson M, et al. A prospective study of obesity and cancer risk (Sweden). Cancer Causes Control. 2001;12(1):13–21. doi:10.1023/A:1008995217664
4. Moller H, Mellemgaard A, Lindvig K, Olsen JH. Obesity and cancer risk: a Danish record-linkage study. Eur J Cancer. 1994;30A(3):344–350. doi:10.1016/0959-8049(94)90254-2
5. Aune D, Sen A, Prasad M, et al. BMI and all cause mortality: systematic review and non-linear dose-response meta-analysis of 230 cohort studies with 3.74 million deaths among 30.3 million participants. Br Med J (Clin Res Ed). 2016;353:i2156.
6. Berrington de Gonzalez A, Hartge P, Cerhan JR, et al. Body-mass index and mortality among 1.46 million white adults. N Engl J Med. 2010;363(23):2211–2219. doi:10.1056/NEJMoa1000367
7. Flegal KM, Kit BK, Orpana H, Graubard BI. Association of all-cause mortality with overweight and obesity using standard body mass index categories: a systematic review and meta-analysis. Jama. 2013;309(1):71–82. doi:10.1001/jama.2012.113905
8. Collaboration NCDRF. Trends in adult body-mass index in 200 countries from 1975 to 2014: a pooled analysis of 1698 population-based measurement studies with 19.2 million participants. Lancet (London, England). 2016;387(10026):1377–1396. doi:10.1016/S0140-6736(16)30054-X.
9. Whitlock G, Lewington S, Sherliker P, et al. Body-mass index and cause-specific mortality in 900 000 adults: collaborative analyses of 57 prospective studies. Lancet. 2009;373(9669):1083–1096. doi:10.1016/S0140-6736(09)60318-4
10. Kalantar-Zadeh K, Block G, Humphreys MH, Kopple JD. Reverse epidemiology of cardiovascular risk factors in maintenance dialysis patients. Kidney Int. 2003;63(3):793–808. doi:10.1046/j.1523-1755.2003.00803.x
11. Flanders WD, Eldridge RC, McClellan W. A nearly unavoidable mechanism for collider bias with index-event studies. Epidemiology (Cambridge, Mass). 2014;25(5):762–764. doi:10.1097/EDE.0000000000000131
12. Moscarella E, Spitaleri G, Brugaletta S, et al. Impact of body mass index on 5-year clinical outcomes in patients with ST-segment elevation myocardial infarction after everolimus-eluting or bare-metal stent implantation. Am J Cardiol. 2017. doi:10.1016/j.amjcard.2017.07.040.
13. Rios-Diaz AJ, Lin E, Williams K, et al. The obesity paradox in patients with severe soft tissue infections. Am J Surg. 2017;214(3):385–389. doi:10.1016/j.amjsurg.2016.05.006
14. Vucenik I, Stains JP. Obesity and cancer risk: evidence, mechanisms, and recommendations. Ann N Y Acad Sci. 2012;1271:37–43. doi:10.1111/j.1749-6632.2012.06750.x
15. Wang J, Yang DL, Chen ZZ, Gou BF. Associations of body mass index with cancer incidence among populations, genders, and menopausal status: A systematic review and meta-analysis. Cancer Epidemiol. 2016;42:1–8. doi:10.1016/j.canep.2016.02.010
16. Lauby-Secretan B, Scoccianti C, Loomis D, et al. Body fatness and cancer–viewpoint of the IARC working group. N Engl J Med. 2016;375(8):794–798. doi:10.1056/NEJMsr1606602
17. Janszky I, Romundstad P, Laugsand LE, Vatten LJ, Mukamal KJ, Morkedal B. Weight and weight change and risk of acute myocardial infarction and heart failure - the HUNT study. J Intern Med. 2016;280(3):312–322. doi:10.1111/joim.12494
18. Barba R, Marco J, Ruiz J, et al. The obesity paradox in stroke: impact on mortality and short-term readmission. J Stroke Cerebrovasc Dis. 2015;24(4):766–770. doi:10.1016/j.jstrokecerebrovasdis.2014.11.002
19. Sakr Y, Alhussami I, Nanchal R, et al. Being overweight is associated with greater survival in ICU patients: results from the intensive care over nations audit. Crit Care Med. 2015;43(12):2623–2632. doi:10.1097/CCM.0000000000001310
20. Sharma A, Lavie CJ, Borer JS, et al. Meta-analysis of the relation of body mass index to all-cause and cardiovascular mortality and hospitalization in patients with chronic heart failure. Am J Cardiol. 2015;115(10):1428–1434. doi:10.1016/j.amjcard.2015.02.024
21. Sogaard M, Heide-Jorgensen U, Norgaard M, Johnsen SP, Thomsen RW. Evidence for the low recording of weight status and lifestyle risk factors in the Danish National Registry of Patients, 1999–2012. BMC Public Health. 2015;15:1320. doi:10.1186/s12889-015-2670-9
22. Gribsholt SB, Pedersen L, Richelsen B, Dekkers O, Thomsen RW. Body mass index of 92,027 patients acutely admitted to general hospitals in Denmark: associated clinical characteristics and 30-day mortality. PLoS One. 2018;13(4):e0195853. doi:10.1371/journal.pone.0195853
23. Nicholson BD, Aveyard P, Hamilton W, et al. The internal validation of weight and weight change coding using weight measurement data within the UK primary care electronic health record. Clin Epidemiol. 2019;11:145–155. doi:10.2147/CLEP.S189989
24. Baer HJ, Karson AS, Soukup JR, Williams DH, Bates DW. Documentation and diagnosis of overweight and obesity in electronic health records of adult primary care patients. JAMA Intern Med. 2013;173(17):1648–1652. doi:10.1001/jamainternmed.2013.7815
25. Schmidt M, Schmidt SA, Sandegaard JL, Ehrenstein V, Pedersen L, Sorensen HT. The Danish National Patient Registry: a review of content, data quality, and research potential. Clin Epidemiol. 2015;7:449–490. doi:10.2147/CLEP.S91125
26. Schmidt M, Schmidt SAJ, Adelborg K, et al. The Danish health care system and epidemiological research: from health care contacts to database records. Clin Epidemiol. 2019;11:563–591. doi:10.2147/CLEP.S179083
27. Sorensen HT, Sabroe S, Olsen J. A framework for evaluation of secondary data sources for epidemiological research. Int J Epidemiol. 1996;25(2):435–442. doi:10.1093/ije/25.2.435
28. Brown LD, DasGupta A. Interval estimation for a binomial proportion. Stat Sci. 2001;16(2):101–117. doi:10.1214/ss/1009213286
29. Christenson A, Johansson E, Reynisdottir S, Torgerson J, Hemmingsson E. Shame and avoidance as barriers in midwives’ communication about body weight with pregnant women: A qualitative interview study. Midwifery. 2018;63:1–7.
30. Cordina-Duverger E, Truong T, Anger A, et al. Weight and weight changes throughout life and postmenopausal breast cancer risk: a case-control study in France. BMC Cancer. 2016;16(1):761.
31. Vijayalakshmi P, Thimmaiah R, Nikhil Reddy SS, Gandhi S, BadaMath S. Gender differences in body mass index, body weight perception, weight satisfaction, disordered eating and weight control strategies among indian medical and nursing undergraduates. Investigacion Y Educacion En Enfermeria. 2017;35(3):276–368.
32. The Danish Health and Medicines Authorities. Anbefalinger for svangreomsorgen København; 2013. [
33. The Danish Health and Medicines Authorities. National klinisk retningslinje for fedmekirurgi København; 2017. Available from: https://www.sst.dk/da/udgivelser/2017/nkr-fedmekirurgi.
34. The Danish Health and Medicines Authoritis, National Institute of Public Health. Danskernes Sundhed. Tal Fra Den Nationale Sundhedsprofil. Available from: http://www.danskernessundhed.dk/. Accessed August 08, 2019.
 © 2019 The Author(s). This work is published and licensed by Dove Medical Press Limited. The full terms of this license are available at https://www.dovepress.com/terms.php and incorporate the Creative Commons Attribution - Non Commercial (unported, v3.0) License.
By accessing the work you hereby accept the Terms. Non-commercial uses of the work are permitted without any further permission from Dove Medical Press Limited, provided the work is properly attributed. For permission for commercial use of this work, please see paragraphs 4.2 and 5 of our Terms.
© 2019 The Author(s). This work is published and licensed by Dove Medical Press Limited. The full terms of this license are available at https://www.dovepress.com/terms.php and incorporate the Creative Commons Attribution - Non Commercial (unported, v3.0) License.
By accessing the work you hereby accept the Terms. Non-commercial uses of the work are permitted without any further permission from Dove Medical Press Limited, provided the work is properly attributed. For permission for commercial use of this work, please see paragraphs 4.2 and 5 of our Terms.