")
Back to Journals » Journal of Pain Research » Volume 9
Validation of the Hanyang Pain Scale for clerical workers with musculoskeletal pain
Authors Oh KY
Received 18 December 2015
Accepted for publication 9 February 2016
Published 8 April 2016 Volume 2016:9 Pages 207—213
DOI https://doi.org/10.2147/JPR.S102778
Checked for plagiarism Yes
Review by Single anonymous peer review
Peer reviewer comments 3
Editor who approved publication: Dr Michael Schatman
Ki Young Oh
Department of Physical Medicine and Rehabilitation, Soonchunhyang University Cheonan Hospital, Cheonan, Republic of Korea
Purpose: The visual analog scale (VAS) is the most widely used scale for pain assessment. However, its reflection of time-, sleep-, work-, psychological-, and reward-related pain characteristics is limited. Therefore, this study aimed to develop a new pain scale, the Hanyang Pain Scale (HPS), evaluate its reliability, and assess its agreement with currently used scales.
Subjects and methods: The HPS comprises a 10 cm long visual vertical bar, similar to the VAS, with eleven simple evaluation sentences related to pain frequency, work, and sleep. We selected 1,037 clerical workers as study subjects and conducted medical examinations through interviews, physical examinations, and musculoskeletal pain assessments tools including the VAS, HPS, and McGill pain questionnaire (MPQ). The reliability of the HPS and its agreement with VAS and MPQ were statistically analyzed.
Results: HPS test–retest reliability was very high (Pearson correlation coefficient =0.902). In particular, HPS test–retest reliability in the weak pain group (<4 points for both VAS and HPS) was greater (Pearson correlation coefficient =0.863) than that of VAS (0.721). Therefore, the HPS showed consistent pain assessment results in cases of relatively weak pain. Correlation was high between HPS and VAS scores (Spearman’s ρ =0.526) and satisfactory between HPS and MPQ scores (Spearman’s ρ =0.367).
Conclusion: The newly developed HPS has high reliability and strong agreement with other currently widely used scales. In particular, HPS was more consistent than the VAS for relatively weak pain. Based on these findings, the HPS can be considered a useful pain assessment tool for clerical workers. Further clinical research on musculoskeletal diseases and on workers in other fields is required.
Keywords: clerical workers, Hanyang Pain Scale, pain assessment, pain scale
Introduction
The definition of pain varies according to individual scholars; however, it is generally defined as a symptom produced via a combination of pain and feelings rather than simply pain due to noxious stimuli. According to the International Association for the Study of Pain, the most widely accepted definition of pain globally is “an unpleasant sensory and emotional experience associated with actual or potential tissue damage, or described in terms of such damage”.1 This definition conveys the fact that pain is complex and subjective.
Keele2 was the first researcher to use a pain scale; it comprised a simple descriptive scale consisting of four levels. The descriptive scale divided questionnaires into several categories of continuity, and subjects selected statements that best described their situation. In pain scales, differences between categories should be distinguished, and subjects should generally be evaluated based on 3–5 descriptive categories. Huskisson3 later introduced the visual analog scale (VAS) comprising two straight lines: a 10 cm long straight line with “no pain at all” at one end and “pain as bad as it could be” at the other end, with different pain levels in between these, and with no labeling. In other studies, pain has been measured using a verbal rating scale (VRS), the results of which have been shown to significantly correlate with the VAS.4,5 Ohnhaus and Adler6 found that the five-scale VRS measured analgesic effects more sensitively in a completely controlled condition than the VAS. In contrast, Joyce et al7 reported that when the VAS was employed alongside a 100-point numeric assessment scale, it was able to measure analgesic effects with slightly higher sensitivity than the four-scale VRS. Furthermore, Scott and Huskisson8 discovered that the VAS could assess the effects of arthritis pain treatment with greater sensitivity than the VRS.
Based on the outcomes of previous studies, the VAS is generally considered to assess pain more accurately than the VRS. However, Kremer et al9 conducted a survey on patients with chronic pain using the VAS and VRS simultaneously and found that 11% of patients answered “no pain” for the VAS compared with 0% for the VRS. Furthermore, patients revealed that they preferred the VRS to the VAS. Based on these results, while the VRS may obtain answers with lower accuracy than the VAS, it can increase the patient response rate because it is easier to understand and simpler to use. These features are preferable for large-scale clinical research or epidemiological studies. Marianne et al10 reviewed the literature to investigate the utilization and performance of unidimensional pain scales, with specific emphasis on the numerical rating scale (NRS). These authors recommended NRS based on its higher compliance rates, improved responsiveness, ease of use, and improved applicability relative to the VAS/VRS.10
However, these simple scales measure pain based on the concept that pain can be assessed based on its intensity alone. They are therefore limited in assessing sensory and emotional factors that can indicate causes of pain. Melzack11 developed a multifaceted rating scale known as the McGill pain questionnaire (MPQ), in which information on pain intensity can be provided quantitatively by reflecting the quality of the pain experience. It also provides objective and detailed information for sensory and emotional evaluation and for assessing the effectiveness of different pain treatments. Numerous experiments and clinical studies have supported the application of the MPQ as a tool for measuring quality and intensity of pain in various therapy areas.12 Although the assessment of pain through multifaceted concepts has been accepted, no consensus has been reached regarding the accurate assessment of pain measurement tools. The level or description of pain perception can vary according to language, geographical area, living environment, and social and cultural background. Therefore, a multidimensional pain scale written in Korean has been developed,13 and follow-up studies using the scale have been published.14,15 However, according to systematic literature reviews conducted by Litcher-Kelly et al,16 the VAS is still the most widely utilized tool for the assessment of chronic musculoskeletal pain. This is because the utilization of multidimensional assessment tools requires a considerable amount of time, making it difficult to assess patient pain, and researchers have been predominately interested in pain intensity for the evaluation of pain relief methods. In this regard, it may be necessary to adopt an easy-to-use pain assessment tool for clinical practice.
For workers in industrial fields, pain is frequently assessed to provide welfare benefits such as in health examinations. From the author’s experiences in the health examination field, most workers do not report their pain state based on their current pain condition; instead, this is based on their severest pain memory, so as to receive welfare benefit. Under such circumstances, the current VAS is limited in its ability to reflect current pain state. Therefore, a new pain assessment scale is required.
Not all workers are admitted to hospital even if they experience pain, and many workers who experience pain in daily living still work. However, if their pain worsens and cannot be endured, they will require treatment. In this respect, usual pain may not be assessed accurately with the currently used simple scales. For example, some workers may not feel pain every day and may only feel pain after excessive levels of work, or may feel pain immediately after starting work. Although the VAS has been widely employed, and its validity and reliability verified, these temporal factors, work-related characteristics, and factors related to rest or sleeping may not have been taken into consideration by this scale.
Therefore, the current study aimed to develop a new and simple pain assessment scale, the Hanyang Pain Scale (HPS), to reflect time-, work-, and sleep-related pain characteristics for clerical workers who work in environments where musculoskeletal pain is prevalent, and to evaluate its reliability and agreement with other existing scales.
Materials and methods
Study subjects
Musculoskeletal pain was assessed in 1,037 clerical workers through medical examinations and surveys conducted by Six physiatrists over 13 months. Thirty-four subjects were randomly selected as test–retest samples for a reliability analysis (Figure 1).
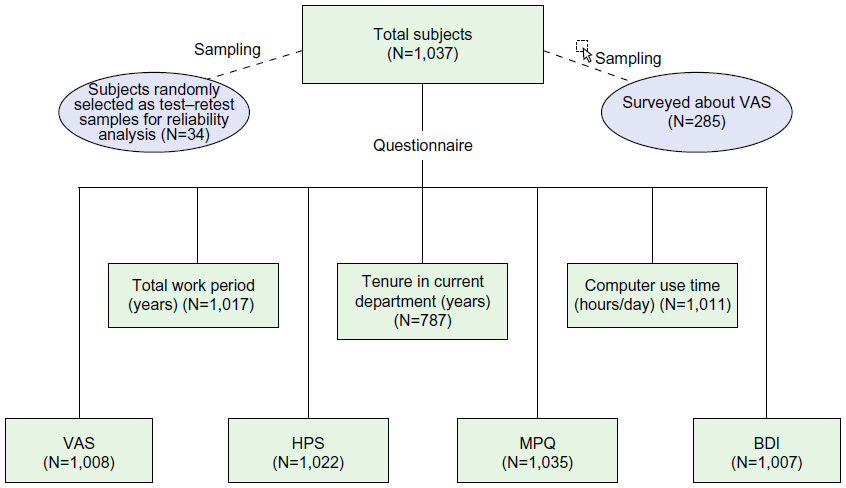 | Figure 1 Number of subjects included for each questionnaire query, surveyed about VAS, and selected for reliability analysis. |
Study methodology
The HPS used in this study is a graphics-based rating scale, similar to the VAS. It comprises a 10 cm long visual vertical bar and eleven simple statements. These statements contain content related to pain frequency, work, and sleep in order to assess the pain felt by each subject (Figure 2). The 1,307 clerical workers were subjected to group medical checkup by interview, physical examination, HPS, VAS, MPQ, Beck Depression Inventory (BDI), and surveys associated with work-related factors. For 34 subjects, the reliability of the HPS was analyzed using a test–retest with 4-week intervals; subjects with low pain scores (<4 points for both VAS and HPS) were analyzed separately. The assessment of agreement between the HPS and other scales utilized a concept of discriminant convergent validity among construct validity. This was determined through correlation analysis with other scales such as VAS and MPQ, whose validity and reliability were already established. Approval was granted by the Hanyang University Hospital Institutional Review Board, and written informed consent was obtained from each subject. Subjects were identified only by number, not by name or initials.
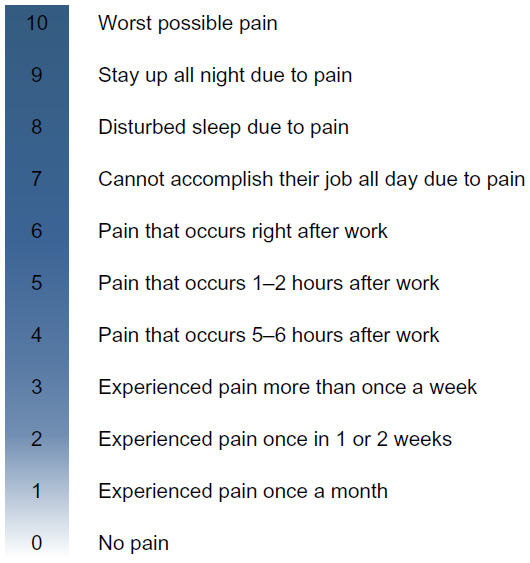 | Figure 2 The Hanyang Pain Scale. |
Statistical analysis
Spearman’s ρ was calculated to assess the correlation of variables, and intraclass correlation coefficients were obtained with 95% confidence intervals (CIs). In addition, the Spearman–Brown coefficient, representing split-half reliability, in order to evaluate agreement with similar items in equivalent tests or the same examination, was calculated. To obtain test–retest reliability of the VAS and HPS, a correlation analysis was conducted using Pearson correlation coefficients. All data were analyzed using Statistical Package for Social Sciences (v.15.0 for Windows; SPSS Inc., Chicago, IL, USA).
Results
General subject characteristics
General subject characteristics are described in Table 1.
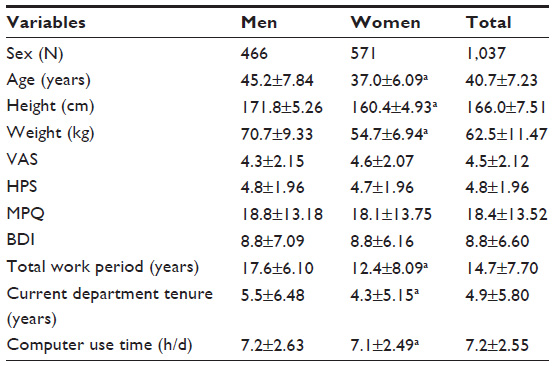 | Table 1 General subject characteristics |
Agreement of the HPS with other scales
There was a positive correlation between the HPS and VAS (Spearman’s ρ =0.526; P=0.000; Figure 3). The intraclass correlation coefficient, used to evaluate the agreement of numerical data (continuous variables), was 0.706 (95% CI: 0.667–0.740), indicating a strong agreement. Spearman–Brown coefficient representing split-half reliability was used to evaluate the agreement. The obtained value was 0.708; this also demonstrated strong agreement between the two scales. The high reliability and validity of the VAS have been demonstrated in many previous studies; therefore, based on the convergent validity concept, the HPS can also be regarded as a valid test. Spearman’s ρ was 0.367 (P=0.000), indicating a positive correlation between the HPS and MPQ (Figure 4). In general, this correlation appeared to be low; however, there was also a positive correlation between the VAS and MPQ (Spearman’s ρ =0.346; P=0.000), indicating a meaningful correlation, consistent with other studies. Since the reliability and validity of the MPQ have also been demonstrated in numerous previous studies, based on the correlations between the HPS and the VAS and MPQ, the HPS developed in this study can be considered a valid test.
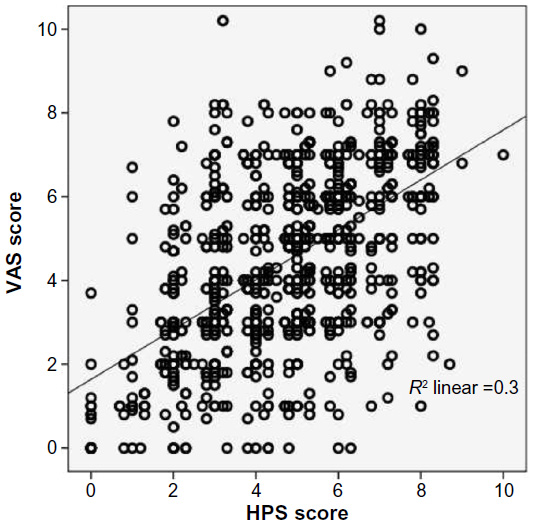 | Figure 3 Correlation between visual analog scale and Hanyang Pain Scale scores. |
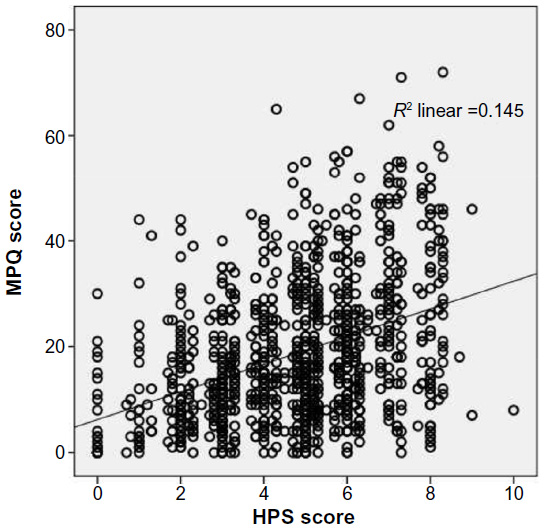 | Figure 4 Correlation between McGill pain questionnaire and Hanyang Pain Scale scores. |
Reliability of the HPS
In the test–retest, the Pearson correlation coefficient score for the VAS and the HPS was 0.917 (P=0.000) and 0.902 (P=0.000), respectively, indicating a strong positive correlation (Figure 5). Therefore, the HPS can be considered as a valid measuring tool with a high test reproducibility, similar to the VAS. The test–retest reliability in the relatively weak pain group (<4 on the VAS and HPS) produced a Pearson correlation coefficient for the VAS of 0.721 (P=0.002); this was slightly lower than the overall result, while for the HPS it was 0.863 (P=0.000), higher than that of the VAS (Figure 6). Therefore, compared with the VAS, the HPS can be regarded as a more reproducible and consistent measuring tool for subjects with relatively weak pain.
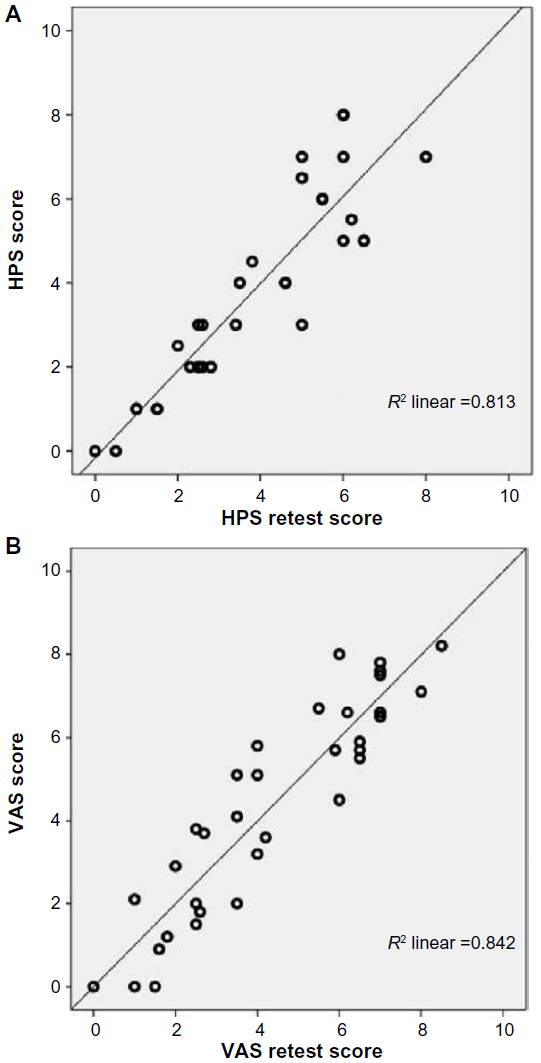 | Figure 5 Correlation between the Hanyang Pain Scale (A) and visual analog scale (B) test and retest. |
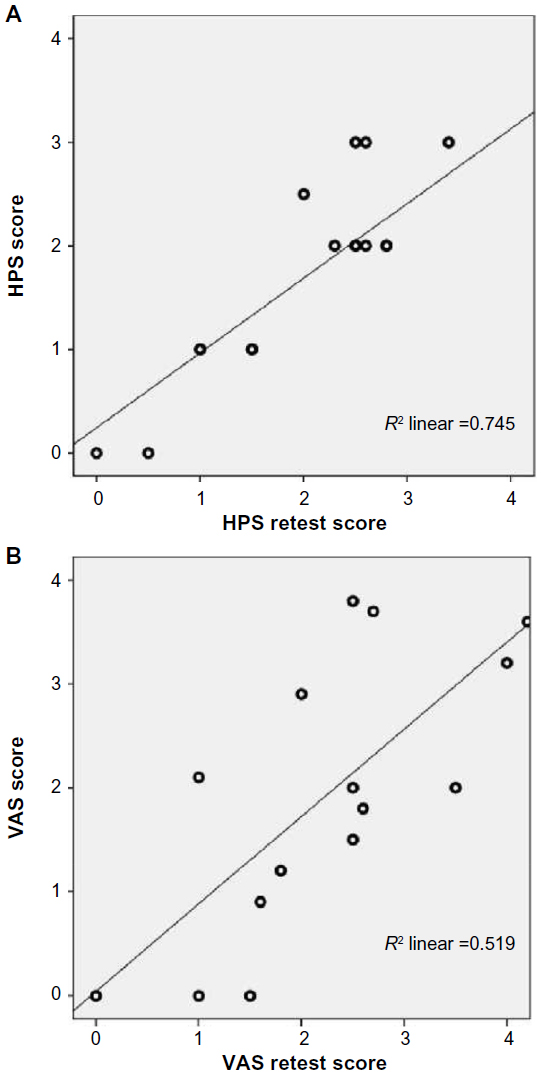 | Figure 6 Correlation between test and retest for the Hanyang Pain Scale (A) and visual analog scale (B) sores below 4. |
Discussion
The VAS is the most used pain assessment tool in medicine. A systematic literature review conducted by Litcher-Kelly et al16 reported that the VAS is not only the most widely applied tool in clinical sectors but also in research fields; 30 out of 50 randomized controlled trials and prospective clinical research studies reported its use. This review also found that there was diversity in VAS questionnaires among the literature, with a variety of scale types being used, such as 100 mm or 10 cm lines, and scales with or without scale anchors. The timing of the reported pain – for example, current pain, pain in the last week, daily pain, hourly pain, pain during rest or activity, pain in the morning or evening or in-between, and pain without specific timing – was also reported to vary among scales. The most appropriate type of scale and timing has not yet been established; however, the most widely utilized scale type shape comprises a 100 mm line without scale anchors, lacking the option to specify pain timings.16 The present study aimed at developing an improved pain assessment scale, while preserving the advantages of the VAS, since the VAS is currently the most useful and widely utilized pain intensity evaluation tool in clinical fields. Therefore, pain frequency, and work- and sleep-related factors were added to a vertical bar equipped with a graphical rating scale, combined with visual and verbal rating scales.
According to Kirshner and Guyatt,17 and Deyo and Dichl,18 pain assessment tools should be practical, comprehensive, reproducible, valid, and responsive. Since the present study did not evaluate changes in pain, such as those associated with treatment effects, responsiveness was not considered. Comprehensiveness and practicality are similar, but they rarely coexist. Comprehensiveness without practicality has no meaning; therefore, practicality is considered the most important in clinical or large-scale studies. Surveys should also include a measuring tool; therefore, a clear definition of measured and operational concepts that can connect the definition with the real phenomenon should be appropriately defined, and questionnaires with high validity and reliability should also be constructed.19
In the present study, in order to determine the reproducibility of the HPS, the test–retest method was utilized. The test–retest reliability refers to a level of time gap between two tests. For example, if a time gap is too long, reliability is underestimated due to changes in measured attribution, while reliability is overestimated when the learning effect of a time gap is too short. Another factor, circumstance, can occur when tests are conducted. For example, health status and patient feeling can be affected by internal condition and environmental factors such as temperature, time, and weather. Therefore, internal condition and environmental factors should remain as constant as possible between tests and retests.
It is reasonable to state that the VAS is responsive. However, although its responsiveness is statistically significant, some studies have suggested that it may not be clinically meaningful. Choi et al20 stated that a clinically significant change in pain in the VAS should be at least 20 mm, because patients are forced to mark “same as before” in the VRS conducted simultaneously if a change was marked within 20 mm in the 100 mm VAS. In addition, a study by Kelly21 also reported that a clinically significant change in pain was 20 mm, while Todd and Funk22 found that pain was “slightly better” if a change was 19 mm or longer, and Wells et al23 reported pain was “slightly better” with a change of at least 15 mm. The aforementioned phenomenon can be clearer in cases of relatively weak pain; therefore, there are questions surrounding the clinical differences between one and two points, and between two and three points in the VAS.
Therefore, the present study aimed at determining the consistency of the test by calculating test–retest reliability in a relatively weak pain group of subjects whose VAS and HPS scores were less than four points. Findings indicated that the HPS showed a higher correlation than the VAS, indicating that the HAS can be a reliable assessment method, even in relatively weak pain subject groups. When a correlation analysis was conducted after removing outliers (for statistical reasons), larger differences were recorded. Therefore, based on this finding, the HPS, with clear criteria such as pain frequency in the relatively weak pain area, can be utilized as a tool with greater reliability and responsiveness than the VAS.
If a correlation between a newly developed test and a well-established test is significantly high, the newly developed test can be applied in clinical fields. Predicting future indexes based on test results or by analyzing relationships with existing criteria to determine the test validity is known as criterion validity. It is also called empirical validity because empirical data obtained are compared with the target test. Since there is no gold standard available for the pain assessment scale in this study, criterion validity, factor analysis, and internal consistency testing could not be applied (due to the simple nature of the questionnaire); therefore, discriminant convergent validity among construct validity testing was employed. The intraclass correlation coefficient or Spearman–Brown coefficient was a concept that was originally applied in reliability testing – a tool used to determine the agreement between two tests. However, the examined equations and derived equations comprised sets of measured values and indexes expressing correlations between values that can be used as a tool to assess the validity of tests. All variables investigated in this study were continuous; therefore, Pearson correlation coefficients could be determined. However, for the assessment of the MPQ and BDI, we employed the Spearman’s ρ as a nonparametric test, because these variables were not normally distributed.
In reality, it is not possible for a pain scale to reflect the multidimensional and complex factors of pain. Since it is difficult to determine a direct and objective method to diagnose pain, we aimed to determine the optimal test method, rather than the best method, for pain assessment. Through the investigation of clerical workers, this study compared the reliability and agreement of the HPS (determined through medical examination and surveys) with other scales, and discussed its applicability. At present, the extent to which these HPS findings can be applied to other work sectors and subject groups cannot be verified. However, in contrast to many other previously developed scales that became obsolete, the HPS can be expected to become a widely utilized tool in clinical and research sectors, alongside future revision and evolution through continuous follow-up studies.
Conclusion
The HPS, a newly developed pain scale, was tested on 1,037 clerical workers. In a correlation analysis, it was found to have a relatively strong agreement with other widely utilized scales such as the VAS and MPQ. In the test–retest analysis, it demonstrated high reliability and, particularly in relatively weak pain groups, showed improved reliability compared with the VAS. It may therefore prove to be a useful tool in the assessment of daily pain for clerical workers. Future research should target workers in other business sectors to develop an improved pain assessment scale that has established reliability and validity for a variety of subject groups.
Acknowledgment
This work was supported by the Soonchunhyang University Research Fund.
Disclosure
The author reports no conflicts of interest in this work.
References
Iasp-pain.org [homepage on the Internet]. Washington, DC. International Association for the Study of Pain; [Last Updated: May 22, 2012]. Available from: http://www.iasp-pain.org/Taxonomy/. Accessed October 6, 2015. | |
Keele KD. The pain chart. Lancet. 1984;2(6514):6–8. | |
Huskisson EC. Measurement of pain. Lancet. 1974;2(7889):1127–1131. | |
Jensen MP, Karoly P, Braver S. The measurement of clinical pain intensity: a comparison of six methods. Pain. 1968;27(1):117–126. | |
DeLoach LJ, Higgins MS, Caplan AB, Stiff JL. The visual analog scale in the immediate post-operative period: intrasubject variability and correlation with a numeric scale. Anesth Analg. 1998;86(1):102–106. | |
Ohnhaus EE, Adler R. Methodological problems in the measurement of pain: a comparison between the verbal rating scale and the visual analogue scale. Pain. 1975;1(4):379–384. | |
Joyce CR, Zutshi DW, Hrubes V, Mason RM. Comparison of fixed interval analogue scales for rating chronic pain. Eur J Clin Pharmacol. 1975;8(6):415–420. | |
Scott J, Huskisson EC. Graphic representation of pain. Pain. 1976;2(2):175–184. | |
Kremer E, Atkinson FH, Ignelzi RJ. Measurement of pain. Patient preference does not confound pain measurement. Pain. 1981;10(2):241–248. | |
Marianne JH, Peter MF, Dagny F, et al. Studies comparing numerical rating scales, verbal rating scales, and visual analogue scales for assessment of pain intensity in adults: a systematic literature review. J Pain Symptom Manage. 2011;41(6):1073–1093. | |
Melzack R. The McGill pain questionnaire: major properties and scoring methods. Pain. 1975;1(3):277–299. | |
Lee EO, Lee SH. Validity survey of pain scale on Korean language in normal adult. J Korean Acad Nurs.1986;16(2):13–28. | |
Lee EO, Yoon SN, Song MS. Development of pain rating scale using pain word. J Korean Acad Nurs. 1984;14(2):93–111. | |
Kim JH. Validity survey of pain scale on Korean language. J Korean Acad Nurs. 1986;16(1):81–88. | |
Yoo KH. Study on Validity Verification of Korean Pain Scale in Thoracic Surgery Patient [dissertation]. Seoul, South Korea: Seoul National University; 1985. | |
Litcher-Kelly L, Martino SA, Broderic JE, Stone AA. A systematic review of measures used to assess chronic musculoskeletal pain in clinical and randomized controlled clinical trials. J Pain. 2007;8(12):906–913. | |
Kirshner B, Guyatt G. Methodological framework for assessing health indices. J Chronic Dis. 1985;38(1):27–36. | |
Deyo RA, Dichl AK. Measuring physical and psycho-social function in patients with low back pain. Spine. 1983;8(6):635–642. | |
Kim SB. Method of Questionnaire. Seoul, Republic of Korea: Book of Training Course of the Korean Society for Preventive Medicine; 1996. | |
Choi DI, Joeng TO, Jin YH, Lee JB. Clinically meaningful reduction in pain severity by using a undimensional scale and verbal categorical rating of pain. J Korean Soc Emerg Med. 2003;14(1):66–70. | |
Kelly AM. Setting the benchmark research in the management of acute pain in emergency medicine. Emerg Med (Fremantle). 2001;13(1):57–60. | |
Todd KH, Funk JP. The minimum clinically important difference in physician-assigned visual analog pain scores. Acad Emerg Med. 1996;3(2):14–146. | |
Wells GA, Tugewell P, Kraag GR, Baker PR, Groh J, Redemeier DA. Minimum important difference between patient with rheumatoid arthritis: the patient’s perspective. J Rheumatol. 1993;20(3):557–560. |
 © 2016 The Author(s). This work is published and licensed by Dove Medical Press Limited. The full terms of this license are available at https://www.dovepress.com/terms.php and incorporate the Creative Commons Attribution - Non Commercial (unported, v3.0) License.
By accessing the work you hereby accept the Terms. Non-commercial uses of the work are permitted without any further permission from Dove Medical Press Limited, provided the work is properly attributed. For permission for commercial use of this work, please see paragraphs 4.2 and 5 of our Terms.
© 2016 The Author(s). This work is published and licensed by Dove Medical Press Limited. The full terms of this license are available at https://www.dovepress.com/terms.php and incorporate the Creative Commons Attribution - Non Commercial (unported, v3.0) License.
By accessing the work you hereby accept the Terms. Non-commercial uses of the work are permitted without any further permission from Dove Medical Press Limited, provided the work is properly attributed. For permission for commercial use of this work, please see paragraphs 4.2 and 5 of our Terms.