")
Back to Journals » Psychology Research and Behavior Management » Volume 15
Validation of the Connor-Davidson Resilience Scale-10 in South Africa: Item Response Theory and Classical Test Theory
Authors Pretorius TB , Padmanabhanunni A
Received 14 March 2022
Accepted for publication 6 May 2022
Published 16 May 2022 Volume 2022:15 Pages 1235—1245
DOI https://doi.org/10.2147/PRBM.S365112
Checked for plagiarism Yes
Review by Single anonymous peer review
Peer reviewer comments 2
Editor who approved publication: Dr Igor Elman
Tyrone Brian Pretorius, Anita Padmanabhanunni
Department of Psychology, University of the Western Cape, Bellville, 7530, South Africa
Correspondence: Tyrone Brian Pretorius, Department of Psychology, University of the Western Cape, Private Bag X17, Bellville, 7530, South Africa, Tel +27 21 959 2101, Email [email protected]
Purpose: During times of crisis, and in particular during the current COVID-19 pandemic, resistance resources, such as resilience, are key to managing the negative impacts of the crisis. The Connor-Davidson Resilience Scale-10 has been extensively used to assess resilience. In the current study, we examined the reliability, validity and dimensionality of this instrument using Rasch analysis, Mokken analysis and classical test theory. Using both item response theory and classical test theory provides a more comprehensive overview of the psychometric properties of the Connor-Davidson Resilience Scale-10.
Participants and Methods: School teachers from South Africa (N = 355) constituted the sample for the study and they completed the following scales: Connor-Davidson Resilience Scale-10, the Center for Epidemiological Studies Depression Scale, State-Trait Anxiety Inventory-Trait Scale, the Beck Hopelessness Scale, and the Sense of Coherence Scale.
Results: Both item response theory and classical test theory provided strong evidence for the reliability and validity of the Connor-Davidson Resilience Scale-10. In addition, the analyses provided support for considering the scale as essentially unidimensional.
Conclusion: The obtained results provide additional support for the reliability and validity, of the Connor-Davidson Resilience Scale-10 for samples from diverse contexts.
Keywords: reliability, validity, Rasch analysis, Mokken analysis, exploratory factor analysis, confirmatory factor analysis, sense of coherence, depression, hopelessness, anxiety
Introduction
A substantial body of recent research for example,1,2 has confirmed an increase in clinically significant symptoms of psychological distress since the onset of the COVID-19 pandemic, including heightened levels of depression, anxiety and hopelessness. Specific aspects of the pandemic that may contribute to adverse mental health outcomes include social isolation, economic downturn and related job insecurity, loss of loved ones due to infection as well as stressors associated with school closures and the home schooling of children.1,3 Furthermore, certain sub-groups of the population have been more vulnerable to adverse mental health outcomes owing to the distinctive impact of the pandemic on their work roles and responsibilities. School teachers represent one such population group.
The COVID-19 pandemic has had a profound impact on the educational sector and led to worldwide school closures and a rapid transition to remote online learning. Teachers have been at the coalface of this transition and have had to contend with the dramatic changes in the nature of their work role and tasks as well as the personal impact of the pandemic on their lives. According to the Job-Demands Resources Model of wellbeing in the work environment,4 these changes in the roles and responsibilities associated with the teaching profession (eg, upskilling in digital literacy and adapting the curriculum to suit online delivery formats) are job demands and represent a significant risk factor for work-related stress and adverse mental health outcomes. High levels of burnout, depression and anxiety among teachers have been documented since the onset of the pandemic.5,6 However, individual resources (eg, sense of coherence and occupational skills) as well as job-related resources (eg, administrative supportive and latitude in decision-making) can serve to buffer the association between job demands and adverse outcomes and thereby facilitate coping.4 Resilience has been consistently identified as a salient personal resource that can contribute to adaptive functioning in the context of the pandemic.7
Resilience has been defined as a personality quality that promotes positive adaptation and coping in the face of trauma or adversity.8 It functions both to shield an individual from severe psychological distress and to promote a state of thriving and wellbeing. Studies of resilience have identified and described isolated characteristics associated with resilience as well as focused on how individuals identify, access, and navigate their way to health-sustaining resources. Some of these characteristics include high self-esteem, a strong sense of coherence (SOC) and the ability to identify and access social support.9 Various studies for example,10 have confirmed that SOC enables people to effectively navigate daily stressors as well as more severe experiences of adversity associated with the pandemic.8,11 Diverse approaches to measuring resilience have been developed, each varying depending on the foci of resilience (eg, attitudes, cognitive appraisals, social support resources, etc.) and the method of assessment.12 A critical review of scales that are most frequently used for the assessment of resilience identified the Connor-Davidson Resilience Scale (CD-RISC)13 as the most useful and robust of these measures.11
The CD-RISC comprises 25 items that are scored on a 5-point scale.13 It focuses on an individual approach to conceptualizing resilience and addresses the shortcomings of previous scales.11 Over the years, substantial normative data on the instrument from various population cohorts have been accumulated.14 The reliability and validity of the instrument have been supported by a range of studies conducted in diverse cultural contexts and in various samples, for example: India;15 Iran;16 Sweden.17
In the initial study, exploratory factor analysis resulted in a five-factor solution for the CD-RISC.13 However, various studies noted a divergence from this and reported a two-factor,18 three-factor,19 four-factor,20 or unidimensional factor structure.21,22 The CD-RISC-10 has been confirmed as psychometrically sound and proven to be an efficacious measuring instrument among numerous subgroups, eg, student nurses,23 women with breast cancer,24 depressive patients,25 and non-professional caregivers.26 In addition, the reliability and validity of the CD-RISC-10 have been extensively researched, predominantly using either confirmatory or exploratory factor analysis.24,25,27 However, sufficient evidence confirming the instrument’s item independence and unidimensional structure remains lacking.12 For this reason,12 Heritage et al used the Rasch model approach to analyze the properties of the CD-RISC-10 and proposed a seven-item version of the scale. The Rasch model has certain advantages over other approaches including its ability to precisely predict the mathematical association between an item and a latent trait to be measured.12 Furthermore, the model provides scale and item-level insights that can assist in the adaptation of instruments to suit specific research populations and settings. This can contribute to the development of a more consistent knowledge base on the psychometric properties of instruments.28
In the current study, we build on prior research by focusing on the reliability, validity and dimensionality of the CD-RISC-10 when used in South Africa among a sample of school teachers, using both item response theory (IRT) and classical test theory (CTT). With respect to IRT, we used both a parametric (Rasch analysis), and a nonparametric (Mokken analysis) approach. The study was undertaken during the third wave of the 2019 novel coronavirus (COVID-19) pandemic in South Africa from July 2021 to September 2021. It has been well established that resilience differs among people and contexts and according to the nature of the stressor experienced.29 The current pandemic offers an unprecedented opportunity to investigate the performance of standardized instruments, such as the CD-RISC-10, that have been predominantly validated using normative data from populations that have faced isolated stressors, such as physical illness (e.g.,24) or exposure to trauma (e.g.,30).
In general, combining CTT, Mokken analysis and Rasch analysis permit a more comprehensive overview of an instrument.31 CTT provides for the computation of a total score for resilience and offers a summative view of the respondents’ level of resilience, while the diagnostic capabilities of Mokken and Rasch analyses facilitate the identification of items with an increased likelihood of being selected by respondents who have different levels of resilience.31–33 This can assist with the development of more accurate profiles of respondents as well as criterion-referenced interpretations.33 This kind of information can be considered important in identifying the levels of resilience in different population groups and aid in the design of more responsive intervention efforts.34
Materials and Methods
Participants
The study sample comprised a convenience sample of school teachers in South Africa (N = 355). Reportedly there are about 444, 900 teachers in South Africa,35 and thus, a sample of 355 represents a 5.09% margin of error, with a confidence interval of 95%. Most of the respondents were female (76.6%), lived in the Western Cape (82.3%) and in urban areas (61.7). Most of them taught grades one to seven (61.1%). The mean age of the sample was 41.9 years (±12.4) and participants reported being in the teaching profession for an average of 15.7 years (±11.8). The sample may also be considered somewhat representative as it aligns very closely with population data reported in the OECD Teaching and Learning International Survey.36 This international survey found that 60% of teachers in South Africa are women (60%), on average 43 years old with an average of 15 years work experience.
Instruments
Participants completed a demographic survey, the CD-RISC-10,22 the Center for Epidemiological Studies Depression Scale (CES-D),37 the Beck Hopelessness Scale (BHS),38 the Sense of Coherence Scale (SOC-13),39 and the State-Trait Anxiety Inventory-Trait Scale (STAI-T).40 The CD-RISC comprises 10 items, each of which are scored on a 5-point scale ranging from 0 (not true at all) to 4 (true nearly all of the time). Examples of items include, “I am able to adapt when changes occur” and “I am not easily discouraged by failure.” Higher scores on the CD-RISC-10 indicate higher levels of resilience. The reliability of the CD-RISC-10, as reported in the literature, can be considered satisfactory.22–24
The SOC-13 is comprised of 13 items that assesses the capacity to identify and utilize intrinsic and extrinsic resources to successfully negotiate stressors and maintain health. This scale is comprised of three subscales: meaningfulness (four items), comprehensibility (five items), and manageability (four items). In the current study, the total scale was used as a global measure of sense of coherence. Examples of items include, “Do you have the feeling that you are in an unfamiliar situation and don’t know what to do?” and “How often do you have the feeling that there’s little meaning in the things you do in your daily life?” The SOC-13 are scored on a 7-point Likert scale. Higher scores on the SOC-13 reflect a stronger sense of coherence. The internal consistency estimates for this scale have been reported to range from α = 0.70 to α = 0.92.41
There are 20 items in the CES-D and it is used to screen for depression. It consists of seven items that focus on somatic symptoms, seven items that focus on depressed affect, four items that focus on positive affect, and two items that focus on interpersonal problems. Examples of items include “I enjoyed life” and “I could not get going.” Responses range from Rarely or None of the time (0) to All of the time (3). Higher scores on the CES-D indicate higher levels of depression. The estimates of reliability for this scale have been reported to be satisfactory (α = 0.70 to 0.90).42 The CES-D has also demonstrated acceptable reliability with a student sample in a prior South African study.43
The BHS comprises 20 items that assess degree of hopelessness where responses are dichotomized as true or false. Examples of items include “I don’t expect to get what I really want” and “My future seems dark to me.” Higher scores on the BHS indicate higher levels of hopelessness. For this instrument,28 Medvedev et al reported a satisfactory reliability coefficient of 0.93. The measure was also validated against a clinical assessment of hopelessness, and a validity coefficient of 0.74 was reported.28 In South Africa, the BHS was used with a student sample and a reliability coefficient of 0.86 was reported.2
The STAI-T comprises 20 items that assess trait anxiety. Sample items from the STAI-T include: “I worry too much over something that really doesn’t matter” and “I am content; I am a steady person.” The items of the STAI-T are scored on a 4-point scale ranging from 1 (Almost Never) to 4 (Almost Always). Higher scores on the STAI-T indicate higher levels of anxiety. In general, internal consistency coefficients for the STAI-T have been reported as satisfactory (eg, α = 0.83).44 A South African study, with young adults, also reported a satisfactory estimate of reliability (α = 0.88).45
Procedure
Google Forms were used to generate a web-based survey consisting of the various scales as well as a demographic survey. The link was disseminated to school teachers between April and July 2021, using social networking sites such as Facebook. Institutional networks were used to further disseminate the questionnaire to prospective participants.
Ethics
The study was conducted in accordance with the Declaration of Helsinki. The institutional review board of the University of the Western Cape (ethics reference number: HS21/3/8) granted ethical approval for the study. Participants provided informed consent.
Data Analysis
The sample size was considered adequate for the purposes of exploratory factor analysis (EFA) and confirmatory factor analysis (CFA),46 as well as Mokken analysis,47 and Rasch analysis.48
The CTT analyses included the determination of reliability (coefficient α), composite reliability (CR), average variance extracted (AVE), item-total correlations, inter-item correlations, standard error of measurement (SEM), EFA (principal components) and CFA. All of the CTT analyses, with the exception of CFA, were conducted with IBM SPSS Statistics (version 26). CFA was performed using IBM SPSS Amos (version 26) in order to examine the concurrent validity and dimensionality of the CD-RISC-10. In general, a reliability coefficient greater than 0.70, an AVE greater than 0.50, a small SEM, item-total correlations greater than 0.50 and inter-item correlations greater than 0.30, were considered acceptable.49,50 Several fit indices were used to examine the dimensionality of the CD-RISC-10. In addition, concurrent validity was investigated through the associations between the CD-RISC-10 and sense of coherence, depression, hopelessness, as well as anxiety. It was hypothesized that resilience would be positively associated with sense of coherence, which is also regarded as a protective resource in the literature, and negatively associated with the indices of psychological distress. As suggested by Kline,51 the selected fit indices for the CFA included the comparative fit index (CFI; should be ≥0.90), the goodness-of-fit index (GFI; should be ≥0.95), the root-mean-square error of approximation (RMSEA; should be ≤0.08), and the Tucker–Lewis index (TLI; should be ≥0.95).52
Winsteps (version 5.1.4)53 was used to conduct the Rasch analysis. The Rasch indices that were examined were the item and person separation index, item and person reliability and the infit and outfit mean square (MnSq)54 indicates that mean square values should ideally be between 0.5 and 1.5 indicating a good fit. In addition, a principal component analysis (PCA) of the residuals was conducted to determine the eigenvalue of the unexplained variance of a potential second dimension. With regards to dimensionality, if the eigenvalue of a possible second dimension is less than 2, it confirms that the instrument is unidimensional.54 To demonstrate that the items can distinguish between different respondents, the person separation index should be greater than 2 and have a reliability greater than 0.8. To confirm the item hierarchy of the instrument, the item separation index should be greater than 3, while item separation reliability should be greater than 0.8. If the item hierarchy is confirmed, it is regarded as indicative of construct validity. To examine measurement invariance across gender, differential item functioning (DIF) was used. In general, DIF values greater than 0.5 suggest substantial DIF.54
Mokken analysis was conducted with the “Mokken” package55,56 in R.57 This includes the determination of dimensionality, reliability (MSRho), invariant item ordering (IIO), and monotonicity. With respect to dimensionality, Mokken analysis determines a scalability coefficient for every item (Hi) of the scale as well as for the total scale (H). When evaluating H-coefficients, it is suggested that an H-value greater than 0.50 indicates a strong scale, while between 0.40 and 0.50 indicates a medium scale, and an H less than 0.40 indicates a weak scale.58 The Mokken package uses an automated algorithm (ie, automated item selection procedure [AISP]) to search for unidimensional scales, which indicates whether a scale is unidimensional or multidimensional.56 Monotonicity implies that as the levels of the latent variable increase the likelihood of positively endorsing items should also increase. The Mokken software package provides a Crit value that indicates whether significant violations of monotonicity have occurred. When there are no violations, it would indicate that the items effectively distinguish respondents with high compared to those with low levels of resilience.56 IIO indicates the extent to which the items are endorsed in the same order at all levels of the latent variable.59 The Mokken package indicates the significance of violations of IIO for each item, which is also called the Crit value. If an item is identified as violating the assumption of IIO, it would suggest that participants that have the same level of the underlying latent variable (resilience) have responded to the particular item in different ways. It is suggested that a Crit value for both monotonicity and IIO > 80 indicate serious violations, while a Crit value of between 40 and 80 indicates minor violations that are acceptable.59
Results
Table 1 reports the intercorrelations, reliability (Cronbach’s alpha), and descriptive statistics of all the variables. The reliability of all the scales can be regarded as satisfactory (α > 0.80). In terms of intercorrelations, resilience was positively associated with sense of coherence (r353 = 0.45, p < 0.001), and negatively related to the indices of psychological distress: depression (r353 = −0.48, p < 0.001), hopelessness (r353 = −0.48, p < 0.001), and anxiety (r353 = −0.53, p < 0.001).
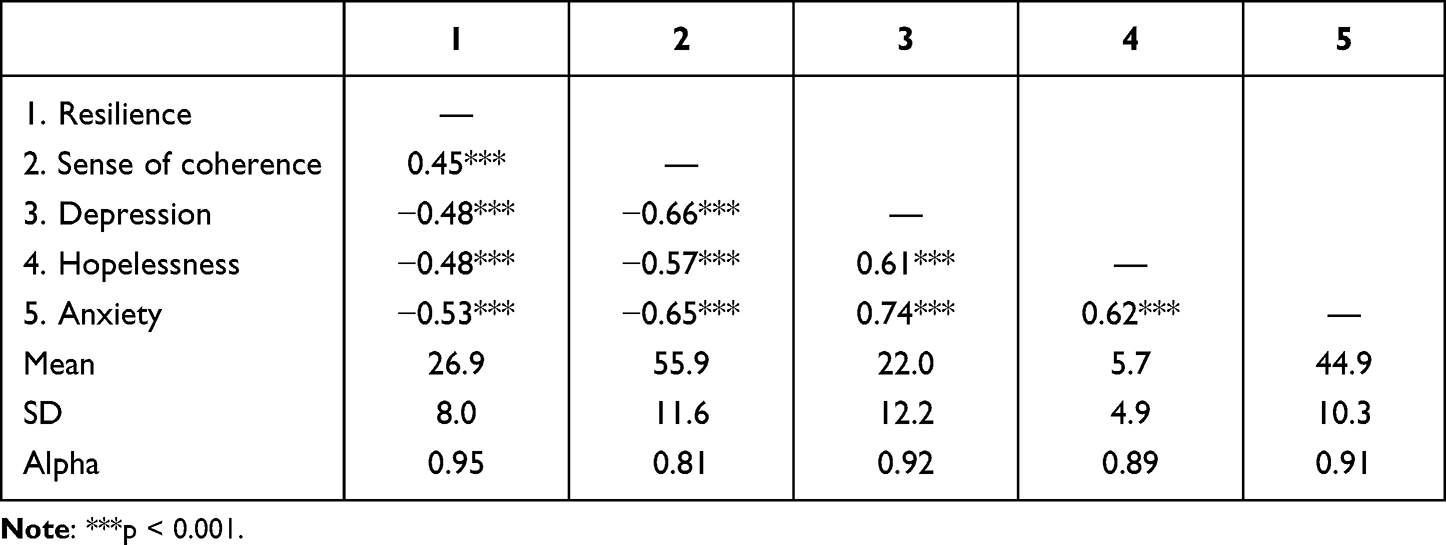 |
Table 1 Descriptive Statistics, Reliabilities and Intercorrelations Between Study Variables |
In terms of mean scores, Table 1 indicates that the mean resilience score of the current sample was 26.9 ± 8.0. This is not significantly different from the mean scores reported in the original study of the CD-RISC-10 (Mean = 27.2 ± 5.8, t354 = −0.70, p = 0.484)22 or a study among German students (Mean = 27.6 ± 5.4, t354 = −1.62, p = 0.107).60 It is, however, significantly lower than the mean resilience scores reported for a sample of competitive sports participants (Mean = 31.14 ± 5.4, t354 = −9.96, p < 0.001).61
The inter-item correlations are reported in Table 2, while the CTT and IRT indices at the item level are reported in Table 3. This includes item-total correlations, factor loadings, MnSq values, Crit values for the assumptions of monotonicity and IIO, and the Hi-coefficients for each of the items of the CD-RISC-10. Table 2 reflects that the inter-item correlations ranged between 0.55 and 0.78, and thus were above the suggested cutoff (0.30), which provides evidence of construct validity.
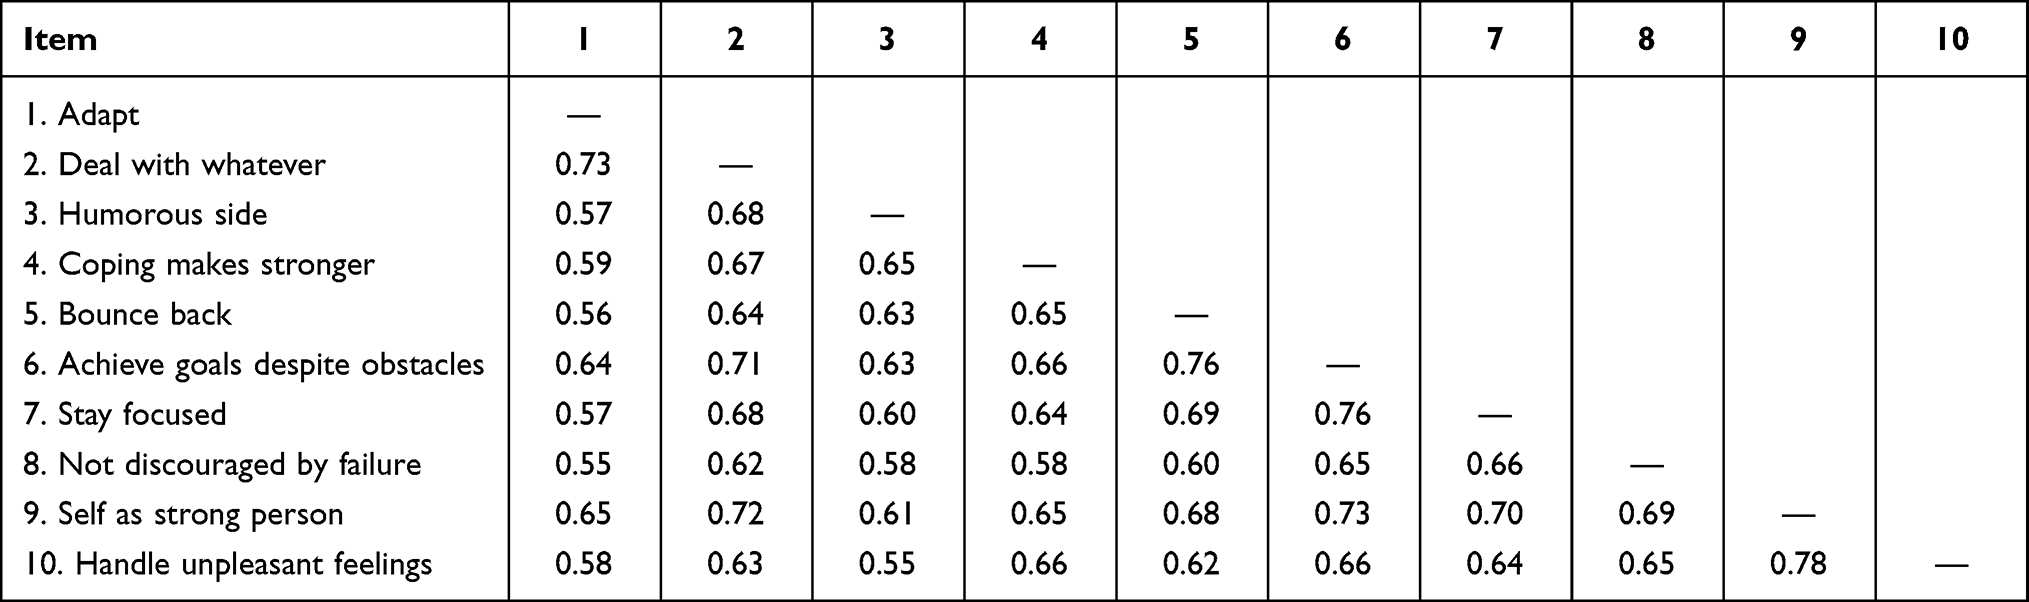 |
Table 2 Inter-Item Correlations for the CD-RISC-10 |
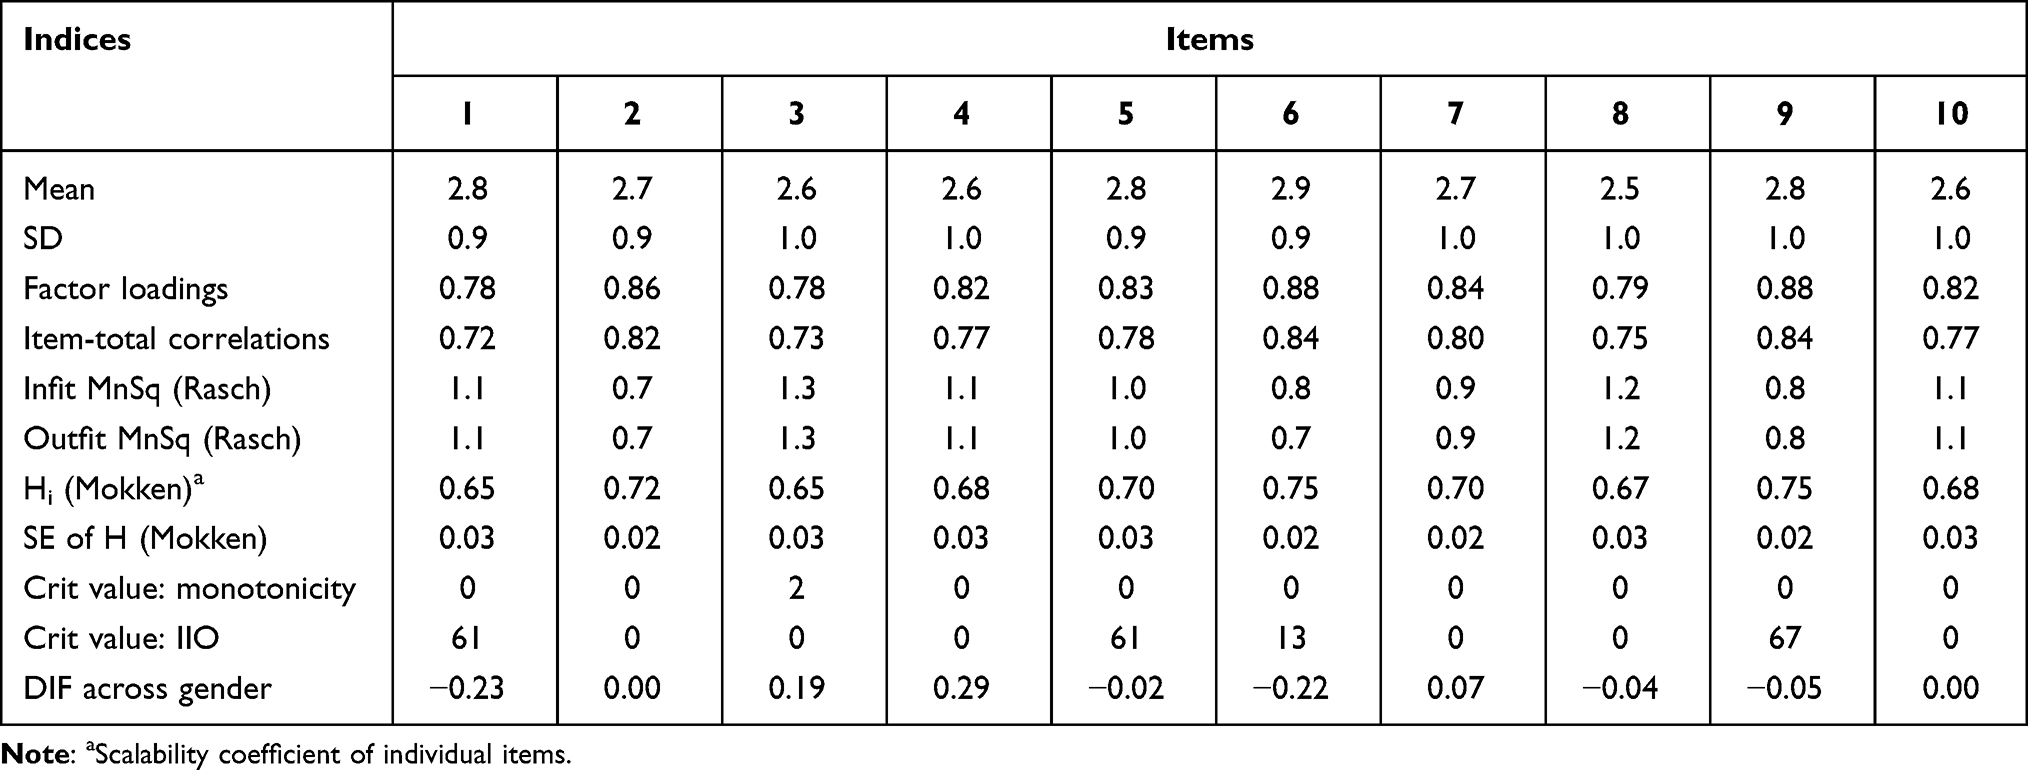 |
Table 3 Classical Test Theory, Rasch, and Mokken Indices for the CD-RISC-10 at the Item Level |
The EFA extracted one factor that explained 68.5% of the variance. Table 3 indicates that the factor loadings of the extracted factor ranged between 0.78 and 0.88, while the item-total correlations ranged between 0.72 and 0.84. Both the factor loadings and the item-total correlations were significant, which indicates that all of the items make a contribution towards the measurement of the latent variable. The MnSq values (infit and outfit) fell within the suggested range (0.5–1.5) since they ranged from 0.70 to 1.3. All the Hi indices were above the proposed criterion of 0.3062 and ranged between 0.65 and 0.75. These Hi values further indicate that all of the items make a contribution to the overall assessment of resilience.
The AISP in the Mokken analysis identified one dimension. For each item, the scalability coefficients (Hi) ranged between 0.65 and 0.75 (SE = 0.02 to 0.03), and for item pairs, the scalability coefficients (Hij) ranged between 0.56 and 0.85 (SE = 0.03 to 0.05). The use of all of the items of the CD-RISC-10 as a Mokken scale was supported by these H coefficients. Based on a numerical and visual assessment, there were no significant violations of monotonicity as only one item, namely “Tried to see humorous side of problems” had a Crit value of 2. This is well below the value of 80 which is considered to be indicative of a serious violation. With respect to item ordering, IIO indicated violations related to items 1, 5, 6, and 9. However, as reflected in Table 2, the Crit values associated with these four items are below the suggested value of 80. The instrument also demonstrated measurement invariance across gender, as DIF for all items were <0.5.
To examine a one-factor model of the CD-RISC-10, CFA was employed. Figure 1 demonstrates the hypothesized one-factor model of the CD-RISC-10, where the 10 items of the instrument are the observed measurements, and resilience is presented as a latent variable on which these 10 items load. As suggested by the modification indices in Amos, the error variables for items 9 and 10, as well as 5 and 6, were allowed to covary. To assess concurrent validity, sense of coherence, depression, hopelessness, and anxiety were included in the CFA model to establish an association between these variables and resilience.
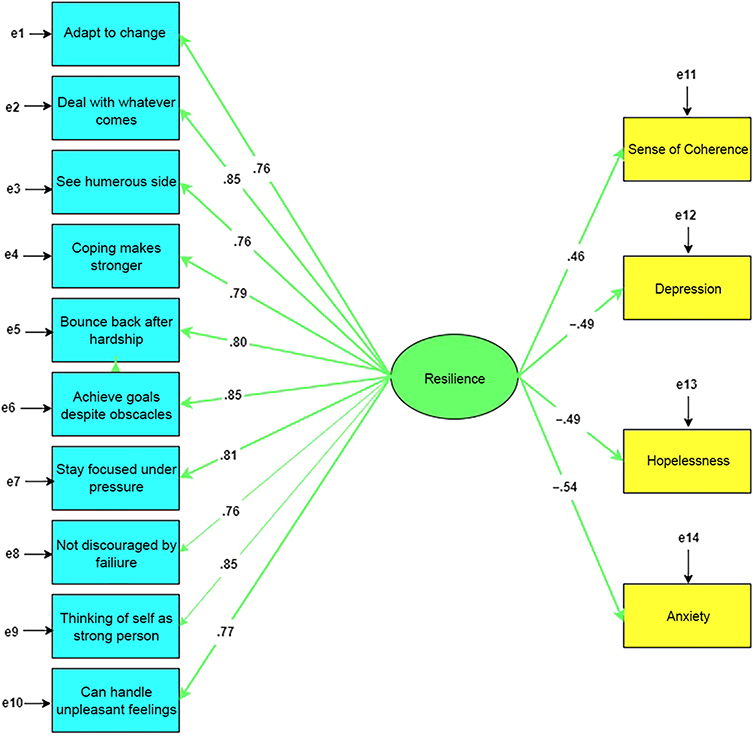 |
Figure 1 One-dimensional model of the CD-RISC-10. Notes: All regression weights are standardized. The rectangles are measured variables, whereas the ellipse is a latent construct. All paths are significant p < 0.001. |
The fit indices obtained with CFA are presented in Table 4. All of the fit indices exceeded the proposed cut-off points (CFI = 0.983, GFI = 0.950, RMSEA = 0.051, and TLI = 0.977), which points to a one-factor model fitting the data appropriately. Furthermore, the regression weights were all above 0.50 (between 0.76 and 0.85) and were significant. This supports the EFA factor loadings and item-total correlations, which indicates that all items make a contribution to the measurement of resilience. Resilience was also positively associated with sense of coherence (β = 0.46, p < 0.001) and negatively associated with depression (β = −0.49, p < 0.001), hopelessness (β = −0.49, p < 0.001), and anxiety (β = −0.54, p < 0.001).
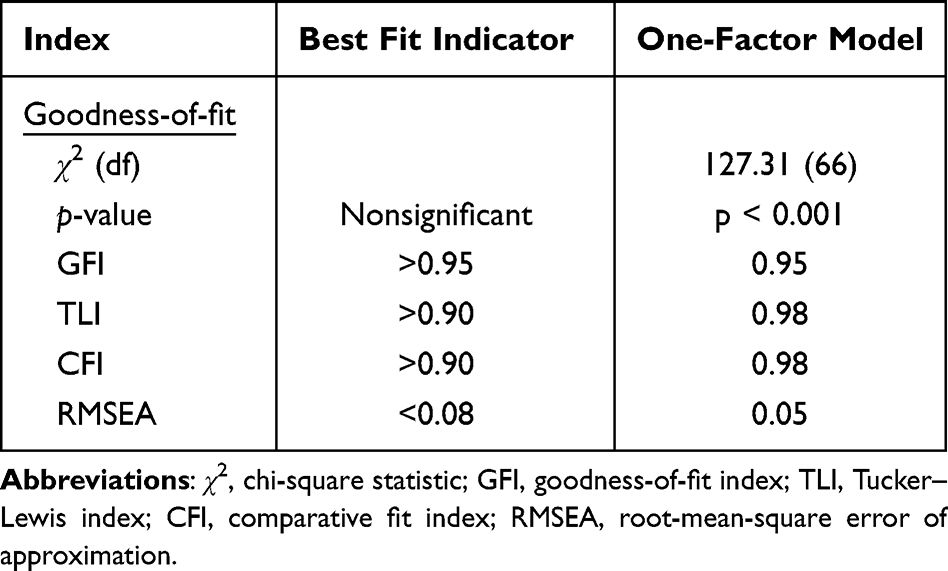 |
Table 4 Fit Indices for One-Factor Model of the CD-RISC-10 |
The IRT and the CTT indices for the CD-RISC-10, at the scale level, are presented in Table 5. The indices of reliability are satisfactory (α = 0.948, MSRho = 0.951, CR = 0.956) and AVE exceeded 0.50 (AVE = 0.684), which is considered satisfactory. The calculated SEM can also be regarded as low (SEM = 1.79). The item and separation reliability values were acceptable (0.91 and 0.93), as were the item and person index values (3.25 and 3.75). The H coefficient was 0.64, which exceeds the threshold for a strong scale (ie, H > 0.50) as suggested in the literature.59 A PCA of the residuals found that the Rasch dimension explained 65.1% (eigenvalue = 18.68) of the variance, while a possible second dimension accounted for only 6% of the variance (eigenvalue = 1.73).
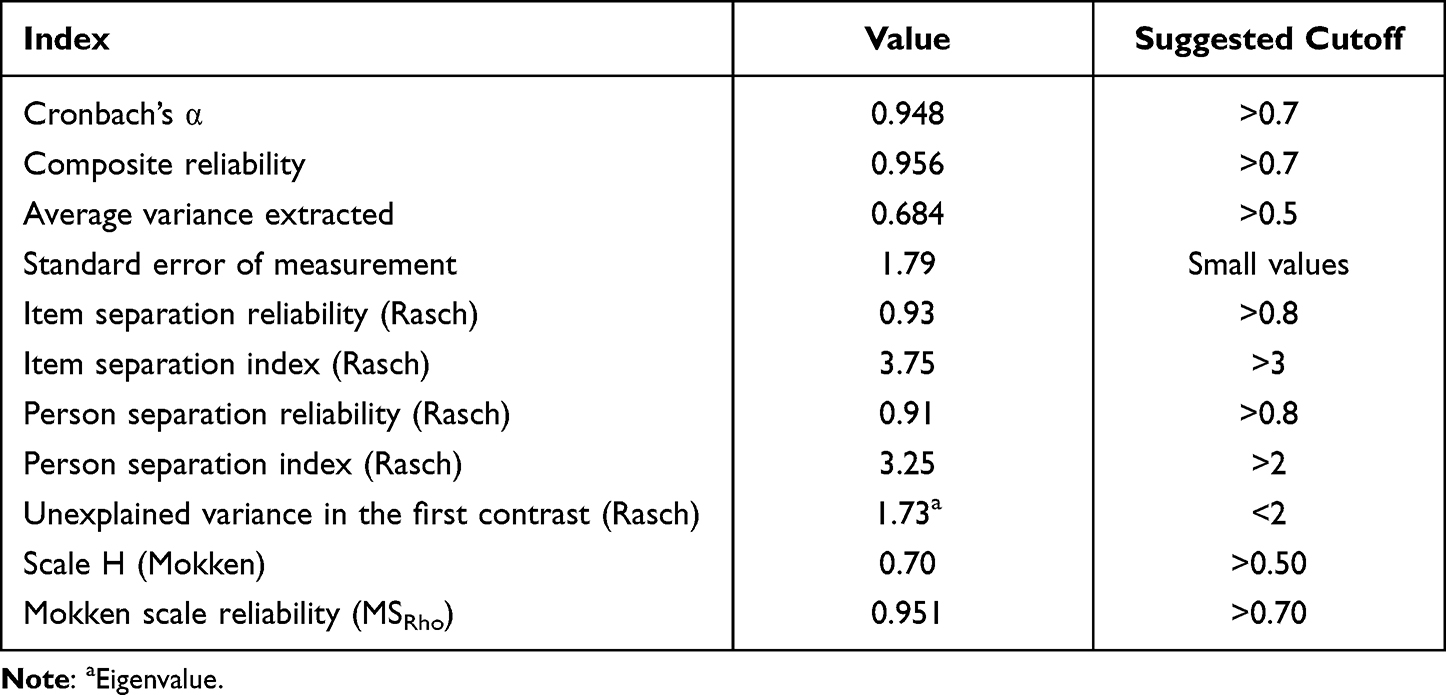 |
Table 5 Classical Test Theory, Rasch, and Mokken Indices for the CD-RISC-10 at the Scale Level |
Discussion
The current study focused on extending the existing knowledge base on the CD-RISC-10 through an examination of its psychometric properties. This entailed an analysis of the instrument’s validity, reliability, and dimensionality, through the use of Rasch and Mokken analyses as well as CTT. The use of such complementary methods of analyses has the potential to offer information that could address ambiguities regarding the instruments’ psychometric properties and provide opportunities for further enhancements.12 Due to the respective strengths and limitations of each of these approaches, integrating them offers a holistic overview of the validity, reliability, and dimensionality of the CD-RISC-10.31
Overall, the reliability indices found in the study can be considered satisfactory. The CD-RISC-10 exhibited acceptable internal consistency in terms of coefficient α and MSRho. Rasch analysis demonstrated that there is a hierarchical ordering of items (ie, item separation reliability) and that the scale can differentiate different levels of “performers” (ie, person separation reliability). This type of information is particularly beneficial for targeted intervention strategies. Given the physical and mental toil exacted by the COVID-19 pandemic, identifying individuals who are less resilient is beneficial in facilitating better planning for resource allocation and allows for interventions to be directed toward more vulnerable populations.
In terms of the results of EFA and CFA, the CD-RISC-10 can be regarded as a single dimension. A PCA of residuals in the Rasch analysis indicated that the Rasch dimension accounted for a significant amount of the variance with a possible second dimension having an eigenvalue below 2. The AISP in the Mokken analysis provided evidence that all the items loaded on one latent factor. It also demonstrated homogeneity in that the scalability coefficients (H and Hi) were all above the suggested threshold. Overall, the results of CTT, Rasch and Mokken analyses provided sufficient support for the unidimensionality of the CD-RISC-10. Ghadi et al50 proposes that CFA factor loadings, the CR, and the AVE assist with the determination of convergent validity. The factor loadings were all above 0.76 and all were significant. The AVE of 0.60 and the CR of 0.91 offer further support for convergent validity.
The current findings also support the construct validity of the CD-RISC-10. In this regard, item-total correlations of >0.50 and inter-item correlations of >0.30 supports construct validity.49 Both the item-total correlations as well as the inter-item correlations exceeded these suggested guidelines. Further evidence for construct validity is provided by the item separation indices in the Rasch analysis. For instance, Linacre54 suggested that when the item separation index is greater than 3 and the item separation reliability is greater than 0.9. It indicates the existence of an item difficulty hierarchy. The item separation indices obtained exceeded these thresholds. In addition, the MnSq values were also within an acceptable range that offers additional support for validity. The association between resilience and sense of coherence as well as indices of psychological distress provide evidence of concurrent validity. As expected, there was a positive association between resilience and sense of coherence, while resilience was negatively associated with indices of psychological distress.
In terms of implications, the current findings suggest that the CD-RISC-10 is a reliable and valid, unitary scale for the measurement of resilience that can be used in developing contexts for research purposes and assessment in clinical settings. Given that resilience is a central resource in managing adversity, it is important to adapt resilience-promoting strategies to suit the needs of people within their context. The current study assessed the psychometric properties of the CD-RISC-10 among South African school teachers. They represent a population group that has been distinctively impacted by the pandemic and are more vulnerable to burnout and adverse mental health outcomes.5 According to the Job-Demands Resources Model,4 the best way to mitigate negative outcomes associated with work stress is to decrease the demands of the job by implementing additional support structures (eg, increased administrative support) as well as identify and amplify existing internal resources such as resilience. Culturally responsive interventions that can enhance resilience during the COVID-19 pandemic have been documented and include cognitive-behavioral interventions, meditation to target depressive symptoms, acceptance-based coping, and strategies to enhance the use of social support networks.63 Future research investigating the efficacy of these approaches in enhancing resilience in sub-Saharan African contexts would be useful for planning interventions.
Limitations
There were limitations to the study. First, the study used self-report measures which might lead to self-reporting bias.64 Second, the findings from the sample surveyed may not be generalizable to school teachers in other settings. These results need to be replicated in broader and more diverse samples.
Conclusion
In developing countries like South Africa, there is a substantial body of research assessing resilience. However, very few of these studies examine the psychometric properties of instruments used to measure resilience. To produce valid cross-cultural comparisons, assessing the internal consistency, validity and dimensionality of instruments remains imperative. This study found the CD-RISC-10 to be a unidimensional scale with satisfactory reliability and validity when used in the South African context. These findings contribute to extending the literature base on cross-culturally validated measures of resilience.
Data Sharing Statement
The data sets generated and/or analysed during the current study are available from the corresponding author upon reasonable request.
Ethics
The study was conducted in accordance with the Declaration of Helsinki. The study proposal was reviewed and approved by the Humanities and Social Sciences Ethics Committee of the University of the Western Cape (ethics reference number: HS21/3/8). All participants were informed of the aims of the study, and completed informed consent forms.
Author Contributions
All authors made a significant contribution to the work reported, whether that is in the conception, study design, execution, acquisition of data, analysis and interpretation, or in all these areas; took part in drafting, revising or critically reviewing the article; gave final approval of the version to be published; have agreed on the journal to which the article has been submitted; and agree to be accountable for all aspects of the work.
Funding
This research received no specific grant from any funding agency in the public, commercial, or not-for-profit sectors.
Disclosure
The authors declare that they have no financial or personal relationships that may have inappropriately influenced them in writing this research article.
References
1. Lin T, Yi Z, Zhang S, Veldhuis CB. Predictors of psychological distress and resilience in the post-COVID-19 era. Int J Behav Med. 2021;1–11. doi:10.1007/s12529-021-10036-8
2. Padmanabhanunni A, Pretorius TB. The loneliness–life satisfaction relationship: the parallel and serial mediating role of hopelessness, depression and ego-resilience among young adults in South Africa during covid-19. Int J Environ Res Public Health. 2021;18(7):3613. doi:10.3390/ijerph18073613
3. Knowles JR, Gray NS, O’Connor C, Pink J, Simkiss NJ, Snowden RJ. The role of hope and resilience in protecting against suicidal thoughts and behaviors during the COVID-19 pandemic. Arch Suicide Res. 2021;1–18. doi:10.1080/13811118.2021.1923599
4. Bakker AB, Demerouti E. The job demands‐resources model: state of the art. J Manag Psychol. 2007;22(3):309–328. doi:10.1108/02683940710733115
5. Padmanabhanunni A, Pretorius TB, Stiegler N, Bouchard JP. A serial model of the interrelationship between perceived vulnerability to disease, fear of COVID-19, and psychological distress among teachers in South Africa. Ann Med Psychol. 2022;180(1):23–28. doi:10.1016/j.amp.2021.11.007
6. Zamarro G, Camp A, Fuchsman D, McGee J. Understanding how Covid-19 has changed teachers’ chances of remaining in the classroom. Sinquefield Center for Applied Economic Research Working Paper No. Forthcoming. 2022. doi:10.2139/ssrn.4047354
7. Barello S, Caruso R, Palamenghi L, et al. Factors associated with emotional exhaustion in healthcare professionals involved in the COVID-19 pandemic: an application of the job demands-resources model. Int Arch Occup Environ Health. 2021;94(8):1751–1761. doi:10.1007/s00420-021-01669-z
8. Kaye-Kauderer H, Feingold JH, Feder A, Southwick S, Charney D. Resilience in the age of COVID-19. BJPsych Adv. 2021;27(3):166–178. doi:10.1192/bja.2021.5
9. Mana A, Bauer GF, Magistretti CM, et al. Order out of Chaos: sense of coherence and the mediating role of coping resources in explaining mental health during COVID-19 in 7 countries. SSM Ment Health. 2021;1:100001. doi:10.1016/j.ssmmh.2021.100001
10. Gómez-Salgado J, Domínguez-Salas S, Romero-Martín M, Ortega-Moreno M, García-Iglesias JJ, Ruiz-Frutos C. Sense of coherence and psychological distress among healthcare workers during the COVID-19 pandemic in Spain. Sustainability. 2020;12(17):6855. doi:10.3390/su12176855
11. Salisu I, Hashim N. A critical review of scales used in resilience research. IOSR Int J Bus Manag. 2017;19(4):23–33. doi:10.9790/487X-1904032333
12. Heritage B, Al Asadi AA, Hegney DG. Examination of the Connor-Davidson Resilience Scale 10 (CD-RISC-10) using the polytomous Rasch model. Psychol Assess. 2021;33(7):672–684. doi:10.1037/pas0001011
13. Connor KM, Davidson JR. Development of a new resilience scale: the Connor‐Davidson resilience scale (CD‐RISC). Depress Anxiety. 2003;18(2):76–82. doi:10.1002/da.10113
14. Davidson JR. Connor-Davidson Resilience Scale (CD-RISC) manual; 2018. Available from: http://www.cd-risc.com.
15. Singh K, Yu XN. Psychometric evaluation of the Connor-Davidson Resilience Scale (CD-RISC) in a sample of Indian students. J Psychol. 2010;1(1):23–30. doi:10.1080/09764224.2010.11885442
16. Khoshouei MS. Psychometric evaluation of the Connor-Davidson resilience scale (CD-RISC) using Iranian students. Int J Test. 2009;9(1):60–66. doi:10.1080/15305050902733471
17. Velickovic K, Hallberg RI, Axelsson U, et al. Psychometric properties of the Connor-Davidson Resilience Scale (CD-RISC) in a non-clinical population in Sweden. Health Qual Life Outcomes. 2020;18:1–10. doi:10.1186/s12955-020-01383-3
18. Green KT, Hayward LC, Williams A, et al. Examining the factor structure of the Connor–Davidson Resilience Scale (CD-RISC) in a post-9/11 US military veteran sample. Assessment. 2014;21(4):443–451. doi:10.1177/1073191114524014
19. Karaırmak Ö. Establishing the psychometric qualities of the Connor–Davidson Resilience Scale (CD-RISC) using exploratory and confirmatory factor analysis in a trauma survivor sample. Psychiatry Res. 2010;179(3):350–356. doi:10.1016/j.psychres.2009.09.012
20. Lamond AJ, Depp CA, Allison M, et al. Measurement and predictors of resilience among community-dwelling older women. J Psychiatr Res. 2008;43(2):148–154. doi:10.1016/j.jpsychires.2008.03.007
21. González VBA, Sierra MTC, Martínez BA, Martínez-Molina A, Ponce FP, Bunevicius R. An in-depth psychometric analysis of the Connor-Davidson Resilience Scale: calibration with Rasch-Andrich model. Health Qual Life Outcomes. 2015;13(1):1–12. doi:10.1186/s12955-015-0345-y
22. Campbell‐Sills L, Stein MB. Psychometric analysis and refinement of the Connor–Davidson resilience scale (CD‐RISC): validation of a 10‐item measure of resilience. J Trauma Stress. 2007;20(6):1019–1028. doi:10.1002/jts.20271
23. Aloba O, Olabisi O, Aloba T. The 10-item Connor–Davidson Resilience Scale: factorial structure, reliability, validity, and correlates among student nurses in southwestern Nigeria. J Am Psychiatr Nurses Assoc. 2016;22(1):43–51. doi:10.1177/1078390316629971
24. Alarcón R, Cerezo MV, Hevilla S, Blanca MJ. Psychometric properties of the Connor-Davidson Resilience Scale in women with breast cancer. Int J Clin Health Psychol. 2020;20(1):81–89. doi:10.1016/j.ijchp.2019.11.001
25. Cheng C, Dong D, He J, Zhong X, Yao S. Psychometric properties of the 10-item Connor–Davidson Resilience Scale (CD-RISC-10) in Chinese undergraduates and depressive patients. J Affect Disord. 2020;261:211–220. doi:10.1016/j.jad.2019.10.018
26. Blanco V, Guisande MA, Sánchez MT, Otero P, Vázquez FL. Spanish validation of the 10-item Connor–Davidson Resilience Scale (CD-RISC-10) with non-professional caregivers. Aging Ment Health. 2019;23(2):183–188. doi:10.1080/13607863.2017.1399340
27. Smith KJ, Emerson DJ, Haight TD, Mauldin S, Wood BG. An examination of the psychometric properties of the Connor-Davidson Resilience Scale-10 (CD-RISC10) among accounting and business students. J Account Educ. 2019;47:48–62. doi:10.1016/j.jaccedu.2019.01.002
28. Medvedev ON, Krägeloh CU. Rasch measurement model. In: Oleg N, Medvedev ON, Krägeloh CU, Siegert RJ, Singh NN, editors. Handbook of Assessment in Mindfulness Research. Cham: Springer International Publishing; 2022:1–18.
29. Meichenbaum D. Bolstering resilience: benefiting from lessons learned. In: Meichenbaum D, editor. The Evolution of Cognitive Behavior Therapy. New York: Routledge; 2017:172–180.
30. Scali J, Gandubert C, Ritchie K, Soulier M, Ancelin ML, Chaudieu I. Measuring resilience in adult women using the 10-items Connor-Davidson Resilience Scale (CD-RISC). Role of trauma exposure and anxiety disorders. PLoS One. 2012;7(6):e39879. doi:10.1371/journal.pone.0039879
31. Meijer RR, Sijtsma K, Smid NG. Theoretical and empirical comparison of the Mokken and the Rasch approach to IRT. Appl Psychol Meas. 1990;14(3):283–298. doi:10.1177/014662169001400306
32. Paap MC, Brouwer D, Glas CA, et al. The St George’s Respiratory Questionnaire revisited: a psychometric evaluation. Qual Life Res. 2015;24(1):67–79. doi:10.1007/s11136-013-0570-y
33. Zamora-Araya JA, Smith-Castro V, Montero-Rojas E, Moreira-Mora TE. Advantages of the rasch model for analysis and interpretation of attitudes: the case of the benevolent sexism subscale. Revista Evaluar. 2018;18(3). doi:10.35670/1667-4545.v18.n3.22201
34. Nguyen HT, Do BN, Pham KM, et al. Fear of COVID-19 scale—associations of its scores with health literacy and health-related behaviors among medical students. Int J Environ Res Public Health. 2020;17(11):4164. doi:10.3390/ijerph17114164
35. Galal S. Number of teachers in education in South Africa in 2019, by province; 2021. Available from: https://www.statista.com/statistics/1262709/number-of-teachers-in-education-in-south-africa-by-province/.
36. OECD. Results from talis 2018; 2019. Available from: https://www.oecd.org›talis›TALIS2018_CN_ZAF.
37. Radloff LS. The CES-D scale: a self-report depression scale for research in the general population. Appl Psychol Meas. 1977;1:385–401. doi:10.1177/014662167700100306
38. Beck AT, Weissman A, Lester D, Trexler L. The measurement of pessimism: the hopelessness scale. J Consult Clin Psychol. 1974;42:861–865. doi:10.1037/h0037562
39. Antonovsky A. Unraveling the Mystery of Health: How People Manage Stress and Stay Well. San Francisco: Jossey-Bass; 1987.
40. Spielberger CD, Gorsuch RL, Lushene RE. Manual for the State-Trait Anxiety Inventory. Palo Alto, CA: Consulting Psychologists Press; 1970.
41. Paika V, Ntountoulaki E, Papaioannou D, Hyphantis T. The Greek version of the Sense of Coherence Scale (SOC-29): psychometric properties and associations with mental illness, suicidal risk and quality of life. J Psychol Clin Psychiatry. 2017;7(4):00449. doi:10.15406/jpcpy.2017.07.00449
42. González P, Nuñez A, Merz E, et al. Measurement properties of the Center for Epidemiologic Studies Depression Scale (CES-D 10): findings from HCHS/SOL. Psychol Assess. 2017;29:372. doi:10.1037/pas0000330
43. Padmanabhanunni A, Pretorius TB. When coping resources fail: the health-sustaining and moderating role of fortitude in the relationship between COVID-19-related worries and psychological distress. Soc Health Sci. 2020;18(2):28–47.
44. Lin Y, Hu Z, Alias H, Wong LP. Knowledge, attitudes, impact, and anxiety regarding COVID-19 infection among the public in China. Front Public Health. 2020;8:236. doi:10.3389/fpubh.2020.00236
45. Pretorius TB, Padmanabhanunni A. A looming mental health pandemic in the time of COVID-19? Role of fortitude in the interrelationship between loneliness, anxiety, and life satisfaction among young adults. S Afr J Psychol. 2021;51(2):256–268. doi:10.1177/0081246321991030
46. Kyriazos TA. Applied psychometrics: sample size and sample power considerations in factor analysis (EFA, CFA) and SEM in general. Psychology. 2021;9(08):2207. doi:10.4236/psych.2018.98126
47. Watson R, Egberink IJ, Kirke L, Tendeiro JN, Doyle F. What are the minimal sample size requirements for Mokken scaling? An empirical example with the Warwick-Edinburgh Mental Well-Being Scale. Health Psychol Behav Med. 2018;6(1):203–213. doi:10.1080/21642850.2018.1505520
48. Chen WH, Lenderking W, Jin Y, Wyrwich KW, Gelhorn H, Revicki DA. Is Rasch model analysis applicable in small sample size pilot studies for assessing item characteristics? An example using PROMIS pain behavior item bank data. Qual Life Res. 2014;23(2):485–493. doi:10.1007/s11136-013-0487-5
49. Hajjar ST. Statistical analysis: internal-consistency reliability and construct validity. Int J Qual Quant Methods. 2018;6(1):27–38.
50. Ghadi I, Alwi NH, Bakar KA, Talib O. Construct validity examination of critical thinking dispositions for undergraduate students in University Putra Malaysia. High Educ Stud. 2012;2(2):138–145.
51. Kline RB. Principles and Practice of Structural Equation Modeling.
52. Hu L, Bentler PM. Cutoff criteria for fit indexes in covariance structure analysis: conventional criteria versus new alternatives. Struct Equ Modeling. 1999;6::1–55. doi:10.1080/10705519909540118
53. Linacre JM. Winsteps® Rasch measurement computer program (Version 5.1.4). Portland, Oregon; 2021a. Available from: Winsteps.com.
54. Linacre JM. Winsteps® Rasch measurement computer program User’s Guide. Version 5.1.1. Portland, Oregon; 2021b. Available from: Winsteps.com.
55. Van der Ark LA. Mokken scale analysis in R. J Stat Softw. 2007;20(11):1–19.
56. Van der Ark LA. New developments in Mokken scale analysis in R. J Stat Softw. 2012;48(5):1–27.
57. R Core Team. R: a language and environment for statistical computing. Vienna, Austria: R Foundation for Statistical Computing; 2017. Available from: https://www.R-project.org/.
58. Wind SA. An instructional module on Mokken scale analysis. Educ Meas. 2017;36(2):50–66. doi:10.1111/emip.12153
59. Sijtsma K, van der Ark LA. A tutorial on how to do a Mokken scale analysis on your test and questionnaire data. Br J Math Stat Psychol. 2017;70(1):137–158. doi:10.1111/bmsp.12078
60. Wollny AI, Jacobs I. Validity and reliability of the German versions of the CD-RISC-10 and CD-RISC-2. Curr Psychol. 2021;1–12. doi:10.1007/s12144-021-01670-2
61. Gonzalez SP, Moore EWG, Newton M, Galli NA. Validity and reliability of the Connor-Davidson Resilience Scale (CD-RISC) in competitive sport. Psychol Sport Exerc. 2016;23:31–39. doi:10.1016/j.psychsport.2015.10.005
62. Mokken RJ. A Theory and Procedure of Scale Analysis. The Hague, The Netherlands: Mouton; 1971.
63. Polizzi C, Lynn SJ, Perry A. Stress and coping in the time of COVID-19: pathways to resilience and recovery. Clin Neuropsychiatr. 2020;17(2):59–62. doi:10.36131/CN20200204
64. Tsipropoulou V, Nikopoulou VA, Holeva V, et al. Psychometric properties of the Greek version of FCV-19S. Int J Ment Health Addict. 2020;19:2279–2288. doi:10.1007/s11469-020-00319-8
 © 2022 The Author(s). This work is published and licensed by Dove Medical Press Limited. The full terms of this license are available at https://www.dovepress.com/terms.php and incorporate the Creative Commons Attribution - Non Commercial (unported, v3.0) License.
By accessing the work you hereby accept the Terms. Non-commercial uses of the work are permitted without any further permission from Dove Medical Press Limited, provided the work is properly attributed. For permission for commercial use of this work, please see paragraphs 4.2 and 5 of our Terms.
© 2022 The Author(s). This work is published and licensed by Dove Medical Press Limited. The full terms of this license are available at https://www.dovepress.com/terms.php and incorporate the Creative Commons Attribution - Non Commercial (unported, v3.0) License.
By accessing the work you hereby accept the Terms. Non-commercial uses of the work are permitted without any further permission from Dove Medical Press Limited, provided the work is properly attributed. For permission for commercial use of this work, please see paragraphs 4.2 and 5 of our Terms.