")
Back to Journals » Clinical Epidemiology » Volume 9
Validation of algorithms to determine incidence of Hirschsprung disease in Ontario, Canada: a population-based study using health administrative data
Authors Nasr A, Sullivan KJ, Chan EW, Wong CA, Benchimol EI
Received 11 August 2017
Accepted for publication 3 October 2017
Published 14 November 2017 Volume 2017:9 Pages 579—590
DOI https://doi.org/10.2147/CLEP.S148890
Checked for plagiarism Yes
Review by Single anonymous peer review
Peer reviewer comments 2
Editor who approved publication: Professor Henrik Sørensen
Ahmed Nasr,1,2 Katrina J Sullivan,1 Emily W Chan,1 Coralie A Wong,3 Eric I Benchimol2–5
1Department of Pediatric Surgery, Children’s Hospital of Eastern Ontario, 2Faculty of Medicine, University of Ottawa, 3Institute for Clinical Evaluative Science (ICES University of Ottawa), 4CHEO Inflammatory Bowel Disease Centre, Division of Gastroenterology, Hepatology and Nutrition, Children’s Hospital of Eastern Ontario, 5School of Epidemiology and Public Health, University of Ottawa, Ottawa, ON, Canada
Objective: Incidence rates of Hirschsprung disease (HD) vary by geographical region, yet no recent population-based estimate exists for Canada. The objective of our study was to validate and use health administrative data from Ontario, Canada to describe trends in incidence of HD between 1991 and 2013.
Study design: To identify children with HD we tested algorithms consisting of a combination of diagnostic, procedural, and intervention codes against the reference standard of abstracted clinical charts from a tertiary pediatric hospital. The algorithm with the highest positive predictive value (PPV) that could maintain high sensitivity was applied to health administrative data from April 31, 1991 to March 31, 2014 (fiscal years 1991–2013) to determine annual incidence. Temporal trends were evaluated using Poisson regression, controlling for sex as a covariate.
Results: The selected algorithm was highly sensitive (93.5%) and specific (>99.9%) with excellent predictive abilities (PPV 89.6% and negative predictive value >99.9%). Using the algorithm, a total of 679 patients diagnosed with HD were identified in Ontario between 1991 and 2013. The overall incidence during this time was 2.05 per 10,000 live births (or 1 in 4,868 live births). The incidence did not change significantly over time (odds ratio 0.998, 95% confidence interval 0.983–1.013, p = 0.80).
Conclusion: Ontario health administrative data can be used to accurately identify cases of HD and describe trends in incidence. There has not been a significant change in HD incidence over time in Ontario between 1991 and 2013.
Keywords: Hirschsprung disease, algorithm validation, incidence, health administrative data
Introduction
HD is a congenital disease in which a section of the bowel is aganglionic, beginning at the internal anal sphincter and extending proximally for varying lengths through the colon.1 Due to the impaired physiology of the nerves in this area, the affected segment is in constant contraction, resulting in symptoms of bowel obstruction.1 Clinically, the symptoms of HD usually present immediately after birth (i.e. absence of meconium passage within the first 48 hours, vomiting, and abdominal distension), and as such, patients are often diagnosed in infancy. For older children, chronic constipation from birth and abdominal distension are classic symptoms of HD.2
Incidence of HD varies by geographical region, with rates ranging from 0.14 to 0.30 per 1,000 live births.3–7 Only one Canadian study has investigated the incidence of HD. A British Columbia surveillance cohort demonstrated incidence of 0.23 per 1,000 live births between 1964 and 1982.3 Incidence estimates are not available for Ontario, Canada’s most populous province. Recent studies have also reported an increasing incidence of HD in the general population.5,8 While this may be due to increased awareness of the disease and improved methods of detection, it must be noted that temporal trends have also been shown to vary by geographical region.5–8
Ontario has a universal health care system in which all medically necessary direct health care costs (excluding medications) are paid by the provincial government for all legal residents (>99% of the population). These costs are contained within provincial health administrative data. These data represent an excellent opportunity to evaluate population-based estimates of incidence and outcomes of disease within the population. However, the accuracy of administrative data varies, and validation has been identified as a priority in the fields of epidemiological and health services research using these databases to minimize misclassification bias.9,10 This study used Ontario health administrative data, obtained using a validated algorithm, to determine the incidence and temporal trends of HD. Establishing a validated population-based cohort of HD patients will be invaluable in the future study of this condition, allowing for continued surveillance of identified patients.
Methods
This study was approved by the research ethics board of CHEO and the Ottawa Hospital.
Data sources
The health records of all legal Ontario residents (>99% of the population) are contained within anonymized provincial health administrative data, housed at the ICES. Each resident has a unique encrypted IKN based on his/her OHIP, allowing for deterministic linkage of a resident across health administrative and population databases. Investigators and analysts had access to uncleaned data from the full population of Ontario. We used the following datasets: hospitalization data from the CIHI-DAD, physician billing records from the OHIP database (including outpatient visits, emergency department care, and surgical procedures), population demographic data from the RPDB, and Canadian census data (census area profiles for 1991, 1996, 2001, 2006, and 2011). All entries within these databases are associated with a diagnostic code formatted to the ICD-9 before April 1, 2002 or ICD-10 after April 1, 2002.
Algorithm development and validation
To develop an algorithm for the identification of patients diagnosed with HD, true-positive (HD patients) and true-negative (patients without HD) reference standards were established. Potential true-positive cases of HD were identified within CHEO by two different methods. An electronic record search was conducted at CHEO between 1991 and 2010 to determine the true-positive reference standard (all patients <18 years of age diagnosed with HD at CHEO). CHEO is the only hospital with inpatient pediatric beds or pediatric surgeries within the CMA of Ottawa. Therefore, all children with HD in this region are treated at this institution (i.e. HD is not a condition that would be treated at community or adult hospitals, unless diagnosis occurred at >18 years of age). The search for reference standard charts was performed using the ICD-9 and ICD-10 diagnostic codes for HD and other congenital functional disorders of the colon (ICD-9 751.3; ICD-10 Q43.1). The ICD code search was intended to be nonspecific and as inclusive as possible to ensure our true-positive cohort including all patients with potential HD. To minimize the potential for bias, an electronic search was conducted in the pathology database for the presence of the Systematized Nomenclature of Medicine Clinical Terms for biopsy associated with HD. All charts identified by these methods were reviewed by two reviewers (AN and a medical student) to confirm the diagnosis of HD using standard diagnostic criteria,11 and only patients born after April 1, 1988 residing in the CMA of Ottawa with a valid Ontario health card number were included. To establish a negative reference standard, the RPDB was used to identify all children <18 years of age living in Ottawa between 1991 and 2010 who were not identified by our search strategy and chart review, and therefore presumed not to have HD. This strategy has been shown to produce accurate true-negative reference standards in previous algorithm validation studies for the province of Ontario.12,13
OHIP health card numbers for true-positive and true-negative reference standards were linked to the ICES-encrypted IKNs, allowing for the testing of various algorithms designed to identify HD patients in Ontario from within the health administrative data. We developed a total of 11 different algorithms using combinations of diagnostic and procedure codes from OHIP and the CIHI-DAD which had face validity for the identification of HD from within the data (Tables S1 and S2). We tested the suitability of each algorithm against the reference standards. We decided a priori that the algorithm that yielded the highest PPV, while maintaining a high sensitivity (optimally >90%), would be selected as the one to be applied to the data to create the HD cohort. A higher PPV minimized false-positive identification of non-HD patients, and a higher sensitivity allowed for more complete identification of the cohort. This strategy has been used in the validation of algorithms for other rare diseases.12,14
Estimation of HD incidence in Ontario
The validated algorithm was applied to Ontario health administrative data to identify all HD cases in Ontario between 1991 and 2013. Inclusion criteria included hospital birth in Ontario between 1991 and 2013 with a valid health card number. Residents were excluded if they were not born in hospital, or if they migrated out of the province within the first year of life. Crude incidence of HD per 10,000 live births per fiscal year and overall was determined.
Statistical analysis
For the algorithm validation stage, we calculated the strength of each algorithm using the reference standards. We calculated sensitivity, specificity, PPV, and NPV with 95% CIs.
Crude incidence was calculated using the 2006 Canadian census standard population. Incidence time trends were assessed using sex-adjusted Poisson regression analysis. OR and 95% CIs were reported, with significance determined with a P-value of <0.05. To exclude patients with suspected short-segment HD from the evaluation of incidence trends, we conducted a sensitivity analysis to evaluate the trends in incidence in children diagnosed under 1 year of age separately from the overall cohort.
Results
Algorithm validation
To develop the true-positive reference standard, the charts of a total of 117 patients were screened, of which 41 were excluded due to birth before April 1, 1988 (n = 5) or the patients were not a resident of Ontario and thus did not have an OHIP number (n = 36) (Figure 1). A large number of non-Ontario residents were identified in the chart review as the catchment of CHEO includes Eastern Ontario and Western Quebec. The charts of all included patients were successfully linked to their health administrative data within the ICES database.
 | Figure 1 Flow diagram of chart review process at CHEO. Patients diagnosed with HD (true-positive reference standard) were treated by corrective surgery using the Soave, Swenson, or Duhamel method. Abbreviations: CHEO, Children’s Hospital of Eastern Ontario; HD, Hirschsprung disease. |
The ability of the 11 identification algorithms to correctly identify patients with HD varied widely (Table 1). The algorithm which identified patients with surgery/biopsy and hospitalization with HD as the true diagnosis (excluding diagnostic codes for suspected HD) was deemed to be the most accurate, and selected for utilization within the ICES database as it had the highest PPV (89.58%, 95% CI 77.34%–96.53%) and excellent sensitivity (93.48%, 95% CI 82.10%–98.63%).
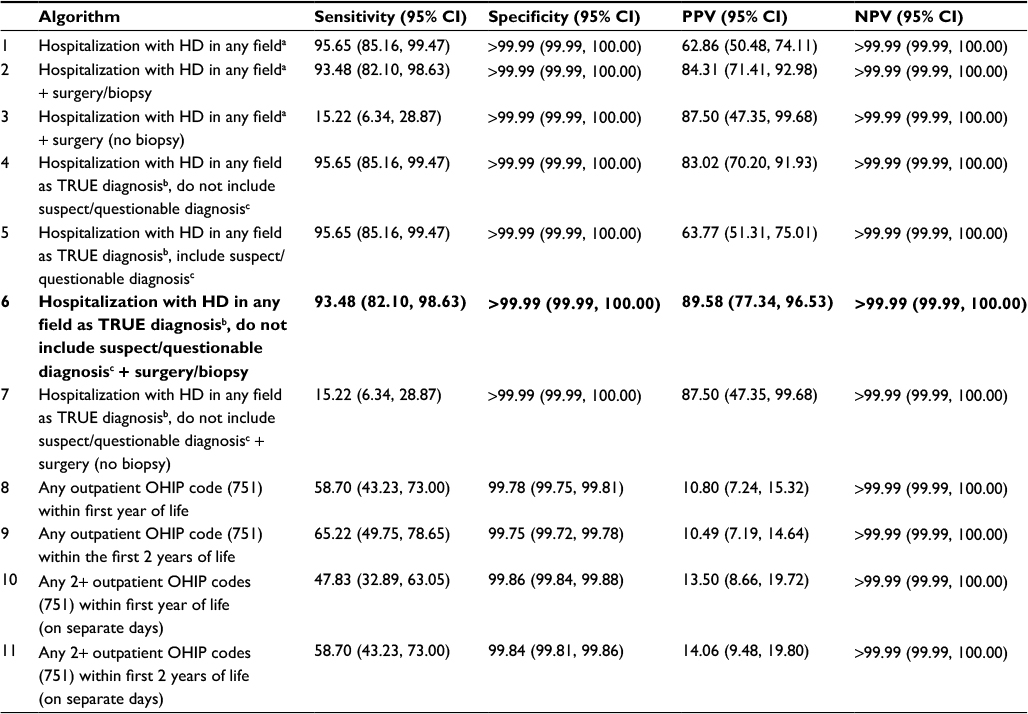 | Table 1 Algorithm validation Notes: aAny hospitalization associated with ICD-9/10 code for HD in any field. bAny hospitalization associated with ICD-9/10 code for HD as “true” diagnosis. cThe CIHI-DAD includes a “suspected” variable (INCLSUSPECT) which indicates that the diagnosis is suspected, not confirmed. ICES uses a macro that enables the algorithm to either include (INCLSUSPECT=T) or exclude (INCLSUSPECT=F) suspect/questionable diagnosis. Bold indicates the algorithm was that was applied to the data to create the final HD cohort. Abbreviations: CI, confidence interval; CIHI-DAD, Canadian Institute for Health Information - Discharge Abstract Database; HD, Hirschsprung disease; ICD, International Classification of Diseases; ICES, Institute for Clinical Evaluative Sciences; NPV, negative predictive value; OHIP, Ontario Health Insurance Plan; PPV, positive predictive value. |
Cohort creation and annual incidence estimates
By applying the validated algorithm to the administrative data, we identified a total of 679 patients <18 years of age diagnosed with HD in Ontario between 1991 and 2013. The majority of patients were male (75.41%, n = 512), living in an urban center (86.75%, n = 589), and had both rectal suction biopsies and surgery (Table 2). The median age at diagnosis was 0.20 months (interquartile range: 0.07, 2.33 months).
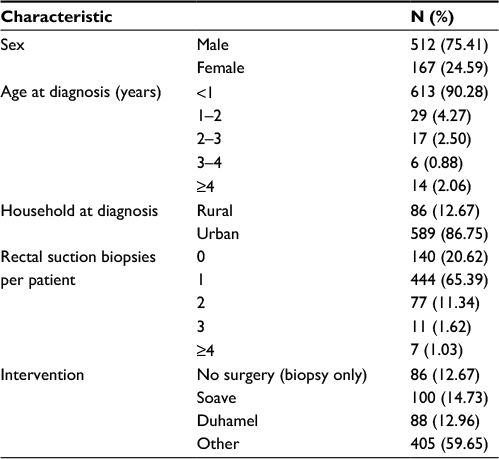 | Table 2 General characteristics of the Ontario cohort (n = 679) identified as having HD by the selected algorithm Abbreviation: HD, Hirschsprung disease. |
The overall crude incidence rate for HD in Ontario between 1991 and 2013 was 2.05 per 10,000 live births (or 1 in 4,868 live births), with yearly values ranging from 0.98 per 10,000 to 3.08 per 10,000 live births (Figure 2 and Table S3). We observed no significant change in the incidence over time (OR 1.00, 95% CI 0.98–1.01, p = 0.80). Sensitivity analysis to evaluate incidence in patients with long-segment disease (i.e. diagnosed under 1 year of age) indicated similar rates to the overall population (1.85 per 10,000 live births or 1 in 5,392; Figure S1).
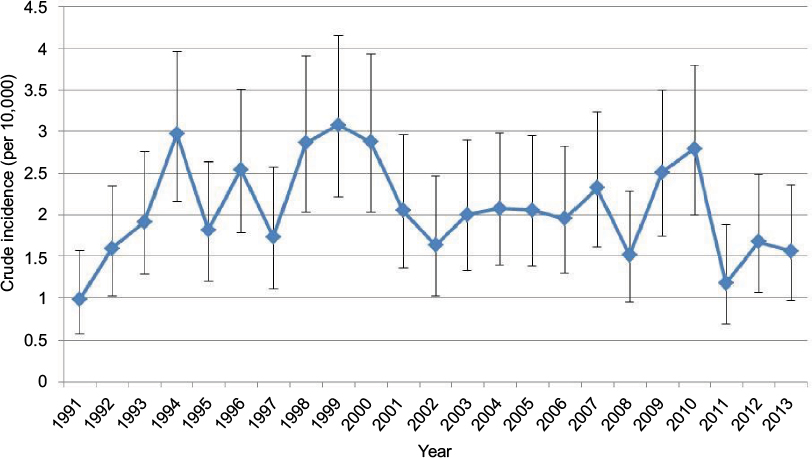 | Figure 2 Trends in crude incidence of HD in patients <18 years of age in Ontario over time. Abbreviation: HD, Hirschsprung disease. |
Discussion
We have described the incidence and temporal trends of HD in Ontario, Canada, using validated population-based health administrative data. We determined that HD cases can be accurately identified from within health administrative data, and that incidence has not significantly changed in Ontario between 1991 and 2013.
Validation of an algorithm will allow us to continue surveillance of HD using Ontario data. While previous studies have utilized ICD codes to search health registries for cases of HD (including an earlier study from British Columbia, Canada3), this is the first study to validate the use of identification algorithms with health administrative data. Results from our study confirm the use of this method, with a sensitivity and PPV ≥90%. Similar methods were used to validate other disease cohorts within Ontario, yielding variable sensitivity and PPV measures. Our algorithm measures were similar to algorithms of ICD codes utilized in existing literature to establish incidence of intussusception (sensitivity 89.3%, PPV 72.4%),12 pediatric inflammatory bowel disease (sensitivity 89.6%–90.5%, PPV 59.2%–76.0%),14 pediatric asthma (sensitivity 91.4%),15 and hospitalization of children for respiratory syncytial virus infection (sensitivity 97.9%, PPV 96.9%)16 within Ontario. A combination of procedural and diagnostic codes resulted in the most accurate identification of patients. While it is reasonable to assume that our algorithm may be used in other Canadian pediatric hospital based on the standardized training CIHI data entry personnel receive, our algorithm should be validated prior to application to the administrative data of other regions. For example, an Ontario study found that in the estimation of incidence of intussusception the addition of a procedural code to an algorithm of diagnostic codes dramatically reduced sensitivity.14 Conversely, a German study investigating incidence for the same condition found that the addition of a procedural code improved specificity while maintaining an acceptable sensitivity.17 Another Ontario study found that application of internationally validated algorithms to identify adults with inflammatory bowel disease had varying degrees of success in estimating inflammatory bowel disease in Ontario.18 This highlights the need to customize algorithms to the population and condition being examined, and to validate the algorithms against established reference standards prior to use.10
The incidence rate of HD in Ontario (1 in 4,868 live births) is similar to that most often reported in North America and Europe (1 in 5,000 live births).4,5,7,19–21 Our results are comparable to incidence rates described in British Columbia,3 Southeast Scotland,22 Denmark,23 and the USA24,25 (Table 3). This is not surprising given the proposed association between race and incidence rates for HD.8,24,26,27 While race and ethnicity are not available within Ontario health administrative data, the majority of the population of Ontario,28 British Columbia,28 Scotland,29 and Denmark30 are white. However, race/ethnicity could not account for all observations, such as Australia’s comparatively low incidence rate for HD,31 or the similarity in HD incidence between Ontario and Japan7,32 (Table 3). While these discrepancies may indicate the presence of additional factors yet to be uncovered in the etiology of HD, they may also be the result of study design. The Australian and Japanese studies estimated incidence rates based on self-reporting of surveyed clinicians and major hospitals, respectively. Further, these studies indicated less-than-optimal response rates, where only 81.1% of Japanese hospitals7 responded to their questionnaire and only 54% of Australian doctors completed the initial paper survey.31 Ultimately, all published incidence rates are estimates susceptible to any number of biases. This is supported by varying incidence rates observed in Denmark, despite the fact that both studies occurred in the same country during a similar time period.6,23
 | Table 3 Literature review of estimates of HD Abbreviation: HD, Hirschsprung disease. |
In addition to geographic differences, variations in temporal trends in HD incidence have been observed. Best et al showed a significant increase in incidence in North England between 1990 and 2008 (p = 0.02),8 and Koh et al also found a surge in cases in Tasmania between 2003 and 2005 for which no obvious explanation could be found.5 Contrary to these studies, our results did not show any evidence of an increasing trend in the incidence of HD in Ontario between 1991 and 2013. Incidence estimates from Baltimore,26 Japan,7 Denmark,6 and British Columbia3 also did not show a change in HD diagnosis across time. Without knowledge of the exact cause of HD, it is difficult to conclude why temporal trends are observed in some countries and not others. One hypothesis might be that incidence rates are increasing as a result of improvements in access to care or methods of diagnosis. In Ontario, where centralized surgical care was available to pediatric patients throughout the evaluation period (1991–2013), it is likely that access and investigative techniques did not change, resulting in stable incidence of HD. Ultimately, further research is required to assess the validity of a temporal trend and to determine what might be the cause for increased incidence rates of HD.
Limitations
The methodology used within our study to estimate the incidence rate of HD has strengths and weaknesses. Strengths include that estimates were made based on a population-based cohort rather than a smaller subset, and were therefore not subject to ascertainment bias. Our validation of the algorithms used to identify HD patients is an additional strength, although the possibility of misclassification bias (occurring both in the identification of the reference standard and the population cohort) can never be excluded in studies using health administrative data. For example, it is thought that misclassification might have contributed to some of our more unusual results, including 12.67% of patients having no surgery and over 50% of patients receiving “other” intervention in our population. A similar concern is a lack of coding for minor procedures, such as biopsy, which surgeons often waive when billing (potentially supported by the 20.62% of patients without biopsy in Table 2). In addition, very mild patients with short-segment HD who may have presented in adulthood with chronic constipation would not have been identified by our algorithm. The derivation of our algorithm from a single cohort that was not validated outside of our center (due to feasibility and budget limitations) may also represent a weakness of our study. However, CHEO represents the only pediatric hospital in the region, and is therefore representative of care received by children in the entire region of Eastern Ontario. In addition, the final algorithm was based only on discharge data (DAD) and surgical codes from the CIHI. CIHI is a national organization tasked with training professional coders in all hospitals on accurate coding, and thus, all pediatric hospital coders receive the same training in Ontario. Therefore, we have reason to believe that an algorithm validated in one institution would perform adequately in other institutions in the province. However, we acknowledge that the ability of our algorithm to identify HD cases could vary across jurisdictions depending on practice variations in hospitalization.
Conclusion
Our study provided important information on the burden of HD in a large Canadian province. We described the creation of a population-based surveillance cohort of HD patients identified from within health administrative data using a validated algorithm. The estimated incidence of HD in Ontario was comparable to previously published rates in Europe and North America, and no change in incidence over time was evident between 1991 and 2013.
Abbreviations
CHEO, Children’s Hospital of Eastern Ontario; CI, confidence interval; CIHI-DAD, Canadian Institute for Health Information - Discharge Abstract Database; CMA, census metropolitan area; HD, Hirschsprung disease; ICD, International Classification of Diseases; ICES, Institute for Clinical Evaluative Sciences; IKN, identification number; NPV, negative predictive value; OHIP, Ontario Health Insurance Plan; OR, odds ratio; PPV, positive predictive value; RPDB, registered persons database.
Acknowledgment
This study was funded by a grant from the Children’s Hospital of Eastern Ontario Research Institute. This study was supported by the Institute for Clinical Evaluative Sciences (ICES), which is funded by an annual grant from the Ontario Ministry of Health and Long-Term Care (MOHLTC). The opinions, results and conclusions reported in this paper are those of the authors and are independent from the funding sources. No endorsement by ICES or the Ontario MOHLTC is intended or should be inferred. Parts of this material are based on data and information compiled and provided by Canadian Institute for Health Information (CIHI). However, the analyses, conclusions, opinions and statements expressed herein are those of the author, and not necessarily those of CIHI.
Disclosure
Eric I Benchimol is supported by a New Investigator Award from the Canadian Institutes of Health Research, Canadian Association of Gastroenterology, and Crohn’s and Colitis Canada. He is also supported by the Career Enhancement Program of the Canadian Child Health Clinician Scientist Program. The authors report no other conflicts of interest in this work.
References
Reding R, de Ville de Goyet J, Gosseye S, et al. Hirschsprung disease: a 20-year experience. J Pediatr Surg. 1997;32(8):1221–1225. | ||
Swenson O. Hirschsprung disease: a review. Pediatrics. 2002;109(5):914–918. | ||
Spouge D, Baird P. Hirschsprung disease in a large birth cohort. Teratology. 1985;32(2):171–177. | ||
Rajab A, Freeman N, Patton M. Hirschsprung disease in Oman. J Pediatr Surg. 1997;32(5):724–727. | ||
Koh CE, Yong TL, Fenton EJ. Hirschsprung disease: a regional experience. ANZ J Surg. 2008;78(11):1023–1027. | ||
Russell MB, Russell CA, Niebuhr E. An epidemiological study of Hirschsprung’s disease and additional anomalies. Acta Paediatr. 1994;83(1):68–71. | ||
Suita S, Taguchi T, Ieiri S, Nakatsuji T. Hirschsprung disease in Japan: analysis of 3852 patients based on a nationwide survey in 30 years. J Pediatr Surg. 1994;40(1):197–202. | ||
Best KE, Glinianaia SV, Bythell M, Rankin J. Hirschsprung diseases in the North of England: prevalence, associated anomalies, and survival. Birth Defects Res A Clin Mol Teratol. 2012;94(6):477–480. | ||
Manuel DG, Rosella LC, Stukel TA. Importance of accurately identifying disease in studies using electronic health records. Br Med J. 2010;341:c4226. | ||
Benchimol EI, Manuel DG, To T, Griffiths AM, Rabeneck L, Guttmann A. Development and use of reporting guidelines for assessing the quality of validation studies of health administrative data. J Clin Epidemiol. 2011;64(8):821–829. | ||
Grosfeld JL, O’Neill JA, Coran AG, Fonkalsrud EW. Hirschsprung disease and related neuromuscular disorders of the intestine. In: Grosfeld JL, editor. Pediatric Surgery. St. Louis: Mosby Inc; 2006. | ||
Ducharme R, Benchimol EI, Deeks SL, Hawken S, Fergusson DA, Wilson K. Validation of diagnostic codes for intussusception and quantification of childhood intussusception incidence in Ontario, Canada: a population-based study. J Pediatr. 2013;163(4):1073–1079. | ||
Hux JE, Ivis F, Flintoft V, Bica A. Diabetes in Ontario: determination of prevalence and incidence using a validated administrative data algorithm. Diabetes Care. 2002;25(3):512–516. | ||
Benchimol EI, Guttman A, Griffiths AM, et al. Increasing incidence of paediatric inflammatory bowel disease in Ontario, Canada: evidence from health administrative data. Gut. 2009;58(11):1490–1497. | ||
To T, Dell S, Dick PT, et al. Case verification of children with asthma in Ontario. Pediatr Allergy Immunol. 2006;17(1):69–76. | ||
Pisesky A, Benchimol EI, Wong CA, et al. Incidence of hospitalization for respiratory syncytial virus infection amongst children in Ontario, Canada: a population-based study using validated health administrative data. PLoS One. 2016;11(3):e0150416. | ||
Kohl LJ, Streng A, Grote V, Koletzko S, Liese JG. Intussusception-associated hospitalisations in southern Germany. Eur J Pediatr. 2010;169(12):1487–1493. | ||
Benchimol EI, Guttman A, Mack DR, et al. Validation of international algorithms to identify adults with inflammatory bowel disease in health administrative data from Ontario, Canada. J Clin Epidemiol. 2014;67(8):887–896. | ||
Amiel J, Sproat-Emison E, Garcia-Barcelo M, et al. Hirschsprung disease, associated syndromes and genetics: a review. J Med Genet. 2008;45(1):1–14. | ||
Kenny SE, Tam PKH, Garcia-Barcelo M. Hirschsprung disease. Semin Pediatr Surg. 2010;19(3):194–200. | ||
Meza-Valencia BE, de Lorimier AJ, Person DA. Hirschsprung disease in the U.S. Associated Pacific Islands: more common than expected. Hawaii Med J. 2005;64(4):96–101. | ||
Orr JD, Scobie WG. Presentation and incidence of Hirschsprung disease. Br Med J. 1983;287(6406):1671. | ||
Madsen CM. Hirschsprung Disease. Copenhagen: Munksgaard; 1964. | ||
Kleinhaus S, Boley SJ, Sheran M, Sieber WK. Hirschsprung disease: a survey of the members of the surgical section of the American Academy of Pediatrics. J Pediatr Surg. 1979;14(5):588–597. | ||
Passarge E. The genetics of Hirschsprung disease: evidence for heterogeneous etiology and a study of sixty-three families. N Engl J Med. 1967;276(3):138–143. | ||
Goldberg EL. An epidemiological study of Hirschsprung disease. Int J Epidemiol. 1984;13(4):479–485. | ||
Torfs CP. An epidemiological study of Hirschsprung disease in a multi-racial California population. Presented at: The Third International Meeting: Hirschsprung Disease and Related Neurocristopathies. 1998; Evian. | ||
Statistics Canada. 2011 National Household Survey: data tables. Government of Canada; 2011. Available from: http://www12.statcan.gc.ca/nhs-enm/2011/dp-pd/dt-td/Rp-eng.cfm?LANG=E&APATH=3&DETAIL=0&DIM=0&FL=A&FREE=0&GC=0&GID=0&GK=0&GRP=0&PID=105395&PRID=0&PTYPE=105277&S=0&SHOWALL=0&SUB=0&Temporal=2013&THEME=95&VID=0&VNAMEE=&VNAMEF=. Accessed October 25, 2017. | ||
Scotland’s Census. 2011 National Records of Scotland. Ethnic group by sex by age. National Records of Scotland; 2011. Available from: http://www.scotlandscensus.gov.uk/ods-web/standard-outputs.html. Accessed October 25, 2017. | ||
Statistics Denmark. Statistical Yearbook 2015: population and elections. Government of Denmark; 2016. Available from: http://www.dst.dk/Site/Dst/Udgivelser/GetPubFile.aspx?id=20195&sid=popu. | ||
Singh SJ, Croaker GD, Manglick P, et al. Hirschsprung disease: the Australian Paediatric Surveillance Unit’s experience. Pediatr Surg Int. 2003;19(4):247–250. | ||
Ikeda K, Goto S. Diagnosis and treatment of Hirschsprung disease in Japan. Ann Surg. 1984;199(4):400–405. | ||
Althoff W. Zur genetik der Hirschsprungschen krankheit [On the genetics of Hirschsprung’s disease]. Ztschr Menschl Vererb-u Konstitutionslehre. 1962;36:314–340. German. | ||
Bodian M, Carter CO. A family study of Hirschsprung disease. Ann Hum Genet. 1963;26:261–277. |
Supplementary materials
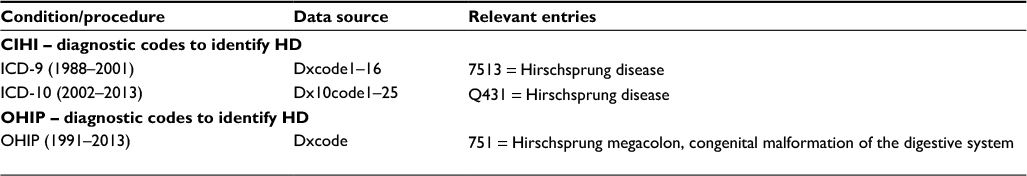 | Table S1 Diagnostic codes for HD from CIHI-DAD and OHIP Abbreviations: CIHI-DAD, Canadian Institute for Health Information - Discharge Abstract Database; HD, Hirschsprung disease; ICD, International Classification of Diseases; OHIP, Ontario Health Insurance Plan. |
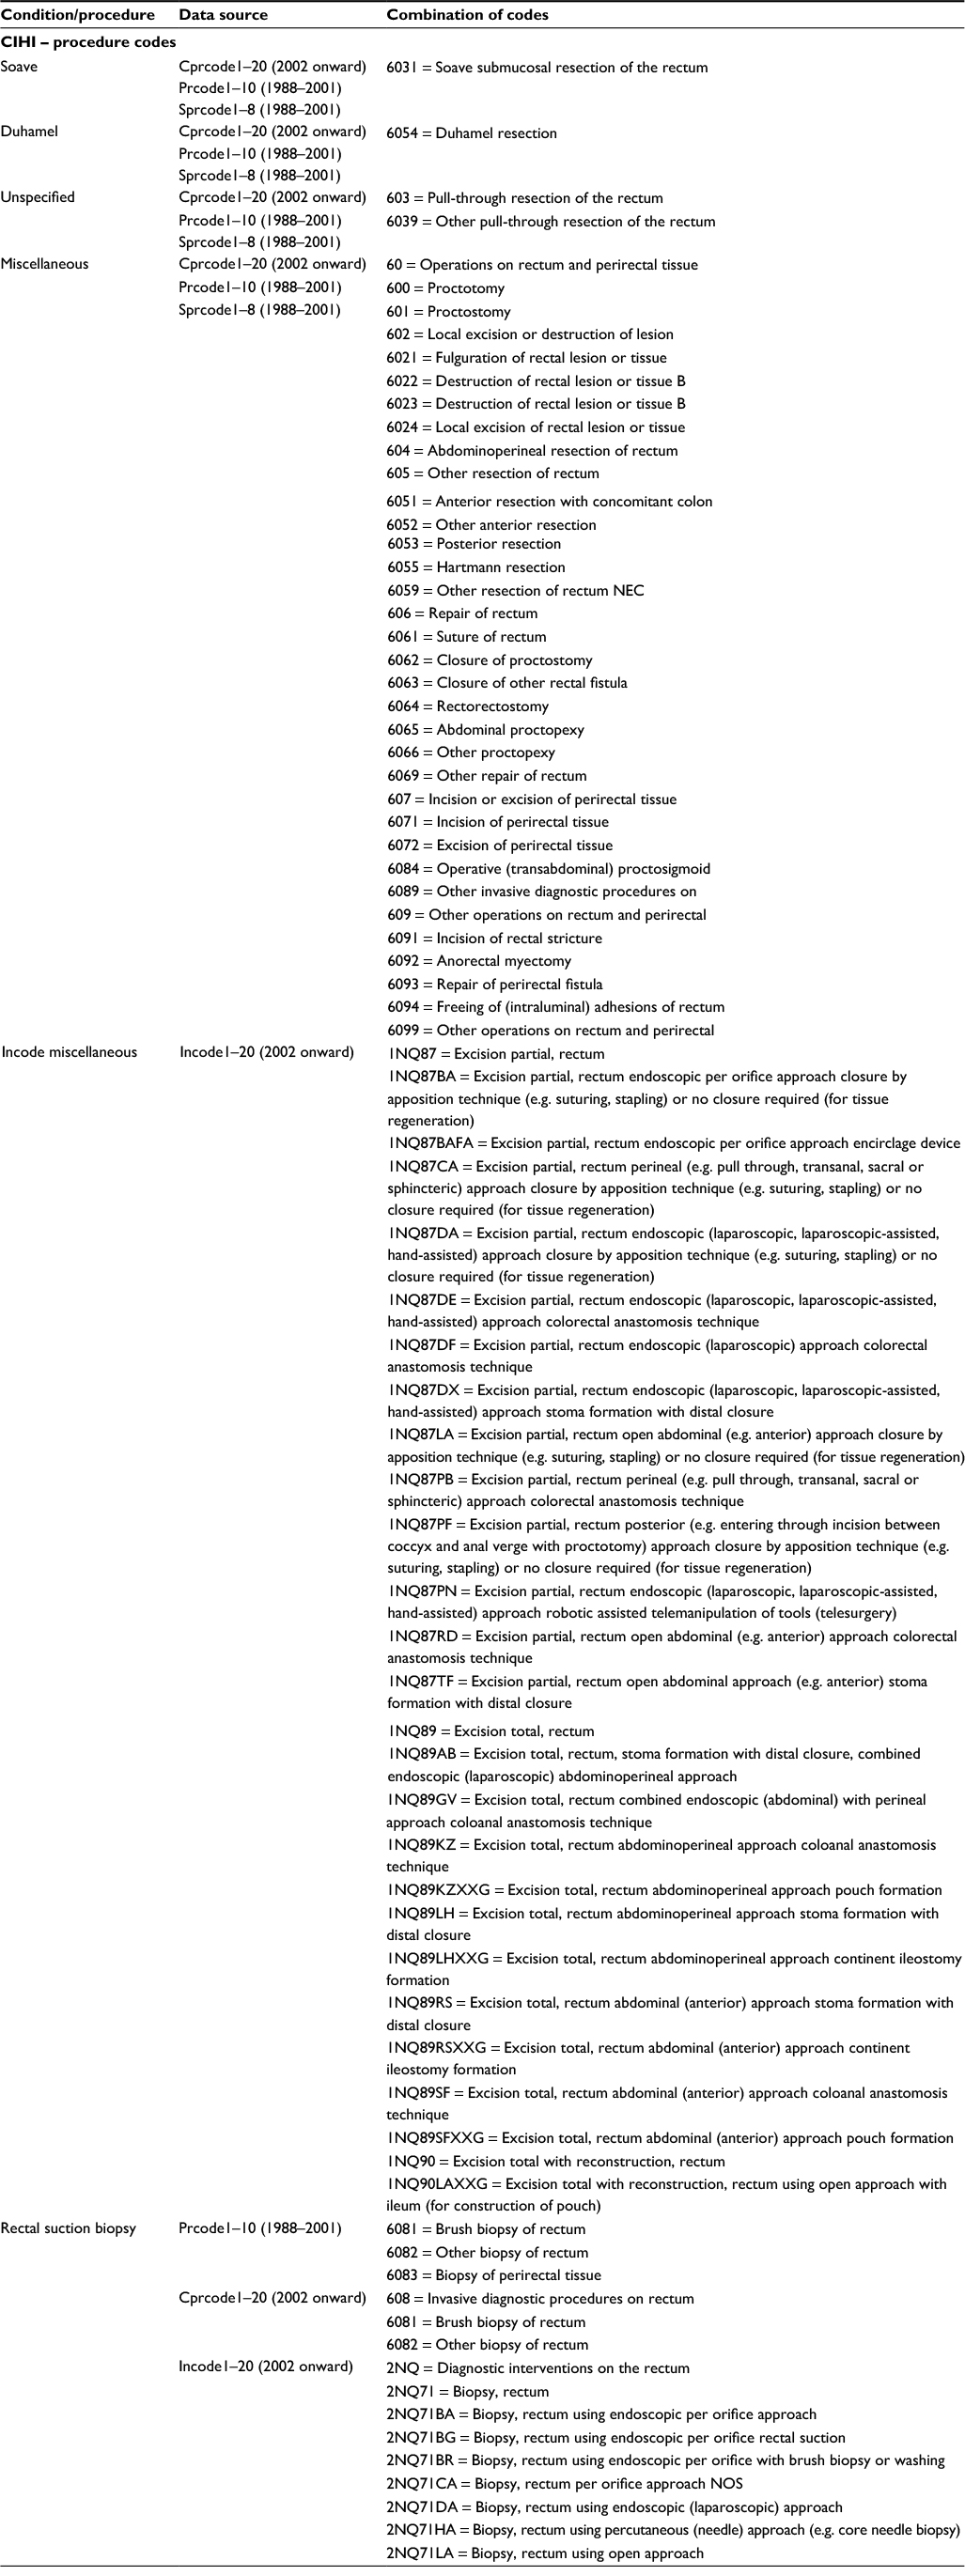 | Table S2 Procedure codes related to HD from CIHI-DAD and OHIP Notes: In 1988–2001 data, multiple variables contain required info (Prcode1–10, Sprcode1–8). If present, use only Prcode1–10 as the variables. Use Sprcode1–8 as a back-up if not present in Prcode1–10. Abbreviations: CIHI-DAD, Canadian Institute for Health Information - Discharge Abstract Database; OHIP, Ontario Health Insurance Plan; NEC, not elsewhere classified; NOS, not otherwise specified. |
 | Table S3 Annual crude incidence of HD in Ontario residents <18 years of age Abbreviations: HD, Hirschsprung disease; LCL, lower confidence limit; UCL, upper confidence limit. |
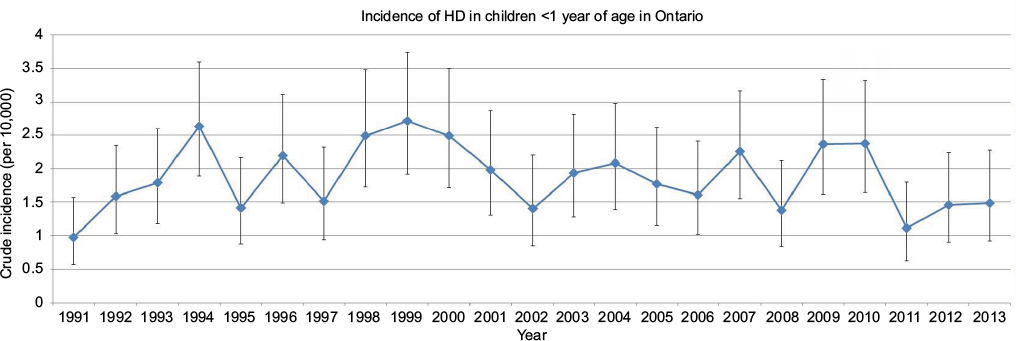 | Figure S1 Trends in crude incidence of HD in patients <1 year of age in Ontario over time. Abbreviation: HD, Hirschsprung disease. |
 © 2017 The Author(s). This work is published and licensed by Dove Medical Press Limited. The full terms of this license are available at https://www.dovepress.com/terms.php and incorporate the Creative Commons Attribution - Non Commercial (unported, v3.0) License.
By accessing the work you hereby accept the Terms. Non-commercial uses of the work are permitted without any further permission from Dove Medical Press Limited, provided the work is properly attributed. For permission for commercial use of this work, please see paragraphs 4.2 and 5 of our Terms.
© 2017 The Author(s). This work is published and licensed by Dove Medical Press Limited. The full terms of this license are available at https://www.dovepress.com/terms.php and incorporate the Creative Commons Attribution - Non Commercial (unported, v3.0) License.
By accessing the work you hereby accept the Terms. Non-commercial uses of the work are permitted without any further permission from Dove Medical Press Limited, provided the work is properly attributed. For permission for commercial use of this work, please see paragraphs 4.2 and 5 of our Terms.