")
Back to Journals » Journal of Inflammation Research » Volume 15
USP35 is a Potential Immunosuppressive Factor in Skin Cutaneous Melanoma
Authors Zhang Q, Liu YJ , Li JP, Zeng SH, Shen H, Han M , Guo S, Liu SL, Zou X
Received 15 February 2022
Accepted for publication 16 May 2022
Published 24 May 2022 Volume 2022:15 Pages 3065—3082
DOI https://doi.org/10.2147/JIR.S362619
Checked for plagiarism Yes
Review by Single anonymous peer review
Peer reviewer comments 2
Editor who approved publication: Dr Monika Sharma
Qian Zhang,1,2,* Yuan-Jie Liu,1,2,* Jie-Pin Li,1– 3 Shu-Hong Zeng,1,2 Hui Shen,3 Mei Han,1 Shun Guo,1,2 Shen-Lin Liu,1,2 Xi Zou1,2,4
1Affiliated Hospital of Nanjing University of Chinese Medicine, Jiangsu Province Hospital of Chinese Medicine, Nanjing, Jiangsu, 210029, People’s Republic of China; 2No. 1 Clinical Medical College, Nanjing University of Chinese Medicine, Nanjing, Jiangsu, 210023, People’s Republic of China; 3Zhangjiagang TCM Hospital Affiliated to Nanjing University of Chinese Medicine, Zhangjiagang, Jiangsu, 215600, People’s Republic of China; 4Jiangsu Collaborative Innovation Center of Traditional Chinese Medicine in Prevention and Treatment of Tumor, Nanjing, People’s Republic of China
*These authors contributed equally to this work
Correspondence: Xi Zou; Shun Guo, Email [email protected]; [email protected]
Background: As one of the most immunogenic malignancies, skin cutaneous melanoma (SKCM) is mainly characterized by a high prevalence in immune-compromised patients and a brisk lymphocyte infiltration in the tumor microenvironment (TME). However, to date, studies on deubiquitination in SKCM are still very limited.
Methods: Public data with regard to this study in SKCM patients were acquired from The Cancer Genome Atlas (TCGA) and the Gene-Expression Omnibus (GEO) databases. We stratified TCGA-SKCM cases using consensus clustering and identified independent prognostic factors in deubiquitinating enzymes encoding genes (DECGs) by LASSO-Cox analysis. USP35 transcriptome level was examined using public data and validated by Immunohistochemical (IHC) staining at the protein level. Enrichment analysis was used to explore the potential functions of USP35, and the TISCH database, providing further evidence at the single-cell level. The CIBERSORT algorithm was used to assess the relationship between USP35 and the immune microenvironment, and IHC was used to further evaluate the relationship between USP35 and immunotherapy response. Finally, we used the cBioPortal and the Methsurv database to analyze the significance of genomic alterations of USP35 in melanoma.
Results: Our results showed that DECGs can be effectively used to stratify SKCM patients, suggesting their potential significance in the development of SKCM. Furthermore, USP35 overexpression was significantly associated with an unfavorable prognosis. We further revealed that USP35 may be involved in the activation of TORC1 signaling. Most importantly, USP35 was found to be significantly associated with an immunosuppressive TME, both in terms of negative correlation with the abundance of infiltrating CD8+ T cells and in terms of the fact that patients with high USP35 expression may benefit less from immunotherapy than those with low USP35 expression.
Conclusion: Deubiquitinating enzymes are of great importance in the diagnosis and treatment of SKCM, and USP35 is an extremely promising target for immunotherapy.
Keywords: skin cutaneous melanoma, deubiquitinating enzymes, USP35, immunotherapy
Introduction
As one of the most aggressive malignancies, skin cutaneous melanoma (SKCM) is characterized with insidious pathogenesis, metastasis and poor response to treatment, accounting for 80% of all deaths from skin tumors.1 Most patients have developed distant metastases before diagnosis, and the 5-year survival rate of patients with metastasis is lower than 25% due to the limited availability of effective treatments and therapeutic agents in the late stages.2,3 At present, the immunotherapy and the latest molecular targeted therapies have been approved for metastatic SKCM.4,5 For example, Ipilimumab, an anti-Cytotoxic T-lymphocyte antigen-4 (CTLA-4) monoclonal antibody, has been approved for the treatment of unresectable/metastatic SKCM.6,7 However, not all patients derive benefits, the individual differences can be significant and their treatment response varies.8 Therefore, research on the molecular mechanisms involved in the development of SKCM is key to finding early diagnostic criteria and effective therapeutic approaches. The regulation of cellular signaling networks plays an important role in the development, progression, recurrence and metastasis of SKCM, and the detection and targeting of key molecules in the signaling pathway is expected to be an effective means of overcoming SKCM.
The protein abundance in tumor cells is regulated by transcriptional, translational and post-translational modifications, as well as being closely linked to its own metabolic degradation.9,10 Recent studies have shown that the level of ubiquitination of critical oncogenic proteins, including oncogenic transcription factors, is significantly reduced in tumor cells.11–13 This indicates that the increase in carcinogen abundance in tumor cells may be the result of the abnormally active process of de-ubiquitination caused by the up-regulation of the expression of de-ubiquitination enzymes (DUBs), which indicates that DUBs, which regulate carcinogens, play a vital role in tumor development and may be potential targets of SKCM.14,15
DUBs consist of six family members: the Ubiquitin Carboxy-terminal Hydrolases (UCHs), Ubiquitin-specific Proteases (USPs), Ovarian Tumor Proteases (OTUs), Machado-Joseph Proteases (MJDs), Jab1/Mov34/Mpr1 metalloproteases (JAMM) and the Motif Interacting with ubiquitin Containing DUB family (MINDYs).16 However, research on DUBs is still in the initial stage, let alone the development of effective and specific small-molecule inhibitors. The key problem is that the potential value of most DUBs in oncology is far from being clarified.
In our study, we obtained the SKCM patients gene expression profiles from The Cancer Genome Atlas (TCGA) and the Gene-Expression Omnibus (GEO) databases, and 116 DECGs were obtained from HUGO Gene Nomenclature Committee (HGAC) website. Patients with SKCM were classified into 2 subtypes based on the DECGs expression profile. USP35 was then selected by LASSO and Cox regression to further analyze the possible mechanisms of deubiquitination in SKCM. We further explored the diagnosis and prognosis value, biological and immunological function of USP35. Finally, we identified USP35 as a potential immunosuppressive factor and a promising therapeutic target in SKCM.
Materials and Methods
The Research Flowchart
The research flowchart demonstrated our study design (Figure 1). We performed consensus clustering of 469 cases from TCGA-SKCM to classify SKCM patients into 2 subtypes to detect the potential role of deubiquitination processes in the development of SKCM. Subsequently, based on LASSO and Cox regression, USP35 was identified as an independent prognostic factor and IHC was used to validate its diagnostic value. Then, we analyzed the potential function of USP35 in pigmentation and immune microenvironment, and confirmed the immunosuppressive role of USP35. Finally, we analyzed the pathogenic role of USP35 in SKCM from the perspective of genomic alterations.
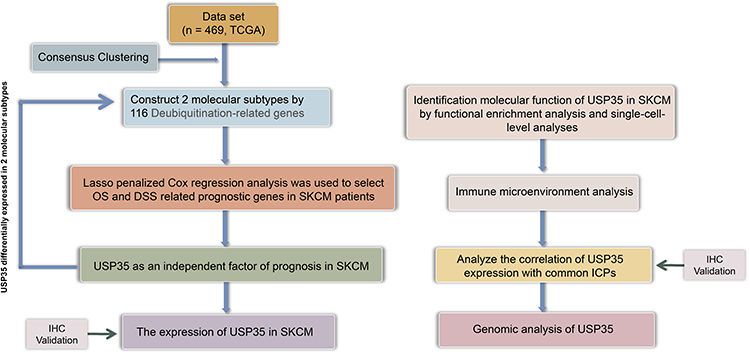 |
Figure 1 The search process is shown in this flowchart. |
Sample Collection and Immunohistochemical Staining (IHC)
The use of specimens was carried out with the informed consent of the patients in accordance with the principles of the Declaration of Helsinki. Our research was approved by the Ethics Committee of Jiangsu Province Hospital of Chinese Medicine (2019-NL-119-02). All patient records/information was anonymised and de-identified prior to analysis. Each sample was collected frozen and immediately stored in liquid nitrogen. Inclusion criteria: (1) All patients were diagnosed as SKCM for the first time by pathology. (2) The diagnosis was referenced in the latest (8th edition) American Joint Committee on Cancer (AJCC) SKCM staging system.17 (3) Patients with SKCM who were hospitalized in the Department of Dermatology of Jiangsu Provincial Hospital of Chinese Medicine from 2020-01-01 to 2021-12-31. Also, pathological specimens from each melanoma patient were kept for independent re-diagnostic confirmation by two doctors. (4) All patients had complete clinical information. Exclusion criteria: (1) Patients with a clinical diagnosis of a tumor that has metastasised to the skin from another site. (2) Exclusion of any other serious chronic disease or other visceral tumors. (3) Incomplete clinical data. Finally, a total of 30 patients with SKCM were analyzed.
IHC was performed on the paraffin-embedded tissue sections. According to the standard protocol,1 after incubation at 60°C for 10 minutes, the tissue sections were dewaxed twice in xylene for 10 minutes each, hydrated in decreasing grades of ethanol (100%, 90%, 75% and 50% ethanol for 5 minutes each), immersed in distilled water for 5 minutes and blocked for 1 h using 4.0% rabbit and 2.0% goat serum. Subsequently, the slides were incubated with 1:100 of primary antibodies (anti-USP35 (ab254939; Abcam, UK), anti-CD274 (ab210931; Abcam, UK), anti-CTLA4 (ab237712; Abcam, UK), anti-HAVCR2 (ab241332; Abcam, UK), anti-LAG3 (ab209236; Abcam, UK), anti-PDCD1 (ab52587; Abcam, UK), anti-PDCD1LG2 (ab288298; Abcam, UK), and anti-TIGIT (ab243903; Abcam, UK) overnight at 4°C. Three 10-min TBS washes were carried out, and the samples were incubated with 1:200 of secondary biotin-conjugated antibody for 2 hour. All slides contained duplicate sections from which one served as a control for secondary antibody-binding specificity. Micrographs were acquired by a NIKON Eclipse Ni-E microscope (original magnification, ×400) (NIKON, Japan). The extent and intensity of staining were assessed by two independent investigators with The H-SCORE (higher scores indicating stronger positive staining, range 0–300). Staining intensities were graded as 0 (none), 1 (weak), 2 (moderate), and 3 (strong). Staining extent was graded as 0 (no positively stained cells), 1 (less than 10%), 2 (10–50%), and 3 (over 50%). The H-SCORE, representing both the proportion of stained cells and the degree of staining, was determined as described in routine clinical trials.2
Cell Culture and Western Blotting
The melanotic melanoma cell-line MNT-1 and the amelanotic melanoma cell-line A375 were purchased from Professor Baorui Liu (Clinical Cancer Institute of Nanjing University, Nanjing, China). The use of these cell lines was approved by the Ethics Committee of Jiangsu Province Hospital of Chinese Medicine. They were cultivated in Dulbecco’s modified Eagle’s medium (DMEM) supplemented with 10% Fetal bovine serum (FBS). The normal Human Epidermal Melanocytes, HEMa-LP were purchased from Thermo Fisher Scientific (#C0245C, Thermo Fisher Scientific, US) and maintained in Medium 254 supplemented with Human Melanocyte Growth Supplement-2 (HMGS-2) (#S0025, Thermo Fisher Scientific, US). All the cells were maintained in a humidified 5% CO2 atmosphere at 37°C.
Cells were lysed in RIPA buffer, and protein concentration was measured using a BCA Assay Kit (#23227 Thermo Fisher Scientific, US). 20 μg proteins were electrophoresed by SDS-polyacrylamide gels and transferred onto a nitrocellulose membrane. The membrane was then blocked in non-fat milk for 1 h at room temperature and subsequently incubated with the primary antibodies overnight at 4°C. After washing with PBST (phosphate-buffered saline containing 0.05% Tween 20) for three or four times, the membrane was incubated with the secondary antibody for 1 hour at room temperature. Protein bands were visualized using the Odyssey Infrared Imaging System (Li-COR Biosciences). The antibodies used in this study were as follows: anti-USP35 (#PA5-116110, Thermo Fisher Scientific, US, 1:1000), β-actin (#PA5-85490, Thermo Fisher Scientific, US, 1:5000).
Public Data Acquisition
A total of 469 SKCM cases from the TCGA database (https://tcga-data.nci.nih.gov/tcga/), including gene expression profiles [fragments per kilobase million (FPKM) values], their clinical data and mutation data, were downloaded through the University of California, Santa Cruz (UCSC) browser (http://xena.ucsc.edu). The gene expression profiles (FPKM values) of the TCGA-SKCM dataset (https://portal.gdc.cancer.gov/projects/TCGA-SKCM) were processed through R software to transform into transcripts per kilobase million (TPM), which is closer to the microarray data. Since there are no normal tissue samples in TCGA, samples from Genotype-Tissue Expression (GTEx) database (https://www.gtexportal.org/home/datasets) were used as controls. We then selected the GEO datasets (https://www.ncbi.nlm.nih.gov/geo/) based on the following criteria: (1) samples in the dataset contained normal and tumor samples; (2) the dataset contained gene expression profile data; finally, the GSE15605 dataset containing 74 samples and the GSE114445 dataset containing 34 samples were selected. Gene expression data were extracted using R software (version 4.1.1), and data matrix was constructed for further analysis.
Establishment of Consistent Clustering Based on DECGs
The 116 DECGs were clustered on the basis of their expression profiles through the “consensus cluster plus” R package, and a consistency matrix was constructed to classify TCGA-SKCM cases into 2 subtypes. To ensure the stability and reproducibility of the classification, the partition around medoids algorithm using the “1-Pearson correlation” distance metric was repeated 1000 times. The number of clusters varies from 2 to 6, and the consistency matrix and the consistency cumulative distribution function (CDF) were evaluated together to determine the best classification.
Identification of SKCM-Independent Prognostic Factors in DECGs
Considering the existence of multicollinearity among the expression levels of DECGs, the LASSO algorithm was conducted for variable selection and shrinkage through the “glmnet” R package. The independent variable in the regression was the normalized expression matrix of 116 DECGs, and the response variables were overall survival and status of patients in TCGA-SKCM. Then, the univariate and multivariate Cox regression analyses were performed to assess the independent prognostic values of USP35 and ZC3H12D. The “forestplot” R package was conducted to visualize the forest plot representing the P-value, hazard ratio (HRs), and 95% confidence interval (CIs) of each variable.
Expression and Survival Curve Analysis of USP35
The relationship between USP35 RNA sequences and clinical profiles in TCGA was visualized through the MEXPRESS database (https://mexpress.be/index.html), Tumor Immune Estimation Resource (TIMER, https://cistrome.shinyapps.io/timer/) and Human Protein Atlas (HPA, https://www.proteinatlas.org/) were conducted to examine USP35 expression at the mRNA and protein levels, respectively, and GEO data including GSE15605 and GSE114445 were used to validate the differential expression results.
USP35-Correlated Gene Enrichment Analysis
The median cutoff of USP35 expression in TCGA-SKCM was used for defining the groups with high and low USP35 expression and the “DESeq” R package was used to obtain the genes co-expressed with USP35. The potential functions of USP35 were detected by enrichment analysis with the “clusterProfiler” R package. The protein–protein interaction (PPI) was generated using the STRING online database (http://string-db.org) and visualized using Cytoscape. The Cytoscape MCODE and cytoHubba plug-ins were used to search for hub genes and sub-networks, with default parameters being used as parameter settings.
Gene set enrichment analysis (GSEA) was performed through R 4.1.1 to explore the potential molecular mechanisms underlying USP35. The gene set “subset of Gene Ontology (GO)” was downloaded from the Molecular Signatures Databases and used as reference gene sets. The False Discovery Rate (FDR) <0.1 was considered to be with statistical significance.
Single Cell Analysis of USP35
In order to find more evidence on the function of USP35 at the single cell level, the HPA database and the TISCH database (http://tisch.comp-genomics.org) were used to detect the expression distribution of USP35 in normal skin tissue and malignant melanoma tissue, respectively. In addition, we also performed GSEA at the single cell level using TISCH to observe the correlation between the USP35 and TORC1 signaling.
Immune Analysis of USP35
The CIBERSORT algorithm was performed to assess the differences in immune cell infiltration levels between different groups.18 Furthermore, Gene Expression Profiling Interactive Analysis (GEPIA) web tool (http://gepia.cancer-pku.cn/) was used to estimate the correlations among different types of immune cells, and their influence on prognosis was also assessed reliably by survival analysis. Besides, TIMER was used to further evaluate the relationship between USP35 and immune cells through multiple algorithms, and GEO datasets were used to independently evaluate the difference in immune cell abundance at different USP35 levels. Pearson’s rank correlation coefficient was calculated for pairwise correlation comparisons and P < 0.05 was considered with statistical significance. All of the above results were visualized with the “ggplot2” and “pheatmap” packages.
Genetic Alteration and DNA Methylation Analysis of USP35
The frequency of USP35 gene alterations in several SKCM studies was analyzed through the cBioPortal database (https://www.cbioportal.org/). The data on genomic alteration type, mutant site distribution, OS (Overall Survival) and D/PFS (Disease/Progression-free survival) analysis were provided. The correlation between Copy Number Variant (CNV) and USP35 expression levels was analyzed by Pearson’s test. The overall survival analysis based on different CNV status of USP35 gene was performed by UCSC Xena (https://xena.ucsc.edu/) with Log rank test.
The DNA methylation status of USP35 in SKCM cases in the TCGA-SKCM cohort was assessed by MEXPRESS. Pearson’s test was used to determine the correlation between methylation and USP35 gene expression levels. We determined correlation coefficients (R) and Benjamini-Hochberg adjusted P values for different methylation probes, including cg19972312 and cg18207410. Waterfall plots of the USP35 gene methylation level and Kaplan–Meier plots of the relationship between USP35 DNA hypermethylation/hypomethylation and SKCM patients survival were generated through the MethSurv web tool (https://biit.cs.ut.ee/methsurv).
Results
Identification and Analysis of Molecular Subtypes of Cutaneous Malignant Melanoma
A total of 116 DECGs were included in the study, including members of the Ubiquitin Carboxy-terminal Hydrolases (UCHs), Ubiquitin-specific Proteases (USPs), Ovarian Tumor Proteases (OTUs), Machado-Joseph Proteases (MJDs), Jab1/Mov34/Mpr1 metalloproteases (JAMM) and the Motif Interacting with ubiquitin Containing DUB family (MINDYs). Figure 2A shows a common PPI from STRING database based on the interactions among all 116 genes, whose functional enrichment analysis showed that they are mainly enriched in deubiquitination pathway (Figure 2B). To identify potential molecular subtypes of SKCM, we classified 469 TCGA-SKCM cases by consensus clustering analysis. All the tumor samples were classified into k (k = 2–6) different subtypes based on the expression levels of 116 DECGs in SKCM. Based on the consensus score, the Cumulative Distribution Function (CDF) curve reached optimal segmentation efficiency when k = 2, and the relative change in the area under the CDF curve when divided into 2 subtypes indicated a near-perfectly stable distribution of SKCM patients (Figure 2C and D). Subsequently, the results of the cluster analysis showed that k = 2 was the optimal number of clusters, with the highest intra-group correlation and low inter-group correlation, indicating that SKCM patients were accurately classified into two subtypes (C1 and C2 clusters) (Figure 2E). Principal component analysis (PCA) showed that the classification was effective in distinguishing between two subtypes of SKCM patients (Figure 2F) and Kaplan–Meier survival analyses showed that C1 patients had worse overall survival rates relative to C2 patients (Figure 2G). In addition, Figure 2H and I showed the gene expression profiles based on both subtypes and the correlation between the distribution of clinicopathological parameters, such as T/N/M staging with the two subtypes. The T staging is mainly based on tumor size, N staging on the swollen regional lymph node and metastasis, and M staging on the distant metastasis of the tumor. Immune assessment based on the CIBERSORT algorithm showed significant differences in the infiltration abundance of B cell plasma, T cell CD4+ memory resting, T cell regulatory, T cell gamma delta, and Macrophage M1 between the two subtypes (Figure 2J, P < 0.05). Interestingly, we also observed that the levels of immune checkpoint genes expression including CD274, PDCD1LG2, and TIGIT, were significantly lower in the C1 subtype compared to the C2 subtype, which had a better prognosis (Figure 2K, P < 0.05).
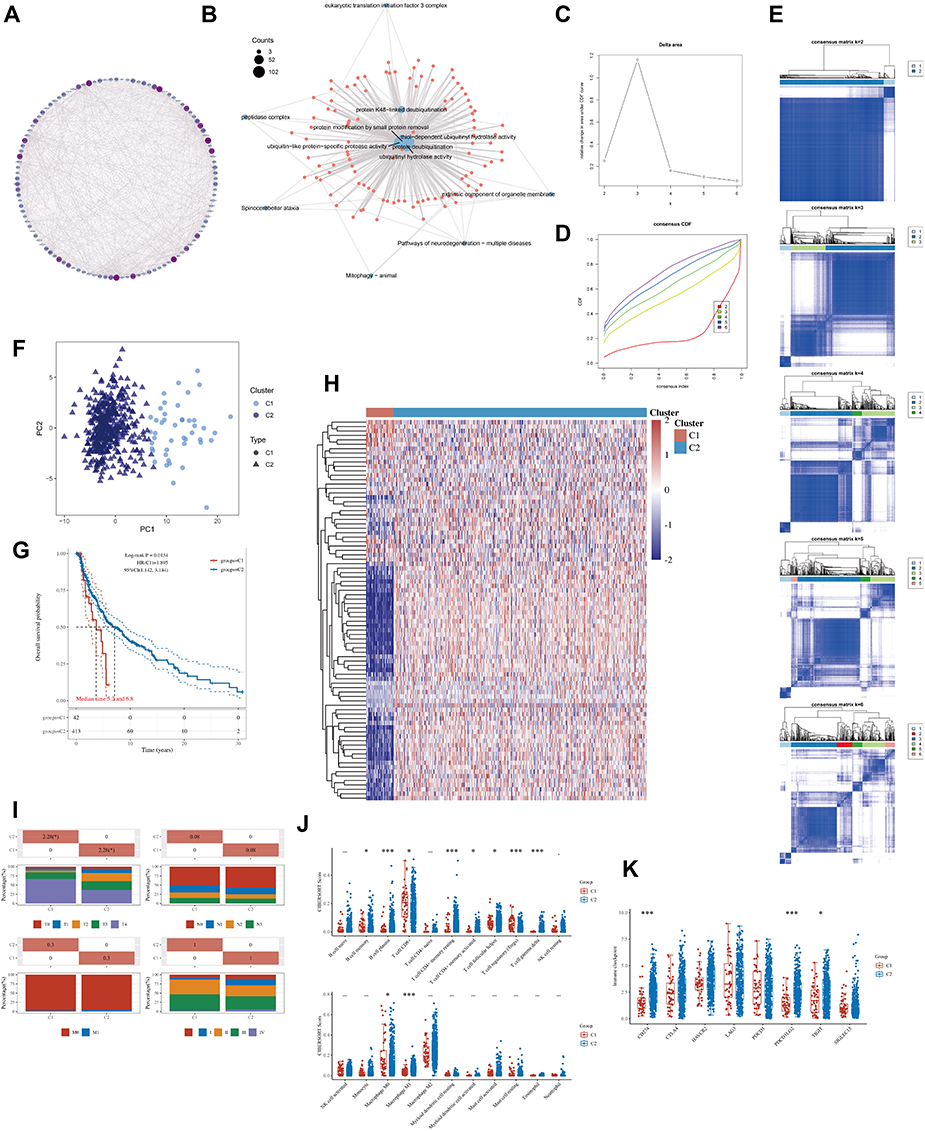 |
Figure 2 The landscape of deubiquitination-related genes in melanoma and the immune characteristics of two subtypes. (A) Protein- protein interaction (PPI) of the deubiquitination-related genes. The color and size of nodes are proportional to their degree. (B) The “clusterProfiler” R package was used for the enrichment analysis. (C) The cumulative distribution function (CDF) curves in consensus cluster analysis. CDF curves of consensus scores by different subtype numbers (k = 2, 3, 4, 5, and 6) were displayed. (D) Relative change in area under the CDF curve for k = 2–6. (E) The consensus score matrix of all samples when k = 2–6. (F) The PCA distribution of TCGA-SKCM samples by expression profile of deubiquitination related-gene. Each point represents a single sample; different colors represent the C1 and C2 subtypes respectively. (G) Survival analysis based on two subtypes. (H) Expression distribution of 116 deubiquitination-related genes between two subtypes. (I) Distribution of clinical characteristics of two subtypes, including T, N, M stages. (J–K) Differences in the abundance of immune cell infiltration (J) and immune checkpoints levels (K) between C1 and C2 subtypes. (*P < 0.05, ***P < 0.001). |
Identification of USP35 and ZC3H12D as Independent Prognostic Factors in SKCM Patients
To further identify potential independent prognostic factors in 116 DECGs, LASSO and Cox regression were used jointly. Cross-validation was performed in ten rounds to prevent overfitting (Figure 3A and B). Cox regression analysis was carried out sequentially and USP35 as well as ZC3H12D expression can serve as independent prognostic factors for SKCM patients both in OS and Disease Specific Survival (DSS) (Figure 3C, P < 0.05). Kaplan–Meier survival curves were then constructed to validate the prognostic value of USP35 as well as ZC3H12D and the results showed that patients with higher USP35 expression level had shorter OS and DSS, while patients with higher ZC3H12D expression showed the opposite trend (Figure 3D–E). Finally, the results showed that the expression level of USP35 was significantly upregulated in C1 than in C2, while that of ZC3H12D showed the opposite result (Figure 3F).
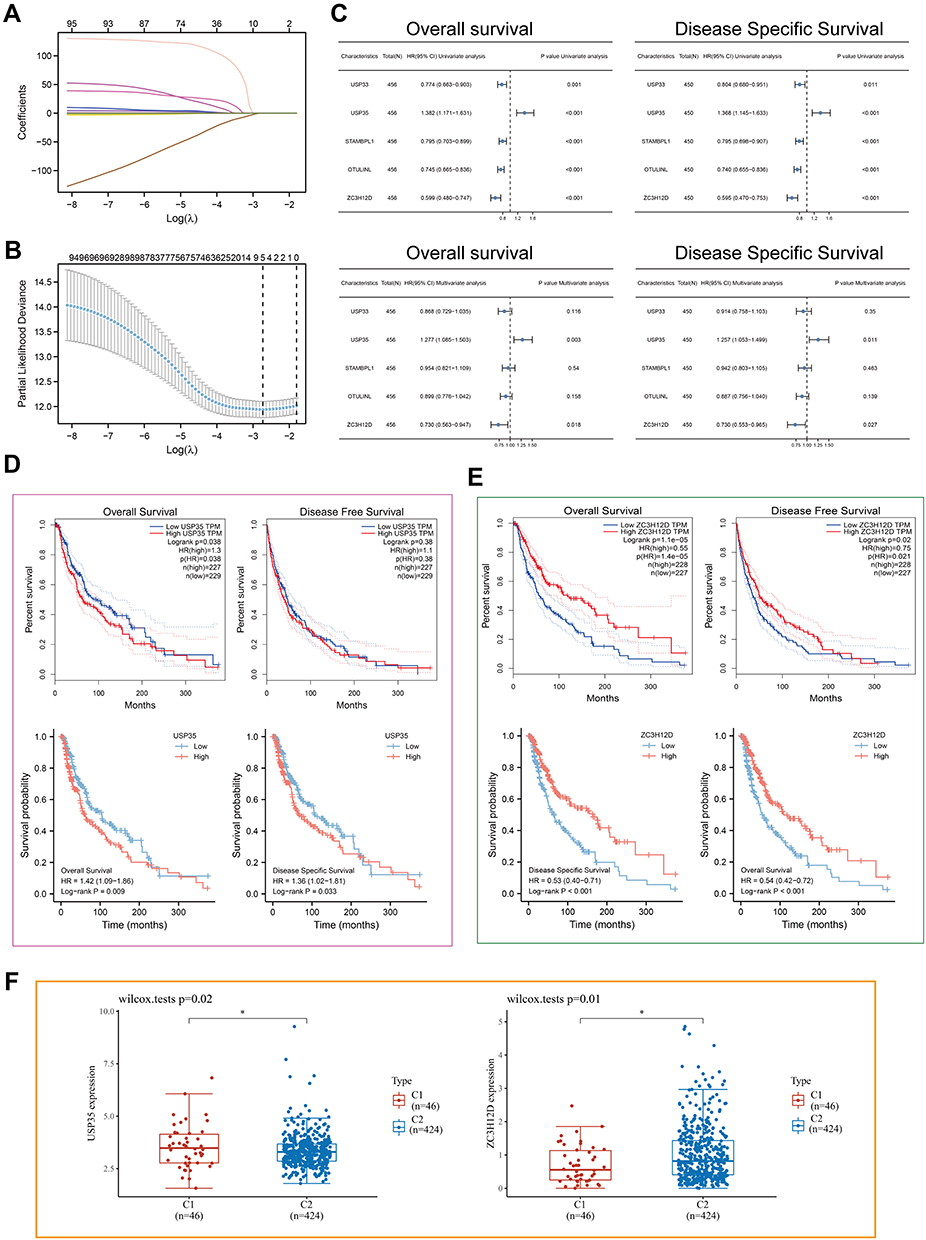 |
Figure 3 LASSO-Cox analysis and survival analysis. (A) least absolute shrinkage and selection operator model (LASSO) fitting. Each curve represents a gene. The profiles of coefficients were plotted versus log(λ). Vertical lines indicate the positions of seven genes with coefficients greater than 0 determined by 10-fold cross-validation. (B) λ was determined from 10-fold cross-validation. The x-axis represents log(λ); the y-axis represents binomial deviance. Optimal values calculated from minimum criteria and one standard error of the criteria are indicated by the dotted vertical lines. (C) Univariate and multivariate forest plot showing association between 5 candidate genes expression and OS/DSS in TCGA-SKCM. (D and E) The OS, DFS and DSS from the TCGA-SKCM data in relation to USP35 (D) and Z3CH12D (E) expression. (F) Differential expression of USP35 and Z3CH12D between C1 and C2 subtypes. (*P < 0.05). |
Expression Analysis of USP35
First, the role of USP35 in SKCM was generally assessed. In cases from MEXPRESS categorized based on different clinical factors, including melanoma Clark level value, Breslow depth value, tumor stage, sample type, and new tumor occurrence, USP35 displayed the differences in expression patterns (Figure 4A, P < 0.05). Figure 4B shows that the differential expression of USP35 in 32 types of cancers and USP35 was significantly upregulated in the majority of cancer types (P < 0.05). Analysis based on the TCGA-SKCM and GTEx dataset showed that USP35 was significantly overexpressed in malignant melanoma tissues compared to normal tissues at the mRNA level (Figure 4C) and consistent results were also found in two independent datasets from the independent datasets GSE114445 and GSE15605 (Figure 4D, P < 0.01). We further analyzed the protein expression of USP35 using the immunohistochemical data from the HPA database (Figure 4E). The results of independent calculations based on TCGA-SKCM showed that the USP35 expression level was significantly and positively correlated with Breslow depth value, which was consistent with the results of MEXPRESS (Figure 4F, P < 0.05). In addition, we observed that in normal skin tissues, USP35 was predominantly expressed on T cells (Figure 4G and H). Finally, 30 samples from our hospitals were tested to confirmed USP35 protein was highly expressed in tumor tissues (Figure 4I, P < 0.05).
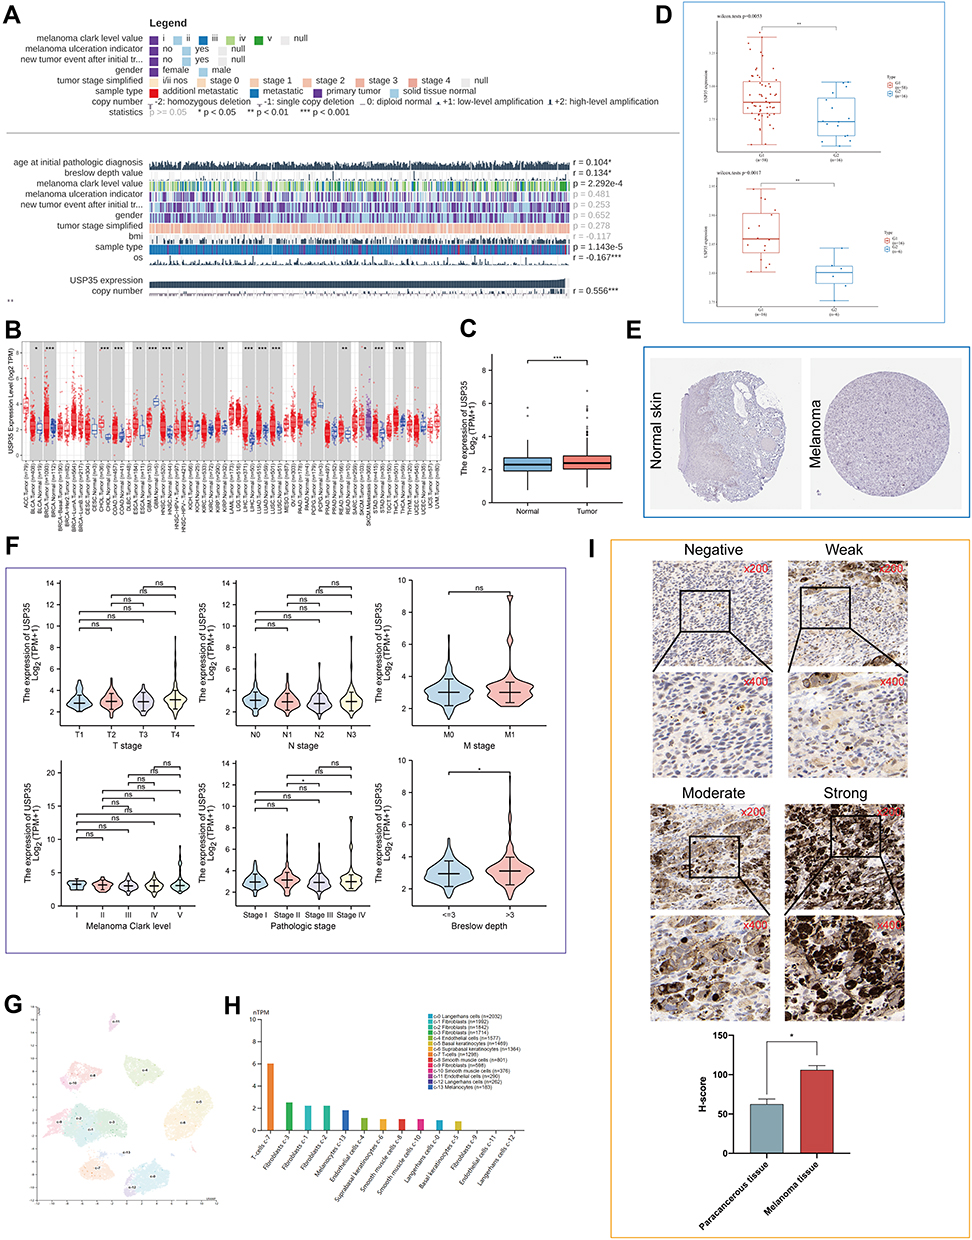 |
Figure 4 Expression analysis of the USP35 gene in SKCM and normal control samples. (A) Correlations between USP35 level and clinicopathological characteristics. (B) Expression of USP35 in pan-cancer. (C) Expression level of USP35 between SKCM tissues in the TCGA-SKCM cohort and control tissues in both the TCGA and GTEx databases. (D) Dataset GSE15605 and GSE114445 from GEO showing USP35 mRNA levels in SKCM. (E) Representative immunohistochemistry images of USP35 in SKCM and noncancerous skin tissues derived from the HPA database. (F) Association of USP35 mRNA expression with T/N/M stages, Clark level, pathologic stages, and Breslow depth in SKCM patients. (G and H) Distribution of USP35 expression in normal human skin at a single cell level. (I) Representative images of different immunohistochemical staining intensities for USP35 based on our own samples and statistical comparison of USP35 expression levels (H-SCORE) in paracancerous and SKCM tissue (n = 30) (* P < 0.05, ** P < 0.01, *** P < 0.001). |
Function Analysis of USP35
The gene co-expressed with USP35 was obtained in TCGA-SKCM and shown in Figure 5A. A total of 471 differentially expressed genes (DEGs) identified by the median expression level of USP35 were collected into the STRING database, and then further analyzed by cytoHubba, a Cytotype plug-in, which proved that CD4, CD8A and PTPRC were the 3 central genes with the highest score (Figure 5B). The constituent members of the key sub-network contained a large number of immune-related genes including PDCD1, CD8A, CD86, CD4 and so on (Figure 5C). Functional enrichment analysis based on the subnetwork showed a close connection with immune activation (Figure 5D). Total enrichment analysis showed that USP35 may be extensively involved in melanogenesis, pigmentation, T cell activation and other processes (Figure 5E). GSEA suggested that USP35 was significantly positively correlated with “melanogenesis”, “TORC1 signaling pathway activation”, and negatively correlated with “T cell activation”, “macrophage activation” (Figure 5F and G). A single cell analysis based on the GSE72056 dataset showed that cells expressing USP35 were mainly malignant cells and enriched for MTORC1 signaling-related genes, which was consistent with previous enrichment analysis (Figure 5H–K). Considering the important function of TORC1 signaling in pigment formation, we finally compared the protein levels of USP35 in HEMa-LP, A-375 and MNT-1 cell lines, and found that MNT-1 (hyperchromatic cells) had the highest USP35 expression levels (Figure 5L).
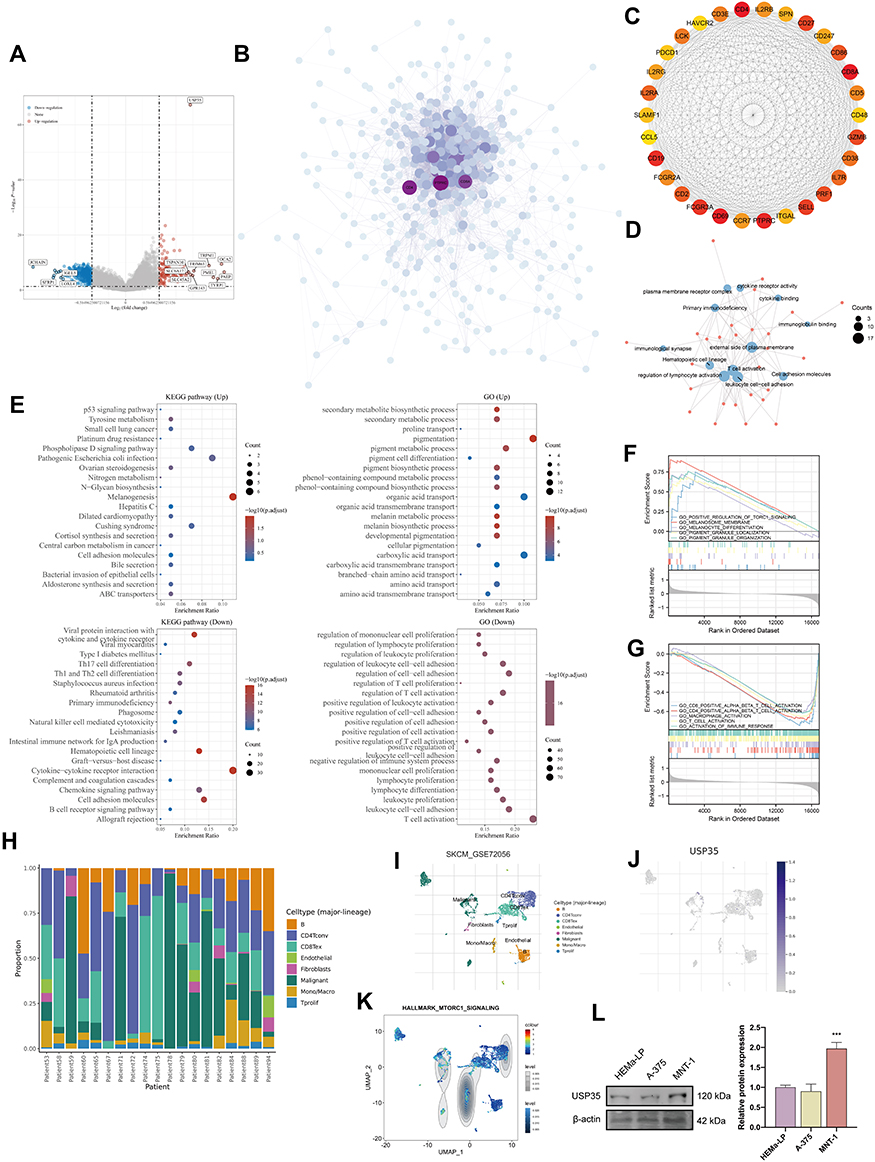 |
Figure 5 Function analysis of USP35. (A) Volcano map of differentially expressed genes after altered USP35 levels. Red indicates up-regulation, blue indicates down-regulation. Data on the abscissa are differences in gene expression (log2 fold change); data on the ordinate represent the significance of these differences (−log10 padj). (B) Network of USP35 and genes significantly correlated with its expression. Darker colors and larger sizes indicate higher degrees. (C) The hub module with the highest scores analyzed by Molecular Complex Detection (MCODE). (D) GO enrichment analysis of the module. (E) GO and KEGG enrichment analysis of USP35. (F and G) Gene Set Enrichment Analysis (GSEA) of USP35 high expression level group (F) and USP35 low expression level group (G). (H–K) Single-cell analysis of USP35 based on single cell RNA-seq dataset GSE72056. (H) Cellular components; (I) Uniform Manifold Approximation and Projection (UMAP) plots showing different SKCM cell types after quality control, reduction of dimensionality, and clustering; (J) UMAP plots showing expression of USP35 clusters; (K) Enrichment scores of genes from the Hallmark TORC1 signaling gene set for each cell, from gene set variation analysis; (L) Differential expression of USP35 in melanotic, amelanotic melanoma cells and normal epidermal melanocytes. (***P < 0.001). |
Immune Analysis of USP35
Considering that enrichment analysis indicated that USP35 might be a potential immunosuppressive factor, we sought to explore possible molecular mechanisms through immune cell infiltration during the etiology of SKCM. First, we analyzed the association between USP35 gene expression and 22 types of immune cell infiltration levels, and found that the infiltration abundance of 7 types of immune cells were significantly correlated with the expression level of USP35 (Figure 6A, P < 0.05). Then, results from GEPIA web tool suggested that low infiltration abundance of “T cells CD8+”, “Macrophages M1”, “T cells CD4+ memory activated”, correlated with an unfavorable prognosis of SKCM patients (Figure 6B, P < 0.05), and we also noted that the infiltration abundance of these three immune cells was positively correlated with each other (Figure 6C–E), indicating these three types of cells may play important roles in the progress of SKCM together. Subsequently, 6 algorithms (including TIMER, QUANTISEQ, MCPCOUNTER, CIBERSORT, CIBERSORT-ABS, and EPIC) were conducted for further immune infiltration estimations. As shown in Figure 6F, we observed a negative correlation between USP35 expression and the immune infiltration levels of “CD8+ T cells”, “macrophages M1”, and “T cells CD4+ memory activated” when adjusted by tumor purity. In order to ensure the reliability of the results, we further confirmed that patients with higher USP35 expression had lower levels of CD8+ T cells infiltration based on GSE114445 and GSE15605 (Figure 6G–I). Finally, calculations based on three independent data sets showed that USP35 expression levels were significantly negatively correlated with most markers of the three immune cells (Figure 6J).
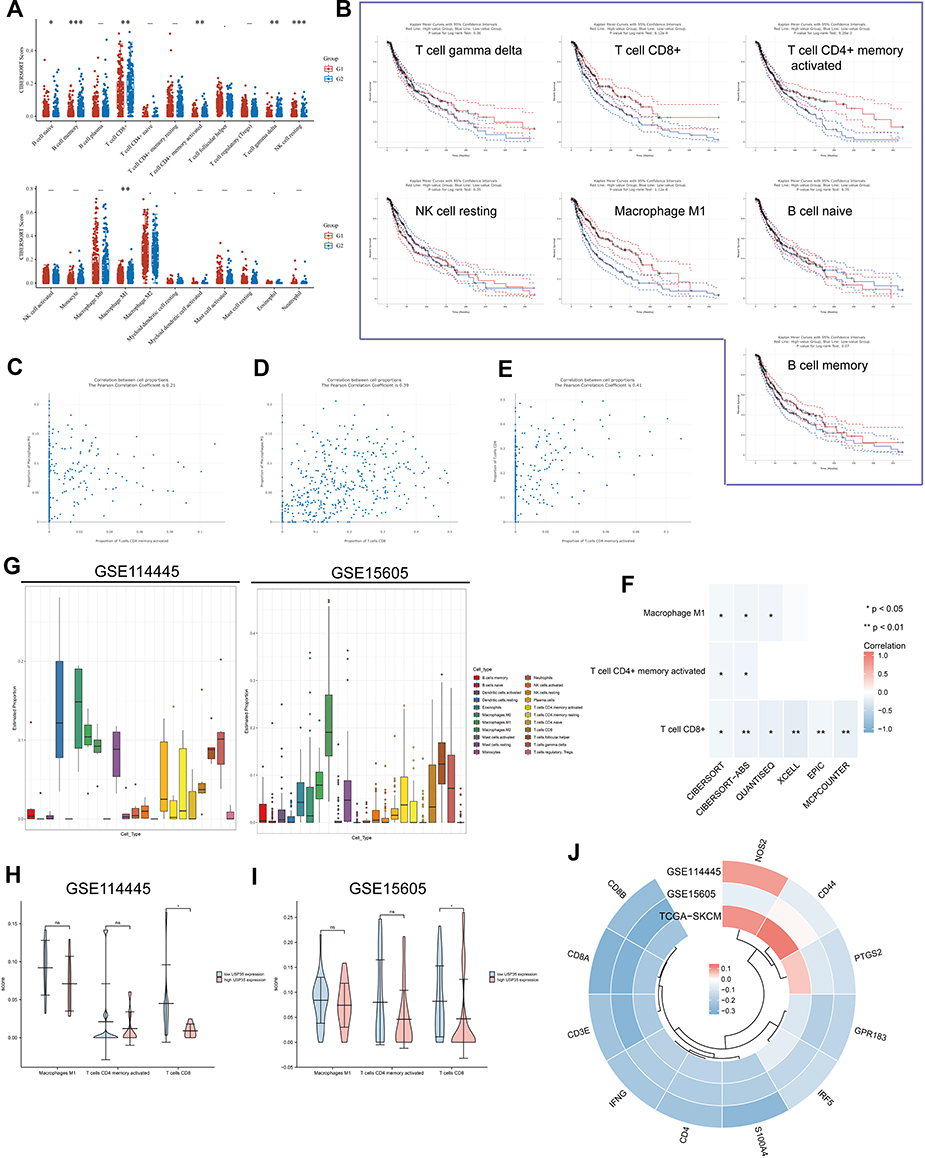 |
Figure 6 Relationship between USP35 levels and the abundance of immune cell infiltration. (A) Score distribution of immune cells in SKCM tissues and normal tissues, where the horizontal axis represents different groups of samples, the vertical axis represents the gene expression distribution, G1 represents the USP35 high expression group, and G2 represents the USP35 low expression group. P-values are indicated in the upper left corner and asterisks represent the level of significance. (B) Prognostic value of immune cells with statistically significant differences in abundance in SKCM. (C–E) Pearson correlation coefficients between T cells CD8+, T cells CD4+ memory activated, Macrophages M1 infiltration abundance. (F) Correlation results between USP35 levels and three types of immune cells based on five algorithms. (G) Proportion of 22 types of immune cells in SKCM samples based on GSE114445 and GSE15605 data. (H and I) Correlation between USP35 expression levels and three types immune cells abundance based on GSE114445 (H) and GSE1560 (I) data. (J) Circos plot shows the correlation between 3 marker genes from three types immune cells and USP35 level in SKCM samples based on three independent datasets. (NS: not significant, *P < 0.05, **P < 0.01, ***P < 0.001). |
To further elucidate the role of USP35 in immunotherapy represented by immune checkpoints (ICPs), we extended our analysis to the association between USP35 and 7 well-known ICP coding genes. In the TCGA-SKCM cohort, USP35 expression was found to be negatively correlated with CD274, HAVCR2, LAG3, PDCD1, PDCD1LG2 and TIGIT expression (Figure 7A), and the results from GSE30784 and GSE41613 were consistent (Figure 7B and C). The IHC staining based on clinical samples further confirmed the negative correlation between USP35 and CD274, CTLA4, LAG3, PDCD1, TIGIT, at the protein level (Figure 7D–J, P < 0.05).
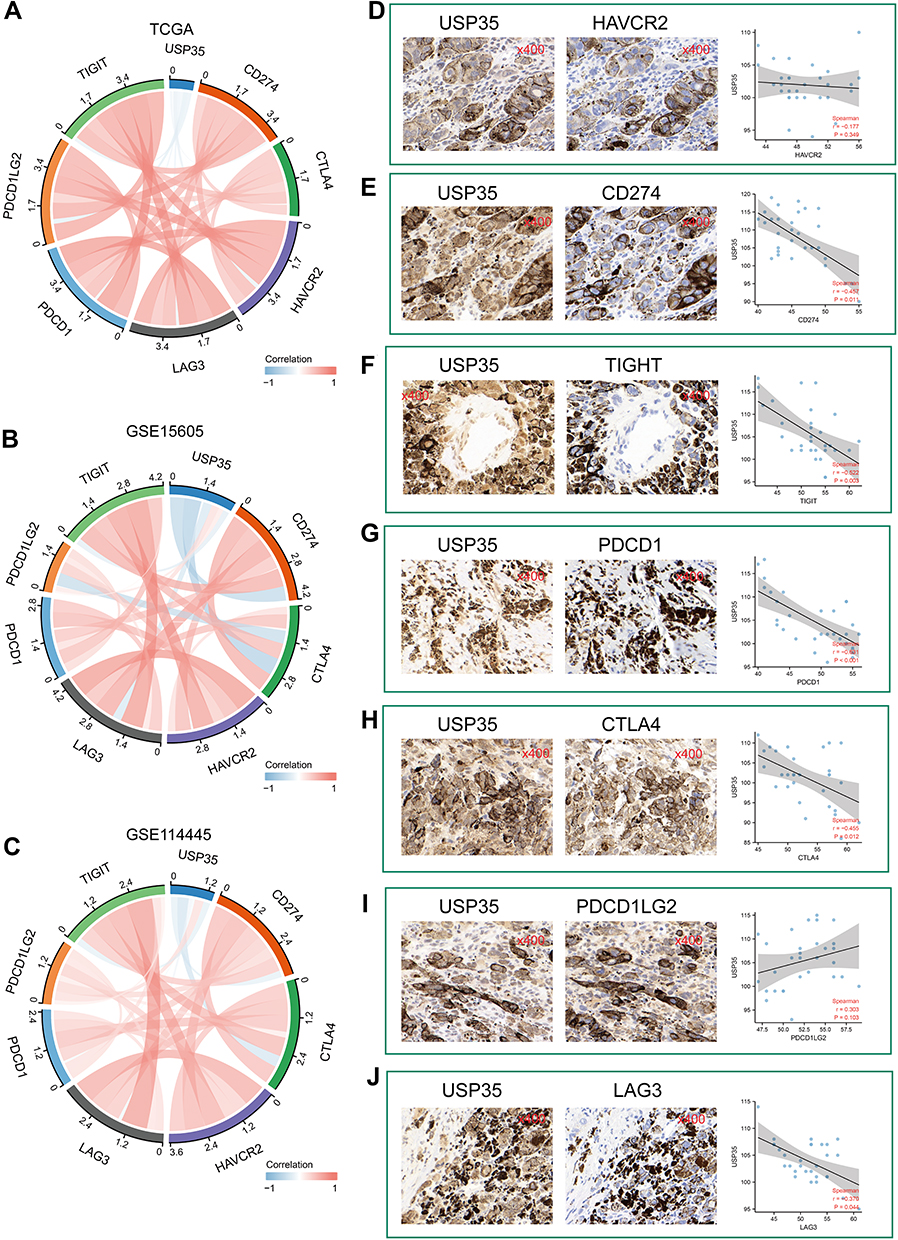 |
Figure 7 Significance of USP35 levels in immunotherapy. (A–C) The mRNA expression of USP35 is negatively correlated with immune checkpoint molecules expression level in TCGA-SKCM (A), GSE15605 (B), and GSE114445 (C). (D–J) Correlation between IHC staining intensity for USP35 and IHC staining intensity for immune checkpoint molecules in SKCM tissues (n = 30). Measures were taken from different samples. |
Genetic Alteration and DNA Methylation Analysis of USP35
Here, we attempted to investigate the potential mechanism of USP35 in melanoma carcinogenesis, in terms of mutation, CNV and DNA methylation. We first detected the alternation frequency in all cases from 10 melanoma groups through the cBioPortal database (Figure 8A). Overall, we observed the presence of USP35 mutations and amplifications in a significant proportion of melanoma patients. When it comes to the specific mutation type and location, the most common missense mutation is R610/del (n = 2), as shown in Figure 8B. In addition, we observed a statistically significant correlation between USP35 alternation and DSS rate (Figure 8C) and Disease-free survival (DFS) rate (Figure 8D, P < 0.05), while there was no significant correlation with DFS rate (Figure 8E, P > 0.05). We then further evaluated the effect of CNVs on USP35 expression levels and observed that USP35-amplified SKCM patients had high USP35 expression levels (Figure 8F and G, P < 0.001) and, in addition, there was a significant association between USP35 CNVs and the OS rate as well as PFS rate of melanoma cases (Figure 8H and I, P < 0.05). We also examined the correlation between USP35 CNVs and the overall level of immune cell infiltration, and found that the copy amplification type of USP35 CNV correlated with the low levels of CD8+ T cell infiltration (Figure 8J, P < 0.01).
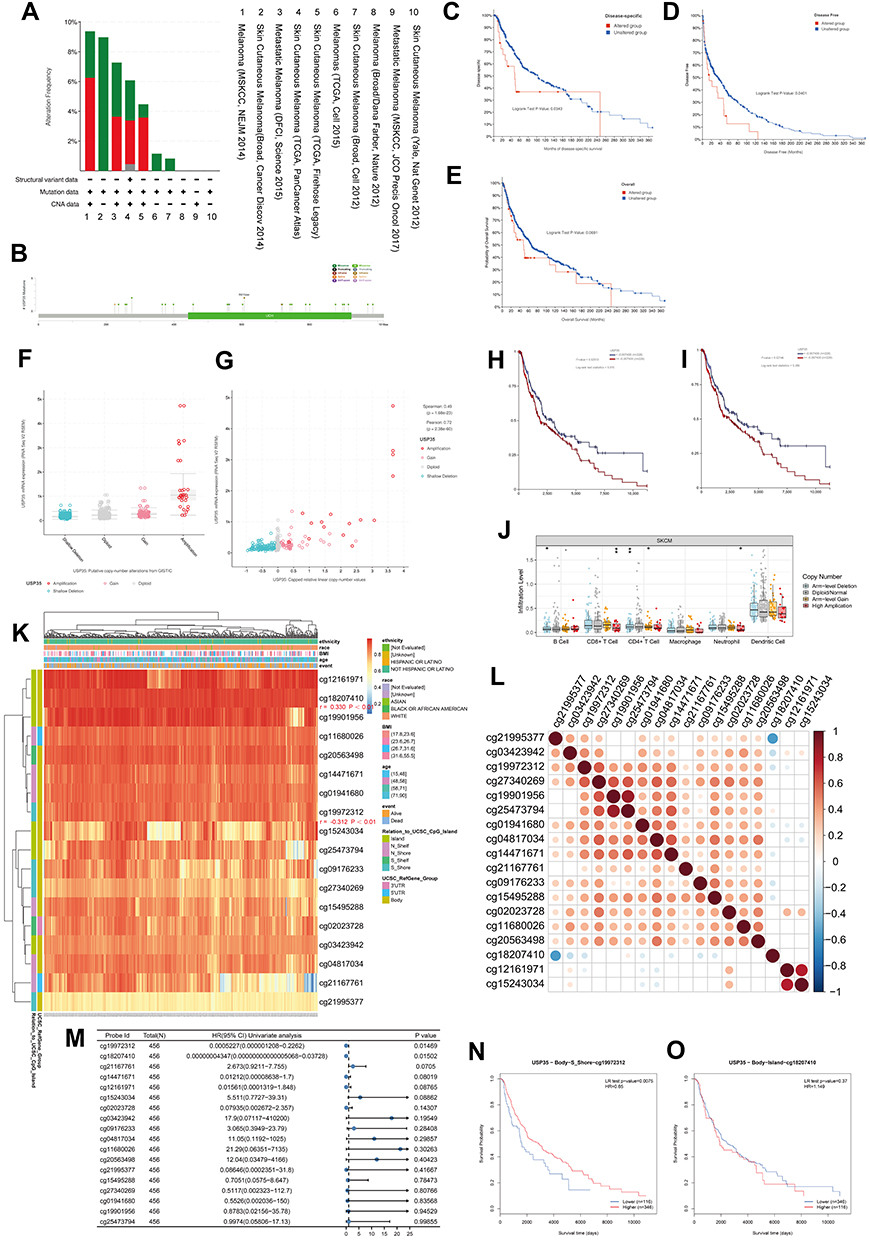 |
Figure 8 Genomics and DNA methylation analyses of the USP35 gene. (A) The alteration frequency of the USP35 gene for the cases in several studies was analyzed through cBioPortal. (B) The mutation site profile of the USP35 gene is shown. (C–E) OS and D/PFS analyses according to the mutation status of the USP35 gene were performed. (F) Deletion, diploid, copy number gain and amplification are involved in the deregulation of USP35. (G) Correlation between USP35 CNVs and mRNA expression. (H and I) OS (H) and PFS (I) analysis according to different CNVs status of the USP35 gene was performed. (J) The CNVs of USP35 are negatively correlated with the level of CD8+T cell in TCGA-SKCM based on TIMER2 database. (*P < 0.05, ⁑P < 0.01) (K) A waterfall plot about the methylation level of the USP35 gene is provided. (L) Correlation between all methylation probes. (M) Univariate regression analysis based on the degree of methylation of all methylation probes. (N and O) Survival analysis of two methylation probes that can be used as independent prognostic factors. (N) cg19972312; (O) cg18207410. (*P < 0.05, **P < 0.01). |
Next, we aimed to investigate whether the USP35 gene was closely linked to USP35 DNA methylation. A heat map based on methylation data from TCGA-SKCM is presented in Figure 8K, and we observed that the methylation values from cg18207410 and cg19972312 probes were positively and negatively correlated with the USP35 gene levels, respectively (P < 0.01). Pearson coefficients were used to quantify the correlation among all methylation probes (Figure 8L). We finally identified 2 probes that could serve as independent prognostic factors by Cox regression (Figure 8M, P < 0.05) and survival analysis based on cg19972312 and cg18207410 further showed that the methylation level of cg19972312 was positively correlated with the OS rate of SKCM patients (Figure 8N and O, P < 0.01).
Discussion
Protein deubiquitination, the reverse process of ubiquitination, is accomplished by DUBs that contribute to the removal of ubiquitin from target proteins and are involved in the maturation, recycling and editing of ubiquitin.19,20 One of the important roles of DUBs is to regulate tumor progression.21 There have been numerous reports showing that members of DUBs are highly elevated in various cancer cells and tissues at different stages of cancer.22,23 This suggests that DUBs could be used as drug targets for cancer therapy.
In this study, we classified melanoma patients based on the gene expression profiles of six DUBs family members in TCGA-SKCM and identified two molecular subtypes. Patients with the C1 subtype had shorter overall survival compared to those with the C2 subtype, suggesting that there may be some biological differences between our two molecular subtypes. It is widely known that ubiquitination modulates pattern recognition receptor signaling and is involved in regulating T cell development, activation and differentiation, thus maintaining an efficient adaptive immune response to pathogens and immune tolerance to self-tissue.24,25 We therefore assessed the abundance of immune cell infiltration between the two molecular subtypes using CIBERSORT and found significant differences between them. Interestingly, we also found that patients with the C1 subtype had lower levels of immune checkpoints than the C2 subtype, suggesting that patients with the C1 subtype had more difficulty benefiting from immunotherapy. Subsequently, LASSO combined with Cox regression showed that USP35 and ZC3H12D were independent prognostic factors, and USP35 was highly expressed in C1 subtype, while ZC3H12D was highly expressed in C2 subtype. Based on these studies, we hypothesized that USP35 and ZC3H12D have great research value. Considering that ZC3H12D has been reported in melanoma, while USP35 has not been reported, we next further analyzed the potential value of USP35 in SKCM.
We first examined the value of USP35 as a diagnostic indicator and found that its expression level was significantly higher in tumor tissues than in normal tissues. In addition, the expression level of USP35 was found to be significantly positively correlated with the Breslow depth value, an indicator currently considered to be the most important prognostic factor for melanoma.26 Depending on the lesion depth, 10-year survival rates of SKCM patients varied considerably.27 In order to explore the possible mechanisms involved in the malignant progression of melanoma, we pooled USP35 expression-related genes to construct PPI and used it for subsequent enrichment analysis. We identified CD4, PTPRC, and CD8A as hub genes using the Maximal Clique Centrality (MCC) algorithm, notably all three were key regulators of immune cell signaling, whose dysfunction may lead to autoimmunity, immunodeficiency, and malignancy. Enrichment analysis further showed that USP35 levels were positively correlated with “melanogenesis” and “TORC1 signaling activation”, while negatively correlated with “T cell activation” and “macrophage activation”. It is well established that melanogenesis plays a key role in melanocyte physiology as well as in the establishment/progression of melanoma;28,29 therefore, melanogenesis-related markers may be useful in studying the biological mechanisms associated with melanotic lesions. TORC1 signaling is a downstream effector of the PI3K/AKT pathway,30 and alterations in the major components of TORC1 signaling have been widely reported to have a significant effect on tumor progression in many types of cancer,31,32 especially in melanoma,33,34 and we found that malignant cells expressing USP35 were closely associated with TORC1 signaling by a single-cell level analysis. Nanao Horike et al identified mRNA and protein expression in all TORC1 isoforms in murine B16 melanoma cells and suggested that TORC1 signaling could induce melanogenesis. In the present study, we found significantly elevated levels of USP35 in melanotic cells relative to amelanotic cells, suggesting that USP35 may influence the regulation of pigment levels in malignant melanoma and drive malignant progression of melanoma through an interaction with TORC1.
Considering that the results of the enrichment analysis suggested that USP35 may have potential immunosuppressive effects, we proceeded to analyze the association between USP35 and the immune microenvironment. The abundance of a total of seven immune cells was found to correlate significantly with USP35 levels, and three of these immune cells, including “Macrophage M1”, “T cell CD8+”, and “T cell CD4+ memory”, were identified to be strongly associated with the prognosis of SKCM patients. According to the available reports and our calculations, the infiltration levels of these three cells were positively correlated, among which there is a co-activating (co-inhibiting) relationship. Subsequent calculations based on two additional independent datasets and multiple immune assessment algorithms confirmed that USP35 levels were significantly negatively correlated with CD8+ T cell infiltration abundance and were mostly negatively correlated with the surface markers of the three immune cells (“Macrophage M1”, “T cell CD8+”, and “T cell CD4+ memory”). Numerous studies have found that the number and activity of lymphocytes in tumor tissue correlate with immunotherapy efficacy: the higher the number of lymphocytes, the better the efficacy.35–38 A recent study found that T cells in the peripheral blood of patients that are effective for immunotherapy are consistent with CD8+ T cells in tumor tissue and have the potential to be a biological predictor of patient outcome and prognosis.39,40 Jiawen Zhang et al demonstrated that USP35 expression was higher in breast cancer tissues compared to normal tissues, and further observed that the protein level of USP35 negatively correlated with the level of CD8+ T cell infiltration after IHC staining, hypothesizing that USP35 is an important factor in the poor prognosis of breast cancer. Further studies revealed that USP35 overexpression decreased the activation of STING-TBK1-IRF3 pathway and reduced the expression of type I interferon, thus weakening the STING-mediated anti-tumor activity of type I interferon and promoting tumor growth. Based on these results and facts, to further clarify the relationship between USP35 and immunotherapy response, we evaluated the relationship between USP35 and the levels of seven well-known ICPs in combination with transcriptomic data and IHC staining. The results showed that USP35 levels negatively correlate with the levels of most ICPs, suggesting that SKCM patients with high USP35 expression may have poor immunotherapy treatment effect.
Genomics alterations are closely related to the development of cancer.41,42 We not only detected a significant correlation between USP35 CNVs amplification category and clinical prognosis of SKCM but also found that SKCM patients with USP35 amplification had lower T cell CD8+ infiltration levels compared to other patients. In addition, hypomethylation status of the USP35 cg19972312 locus was also detected to be associated with high USP35 expression and poor clinical survival outcomes. Interestingly, cg19972312 is located in the gene body region, where methylation is generally thought to promote gene expression levels, yet we observed the opposite result, which may be due to the association of cg19972312 with certain functional elements, such as enhancers or alternative promoters.
In this study, we constructed a validated deubiquitination classification and high USP35 expression levels were identified as a potential prognostic indicator for SKCM. USP35 was shown to be closely associated with immunosuppressive status, in which CD8+ T cells may play a key role. DNA hypomethylation of USP35 and CNV amplification type were associated with high expression of the USP35 gene and overall clinical prognosis. In conclusion, USP35 was identified as a potent therapeutic target for melanoma. On the one hand, targeting USP35 may play a potential role in inhibiting melanin formation; on the other hand, it may help improve the immunosuppressive state by inhibiting the expression of USP35.
Data Sharing Statement
The authors declare that the data that support the findings of this study are available from the corresponding author on reasonable request.
Acknowledgments
We thank the TCGA and GEO databases for permitting the authors to use the data.
Author Contributions
All authors made a significant contribution to the work reported, whether that is in the conception, study design, execution, acquisition of data, analysis and interpretation, or in all these areas; took part in drafting, revising or critically reviewing the article; gave final approval of the version to be published; have agreed on the journal to which the article has been submitted; and agree to be accountable for all aspects of the work. Shen-lin Liu and Xi Zou are conjointly designated as corresponding authors.
Funding
The present study was supported by the Jiangsu Province Hospital of Chinese Medicine Peak Academic Talent Project (y2021rc19), the Advantageous Disciplines Program of Nanjing University of Chinese Medicine (ZYX03KF022 and ZYX03KF019), Science and Technology Project of Affiliated Hospital of Nanjing University of Chinese Medicine (Y2020CX62), State Administration of Chinese Medicine Project (20085-9-3), Jiangsu Provincial Science and Technology Department Project (BE2019771), Jiangsu Province Postgraduate Research Innovation Program Project (KYCX21-1677); Youth Science and Technology Project of Suzhou (No. KJXW2019059); the Suzhou Science and Technology Development Plan (No. SYSD2019006).
Disclosure
The authors have declared no conflicts of interest.
References
1. Rebecca VW, Somasundaram R, Herlyn M. Pre-clinical modeling of cutaneous melanoma. Nat Commun. 2020;11(1):2858. doi:10.1038/s41467-020-15546-9
2. Bray F, Ferlay J, Soerjomataram I, et al. Global cancer statistics 2018: GLOBOCAN estimates of incidence and mortality worldwide for 36 cancers in 185 countries. CA Cancer J Clin. 2018;68(6):394–424. doi:10.3322/caac.21492
3. Fischer GM, Jalali A, Kircher DA, et al. Molecular profiling reveals unique immune and metabolic features of melanoma brain metastases. Cancer Discov. 2019;9(5):628–645. doi:10.1158/2159-8290.CD-18-1489
4. Leonardi GC, Falzone L, Salemi R, et al. Cutaneous melanoma: from pathogenesis to therapy (Review). Int J Oncol. 2018;52(4):1071–1080. doi:10.3892/ijo.2018.4287
5. Namikawa K, Yamazaki N. Targeted therapy and immunotherapy for melanoma in Japan. Curr Treat Options Oncol. 2019;20(1):7. doi:10.1007/s11864-019-0607-8
6. Leonardi GC, Candido S, Falzone L, et al. Cutaneous melanoma and the immunotherapy revolution (Review). Int J Oncol. 2020;57(3):609–618. doi:10.3892/ijo.2020.5088
7. Testori AAE, Ribero S, Indini A, et al. Adjuvant treatment of melanoma: recent developments and future perspectives. Am J Clin Dermatol. 2019;20(6):817–827. doi:10.1007/s40257-019-00456-4
8. Weiss SA, Wolchok JD, Sznol M. Immunotherapy of melanoma: facts and hopes. Clin Cancer Res. 2019;25(17):5191–5201. doi:10.1158/1078-0432.CCR-18-1550
9. Benayoun BA, Veitia RA. A post-translational modification code for transcription factors: sorting through a sea of signals. Trends Cell Biol. 2009;19(5):189–197. doi:10.1016/j.tcb.2009.02.003
10. Sims RJ 3rd, Reinberg D. Is there a code embedded in proteins that is based on post-translational modifications? Nat Rev Mol Cell Biol. 2008;9(10):815–820. doi:10.1038/nrm2502
11. Deng L, Meng T, Chen L, et al. The role of ubiquitination in tumorigenesis and targeted drug discovery. Signal Transduct Target Ther. 2020;5(1):11. doi:10.1038/s41392-020-0107-0
12. Ma J, Guo W, Li C. Ubiquitination in melanoma pathogenesis and treatment. Cancer Med. 2017;6(6):1362–1377. doi:10.1002/cam4.1069
13. Habel N, El-Hachem N, Soysouvanh F, et al. FBXO32 links ubiquitination to epigenetic reprograming of melanoma cells. Cell Death Differ. 2021;28(6):1837–1848. doi:10.1038/s41418-020-00710-x
14. Hussain S, Zhang Y, Galardy PJ. DUBs and cancer: the role of deubiquitinating enzymes as oncogenes, non-oncogenes and tumor suppressors. Cell Cycle. 2009;8(11):1688–1697. doi:10.4161/cc.8.11.8739
15. Sarodaya N, Karapurkar J, Kim K-S, et al. The role of deubiquitinating enzymes in hematopoiesis and hematological malignancies. Cancers. 2020;12(5):5. doi:10.3390/cancers12051103
16. Schauer NJ, Magin RS, Liu X, et al. Advances in discovering deubiquitinating enzyme (DUB) inhibitors. J Med Chem. 2020;63(6):2731–2750. doi:10.1021/acs.jmedchem.9b01138
17. Scolyer RA, Rawson RV, Gershenwald JE, et al. Melanoma pathology reporting and staging. Mod Pathol. 2020;33(Suppl S1):15–24. doi:10.1038/s41379-019-0402-x
18. Kawada JI, Takeuchi S, Imai H, et al. Immune cell infiltration landscapes in pediatric acute myocarditis analyzed by CIBERSORT. J Cardiol. 2021;77(2):174–178. doi:10.1016/j.jjcc.2020.08.004
19. Sun T, Liu Z, Yang Q. The role of ubiquitination and deubiquitination in cancer metabolism. Mol Cancer. 2020;19(1):146. doi:10.1186/s12943-020-01262-x
20. Wu X, Luo Q, Liu Z. Ubiquitination and deubiquitination of MCL1 in cancer: deciphering chemoresistance mechanisms and providing potential therapeutic options. Cell Death Dis. 2020;11(7):556. doi:10.1038/s41419-020-02760-y
21. Fang Y, Shen X. Ubiquitin carboxyl-terminal hydrolases: involvement in cancer progression and clinical implications. Cancer Metastasis Rev. 2017;36(4):669–682. doi:10.1007/s10555-017-9702-0
22. Jin WL, Mao XY, Qiu GZ. Targeting deubiquitinating enzymes in glioblastoma multiforme: expectations and challenges. Med Res Rev. 2017;37(3):627–661. doi:10.1002/med.21421
23. Li S, Zhang H, Wei X. Roles and mechanisms of deubiquitinases (DUBs) in breast cancer progression and targeted drug discovery. Life. 2021;11:9.
24. Chen Z, Luo X, Lu Y, et al. Ubiquitination signals critical to regulatory T cell development and function. Int Immunopharmacol. 2013;16(3):348–352. doi:10.1016/j.intimp.2013.01.023
25. Hu H, Sun SC. Ubiquitin signaling in immune responses. Cell Res. 2016;26(4):457–483. doi:10.1038/cr.2016.40
26. Patrick RJ, Corey S, Glass LF. The use of sequential serial sectioning of thin melanomas in determining maximum Breslow depth. J Am Acad Dermatol. 2007;57(5 Suppl):S127–8. doi:10.1016/j.jaad.2006.02.007
27. Negin BP, Riedel E, Oliveria SA, et al. Symptoms and signs of primary melanoma: important indicators of Breslow depth. Cancer. 2003;98(2):344–348. doi:10.1002/cncr.11513
28. Djehal A, Krayem M, Najem A, et al. Targeting prohibitin with small molecules to promote melanogenesis and apoptosis in melanoma cells. Eur J Med Chem. 2018;155:880–888. doi:10.1016/j.ejmech.2018.06.052
29. Chung YC, Hyun CG. Inhibitory effects of pinostilbene hydrate on melanogenesis in B16F10 melanoma cells via ERK and p38 signaling pathways. Int J Mol Sci. 2020;21(13):4732. doi:10.3390/ijms21134732
30. Aoki M, Fujishita T. Oncogenic roles of the PI3K/AKT/mTOR axis. Curr Top Microbiol Immunol. 2017;407:153–189. doi:10.1007/82_2017_6
31. Xia P, Xu XY. PI3K/Akt/mTOR signaling pathway in cancer stem cells: from basic research to clinical application. Am J Cancer Res. 2015;5(5):1602–1609.
32. Xu Z, Han X, Ou D, et al. Targeting PI3K/AKT/mTOR-mediated autophagy for tumor therapy. Appl Microbiol Biotechnol. 2020;104(2):575–587. doi:10.1007/s00253-019-10257-8
33. Liu XR, Wang W, Li HM. KLHL22 promotes malignant melanoma growth in vitro and in vivo by activating the PI3K/Akt/mTOR signaling pathway. Neoplasma. 2020;67(5):1106–1113. doi:10.4149/neo_2020_190923N954
34. Chamcheu JC, Roy T, Uddin M, et al. Role and therapeutic targeting of the PI3K/Akt/mTOR signaling pathway in skin cancer: a review of current status and future trends on natural and synthetic agents therapy. Cells. 2019;8(8):803. doi:10.3390/cells8080803
35. Lee N, Zakka LR, Mihm MC, et al. Tumour-infiltrating lymphocytes in melanoma prognosis and cancer immunotherapy. Pathology. 2016;48(2):177–187. doi:10.1016/j.pathol.2015.12.006
36. Schatton T, Scolyer RA, Thompson JF, et al. Tumor-infiltrating lymphocytes and their significance in melanoma prognosis. Methods Mol Biol. 2014;1102:287–324.
37. Taylor RC, Patel A, Panageas KS, et al. Tumor-infiltrating lymphocytes predict sentinel lymph node positivity in patients with cutaneous melanoma. J Clin Oncol. 2007;25(7):869–875. doi:10.1200/JCO.2006.08.9755
38. Ostroumov D, Fekete-Drimusz N, Saborowski M, et al. CD4 and CD8 T lymphocyte interplay in controlling tumor growth. Cell Mol Life Sci. 2018;75(4):689–713. doi:10.1007/s00018-017-2686-7
39. Farhood B, Najafi M, Mortezaee K. CD8(+) cytotoxic T lymphocytes in cancer immunotherapy: a review. J Cell Physiol. 2019;234(6):8509–8521. doi:10.1002/jcp.27782
40. Raskov H, Orhan A, Christensen JP, et al. Cytotoxic CD8(+) T cells in cancer and cancer immunotherapy. Br J Cancer. 2021;124(2):359–367. doi:10.1038/s41416-020-01048-4
41. Yang Q, Zhao J, Zhang W, et al. Aberrant alternative splicing in breast cancer. J Mol Cell Biol. 2019;11(10):920–929. doi:10.1093/jmcb/mjz033
42. Ehrlich M. DNA methylation in cancer: too much, but also too little. Oncogene. 2002;21(35):5400–5413. doi:10.1038/sj.onc.1205651
 © 2022 The Author(s). This work is published and licensed by Dove Medical Press Limited. The full terms of this license are available at https://www.dovepress.com/terms.php and incorporate the Creative Commons Attribution - Non Commercial (unported, v3.0) License.
By accessing the work you hereby accept the Terms. Non-commercial uses of the work are permitted without any further permission from Dove Medical Press Limited, provided the work is properly attributed. For permission for commercial use of this work, please see paragraphs 4.2 and 5 of our Terms.
© 2022 The Author(s). This work is published and licensed by Dove Medical Press Limited. The full terms of this license are available at https://www.dovepress.com/terms.php and incorporate the Creative Commons Attribution - Non Commercial (unported, v3.0) License.
By accessing the work you hereby accept the Terms. Non-commercial uses of the work are permitted without any further permission from Dove Medical Press Limited, provided the work is properly attributed. For permission for commercial use of this work, please see paragraphs 4.2 and 5 of our Terms.