")
Back to Journals » International Journal of General Medicine » Volume 15
Using Weighted Gene Co-Expression Network Analysis to Identify Increased MND1 Expression as a Predictor of Poor Breast Cancer Survival
Authors Bao Z , Cheng J, Zhu J, Ji S , Gu K , Zhao Y, Yu S, Meng Y
Received 19 December 2021
Accepted for publication 7 May 2022
Published 14 May 2022 Volume 2022:15 Pages 4959—4974
DOI https://doi.org/10.2147/IJGM.S354826
Checked for plagiarism Yes
Review by Single anonymous peer review
Peer reviewer comments 2
Editor who approved publication: Dr Scott Fraser
Zhaokang Bao,1,* Jiale Cheng,1,* Jiahao Zhu,2,* Shengjun Ji,3 Ke Gu,2 Yutian Zhao,2 Shiyou Yu,1 You Meng1
1Department of Oncology Surgery, The Affiliated Suzhou Hospital of Nanjing Medical University, Gusu School, Nanjing Medical University, Suzhou, Jiangsu, People’s Republic of China; 2Department of Radiotherapy and Oncology, Affiliated Hospital of Jiangnan University, Wuxi, Jiangsu, People’s Republic of China; 3Department of Radiotherapy and Oncology, The affiliated Suzhou Hospital of Nanjing Medical University, Gusu School, Nanjing Medical University, Suzhou, Jiangsu, People’s Republic of China
*These authors contributed equally to this work
Correspondence: You Meng, Department of Oncology Surgery, The affiliated Suzhou Hospital of Nanjing Medical University, Gusu School, Nanjing Medical University, 16 West Baita Road, Suzhou, Jiangsu, People’s Republic of China, Email [email protected]
Objective: We used bioinformatics analysis to identify potential biomarker genes and their relationship with breast cancer (BC).
Materials and Methods: We used a weighted gene co-expression network analysis (WGCNA) to create a co-expression network based on the top 25% genes in the GSE24124, GSE33926, and GSE86166 datasets obtained from the Gene Expression Omnibus. We used the DAVID online platform to perform GO and KEGG pathway enrichment analyses and the Cytoscape CytoHubba plug-in to screen the potential genes. Then, we related the genes to prognostic values in BC using the Oncomine, GEPIA, and Kaplan–Meier Plotter databases. Findings were validated by immunohistochemical (IHC) staining in the Human Protein Atlas and the TCGA-BRCA cohort. LinkedOmics identified the interactive expressions of hub genes. We used UALCAN to evaluate the methylation levels of these hub genes. MethSurv and SurvivalMeth were used to assess the multilevel prognostic value. Finally, we assessed hub gene association with immune cell infiltration using TIMER.
Results: The mRNA levels of MKI67, UBE2C, GTSE1, CCNA2, and MND1 were significantly upregulated in BC, whereas ESR1, THSD4, TFF1, AGR2, and FOXA1 were significantly downregulated. The DNA methylation signature analysis showed a better prognosis in the low-risk group. Further subgroup analyses revealed that MND1 might serve as an independent risk factor for unfavorable BC prognosis. Additionally, MND1 expression levels positively correlate with the immune infiltration statuses of CD4+ T cells, CD8+ T cells, B cells, neutrophils, dendritic cells, and macrophages.
Conclusion: Our results indicate that the ten hub genes may be involved in BC’s carcinogenesis, development, or metastasis, and MND1 may be a potential biomarker and therapeutic target for BC.
Keywords: breast neoplasms, immunohistochemistry, polymerase chain reaction, biomarker
Introduction
Breast cancer (BC) is the most commonly diagnosed cancer in women, and it is the main cause of cancer mortality in women around the world.1 Although standard treatments for breast cancer, including surgery, radiotherapy, chemotherapy, endocrine therapy, targeted therapy, and immunotherapy, have greatly improved during the last few decades.2,3 However, BC remains a serious clinical challenge. The outcomes of patients with different molecular BC subtypes are very different. For example, the triple-negative breast cancer (TNBC) subtype usually has poorer progression-free survival (PFS) and overall survival (OS) outcomes, and it has higher risks of recurrence and metastasis compared to other molecular BC subtypes.3 There is no effective treatment for TNBC. However, prognostic biomarkers are a valuable tool to develop treatments. For example, the expression level of human epidermal growth factor receptor 2 (HER2) is one of the most effective prognostic biomarkers for breast cancer, and anti-HER2 drugs, including trastuzumab and lapatinib, are highly beneficial for BC patients with HER2 overexpression.4–7 To better treat BC, novel prognostic biomarkers with high sensitivity and specificity and effective therapeutic targets need development.
Weighted gene co-expression network analysis (WGCNA) is now widely used to explore potential genes associated with clinical characteristics of cancer progression, which include tumor grade, stage, and metastasis. Furthermore, due to easy access to public databases, such as The Cancer Genome Atlas (TCGA) and the Gene Expression Omnibus (GEO), bioinformatics analysis has become a popular tool to screen tumor target genes. For example, Tang et al found that the hub genes RSAD2, HERC5, and CCL8 are potential prognostic biomarkers for BC.8 Moreover, miR-124 regulates CDK6 via the Wnt signaling pathway in BC.9 This study analyzed BC expression profile data from the GEO public database using WGCNA and identified BC-associated gene modules. Five hub genes, namely MKI67, UBE2C, GTSE1, CCNA2, and MND1, were eventually selected from two modules. By combining the IHC assays of the Human Protein Atlas and the TCGA-BRCA cohort, we confirmed the differential expression of MND1 in BC tissues and its association with BC prognosis. Moreover, we investigated the molecular mechanisms involving MND1 during carcinogenesis and the development of BC and the possible connection between MND1 and tumor immune infiltration.
Materials and Methods
Dataset Collection and Processing
Supplementary Figure 1 illustrates the study’s workflow. Hsieh et al, Chang et al, and Cheng et al provided the GSE24124, GSE33926, GSE86166 gene expression profile datasets we retrieved and analyzed these data with the GEO (https://www.ncbi.nlm.nih.gov/geo).10 The gene expression data based on 20, 51, and 366 BC samples were generated using the GPL887 (Agilent-012097 Human 1A Microarray V2 G4110B, Feature Number version), GPL7264 (Agilent-012097 Human 1A Microarray V2 G4110B Probe Name version), and GPL15048 (Rosetta/Merck Human RSTA Custom Affymetrix 2.0 microarray HuRSTA_2a520709.CDF) platforms, respectively. The datasets used in this study were normalized by batch, and the top 25% of variant genes were selected to build weighted co-expression networks.
The gene expression dates (WorkflowType: HTSeqFPKM) for 1096 BC samples and 119 normal breast samples were downloaded from the TCGA database (http://cancergenome.nih.gov/). The relationship between MND1 and the prognosis of BC patients was evaluated using clinical data.
The genes that were differentially expressed (DEGs) between tumor and normal samples were visualized using the R package.11 Here, we define a fold-change that is correlated with significant DEGs as a |log2 fold-change| with a threshold >1.5 and false discovery rate (FDR) < 0.05.12
Weighted Gene Co-Expression Network Construction
We constructed a scale-free gene co-expression network using the “WGCNA” x in the R software environment.13 To ensure the network structure’s stability, we removed cases with incomplete clinical information. We also transformed the gene expression profile matrix by x. The similarity between genes “m” and “n” was defined as Smn = |cor(m, n)|. A weighted adjacency matrix was constructed by the power function, amn = power (Smn, β) = |Smn|β. The “soft thresholding” parameter highlighted similarities between genes, while poor correlations were penalized. The WGCNA package’s “pickSoftThreshold” x was used to find an acceptable - value for a scale-free network. The resulting adjacency matrix was transformed to a topological overlap matrix and used to determine dissimilarity values (1-TOM).14 Topological overlap assesses the biological similarity between two genes based on their expression patterns. A dissimilarity-based cluster analysis was then performed to build a hierarchically clustered tree, with each leaf in the branch representing a gene and each branch representing a gene module. Gene modules were extracted via the complex tree cut approach, with the minimum size cutoff set to 30 and the deep break parameter set to 2. With a height cutoff of 0.25, only extremely related modules were grouped together.
Identification of Modules with Clinical Significance
We used two approaches to screen modules linked to specific clinical features of BC. First, principal component analysis was used to generate the module eigengene (ME), which captures the bulk of the module’s knowledge. Second, Pearson’s correlation coefficients were used to calculate the ME and different clinical characteristics’ correlations. Modules that were highly clustered (P < 0.05) were eliminated. Clinically relevant modules were identified by examining the associations between gene significance and module membership. Using these two approaches, we could select the most strongly associated modules with BC phenotypes for further study.
Function and Pathway Enrichment Analysis
To better understand the biological processes involved in the main modules, we used the Database for Annotation, Visualization, and Integrated Discovery (DAVID) to conduct Gene Ontology (GO) and Kyoto Encyclopedia of Genes and Genomes (KEGG) pathway enrichment studies (https://david.ncifcrf.gov).15 A P value of <0.05 indicated significant enrichment.
Identification and Validation of Hub Genes in Pivotal Modules
We identified hub genes using the CytoHubba plug-in of Cytoscape 3.5.1.16 The candidate genes were selected from the top ten nodes with the highest degree ranking. The Kaplan–Meier plot (http://kmplot.com) was then used to assess the association between hub gene expression and BC prognosis.17 GEPIA (http://gepia.cancerpku.cn/) was used to evaluate the differential expression levels of x.18 We used the Oncomine database (https://www.oncomine.org/) to analyze the differential expression of x between cancer and normal tissue.19 The expression of each hub gene was validated in the Human Protein Atlas (http://www.proteinatlas.org). Differences in x were considered statistically significant at P < 0.05. 30 tissues examples were collected from Suzhou Municipal Hospital including 15 BC and 15 breast normal tissues. All patients signed informed consent before the experiment. The Ethics Committee of Suzhou Municipal Hospital reviewed and approved this study. Total RNA were extracted from cells with RNeasy Mini Kit (Cat.74101, Qiagen, Germany) in accordance with the manufacturer’s instruction. The relative mRNA levels of MKI67, UBE2C, GTSE1, CCNA2 and MND2 were determined by quantitative reverse transcription polymerase chain reaction (qRT-PCR) method. The PCR process was carried out with ABI PRISM 7500 real-time PCR system (Applied Biosystems, Carlsbad, CA, USA). The 2−ΔΔCt statistic was used to calculate the expression levels of genes. The primer sequences used as follows: MKI67: F: 5-ACGCCTGGTTACTATCAAAAGG-3 R: 5-CAGACCCATTTACTTGTGTTGGA-3; UBE2C: F: 5-GACCTGAGGTATAAGCTCTCGC-3 R: 5-TTACCCTGGGTGTCCACGTT-3; GTSE1: F: 5-CAGGGGACGTGAACATGGATG-3 R: 5-ATGTCCAAAGGGTCCGAAGAA-3; CCNA2: F: 5-CGCTGGCGGTACTGAAGTC-3 R: 5-GAGGAACGGTGACATGCTCAT-3; MND1: F: 5-TGTGAGAGGATCGGAACTTCT-3 R: 5-CACATCGGCCAATTTTAGCTTTC-3;
LinkedOmics Database Analysis
The LinkedOmics function module (http://www.linkedomics.org/login.php) was used to analyze GO categories and KEGG pathways through gene set enrichment analysis.20 The rank criterion was based on a FDR of <0.05. A total of 500 simulations were performed.
Expression and Methylation Analysis
UALCAN (http://ualcan.path.uab.edu/) was used to access the hub genes expression and methylation.21 We used MethSurv (https://biit.cs.ut.ee/methsurv/) to evaluate the prognostic significance of different CpG methylation patterns of hub genes.22 SurvivalMeth (http://bio-bigdata.hrbmu.edu.cn/survivalmeth/) was used to access the effect of DNA methylation of hub genes signature on BC prognosis.23–25
TIMER Analysis
The Spearman correlations between hub gene expression and immune infiltration abundance were determined using the “Gene” module and the TIMER database (https://cistrome.shinyapps.io/timer/). The “Survival” module determined the relationships between clinical outcomes and immune cell infiltration or hub gene expression.26
Potential Drugs Screening
Connectivity Map tools (https://clue.io/) was used to analyze the mechanism of actions and potential drugs.27–29 Top upregulated and downregulated hub genes was input. “ComplexHeatmap” package in R was used to visualized the results.
Statistical Analysis
All statistical analyses used SPSS software (version 24; SPSS Inc., Chicago, IL, USA). Chi-squared and Fisher’s exact tests, Wilcox test, Kaplan–Meier method, and the Cox proportional regression model analyzed differences in the expression of hub genes. And Two-side P values < 0.05 were considered significant.
Results
Gene Screening
The gene expression profile dataset containing 417 BC and 20 normal breast samples was downloaded from the GEO database (Supplement of batch correction was shown in Supplementary Figure 2). The expression matrix files and clinical data (.txt format) were obtained and sorted from the TCGA database before WGCNA analysis. The “edgeR” package in R Studio was used to process the data, resulting in a total of 484 differentially expressed genes (DEGs) for further WGCNA analysis (Supplementary Figure 3).
Construction of the Co-Expression Network Using WGCNA
The selected genes were clustered hierarchically using the “FlashClust” package in R. Based on the results, 51 outlier samples were omitted, and 366 samples were used to construct the co-expression network (Figure 1A and B). Scale independence and mean connectedness were calculated with soft thresholding settings (β) ranging from 1 to 20. The degree of independence was more than 0.8, when the value of β reached 6, and the associated mean connectivity was near to zero, implying that the network complies with the scale-free network distribution criteria. As a result, the co-expression network was built with a value of 6 (Figure 1C). The dynamic tree cut approach was used to identify and merge gene modules that were close in proximity, resulting in a total of seven gene modules illustrated in Figure 1D (the gray module includes genes that were not co-expressed with other genes). Correlations among the seven modules were analyzed and plotted in the heat map shown in Figure 1E.
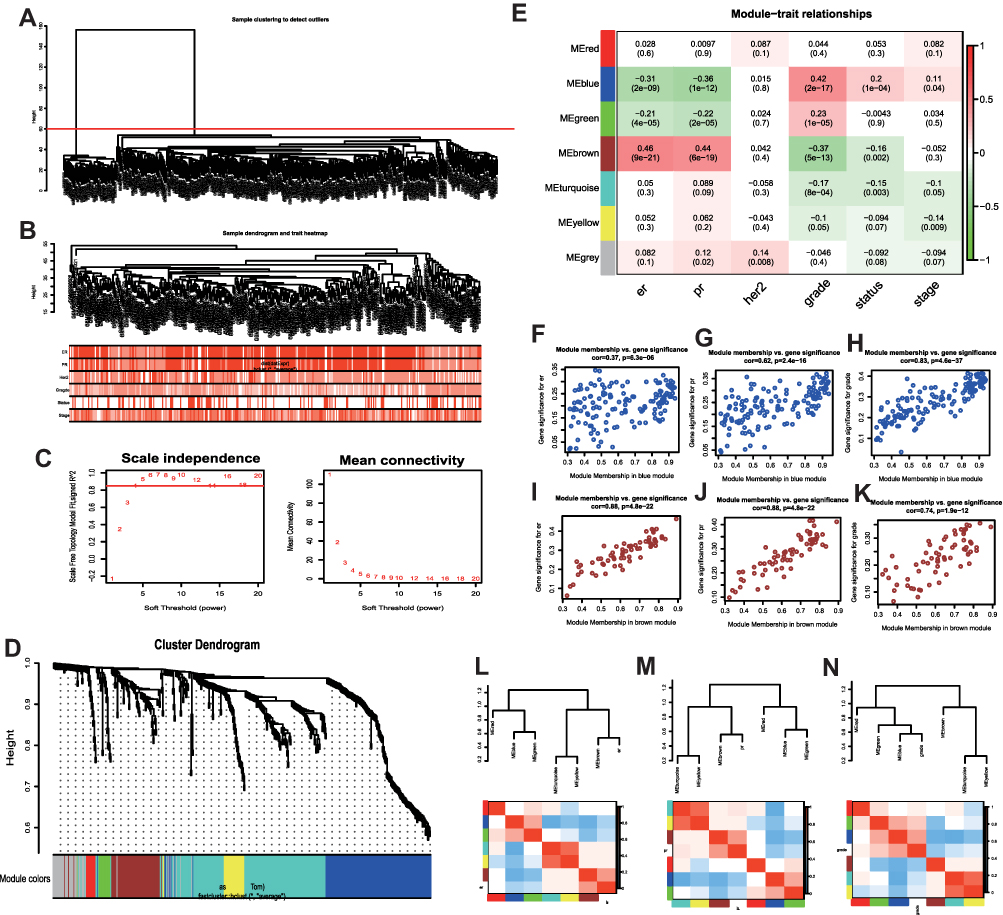 |
Figure 1 Co-expression network constructed with WGCNA (weighted gene co-expression network analysis). (A) No outlier samples were identified based on hierarchical cluster analysis. (B) Hierarchical clustering of the top 25% variant genes in the GSE24124, GSE33926, and GSE86166 dataset and associated clinical information. Color intensity indicates a positive correlation with ER (estrogen receptor), PR (progesterone receptor), Her2, and the grade, status, and stage of tumors. (C) Determination of the optimal soft thresholding value (β) of the sample. (D) Dendrogram of the top 25% variant genes clustered based on dissimilarity values (1-TOM), where TOM is the topological overlap matrix. The upper panel shows the gene dendrogram, and the lower panel shows seven gene modules displayed in different colors, including the gray module. (E) Heat map of the correlation between modules and clinical features. The number above each cell represents the correlation between the module and the feature, and the number below each cell represents the corresponding P value. Red and green represent positive and negative correlations, respectively. The scatter plots show the correlations between the blue modular gene and ER (F), PR (G), and grade (H); the correlations between the brown modular gene and ER (I), PR (J), and grade (K); and the correlations between each module and ER (L), PR (M), and grade (N). |
Modules with Clinical Significance
Figure 1E shows the gene modules significantly correlated to certain clinical features. The blue module is negatively correlated to ER (estrogen receptor) and PR (progesterone receptor) positively correlated to grade. The brown module positively correlated to ER and PR, and negatively correlated to grade. Furthermore, GS (gene significance) and MM (Module membership) are significantly correlated within the blue module (cor = 0.37, P = 6.3e-06; cor = 0.62, P = 2.4e-16; cor = 0.83, P = 4.6e-37), indicating that this module is closely related to BC (Figure 1F–H). In addition, GS and MM in the brown module are also significantly correlated (cor = 0.88, P = 4.8e-22; cor = 0.88, P = 4.8e-22; cor = 0.74, P = 1.9e-12), indicating that the brown module is also closely related to BC (Figure 1I–K). These results are supported by the clustering heat maps of ER, PR, and grade (Figure 1L–N).
Screening of Hub Genes in Key Modules and Functional Enrichment Analysis of Genes
We used Cytoscape to calculate each node’s degree in modules X and Y, and the top five nodes were selected as candidate genes. Figure 2A shows the blue module network. The hub nodes are: Marker of Proliferation Ki-67 (MKI67), Ubiquitin Conjugating Enzyme E2C (UBE2C), G2, and S-Phase Expressed 1 (GTSE1), Cyclin A2 (CCNA2), and Meiotic Nuclear Divisions 1 (MND1). The brown module network (Figure 2B) shows the hub nodes Estrogen Receptor 1 (ESR1), Thrombospondin Type 1 Domain Containing 4 (THSD4), Trefoil Factor 1 (TFF1), Anterior Gradient 2 (AGR2), and Forkhead Box A1 (FOXA1).
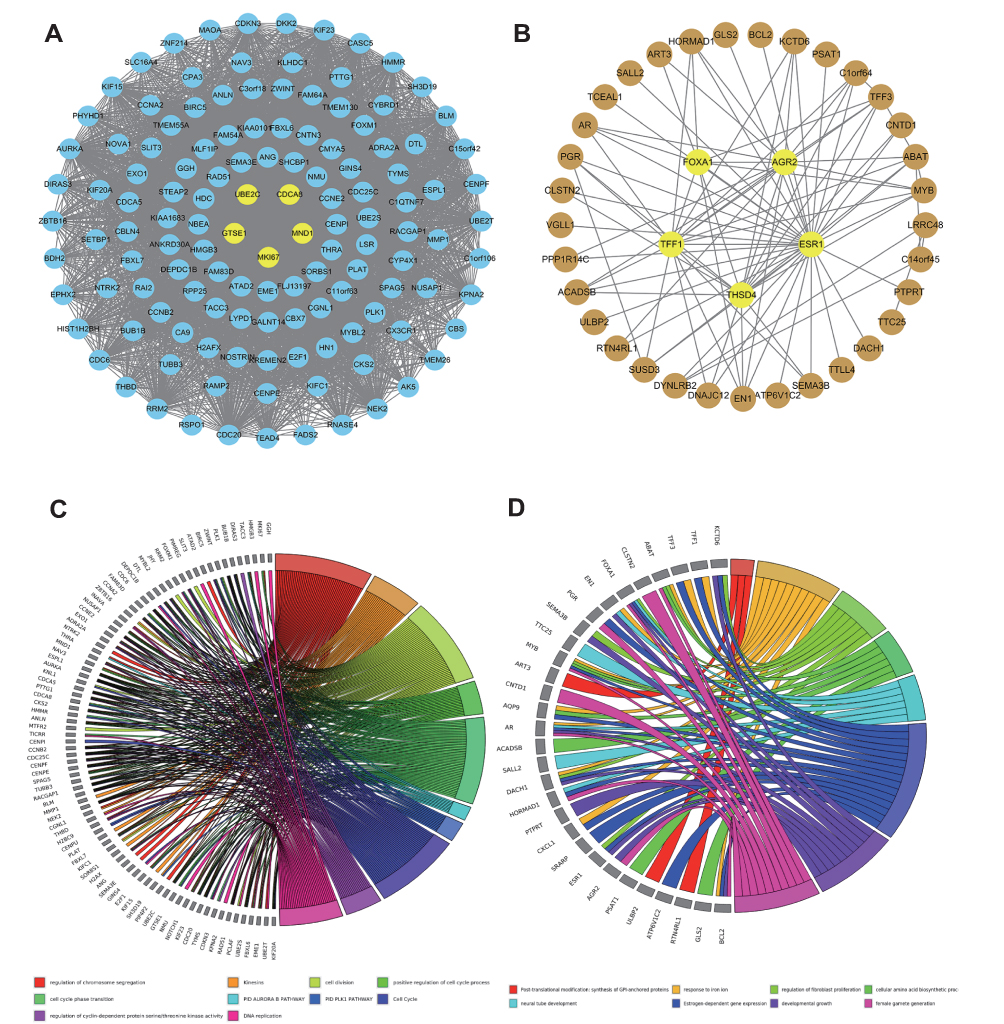 |
Figure 2 Gene co-expression networks of the blue (A) and brown (B) modules visualized by Cytoscape. Yellow nodes represent hub genes. Blue and brown nodes represent non-hub genes in the respective modules. Nodes in the networks represent genes in the module. Edges between the nodes indicate that the two genes are co-expressed. GO (gene ontology) enrichment analyses of the blue (C) and brown (D) modules. |
GO enrichment analysis on the blue module indicates its involvement in cell cycle, cell division, cell cycle phase transition, regulation of chrome segregation, PID Plk1 pathway, and cyclin-dependent protein serine/threonine regulation kinase activity, and positive regulation of the cell cycle process (Figure 2C). Similarly, the pathways involved in the brown module include evolution-dependent gene expression, response to iron ion, regulation of fibroblast promotion, cellular amino acid biosynthetic process, post-translational modification, synthesis of GPI-anchored proteins, etc (Figure 2D).
Expression and Clinical Significance of the Hub Genes
The ten candidate genes identified above were analyzed using the KM Plotter online tool. Their expressions were significantly upregulated in BC tissues compared with normal tissues (P < 0.05, Figure 3A). And as shown in Figure 3B, overexpression of MKI67, UBE2C, GTSE1, CCNA2, and MND1 in the blue module significantly correlated with the poor OS of breast cancer (P < 0.05).
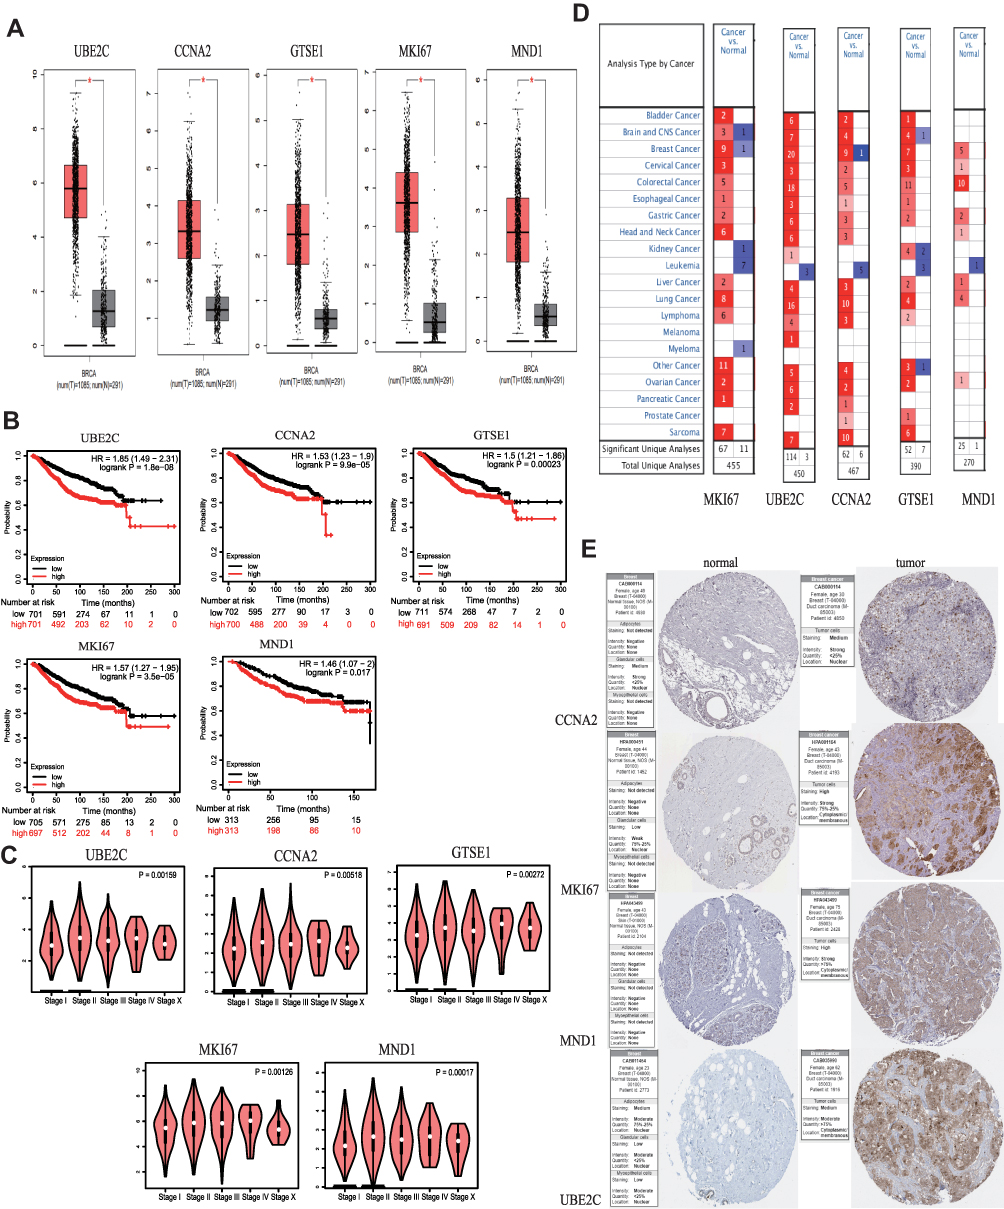 |
Figure 3 Survival analysis and differential expression of hub genes in blue modules. (A) Differential expression of hub genes analyzed using the GEPIA database. Box plots show mRNA expression of hub genes in breast cancer (red plot) and the corresponding normal tissues (gray plot). “*” represents P < 0.05. (B) Survival analysis of the hub genes in breast cancer (Kaplan–Meier plot). (C) Relationship analysis between the expression of hub genes and stage of breast cancer. (D) Differential expression of hub genes analyzed using the Oncomine database. Differential expression of hub genes in different tumors. The intensity of the color (red or blue) indicates positive correlation with the degree of significance of upregulation or downregulation, respectively. (E) Expression of CCNA2, MKI67, MND1, and UBE2C in breast cancer and normal breast tissues validated in the Human Protein Atlas. |
The different expression levels in BC and normal breast tissues of the four genes in the brown module were validated using the GEPIA database. In BC tissues, ESR1, THSD4, TFF1, AGR2, and FOXA1 were significantly upregulated (P < 0.05, Supplementary Figure 4A). Survival analysis showed that ESR1, THSD4, and TFF1 significantly correlated with BC prognosis (P < 0.05), while AGR2 was only marginally correlated with BC prognosis (P = 0.01). Moreover, high expression levels of ESR1, THSD4, TFF1 and AGR2 are related to better BC prognosis compared to those in patients with low-expression levels of these genes (Supplementary Figure 4B). Thus, high expression levels of these genes may inhibit BC development.
We chose the blue gene module due to its cancer-promoting function to conduct follow-up research. Analysis of the association between tumor stage and hub gene expression showed a significant relationship (P < 0.05) (Figure 3C). Using the Oncomine database, we analyzed the expression levels of hub genes in different types of cancer and found that MKI67, UBE2C, GTSE1, CCNA2, and MND1 were upregulated in most cancers, although they were also downregulated in a few types of cancers (Figure 3D). In the human protein atlas database, the hub gene was upregulated in BC tissues (Figure 3E).
Expression Validation of the Five Hub Genes by qRT-PCR
15 normal breast samples and 15 BC samples were collected. As shown in Figure 4A–E, MKI67, UBE2C, GTSE1, CCNA2, and MND1 expression levels in BC samples were significantly higher compared with normal breast samples. (P < 0.01).
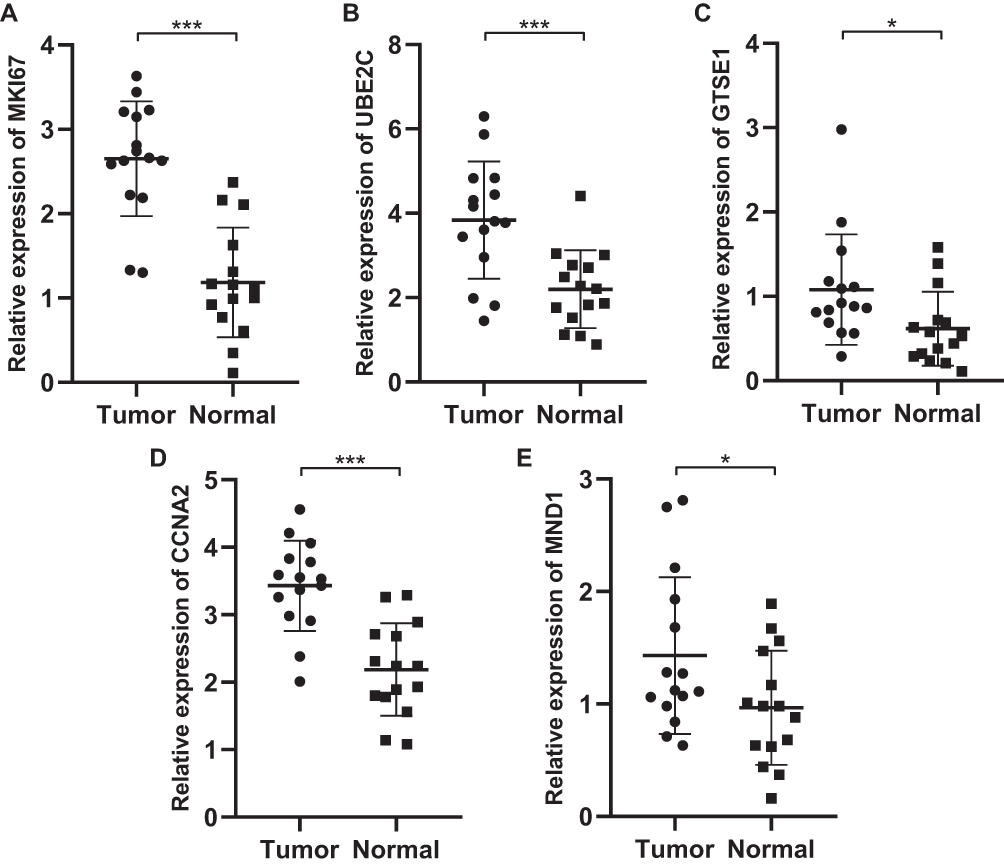 |
Figure 4 (A–E) Validation of the expression levels of the five genes between the normal breast samples (n = 15) and breast cancer samples (n = 15) by polymerase chain reaction analysis. All the data are presented as mean SD. Significant differences are defined by *p < 0.05, and ***p < 0.001. |
Prognostic Value of Single CpG of Hub Genes in BC
MethSurv was used to investigate the prognosis value of DNA methylation of these five hub genes. The heat map of DNA methylation results is displayed in Supplementary Figure 5. We observed that five CpGs of UBE2C, five CpGs of CCNA2, two CpGs of GTSE1, one CpGs of MKI67 and six CpGs of MND1 were significantly associated with prognosis in breast cancer patients (Table 1).
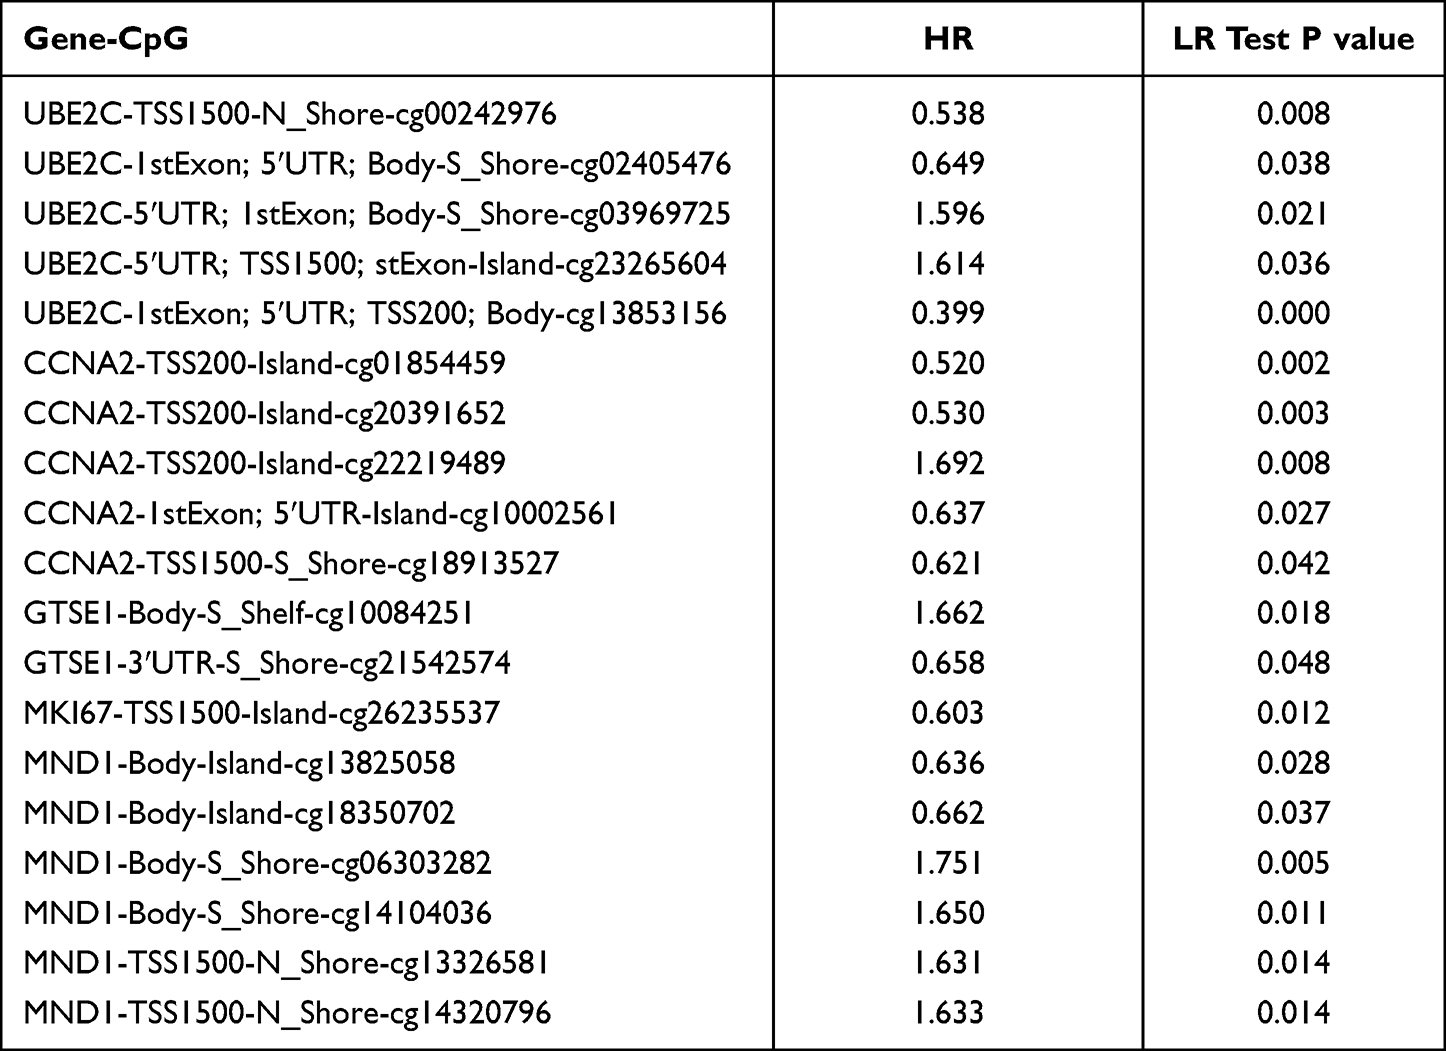 |
Table 1 The Prognostic Value of CpG in the Upregulated Five Hub Genes by MethSurv (P<0.05) |
Validation of MND1 in the TCGA Database
MND1 expression data and related clinical information were downloaded from the TCGA-BRCA database. As shown in Figure 5A–F, higher expression of MND1 in luminal A, triple negative and the whole BC has close association with worse OS and PFS. The expression of MND1 in luminal A, luminal B, HER2 overexpression, and triple negative BC tissue was significantly higher than that in normal tissue. We considered the median value of MND1 expression as the threshold, thus the upper 50% was the high expression group, and the lower 50% was the low-expression group of MND1 (Figure 5G). Univariate Cox analysis showed that high expression of MND1, age, and tumor stage are independent risk factors for the prognosis of BC patients, with hazard ratio values of 1.128, 1.035, and 1.626, respectively (all P < 0.05; Figure 5H). Similarly, multivariate Cox analysis showed that high expression of MND1, age, and M stage are independent risk factors for BC patients’ prognoses, with hazard ratio values of 1.213, 1.019, and 1.640 (all P < 0.05; Figure 5I).
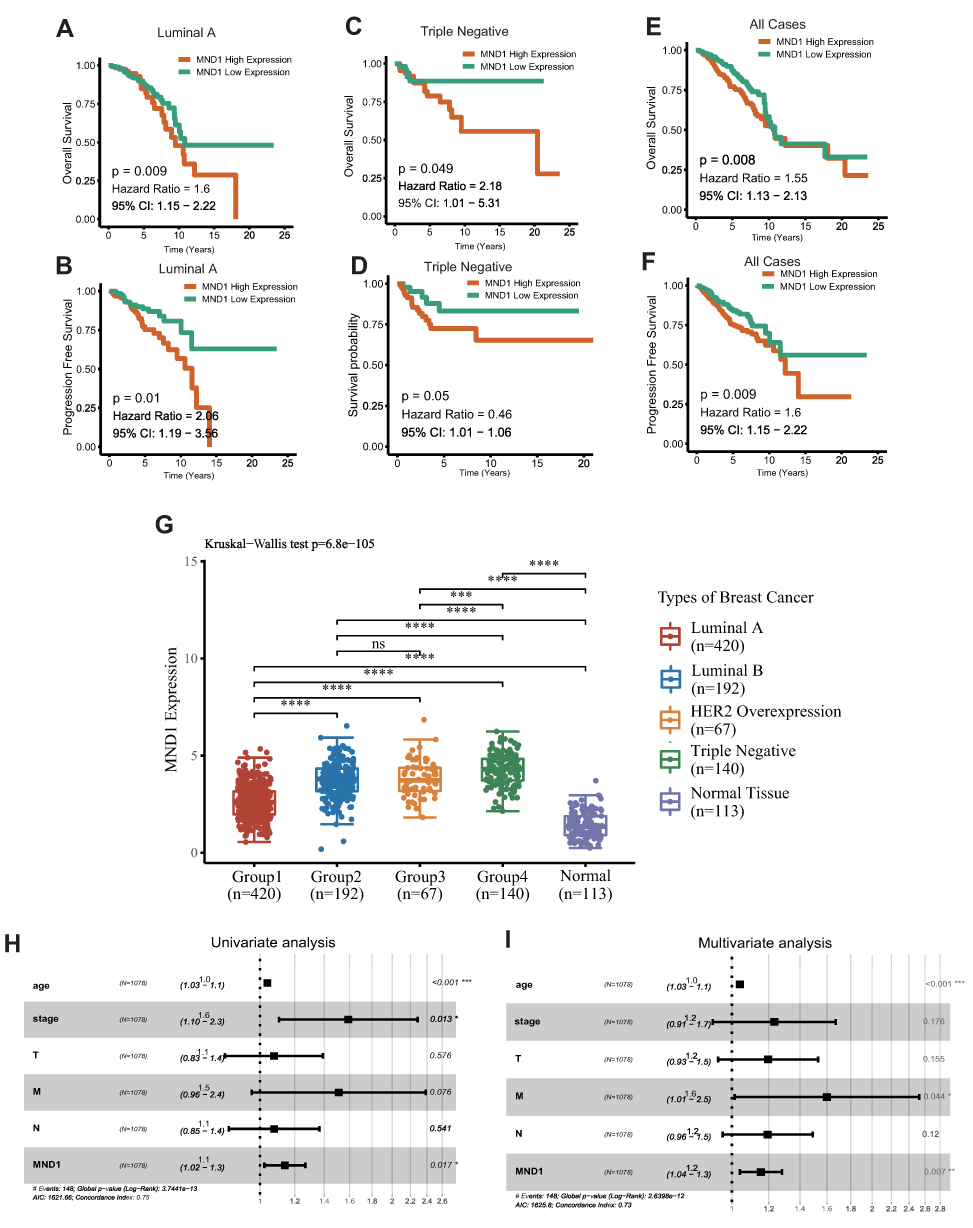 |
Figure 5 Survival analysis and differential expression of MND1 (Meiotic Nuclear Divisions 1) in the molecular subtypes of BC with TCGA-BRCA database. (A, C, E) Correlation of MND1 expression level with overall survival in luminal A, triple negative, and the whole cases of BC. (B, D, F) Correlation of MND1 expression level with progression free survival in luminal A, triple negative, and the whole cases of BC. (G) Box plot validating mRNA expression of MND1 among luminal A, luminal B, HER2 overexpression, triple negative BC and normal tissues. (H and I) Forest plot based on univariate and multivariate Cox regression analyses of overall survival. Significant differences are defined by “*”: P < 0.05, “**”: P < 0.01, “***”: P < 0.001, and “****”:P < 0.0001. |
Methylation Analysis
Methylation level in BC and normal tissues was investigated (Figure 6A–J). Almost all of the ten hub genes have the significant hypermethylation. SurvivalMeth was used to analyze the prognostic value of ten signature (Figure 6K–M). An optimal cutoff (prognostic index = −26.057) was calculated and all BC cases were divided into high/low risk groups. Significant expression patterns of all ten hub genes were found between the low- and high-risk groups (Figure 6K). The heat map showed that DNA methylation level (Figure 6L), and the high-risk group demonstrated a worse OS compared with the low-risk group (P=0.012) (Figure 6M).
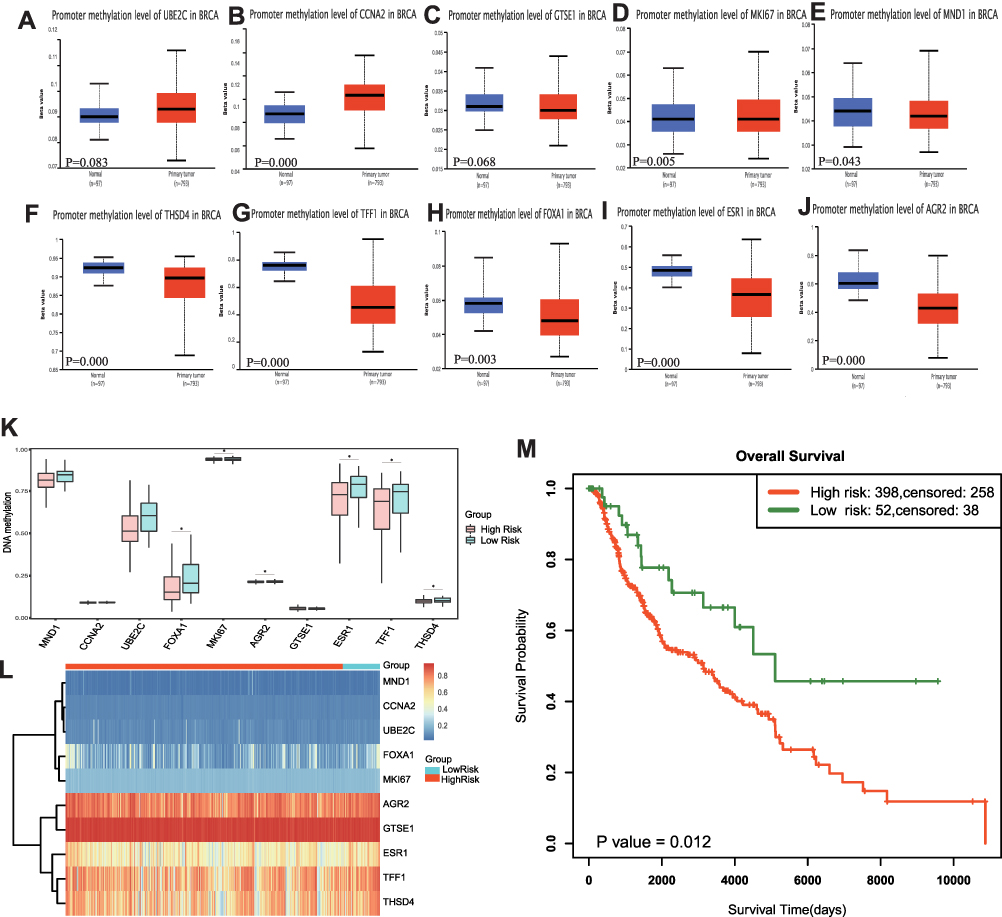 |
Figure 6 Methylation analysis in BC with UALCAN and SurvivalMeth online tool. (A–J) Methylation level of ten hub genes in BC cases. (K) The methylation level of CpGs in the high- and low-risk group. (L) The heatmap of CpG methylation level. (M) The Kaplan–Meier curve of OS. Significant differences are defined by “*”: P < 0.05. |
Correlation Analysis of MND1 Expression and Immune Infiltration Status
To explore the potential correlation between MND1 and the immune microenvironment of BC, we evaluated the relationship between MND1 expression and immune infiltration level in the TCGA-BRCA cohort using the TIMER database. The expression of MND1 was positively correlated with the infiltration level of B cells, CD8 + T cells, CD4 + T cells, macrophages, neutrophils, and dendritic cells in patients with BC (r = 0.255, P = 3.35e-16; r = 0.172, P < 0.05) = 30e-08; r = 0.769, P = 5.58e-10; r = −0.319, P = 7.14e-25; r = 0.266, P = 1.38e-17; r = 0.308, P = 2.84e-23, respectively) (Figure 7A). MND1 is also upregulated in a variety of cancers besides BC, including lung adenocarcinoma, colon adenocarcinoma, and head and neck squamous cell carcinoma (Figure 7B).
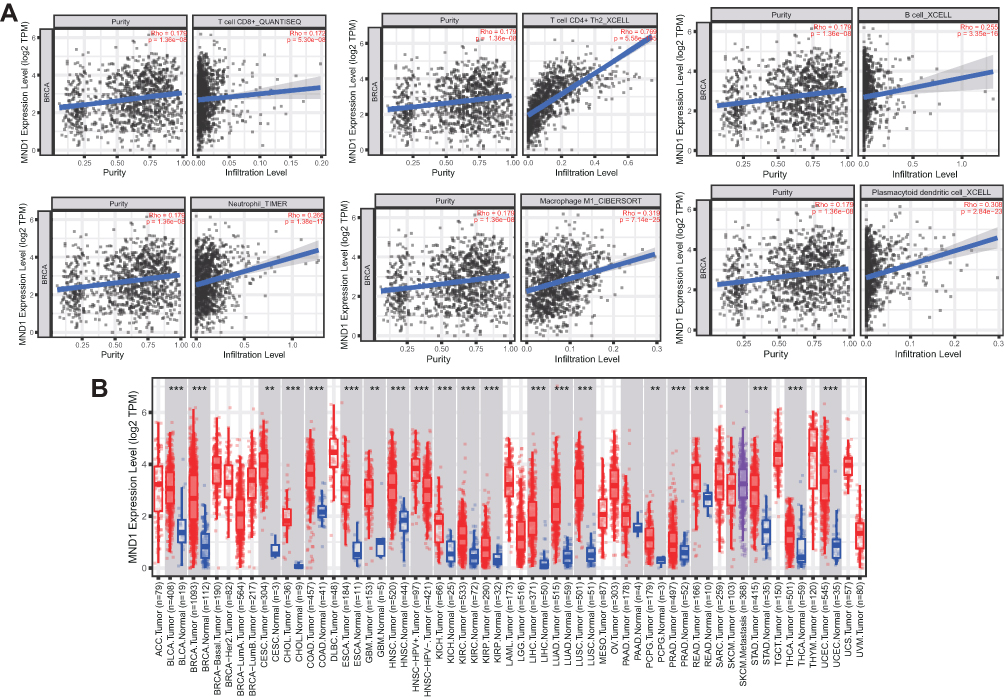 |
Figure 7 Association between MND1 expression and immune signature (TIMER). (A) Relationship between MND1 expression and infiltration levels of six subsets of immune cells (B cells, CD4+ T cells, CD8+ T cells, macrophages, neutrophils, and dendritic cells) in BRCA. (B) Expression of MND1 in different types of cancers showing the comparison between tumor and corresponding normal tissues. “**” and “***” represent P < 0.01 and P < 0.001, respectively. |
Potential Mechanism of Action of Small Molecules Screening
CMap mode-of-action analysis of the 42 compounds revealed 35 mechanisms of action shared by the above compounds (Figure 8).
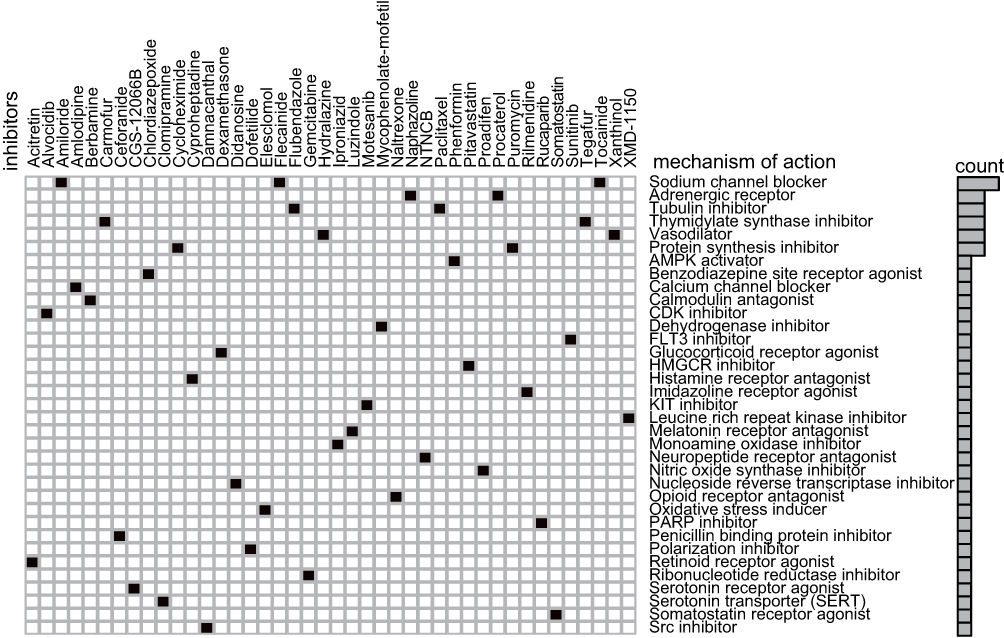 |
Figure 8 Heatmap showing CMap mode-of-action analysis of the 42 compounds (perturbagen) revealed 35 mechanisms of action (rows) shared by the above compounds. |
Discussion
We screened for potential biomarkers associated with BC’s progression and prognosis using the GSE24124, GSE33926, and GSE86166 gene expression profiles from the GEO database. These profiles include 417 BC and 20 normal breast samples. Using WGCNA, we constructed a co-expression network of 484 of the most variable genes, resulting in the identification of seven independent modules. We then used the DAVID database to perform enrichment analyses on two selected modules. In the blue module, we found mainly genes involved in the cell cycle, cell division, cell cycle phase transition, regulation of chrome segregation, PID Plk1 pathway, and cyclin-dependent protein serine/threonine regulation kinase activity, and positive regulation of the cell cycle process. In the brown module, we found genes involved in biological processes, such as evolution-dependent gene expression, response to iron ion, regulation of fibroblast promotion, cellular amino acid biosynthetic process, post-translational modification, synthesis of GPI-anchored proteins, etc. Cell cycle-related biological functions are involved in developing many tumors, including BC, while the PID Plk1 pathway is associated with tumor cell proliferation and recurrence. Therefore, these modules may influence the development of BC by regulating the above biological processes and pathways.
The five genes with the highest degree of x in the blue and brown modules were selected using the CytoHubba plug-in in x. Further analysis demonstrated that the expression levels of MKI67, UBE2C, GTSE1, CCNA2, and MND1 in blue modules were negatively associated with prognosis and were significantly upregulated in BC. Thus, these five genes may promote the development of BC. Meanwhile, ESR1, THSD4, and TFF1 in brown modules were positively correlated with favorable patient prognosis and were significantly downregulated in BC. High levels of expression of these genes may thus serve as a tumor suppressor. The five hub genes (MKI67, UBE2C, GTSE1, CCNA2, and MND1), that likely affect BC development were selected for further analysis.MKI67 is also known as Antigen Ki-67, and it is a well-known cell cycle-related protein. Ki-67/MKI67 has both therapeutic and prognostic value in various cancers, including breast,30 cervical,31 colorectal,32 and gastric33 cancers. Ki67 has been designated a therapeutic target for cancer therapy due to its important cell proliferation role. Recently, Zhang et al achieved favorable outcomes after using a novel siRNA to inhibit the proliferation and induce the apoptosis of 786-O human renal carcinoma cells.34 In another study, replicative adenovirus vectors combined with Ki67 contributed to the destruction of melanoma cells.35 Thus, the application of Ki67-targeted cancer therapy is expected to treat BC. UBE2C, a member of the E2 ubiquitin conjugating enzyme family, is involved in mitotic cyclin B degradation, and it promotes the transition from the M to the G1 phase of the cell cycle.36 Dastsooz et al showed that UBE2C is upregulated in all 27 different types of cancer, a finding that agrees with our results showing increased somatic expression of UBE2C in BC.37 Moreover, Qin et al found that UBE2C upregulation is associated with poor prognosis in BC.38 Rawat et al demonstrated that inhibiting UBE2C sensitizes BC cells to radiation, doxorubicin, and hormone-blocking agents.39 Therefore, UBE2C is a potential therapeutic target for the enhancement of radiation and chemo-sensitization treatments against BC. CCNA2, also known as CyclinA2, belongs to the highly conserved cyclin family and is found in almost all human body tissues.40 Results of several studies have shown that CCNA2 is overexpressed in various malignancies and may be involved in the processes of epithelial-mesenchymal transitions (EMT) and metastasis.41,42 Gao et al showed that CCNA2 might serve as a biomarker for the prognosis of ER+ BC and monitor the efficacy of tamoxifen.43 In another study, cyclinA2 proteins were suppressed by aspirin and salicylic acid in multiple cancer cell lines, indicating that they may serve as a novel target and mechanism of chemoresistance.44 Previous studies have demonstrated that GTSE1, an x that is upregulated in dozens of cancers, plays an essential role in cell cycle regulation and is involved in chemoresistance, chromosome instability (CIN), and metastasis.45–47 BC patients with high GTSE1 levels always have poor OS and are unlikely to survive disease-free, indicating that GTSE1 overexpression correlates with unfavorable outcomes.46 The silencing of GTSE1 results in cancer cell death by increasing its sensitivity to paclitaxel and cisplatin.48 Thus, GTSE1 can be considered a new target for the treatment of cancers, including BC. MND1, along with HOP2, is part of a highly conserved heterodimeric protein complex that plays important roles in binding DNA and stimulating the recombinase activities of RAD51 and DMC1, which are indispensable for meiotic recombination.49–51 While evidence for the association between MND1 and cancers is sparse, Wu et al found that this gene is included in a panel of four genes (MND1, FOXM1, CDC6, and POLE2) that are significantly associated with low survival against squamous cell lung cancer.52 Another study demonstrated that mRNA patterns combining AKT3, PTTG1, MND1, and CENPF can potentially serve as a strong biomarker for monitoring the growth and metastasis of ovarian cancer.53 A recent study conducted by Dastsooz et al showed that the expression of MND1 is associated with BC prognosis.37 However, no study has yet explored the biological functions of MND1 and how its role in tumors. As a result, we selected MND1 as a major hub gene for further investigation, analyzing its expression in BC as well as its relationship to clinical features and prognosis.
MND1 expression is both positive and significantly greater in the BC group than in the normal breast groups, according to IHC staining results. The Cox multivariate regression model based on the TCGA-BRCA cohort demonstrated that high MND1 expression, metastasis, and age are independent risk factors affecting BC’s prognosis. MND1 upregulation may play an important role in BC, and MND1 could serve as a useful biomarker for screening early BC and assessing the prognosis of BC patients.
The presence of immune cells in tumors is closely related to a patient’s clinical prognosis. Immune cell infiltration is the movement of immunological cells from the bloodstream to tumor tissue, which is a part of cancer’s immune escape strategy. Anti-cancer medicines also target immune cell infiltration.54 TIMER analysis showed the expression of MND1 is positively correlated with the infiltration level of B cells, CD8 + T cells, CD4 + T cells, macrophages, neutrophils, and dendritic cells in BC patients. Immune cell infiltration deficiency or malfunctioning in malignancies can lead to immune escape and increase tumor development. Novel treatments targeting tumor immune escape, notably inhibitory receptors involved in T cell activity control, have been proposed.55 However, further experimental verification is needed to identify reliable BC immunotherapy targets and understand the relationship between MND1 and immune infiltrating cells and the effect of MND1 on the BC immune system. MND1 is upregulated in a variety of cancers besides BC; specifically, it is upregulated in lung adenocarcinoma, colon adenocarcinoma, and head and neck squamous cell carcinoma.
Conclusions
Bioinformatics analysis based on the construction of a co-expression network by WGCNA has identified five BC hub genes: MKI67, UBE2C, GTSE1, CCNA2, and MND1. These genes may participate in BC and impact BC prognosis. Moreover, we speculate that MND1, via immune-related biological processes and pathways, may act as a tumor suppressor gene in BC development. Determining the clinical value of our findings and the molecular mechanisms involved will require further exploration in future studies.
Ethics Approval
Ethical approval for this study was obtained from the Clinical Research Ethics Committee of Suzhou Municipal Hospital. This study was conducted in accordance with the declaration of Helsinki. Written informed consent was obtained from all participants.
Acknowledgments
This study was supported by Suzhou Applied Basic Research Fund (SKJY2021126); Beijing Xisk Clinical Oncology Research Foundation (Y-Young2021-0087); Wuxi Taihu Lake Talent Plan, Supports for Leading Talents in Medical and Health Profession; Maternal and Child Health Research Project of Jiangsu Commission of Health (F202009); Scientific Research Project of Jiangsu Maternal and Child Health Association (FYX202016); and Scientific Research Project of Wuxi Commission of Health (M202041).
Disclosure
The authors have no conflicts of interest to declare.
References
1. Bray F, Ferlay J, Soerjomataram I, Siegel RL, Torre LA, Jemal A. Global cancer statistics 2018: GLOBOCAN estimates of incidence and mortality worldwide for 36 cancers in 185 countries. CA Cancer J Clin. 2018;68(6):394–424. doi:10.3322/caac.21492
2. Zhu J, Wu G, Zhao Y, et al. Epidemiology, treatment and prognosis analysis of small cell breast carcinoma: a population-based study. Front Endocrinol. 2022;13:802339. doi:10.3389/fendo.2022.802339
3. Harbeck N, Gnant M. Breast cancer. Lancet. 2017;389(10074):1134–1150. doi:10.1016/S0140-6736(16)31891-8
4. Jung KH, Ataseven B, Verrill M, et al. Adjuvant subcutaneous trastuzumab for HER2-positive early breast cancer: subgroup analyses of safety and active medical conditions by body weight in the SafeHer phase III study. Oncologist. 2018;23(10):1137–1143. doi:10.1634/theoncologist.2018-0065
5. Rimawi M, Ferrero JM, de la Haba-rodriguez J, et al. First-line trastuzumab plus an aromatase inhibitor, with or without pertuzumab, in human epidermal growth factor receptor 2-positive and hormone receptor-positive metastatic or locally advanced breast cancer (PERTAIN): a randomized, open-label phase II trial. J Clin Oncol. 2018;36(28):2826–2835. doi:10.1200/JCO.2017.76.7863
6. Sagara Y, Takada M, Ohi Y, et al. Effectiveness of neo-adjuvant systemic therapy with trastuzumab for basal HER2 type breast cancer: results from retrospective cohort study of Japan Breast Cancer Research Group (JBCRG)-C03. Breast Cancer Res Treat. 2018;171(3):675–683. doi:10.1007/s10549-018-4873-0
7. Takada M, Sugimoto M, Masuda N, et al. Prediction of postoperative disease-free survival and brain metastasis for HER2-positive breast cancer patients treated with neoadjuvant chemotherapy plus trastuzumab using a machine learning algorithm. Breast Cancer Res Treat. 2018;172(3):611–618. doi:10.1007/s10549-018-4958-9
8. Tang J, Yang Q, Cui Q, et al. Weighted gene correlation network analysis identifies RSAD2, HERC5, and CCL8 as prognostic candidates for breast cancer. J Cell Physiol. 2020;235(1):394–407. doi:10.1002/jcp.28980
9. Guo X, Xiao H, Guo S, Dong L, Chen J. Identification of breast cancer mechanism based on weighted gene coexpression network analysis. Cancer Gene Ther. 2017;24(8):333–341. doi:10.1038/cgt.2017.23
10. Dezso Z, Oestreicher J, Weaver A, et al. Gene expression profiling reveals epithelial mesenchymal transition (EMT) genes can selectively differentiate eribulin sensitive breast cancer cells. PLoS One. 2014;9(8):e106131. doi:10.1371/journal.pone.0106131
11. Robinson MD, McCarthy DJ, Smyth GK. edgeR: a bioconductor package for differential expression analysis of digital gene expression data. Bioinformatics. 2010;26(1):139–140. doi:10.1093/bioinformatics/btp616
12. Anders S, Huber W. Differential expression analysis for sequence count data. Genome Biol. 2010;11(10):R106. doi:10.1186/gb-2010-11-10-r106
13. Langfelder P, Horvath S. WGCNA: an R package for weighted correlation network analysis. BMC Bioinform. 2008;9(1):559. doi:10.1186/1471-2105-9-559
14. Botia JA, Vandrovcova J, Forabosco P, et al. An additional k-means clustering step improves the biological features of WGCNA gene co-expression networks. BMC Syst Biol. 2017;11(1):47. doi:10.1186/s12918-017-0420-6
15. Huang da W, Sherman BT, Lempicki RA. Systematic and integrative analysis of large gene lists using DAVID bioinformatics resources. Nat Protoc. 2009;4(1):44–57. doi:10.1038/nprot.2008.211
16. Chin CH, Chen SH, Wu HH, Ho CW, Ko MT, Lin CY. cytoHubba: identifying hub objects and sub-networks from complex interactome. BMC Syst Biol. 2014;8(Suppl 4):S11. doi:10.1186/1752-0509-8-S4-S11
17. Gyorffy B, Lanczky A, Szallasi Z. Implementing an online tool for genome-wide validation of survival-associated biomarkers in ovarian-cancer using microarray data from 1287 patients. Endocr Relat Cancer. 2012;19(2):197–208. doi:10.1530/ERC-11-0329
18. Tang Z, Li C, Kang B, Gao G, Li C, Zhang Z. GEPIA: a web server for cancer and normal gene expression profiling and interactive analyses. Nucleic Acids Res. 2017;45(W1):W98–W102. doi:10.1093/nar/gkx247
19. Rhodes DR, Kalyana-Sundaram S, Mahavisno V, et al. Oncomine 3.0: genes, pathways, and networks in a collection of 18,000 cancer gene expression profiles. Neoplasia. 2007;9(2):166–180. doi:10.1593/neo.07112
20. Vasaikar SV, Straub P, Wang J, Zhang B. LinkedOmics: analyzing multi-omics data within and across 32 cancer types. Nucleic Acids Res. 2018;46(D1):D956–D963. doi:10.1093/nar/gkx1090
21. Chandrashekar DS, Bashel B, Balasubramanya SAH, et al. UALCAN: a portal for facilitating tumor subgroup gene expression and survival analyses. Neoplasia. 2017;19(8):649–658. doi:10.1016/j.neo.2017.05.002
22. Modhukur V, Iljasenko T, Metsalu T, et al. MethSurv: a web tool to perform multivariable survival analysis using DNA methylation data. Epigenomics. 2018;10(3):277–288. doi:10.2217/epi-2017-0118
23. Zhang C, Zhao N, Zhang X, et al. SurvivalMeth: a web server to investigate the effect of DNA methylation-related functional elements on prognosis. Brief Bioinform. 2021;22(3):bbaa162. doi:10.1093/bib/bbaa162
24. Anuraga G, Wang WJ, Phan NN, et al. Potential prognostic biomarkers of NIMA (Never in Mitosis, Gene A)-Related Kinase (NEK) family members in breast cancer. J Pers Med. 2021;11(11):1089. doi:10.3390/jpm11111089
25. Liu F, Wu H. Identification of prognostic biomarkers and molecular targets among JAK family in breast cancer. J Inflamm Res. 2021;14:97–114. doi:10.2147/JIR.S284889
26. Li T, Fan J, Wang B, et al. TIMER: a web server for comprehensive analysis of tumor-infiltrating immune cells. Cancer Res. 2017;77(21):e108–e110. doi:10.1158/0008-5472.CAN-17-0307
27. Subramanian A, Narayan R, Corsello SM, et al. A next generation connectivity map: L1000 platform and the first 1,000,000 profiles. Cell. 2017;171(6):1437–1452.e17. doi:10.1016/j.cell.2017.10.049
28. Wang CY, Chiao CC, Phan NN, et al. Gene signatures and potential therapeutic targets of amino acid metabolism in estrogen receptor-positive breast cancer. Am J Cancer Res. 2020;10(1):95–113.
29. Ye H, Sun M, Huang S, et al. Gene network analysis of hepatocellular carcinoma identifies modules associated with disease progression, survival, and chemo drug resistance. Int J Gen Med. 2021;14:9333–9347. doi:10.2147/IJGM.S336729
30. Inari H, Suganuma N, Kawachi K, et al. Clinicopathological and prognostic significance of Ki-67 immunohistochemical expression of distant metastatic lesions in patients with metastatic breast cancer. Breast Cancer. 2017;24(6):748–755. doi:10.1007/s12282-017-0774-z
31. Piri R, Ghaffari A, Azami-Aghdash S, Ali-Akbar YP, Saleh P, Naghavi-Behzad M. Ki-67/MIB-1 as a prognostic marker in cervical cancer - A systematic review with meta-analysis. Asian Pac J Cancer Prev. 2015;16(16):6997–7002. doi:10.7314/APJCP.2015.16.16.6997
32. Li W, Zhang G, Wang HL, Wang L. Analysis of expression of cyclin E, p27kip1 and Ki67 protein in colorectal cancer tissues and its value for diagnosis, treatment and prognosis of disease. Eur Rev Med Pharmacol Sci. 2016;20(23):4874–4879.
33. Xiong DD, Zeng CM, Jiang L, Luo DZ, Chen G. Ki-67/MKI67 as a predictive biomarker for clinical outcome in gastric cancer patients: an updated meta-analysis and systematic review involving 53 studies and 7078 patients. J Cancer. 2019;10(22):5339–5354. doi:10.7150/jca.30074
34. Zhang Y, Chen ZD, et al. siRNA targeting survivin inhibits growth and induces apoptosis in human renal clear cell carcinoma 786-O cells. Pathol Res Pract. 2009;205(12):823-7. doi:10.1016/j.prp.2009.06.018.
35. Jiang G, Jiang AJ, Cheng Q, Tian H, Li LT, Zheng JN. A dual-regulated oncolytic adenovirus expressing interleukin-24 sensitizes melanoma cells to temozolomide via the induction of apoptosis. Tumour Biol. 2013;34(2):1263–1271. doi:10.1007/s13277-013-0701-7
36. Townsley FM, Aristarkhov A, Beck S, Hershko A, Ruderman JV. Dominant-negative cyclin-selective ubiquitin carrier protein E2-C/UbcH10 blocks cells in metaphase. Proc Natl Acad Sci U S A. 1997;94(6):2362–2367. doi:10.1073/pnas.94.6.2362
37. Dastsooz H, Cereda M, Donna D, Oliviero S. A comprehensive bioinformatics analysis of UBE2C in cancers. Int J Mol Sci. 2019;20(9):2228. doi:10.3390/ijms20092228
38. Qin T, Huang G, Chi L, et al. Exceptionally high UBE2C expression is a unique phenomenon in basal-like type breast cancer and is regulated by BRCA1. Biomed Pharmacother. 2017;95:649–655. doi:10.1016/j.biopha.2017.08.095
39. Rawat A, Gopal G, Selvaluxmy G, Rajkumar T. Inhibition of ubiquitin conjugating enzyme UBE2C reduces proliferation and sensitizes breast cancer cells to radiation, doxorubicin, tamoxifen and letrozole. Cell Oncol. 2013;36(6):459–467. doi:10.1007/s13402-013-0150-8
40. Ko E, Kim Y, Cho EY, et al. Synergistic effect of Bcl-2 and cyclin A2 on adverse recurrence-free survival in stage I non-small cell lung cancer. Ann Surg Oncol. 2013;20(3):1005–1012. doi:10.1245/s10434-012-2727-2
41. Bendris N, Arsic N, Lemmers B, Blanchard JM. Cyclin A2, Rho GTPases and EMT. Small GTPases. 2012;3(4):225–228. doi:10.4161/sgtp.20791
42. Uhlen M, Oksvold P, Fagerberg L, et al. Towards a knowledge-based human protein atlas. Nat Biotechnol. 2010;28(12):1248–1250. doi:10.1038/nbt1210-1248
43. Gao T, Han Y, Yu L, Ao S, Li Z, Ji J. CCNA2 is a prognostic biomarker for ER+ breast cancer and tamoxifen resistance. PLoS One. 2014;9(3):e91771. doi:10.1371/journal.pone.0091771
44. Dachineni R, Ai G, Kumar DR, Sadhu SS, Tummala H, Bhat GJ. Cyclin A2 and CDK2 as novel targets of aspirin and salicylic acid: a potential role in cancer prevention. Mol Cancer Res. 2016;14(3):241–252. doi:10.1158/1541-7786.MCR-15-0360
45. Bublik DR, Scolz M, Triolo G, Monte M, Schneider C. Human GTSE-1 regulates p21(CIP1/WAF1) stability conferring resistance to paclitaxel treatment. J Biol Chem. 2010;285(8):5274–5281. doi:10.1074/jbc.M109.045948
46. Scolz M, Widlund PO, Piazza S, et al. GTSE1 is a microtubule plus-end tracking protein that regulates EB1-dependent cell migration. PLoS One. 2012;7(12):e51259. doi:10.1371/journal.pone.0051259
47. Utrera R, Collavin L, Lazarevic D, Delia D, Schneider C. A novel p53-inducible gene coding for a microtubule-localized protein with G2-phase-specific expression. EMBO J. 1998;17(17):5015–5025. doi:10.1093/emboj/17.17.5015
48. Subhash VV, Tan SH, Tan WL, et al. GTSE1 expression represses apoptotic signaling and confers cisplatin resistance in gastric cancer cells. BMC Cancer. 2015;15(1):550. doi:10.1186/s12885-015-1550-0
49. Guo L, Zhang S, Zhang B, et al. Silencing GTSE-1 expression inhibits proliferation and invasion of hepatocellular carcinoma cells. Cell Biol Toxicol. 2016;32(4):263–274. doi:10.1007/s10565-016-9327-z
50. Lee J, Sung CO, Lee EJ, et al. Metastasis of neuroendocrine tumors are characterized by increased cell proliferation and reduced expression of the ATM gene. PLoS One. 2012;7(4):e34456. doi:10.1371/journal.pone.0034456
51. Neapolitan RE, Jiang X. Study of integrated heterogeneous data reveals prognostic power of gene expression for breast cancer survival. PLoS One. 2015;10(2):e0117658. doi:10.1371/journal.pone.0117658
52. Wu Z, Wang YM, Dai Y, Chen LA. POLE2 Serves as a Prognostic Biomarker and Is Associated with Immune Infiltration in Squamous Cell Lung Cancer. Med Sci Monit. 2020;26:e921430. doi:10.12659/MSM.921430.
53. Yeganeh PN, Richardson C, Bahrani-Mostafavi Z, Tait DL, Mostafavi MT. Dysregulation of AKT3 along with a small panel of mRNAs stratifies high-grade serous ovarian cancer from both normal epithelia and benign tumor tissues. Genes Cancer. 2017;8(11–12):784–798. doi:10.18632/genesandcancer.164
54. Xia W, Mao W, Chen R, et al. Epidermal growth factor receptor mutations in resectable non-small cell lung cancer patients and their potential role in the immune landscape. Med Sci Monit. 2019;25:8764–8776. doi:10.12659/MSM.920042
55. Antomarchi J, Ambrosetti D, Cohen C, et al. Immunosuppressive tumor microenvironment status and histological grading of endometrial carcinoma. Cancer Microenviron. 2019;12(2–3):169–179. doi:10.1007/s12307-019-00225-1
 © 2022 The Author(s). This work is published and licensed by Dove Medical Press Limited. The full terms of this license are available at https://www.dovepress.com/terms.php and incorporate the Creative Commons Attribution - Non Commercial (unported, v3.0) License.
By accessing the work you hereby accept the Terms. Non-commercial uses of the work are permitted without any further permission from Dove Medical Press Limited, provided the work is properly attributed. For permission for commercial use of this work, please see paragraphs 4.2 and 5 of our Terms.
© 2022 The Author(s). This work is published and licensed by Dove Medical Press Limited. The full terms of this license are available at https://www.dovepress.com/terms.php and incorporate the Creative Commons Attribution - Non Commercial (unported, v3.0) License.
By accessing the work you hereby accept the Terms. Non-commercial uses of the work are permitted without any further permission from Dove Medical Press Limited, provided the work is properly attributed. For permission for commercial use of this work, please see paragraphs 4.2 and 5 of our Terms.