")
Back to Journals » OncoTargets and Therapy » Volume 9
Using the geometric mean fluorescence intensity index method to measure ZAP-70 expression in patients with chronic lymphocytic leukemia
Authors Wu Y, Wang H, Liang J, Miao Y, Liu L, Qiu H, Chun Q, Wang R , Li J
Received 17 August 2015
Accepted for publication 10 November 2015
Published 18 February 2016 Volume 2016:9 Pages 797—805
DOI https://doi.org/10.2147/OTT.S94613
Checked for plagiarism Yes
Review by Single anonymous peer review
Peer reviewer comments 2
Editor who approved publication: Dr William C. Cho
Yu-Jie Wu, Hui Wang, Jian-Hua Liang, Yi Miao, Lu Liu, Hai-Rong Qiu, Chun Qiao, Rong Wang, Jian-Yong Li
Department of Hematology, First Affiliated Hospital of Nanjing Medical University, Jiangsu Province Hospital, Nanjing, People’s Republic of China
Abstract: Expression of ζ-chain-associated protein kinase 70 kDa (ZAP-70) in chronic lymphocytic leukemia (CLL) is associated with more aggressive disease and can help differentiate CLL from cases expressing mutated or unmutated immunoglobulin heavy chain variable region (IgHV) genes. However, standardizing ZAP-70 expression by flow cytometric analysis has proved unsatisfactory. The key point is that ZAP-70 is weakly expressed with a continuous expression pattern rather than a clear discrimination between positive and negative CLL cells, which means that the resulting judgment is subjective. Thus, in this study, we aimed at assessing the reliability and repeatability of ZAP-70 expression using the geometric mean fluorescence intensity (geo MFI) index method based on flow cytometry with 256-channel resolution in a series of 402 CLL patients and to compare ZAP-70 with other biological and clinical prognosticators. According to IgHV mutational status, we were able to confirm that the optimal cut-off point for the geo MFI index was 3.5 in the test set. In multivariate analyses that included the major clinical and biological prognostic markers for CLL, the prognostic impact of ZAP-70 expression appeared to have stronger discriminatory power when the geo MFI index method was applied. In addition, we found that ZAP-70-positive patients according to the geo MFI index method had shorter time to first treatment or overall survival (P=0.0002, P=0.0491). This is the first report showing that ZAP-70 expression can be evaluated by a new approach, the geo MFI index, which could be a useful prognostic method as it is more reliable, less subjective, and therefore better associated with improvement of CLL prognostication and prediction of clinical course.
Keywords: chronic lymphocytic leukemia, ZAP-70, flow cytometry, prognosis, geometric mean fluorescence intensity index
Introduction
Chronic lymphocytic leukemia (CLL) is a B-cell chronic lymphoproliferative disorder characterized by proliferation of small B-cells expressing the CD5+CD23+ antigens.1,2 The clinical course of CLL is heterogeneous. Some patients have aggressive disease and a short survival, while others have an almost normal life expectancy without the need for treatment. Therefore, constantly emerging biological parameters have been used to try to differentiate between the prognostic subsets.3–5 Using retrospective studies, the mutational status of immunoglobulin heavy chain variable region (IgHV) genes has been identified as a prognostic marker that can distinguish CLL patients with aggressive disease from those with a more indolent clinical course.6,7 Unfortunately, IgHV mutational analysis is complex, expensive, time consuming, and difficult to perform in a routine clinical laboratory. Subsequently, several studies have measured ζ-chain-associated protein kinase 70 kDa (ZAP-70) protein expression in CLL using flow cytometry, and showed that the expression of ZAP-70 may serve as a strong surrogate marker for IgHV mutational status in distinguishing heterogeneity of CLL. The expression of ZAP-70 was found to be higher in patients with unmutated IgHV genes than in those with mutated genes; the predominant method of quantification being flow cytometry.8–10 However, flow cytometric analysis of ZAP-70 has proven to be problematic in follow-up studies, although various methods for the detection of ZAP-70 by flow cytometry have been evaluated to develop an optimized assay for determining ZAP-70 expression.8,11,12 Unfortunately, to date a consensus has not been reached.
In this study, we aimed at developing a more reasonable and objective flow cytometric assay strategy to evaluate the clinical impact of ZAP-70 expression in the hope that a new method could be established to reduce interlaboratory discrepancies. To validate this technique, we took advantage of a consecutive series of 402 CLL cases, all with a complete clinical and biological prognostic assessment.
Materials and methods
Patients
Peripheral blood samples were collected from 402 previously untreated patients with CLL, between January 2008 and March 2015. All samples were collected into heparinized or EDTA tubes. All patients met the International Workshop CLL criteria for the diagnosis and treatment of CLL.13 A complete clinical and biological assessment was available for all samples, including Binet stage at diagnosis, IgHV and p53 gene mutational status, β2-microglobulin (β2-MG), interphase fluorescence in situ hybridization (FISH) analysis, and CD38 status.13,14 This study was approved by the ethical committee of the First Affliated Hospital of Nanjing Medical University, and written informed consent was obtained from all patients. The clinical characteristics are summarized in Table 1.
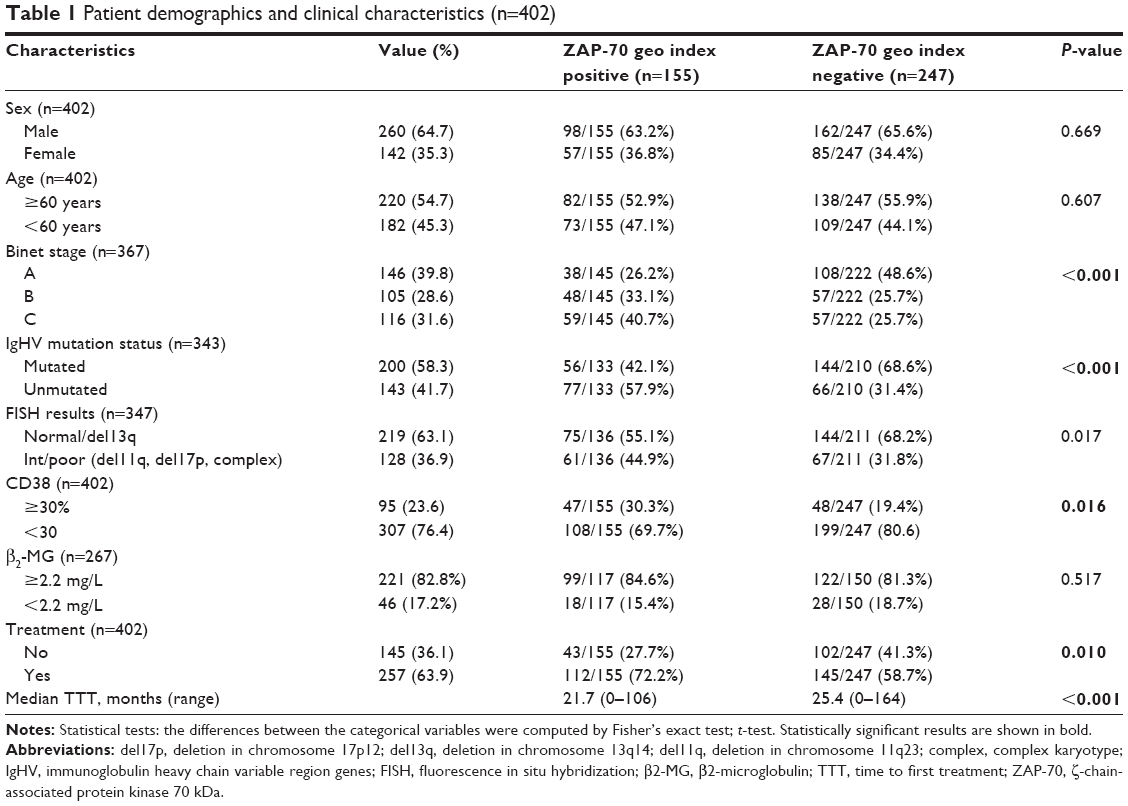 | Table 1 Patient demographics and clinical characteristics (n=402) |
ZAP-70 Protein Staining
ZAP-70 analysis was performed on fresh cells within 8 hours of blood collection. For each sample, cells were counted and whole blood was diluted with PBS to a final concentration of 5×10⁶ to 10×106 cells/mL. One million cells were stained with CD3 FITC (clone SK7), CD19 PerCP-Cy5.5 (clone SJ25C1), and CD5APC (clone L17F12; all from BD Biosciences, San Jose, CA, USA) for 15 mintues in the dark, and then treated with fixatives and permeabilizing reagents (BD Biosciences) according to the manufacturer’s instructions. The cells were then stained with 5 μL of phycoerythrin (PE)-conjugated anti-ZAP-70 (clone 1E7.2, BD Biosciences), followed by vortexing for 2–3 seconds and incubation for 20 minutes at room temperature. Control cells were stained with an isotype-matched PE-conjugated control mAb (BD Biosciences). Cells were then washed once in 2 mL phosphate-buffered saline (PBS), resuspended in 500 μL PBS, and analyzed by flow cytometry on a FACSCalibur flow cytometer and analyzed with CellQuest software (BD Biosciences).
The stained lymphocytes were gated on the basis of their forward and side light-scatter properties. For each sample, 40,000 events were acquired and analyzed using CellQuest Software. For analysis of ZAP-70 expression in CLL patients, two different methods were used: 1) Percentage of positive cells compared to T-cells: The ZAP-70 expression of CLL cells was estimated according to an approach by Crespo et al.8,15 Briefly, the lower limit of the fluorescence range corresponding to 98% positive internal T-cells was used as the threshold marker. The threshold for positivity for ZAP-70 was 20%. 2) The geometric mean fluorescence intensity (geo MFI) index method: this approach was based on the evaluation of ZAP-70 expression levels in terms of geo MFI index. A two-tube method was used to calculate the ZAP-70 geo MFI index obtained from T-lymphocytes, CLL cells, and PE-conjugated isotype controls from CLL cells. Each program permits the analysis of ZAP-70 or PE-conjugated isotype control histograms with 256-channel resolution. Nonspecific staining was evaluated on gated CLL cells in a CD19/PE-isotype control plot, setting the electric voltage and compensation so that the geo mean of CLL cells was 10±1 (tube 2). Subsequently, ZAP-70 was measured on a histogram, utilizing the “geo mean” parameter, on gated T-lymphocytes (T-geo mean), or CLL cells (B-geo mean) as defined in the CD3/CD5 or CD5/CD19 dot plot (tube 1). Values of the isotype control and CLL cells were determined from the CD5+CD19+ gate and a minimum of 20,000 cells was collected. The T-cell geo mean was determined from the gate of CD3+CD5+ cells (minimum collection of 1,000 cells). These values were then used to calculate the geo MFI index between corresponding T-geo mean and B-geo mean values (T/B geo mean). Youden’s index was calculated in patients to optimize sensitivity and specificity of the ZAP-70 geo MFI index in distinguishing between those with mutated and unmutated IgHV status, and the 3.5 index value was very near to the best cut-off. Therefore, the geo MFI index lower than 3.5 was used as the threshold for ZAP-70 positivity.
CD38 expression by flow cytometry
CD38 was measured with CD5-FITC (BD Biosciences), CD19-PerCP (BD Biosciences), and CD38-PE (clone HB-7; BD Biosciences). Isotype controls were run with each sample to distinguish positive cells from negative cells. CD5+CD19+ were gated, and CD38+ cells were measured in CD5+CD19+ lymphocyte population. The cut-off point for CD38-positive CLL cells was >30%.
Statistical evaluation
All statistical analyses were carried out using SPSS (version 17.0; IBM Corporation, Armonk, NY, USA). Differences in time to first treatment (TTT) and overall survival (OS) were assessed using the log-rank test, and survival curves were constructed according to the Kaplan–Meier method. Receiver operating characteristic curve analysis representing the relationship between sensitivity and specificity was compared by a nonparametric approach. The cut-off value for the geo MFI index method of ZAP-70 quantification was estimated in the training cohort by maximizing Youden’s index (J = Sensitivity + Specificity − 1). Multinomial logistic regression with ZAP-70 as dependent variable was used for multivariate analyses. A P-value lower than 0.05 was considered statistically significant, and all tests were two tailed.
Results
Clinical and biological features according to ZAP-70 geo MFI index
The characteristics of the 402 subjects are summarized in Table 1. Median age was 60.8 years (range: 16–92), with 54.7% of the cohort aged 60 years or older, and the male/female ratio was 1.79:1. Median follow-up was 36.4 months (range: 1–267 months). Overall, ZAP-70 geo MFI index was positive in 155 (38.6%) of the 402 CLL patients. There were significant differences in the distributions of some clinical and biological features between the ZAP-70-positive and ZAP-70-negative patients, as listed in Table 1. In particular, 143/343 CLL patients had no mutation in the IgHV gene (41.7%). When the two readouts showed that the IgHV gene was not mutated and ZAP-70 status was positive, correlation analysis showed a significant concordance of 57.7% (P=0.051) and 64.4% (P<0.001) by applying the percentage and the geo MFI index methods, respectively (Table 2). The concordance of P53 disruption status in geo MFI index group was higher than percentage methods (64.4% and 57.7%); however, there was no statistical significance (P=0.059; Table 3). In addition, the patients with a ZAP-70 geo MFI index higher than 3.5 presented with significantly lower clinical stage, fewer CD38 negative cases (<30%), and more favorable cytogenetic lesions compared to the index-positive patients.
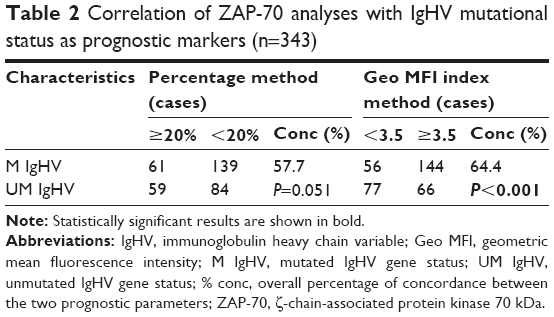 | Table 2 Correlation of ZAP-70 analyses with IgHV mutational status as prognostic markers (n=343) |
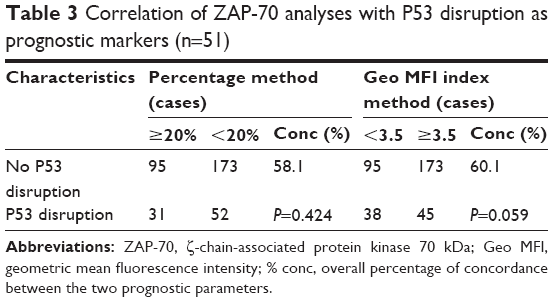 | Table 3 Correlation of ZAP-70 analyses with P53 disruption as prognostic markers (n=51) |
ZAP-70 expression according to the percentage and geo MFI index methods
According to the percentage method, in which ZAP-70 evaluation is driven by the residual population of normal T-cells, 142/402 (35.3%) cases were defined as ZAP-70 positive using a cut-off value at 20% of positive cells. In the case of the geo MFI index method, in which ZAP-70 expression is evaluated taking into account the ISO B-, T-, and B-geo means, the optimal cut-off value of 3.5 was estimated by calculating the ZAP-70 geo MFI index at 256 channel resolution (Figure 1). In our series, 155 CLL patients (38.6%) had geo MFI index values ≥3.5 (ie, ZAP-70 negative), while 247 CLL patients (61.4%) had values <3.5, and were, therefore, considered as ZAP-70-positive cases (Table 1).
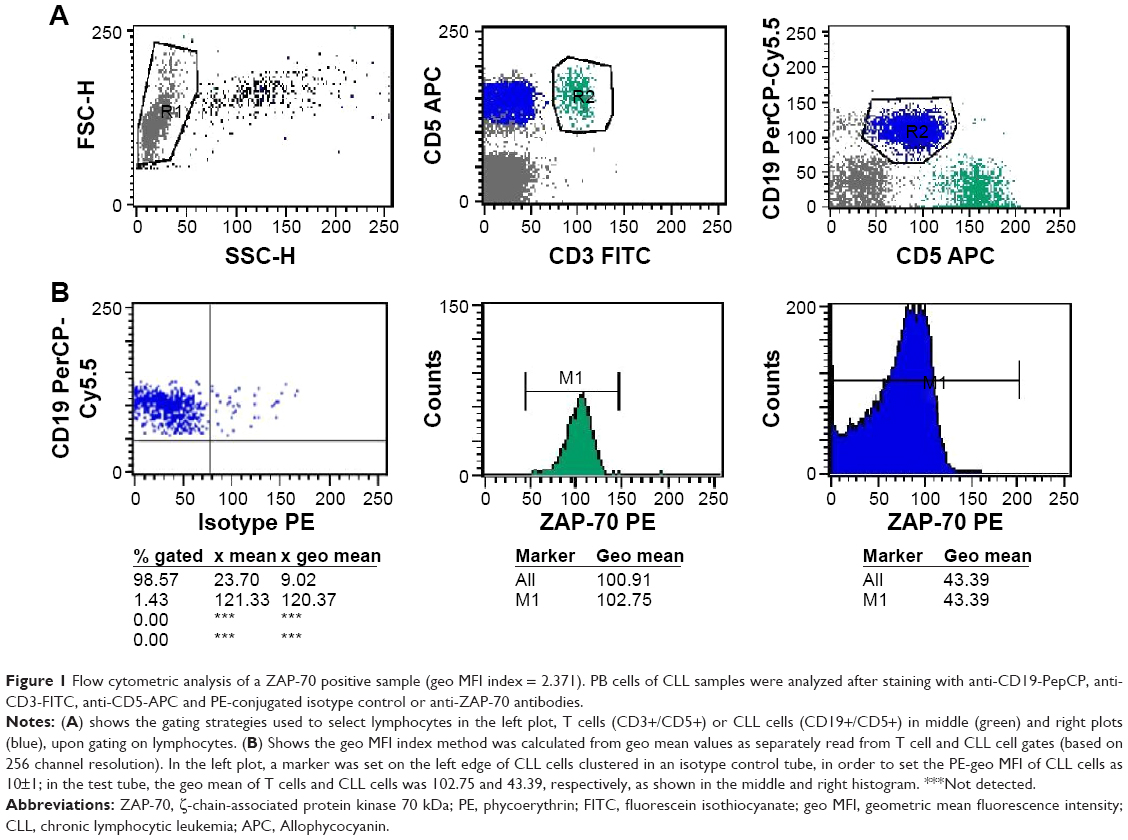 | Figure 1 Flow cytometric analysis of a ZAP-70 positive sample (geo MFI index = 2.371). PB cells of CLL samples were analyzed after staining with anti-CD19-PepCP, anti-CD3-FITC, anti-CD5-APC and PE-conjugated isotype control or anti-ZAP-70 antibodies. |
The arithmetic mean and geo mean of CLL cells were analyzed for their FL2 signals in the isotype tube. These parameters were then used to evaluate the ZAP-70-labeled T-cells, as detected in the test tube. The mean ± standard deviation (SD) was 24.79±2.02, 10.03±0.61, 108.1+10.8, and 108.5+10.5 for mean ISO B-, geo mean ISO B-, mean T-, and geo mean T-cells, respectively (Figure 2).
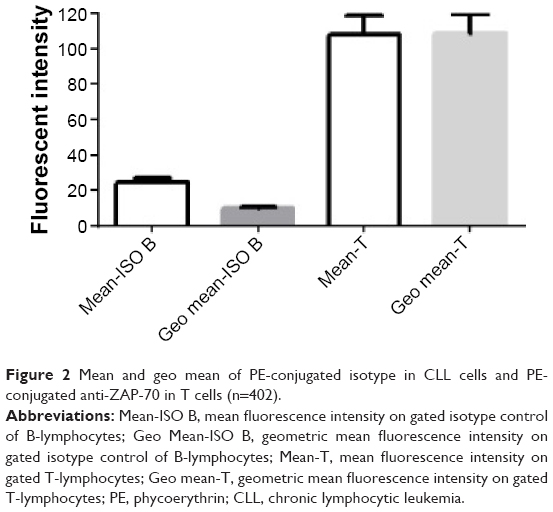 | Figure 2 Mean and geo mean of PE-conjugated isotype in CLL cells and PE-conjugated anti-ZAP-70 in T cells (n=402). |
Moreover, the data of eleven samples were independently evaluated by three operators. In the geo MFI index experiment and arithmetic mean fluorescence intensity (MFI) ratio method,16 concordance in ZAP-70 expression was demonstrated in all patients. In contrast to these two analytic strategies, three CLL patients exhibited marked variation in ZAP-70 expression by the percentage method. It was difficult to distinguish positive and negative ZAP-70 values because the proportion varied between 15% and 25% (Figure 3). Moreover, when the result of percentage was compared with geo MFI in 402 CLL patients, there was discordance in 40 CLL cases (10%), and the percentage also varied between 15% and 25% all these 40 cases.
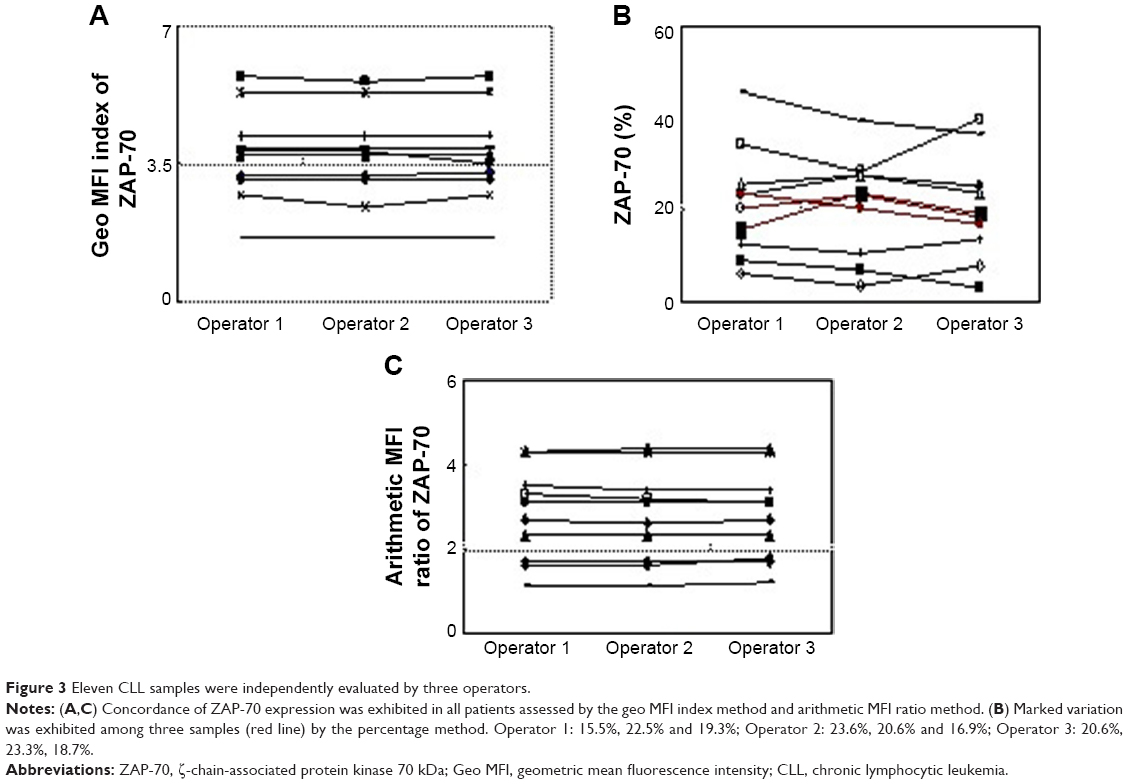 | Figure 3 Eleven CLL samples were independently evaluated by three operators. |
Prognostic relevance of ZAP-70 geo MFI index and univariate analysis
The expression of ZAP-70 geo MFI index and other known prognostic factors were analyzed in our cohort (Table 1). Using the ZAP-70 geo MFI index, we analyzed the different expression of these markers in ZAP-70-positive and ZAP-70-negative groups. Univariate analysis identified high expression of CD38, β2-MG, unmutated IgHV, high risk cytogenetic lesions, defined as del11q, del17p, or complex karyotype, and Binet stage as statistically significant predictors of poor prognosis. As shown in Table 1, the ZAP-70-positive group was significantly associated with unmutated IgHV (P<0.001), CD38 (P=0.016), cytogenetic abnormalities (P=0.017), and Binet stage (P<0.001 and P=0.002), but there was no statistically significant association with β2-MG (P=0.517).
Multinomial logistic regression with pooled multivariable analysis
For the multinomial logistic regression analysis, four independent variables which were associated with ZAP-70 expression at level of P-value <0.05 in the bivariate analysis were retained in the analysis. These were Binet stage, IgHV mutation status, FISH results, and CD38. Those with values <0.05 in the multivariable were considered statistically significant and were considered independent predictors of the ZAP-70 geo index. IgHV mutation status and Binet stage were significant throughout the study (odds ratio [OR]: 2.394, 95% confidence interval [CI]: 1.440–3.980 and OR: 1.561, 95% CI: 1.150–2.119; Table 4).
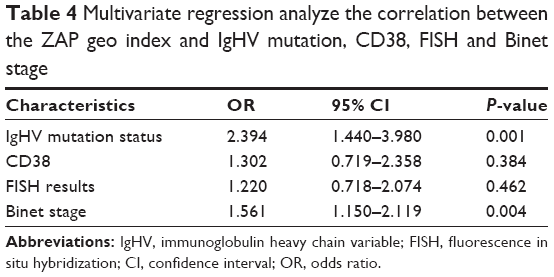 | Table 4 Multivariate regression analyze the correlation between the ZAP geo index and IgHV mutation, CD38, FISH and Binet stage |
ZAP-70 expression according to the percentage and geo MFI index methods: prognostic significance
TTT and OS were assessed relative to ZAP-70 levels evaluated by the percentage or geo MFI index method in CLL cells. As shown in Figure 4, regardless of the readout chosen to evaluate ZAP-70 expression, lower ZAP-70 geo MFI index levels always correlated with shorter TTT and OS in CLL (Figure 4B and E; P=0.0002, P=0.0491). However, there was no significant difference for the patients with a high percentage of ZAP-70 (Figure 4A and D; P=0.2639, P=0.5787).
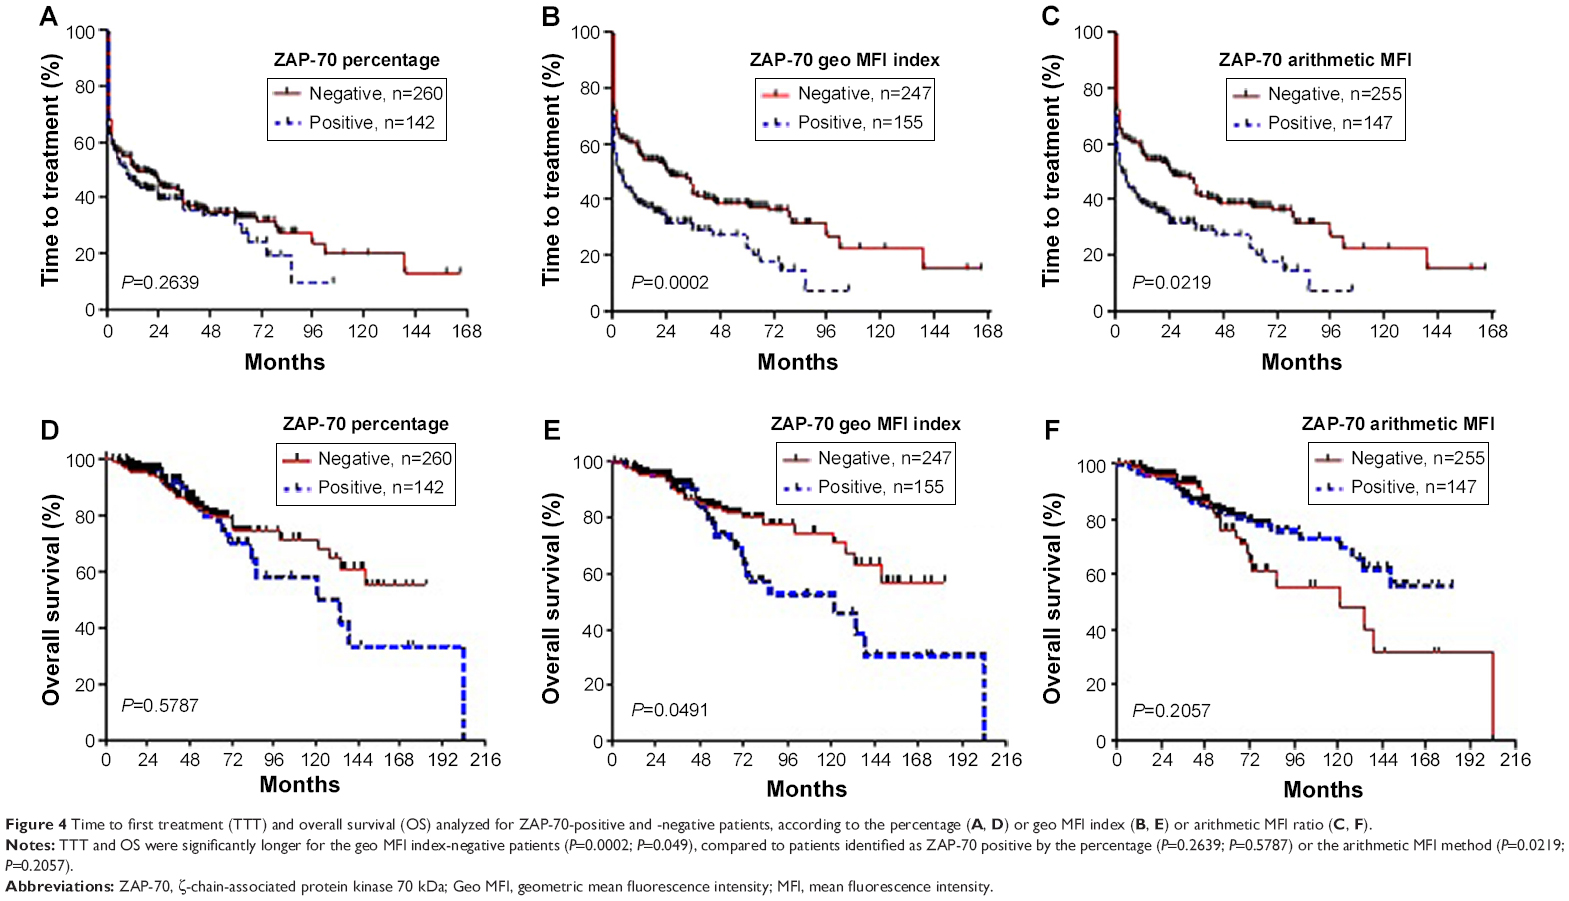 | Figure 4 Time to first treatment (TTT) and overall survival (OS) analyzed for ZAP-70-positive and -negative patients, according to the percentage (A, D) or geo MFI index (B, E) or arithmetic MFI ratio (C, F). |
Discussion
ZAP-70, originally considered as a potential surrogate for VH mutational status, has predominant prognostic value. The expression of ZAP-70 can be assessed by different techniques, such as immunohistochemistry, Western blotting, reverse transcription polymerase chain reaction (RT-PCR), and flow cytometry.8,11,12 Obviously, as a precise and fast methodology, flow cytometry has become a useful technique extensively used in routine cytometric laboratories. However, standardization for evaluation of ZAP-70 detection has not been easy. The key problem is the weak ZAP-70 expression with a continuous expression pattern rather than a clear discrimination between positive and negative CLL cells.17–19 Consequently, the resulting judgment tends to be subjective.
Following the proposed protocol, we showed that determination of ZAP-70 status, which requires using T- or natural killer (NK)-cells for reference definition,8,20 can be discordant in 10% of the CLL cases. According to this classical analysis strategy, our results also showed no significant association between ZAP-70/T expression and IgHV mutational status and any other clinical–biological characteristic (data not shown). As a result, even with the same analysis method, different results may be obtained by different operators (Figure 3). In our study, three of eleven CLL samples that were acquired and evaluated by different operators exhibited marked variation in ZAP-70 expression based on the percentage method. It is evident that the choice of controls and the method used to set a threshold to distinguish positive and negative ZAP-70 status in CLL remains challenging.
As a consequence, we consider it reasonable to assume that reduction of subjective error is the key point in standardizing ZAP-70 score. Of note, a resolution of 1,024 has been used in collection practices in flow cytometry. However, the higher resolution is associated with an inherent variability, due to subjectivity in cursor placement to determine the expression of ZAP-70-positive cells.21,22
In addition, the arithmetic MFI was used in calculations of the MFI ratio of T-cells/CLL cells in many laboratories.16,23 Although these results have been confirmed by a large international standardization project,17 we believe that arithmetic MFI is not the best parameter to use in evaluating ZAP-70 expression. The reason is that another parameter, the geometric mean, would indicate the center of a distribution better than the arithmetic mean if a sample is normally distributed in flow cytometry. In our study, we show that the PE-conjugated CLL cells in the isotype control sample or the ZAP-70 expression of T-/CLL cells in the test sample are clearly normally distributed. In addition, SD of the geo mean of CLL cells is lower than the arithmetic mean (Figure 2).
In a previous study, Wilhelm et al24 reported that high ZAP-70 variability of T/NK cells and isotype controls were observed in CLL patients. However, we found that when the PE-conjugated isotype control of CLL cells was a regular number (eg, 10±1), only minor discrepancies were observed between the geo MFI values of the ZAP-70 staining in T-cells (Figure 2).
Taken together, our results show for the first time that ZAP-70 expression can be evaluated by the geo MFI index method, which combines reducing resolution with using the parameter of geo MFI. According to the IgHV mutational status, we could confirm a value of 3.5 for the geo MFI index (actual value 3.65) as the optimal cut-off yielding the best segregation of ZAP-70-positive and ZAP-70-negative cases into two groups. Measurement using geo MFI index reduces the subjective error potentially present when assessing ZAP-70 expression by the percentage method. In our analysis, the result of 40 cases assessed based on the percentage method was modified by the geo MFI index method in our cohort. As can be seen in Figure 3, a positive proportion of approximately 20% is most likely to lead to an error of subjective judgment because the result of all discordant patients analyzed varied between 15% and 25% (data not shown).
In addition, one point that needs to be addressed is that if the geo MFI index of ZAP-70 is lower than the established 3.5 cut-off and is marked as ZAP-70 positive in CLL cases. We assessed the expression of ZAP-70 using the percentage and geo MFI index methods with significant biological and clinical factors. The obtained results showed that the patients with a ZAP-70 geo MFI index lower than 3.5 were more likely to have a worse clinical stage at diagnosis and adverse biological factors, such as unmutated IgHV genes, CD38+, advanced Binet stage, or high risk cytogenetic abnormalities (Table 1).
Using the geo MFI index method, we also show that ZAP-70 positivity is an unfavorable factor for survival and TTT. By Kaplan–Meier analysis, patients with a level of ZAP-70 expression above the cut-off value had significantly longer OS and TTT than those patients with ZAP-70 expression levels below the cut-off value. However, the use of the percentage method did not result in significant differences in TTT or OS. Moreover, the difference in OS was no significant with T-cells/CLL cells by arithmetic MFI ratio method in our laboratory (Figure 4). Besides subjective factors, the reason that we did not see any significant values for the percentage method of ZAP-70 expression in either model may be due to the choice of antibody. In this study, we used a PE-conjugated antibody from BD Biosciences for all measurements of ZAP-70 expression. As previously described, the antibody against ZAP-70 supplied by Caltag may have better discrimination.25 Encouragingly, it did not interfere with the result of geo MFI index measurement in CLL.
In conclusion, the prognostic significance of ZAP-70 in CLL has been emphasized in several retrospective analyses.26,27 However, a standardized procedure for ZAP-70 evaluation, which is associated with the different strategies and analytical approaches, is still lacking to date. Our results strongly suggest that assessment by the geo MFI index method, as proposed here, could be a useful method, as it is more reliable, less subjective, and therefore associated with improvement of CLL prognostication and prediction of clinical course.
Acknowledgments
This study was supported by National Natural Science Foundation of China (81370656), “Liu Da Ren Cai Gao Feng” of Jiangsu Province (number 2014-WSN-009).
Disclosure
The authors report no conflicts of interest in this work.
References
Chiorazzi N, Rai KR, Ferrarini M. Chronic lymphocytic leukemia. N Engl J Med. 2005;352:804–815. | ||
Swerdlow SH, Campo E, Harris NL, et al. WHO Classification of Tumors of Haematopoietic and Lymphoid Tissues. Lyon, France: IARC Press; 2008. | ||
Shanafelt TD. Predicting clinical outcome in CLL: how and why. Hematology Am Soc Hematol Educ Program. 2009;421–429. | ||
Hallek M. Signaling the end of chronic lymphocytic leukemia: new frontline treatment strategies. Blood. 2013;122:3723–3734. | ||
Wan Y, Wu CJ. SF3B1 mutations in chronic lymphocytic leukemia. Blood. 2013;121:4627–4734. | ||
Dohner H, Stilgenbauer S, Benner A, et al. Genomic aberrations and survival in chronic lymphocytic leukemia. N Engl J Med. 2000;34:1910–1916. | ||
Dicker F, Herholz H, Schnittger S, et al. The detection of TP53 mutations in chronic lymphocytic leukemia independently predicts rapid disease progression and is highly correlated with a complex aberrant karyotype. Leukemia. 2009;23:117–124. | ||
Crespo M, Bosch F, Villamor N, et al. ZAP-70 expression as a surrogate for immunoglobulin variable region mutations in chronic lymphocytic leukemia. N Engl J Med. 2003;348:1764–1775. | ||
Muñoz L, Lasa A, Carricondo MT, et al. Comparative analysis of ZAP-70 expression and Ig VH mutational status in B-cell chronic lymphocytic leukemia. Cytometry B Clin Cytom. 2007;7:96–102. | ||
Del Principe MI, Del Poeta G, Buccisano F, et al. Clinical significance of ZAP-70 protein expression in B-cell chronic lymphocytic leukemia. Blood. 2006;108(3):853–861. | ||
Carreras J, Villamor N, Colomo L, et al. Immunohistochemical analysis of ZAP-70 expression in B-cell lymphoid neoplasms. J Pathol. 2005;205:507– 513. | ||
Adams RL, Cheung C, Banh R, et al. Prognostic value of ZAP-70 expression in chronic lymphocytic leukemia as assessed by quantitative polymerase chain reaction and flow cytometry. Cytometry B Clin Cytom. 2014;86(2):80–90. | ||
Hallek M, Cheson BD, Catovsky D, et al. International Workshop on Chronic Lymphocytic Leukemia. Guidelines for the diagnosis and treatment of chronic lymphocytic leukemia: a report from the International Workshop on Chronic Lymphocytic Leukemia updating the National Cancer Institute-Working Group 1996 guidelines. Blood. 2008;111:5446–5456. | ||
Chiorazzi N. Implications of new prognostic markers in chronic lymphocytic leukemia. Hematology Am Soc Hematol Educ Program. 2012:76–87. | ||
Crespo M, Villa mor N, Gine E, et al. ZAP-70 expression in normal pro/pre B cells, mature B cells, and in B -cell acute lymphoblastic leukemia. Clin Cancer Res. 2006;12(3 Pt 1):726–734. | ||
Smolej L, Vroblova V, Motyckova M, et al. Quantification of ZAP-70 expression in chronic lymphocytic leukemia: T/B-cell ratio of mean fluorescence intensity provides stronger prognostic value than percentage of positive cells. Neoplasma. 2011;(58):140–145. | ||
Letestu R, Rawstron A, Ghia P, et al. Evaluation of ZAP-70 expression by flow cytometry in chronic lymphocytic leukemia: a multicentric international harmonization process. Cytometry B Clin Cytom. 2006;70:309–314. | ||
Best OG, Ibbotson RE, Parker AE, et al. ZAP-70 by flow cytometry: a comparison of different antibodies, anticoagulants, and methods of analysis. Cytometry B Clin Cytom. 2006;70:235–241. | ||
Bekkema R, Tadema A, Daenen SM, et al. An improved flow cytometric method using FACS Lysing Solution for measurement of ZAP-70 expression in B-cell chronic lymphocytic leukemia. Cytometry B Clin Cytom. 2008;74:40–44. | ||
Zucchetto A, Bomben R, Bo MD, et al. ZAP-70 expression in B-cell chronic lymphocytic leukemia: evaluation by external (isotypic) or internal (T/NK cells) controls and correlation with IgV(H) mutations. Cytometry B Clin Cytom. 2006;70:284–292. | ||
Jourdan ML, Ferrero-Poüs M, Spyratos F, et al. Flow cytometric s-phase fraction measurement in breast carcinoma: influence of software and histogram resolution. Cytometry. 2002;48:66–70. | ||
Hoffmann JJ, Janssen WC. HLA-B27 phenotyping with flow cytometry: further improvement by multiple monoclonal antibodies. Clin Chem. 1997;43:1975–1981. | ||
Rossi FM, Del Principe MI, Rossi D, et al. Prognostic impact of ZAP-70 expression in chronic lymphocytic leukemia: mean fluorescence intensity T/B ratio versus percentage of positive cells. J Transl Med. 2010;8:23. | ||
Wilhelm C, Neubauer A, Brendel C. Discordant results of flow cytometric ZAP-70 expression status in B-CLL samples if different gating strategies are applied. Cytometry B Clin Cytom. 2006;70:242–250. | ||
Preobrazhensky SN, Bahler DW. Optimization of flow cytometric measurement of ZAP-70 in chronic lymphocytic leukemia. Cytometry B Clin Cytom. 2008;74:118–127. | ||
Rassenti LZ, Jain S, Keating MJ, et al. Relative value of ZAP-70, CD38, and immunoglobulin mutation status in predicting aggressive disease in chronic lymphocytic leukemia. Blood. 2008;112:1923–1930. | ||
Preobrazhensky SN, Szankasi P. Improved flow cytometric detection of ZAP-70 in chronic lymphocytic leukemia using experimentally optimized isotypic control antibodies. Cytometry B Clin Cytom. 2012; 82:78–84. |
 © 2016 The Author(s). This work is published and licensed by Dove Medical Press Limited. The full terms of this license are available at https://www.dovepress.com/terms.php and incorporate the Creative Commons Attribution - Non Commercial (unported, v3.0) License.
By accessing the work you hereby accept the Terms. Non-commercial uses of the work are permitted without any further permission from Dove Medical Press Limited, provided the work is properly attributed. For permission for commercial use of this work, please see paragraphs 4.2 and 5 of our Terms.
© 2016 The Author(s). This work is published and licensed by Dove Medical Press Limited. The full terms of this license are available at https://www.dovepress.com/terms.php and incorporate the Creative Commons Attribution - Non Commercial (unported, v3.0) License.
By accessing the work you hereby accept the Terms. Non-commercial uses of the work are permitted without any further permission from Dove Medical Press Limited, provided the work is properly attributed. For permission for commercial use of this work, please see paragraphs 4.2 and 5 of our Terms.