")
Back to Journals » Clinical Epidemiology » Volume 8
Using existing questionnaires in latent class analysis: should we use summary scores or single items as input? A methodological study using a cohort of patients with low back pain
Authors Nielsen A, Vach W, Kent P, Hestbaek L, Kongsted A
Received 29 December 2015
Accepted for publication 17 February 2016
Published 26 April 2016 Volume 2016:8 Pages 73—89
DOI https://doi.org/10.2147/CLEP.S103330
Checked for plagiarism Yes
Review by Single anonymous peer review
Peer reviewer comments 3
Editor who approved publication: Professor Henrik Sørensen
Video abstract presented by Anne Molgaard Nielsen
Views: 614
Anne Molgaard Nielsen,1 Werner Vach,2 Peter Kent,1,3 Lise Hestbaek,1,4 Alice Kongsted1,4
1Department of Sports Science and Clinical Biomechanics, University of Southern Denmark, Odense, Denmark; 2Center for Medical Biometry and Medical Informatics, Medical Center, University of Freiburg, Freiburg, Germany; 3School of Physiotherapy and Exercise Science, Curtin University, Perth, Australia; 4Nordic Institute of Chiropractic and Clinical Biomechanics, University of Southern Denmark, Odense, Denmark
Background: Latent class analysis (LCA) is increasingly being used in health research, but optimal approaches to handling complex clinical data are unclear. One issue is that commonly used questionnaires are multidimensional, but expressed as summary scores. Using the example of low back pain (LBP), the aim of this study was to explore and descriptively compare the application of LCA when using questionnaire summary scores and when using single items to subgrouping of patients based on multidimensional data.
Materials and methods: Baseline data from 928 LBP patients in an observational study were classified into four health domains (psychology, pain, activity, and participation) using the World Health Organization’s International Classification of Functioning, Disability, and Health framework. LCA was performed within each health domain using the strategies of summary-score and single-item analyses. The resulting subgroups were descriptively compared using statistical measures and clinical interpretability.
Results: For each health domain, the preferred model solution ranged from five to seven subgroups for the summary-score strategy and seven to eight subgroups for the single-item strategy. There was considerable overlap between the results of the two strategies, indicating that they were reflecting the same underlying data structure. However, in three of the four health domains, the single-item strategy resulted in a more nuanced description, in terms of more subgroups and more distinct clinical characteristics.
Conclusion: In these data, application of both the summary-score strategy and the single-item strategy in the LCA subgrouping resulted in clinically interpretable subgroups, but the single-item strategy generally revealed more distinguishing characteristics. These results 1) warrant further analyses in other data sets to determine the consistency of this finding, and 2) warrant investigation in longitudinal data to test whether the finer detail provided by the single-item strategy results in improved prediction of outcomes and treatment response.
Keywords: classification, data mining, subgrouping, clinical interpretability, questionnaire, low back pain
Background
Currently, there is considerable focus on the identification of low back pain (LBP) subgroups.1,2 LBP is a major global health problem due to its high prevalence and associated disability,3 resulting in substantial personal and societal costs, including those associated with time off work, rehabilitation, and treatment.4 Despite many treatment approaches and extensive research,5–10 treatment effects remain modest. This may partly be due to heterogeneity in people with LBP, including variability in the presenting signs and symptoms11 and treatment responses.7 This has led researchers to focus on subgrouping, potentially to improve the targeting of treatment and also to allow more precise prognostic estimates.
Traditionally, identification of LBP subgroups has been based on analyses, such as logistic regression, that aim to identify subgroups that differ on a predefined outcome measure; therefore, subgroup formation is “supervised” by the categorization of the outcome and thus termed “supervised analysis”. Another approach to subgrouping is unsupervised analysis. In this approach, subgroups are identified by the patterns in which people score at baseline (eg, patient history and physical examination) without predefining the measures that differentiate the subgroups or the number of subgroups. Unsupervised analysis attempts to maximize the homogeneity within subgroups and the heterogeneity between subgroups. Subsequently, these subgroups can be tested for validity on a range of outcomes, either as treatment-effect modifiers or prognostic indicators. Latent class analysis (LCA) is one such statistical technique that is widely used to identify subgroups using unsupervised analysis.12–16 Within musculoskeletal research, the use of LCA has increased during the last decade,17–19 and its strengths compared to other clustering approaches are becoming more evident.20
In LBP research, LCA has mainly been applied to the analysis of outcome trajectories.21–23 An exception was Baron et al, who found an association between LCA-derived baseline subgroups and their response to a cognitive behavioral intervention.24 Their focus was on the psychological profile of patients at baseline. However, to better understand the complex nature of LBP, as well as any other complex health condition, and explore better options for the management of disease, it seems potentially fruitful to identify the clusters of associations between the broad arrays of biological, psychological, and social dimensions of patients,25 as all these domains are present in individual patients.
Key components of the clinical presentation of patients are often assessed using validated questionnaires. Many are multidimensional,26,27 and although they often measure more than one factor (dimension), frequently all answers are combined into a summary score. Consequently, there may be some clinical characteristics that are potentially important in distinguishing baseline differences between subgroups that might be overlooked if such information is only covered by some questions within a summary score. For example, the Fear-Avoidance Beliefs Questionnaire (FABQ) contains two subscale scores (physical activity and work), but there is evidence that even these subscales are actually multidimensional.28 Also, unidimensional scales may contain single items that in combination with other variables help to profile patients.
It is unknown whether the choice of data-preprocessing strategy has any impact on the results of LCA. Summary scores can provide useful summaries of single items that measure the same construct, and thus using single items might simply add more noise and lead to inferior results. Alternatively, single items might add more detailed information that is useful, in particular if the scoring pattern on particular single items from different questionnaires helps to identify the latent classes. Under those circumstances, a reasonable assumption might be that subgrouping using single items would reveal more informative subgroups, due to there being more information available. It also could be that compared to the use of summary scores, when individual questions are used, there is greater capacity for LCA to model any interactions that occur between them and other items, but there is a need to examine these assumptions and explore any potential impact.
Therefore, the aim of this methodological case study was to explore the application of LCA when using questionnaire summary scores (summary-score strategy) and to compare descriptively the results with those when treating all variables individually (single-item strategy) to subgroup LBP patients. This was performed within four domains of health, applying a combination of statistical measures and the clinical interpretability (face validity) of the derived subgroups.
Materials and methods
This study used cross-sectional (baseline) data from a longitudinal observational study of adult patients who were consulting chiropractors in Denmark due to their LBP. Two strategies for LCA subgrouping were descriptively compared: one strategy using summary scores of questionnaires and the other using all items individually based on patient self-reported and clinician-reported questionnaires. Subgroups were identified using LCA within four domains of health (psychology, pain, activity, and participation). The descriptive comparison was based on a combination of statistical and clinical interpretability (face validity) criteria, and the final decision about a preferable strategy was reached by consensus within the author group.
Setting and participants
Data were collected from September 2010 to January 2012 from 17 chiropractic practices across Denmark that were part of the research network of the Nordic Institute for Chiropractic and Clinical Biomechanics.29 Some of the aims of creating the overall cohort included the identification of clinical course patterns, prognostic factors, and clinically important subgroups in LBP patients consulting primary care clinicians. The results of some of these other investigations and full details about the longitudinal study have been reported previously.21,29
Patients were included if they had LBP with or without leg pain as their main complaint, were 18–65 years of age, had a mobile phone and were able to send a text message (for reasons unrelated to this paper), and could adequately read and write Danish. Patients were excluded due to pregnancy, pathology of the back that required referral for acute surgical evaluation or other serious pathology, or more than one consultation for LBP in the preceding 3 months. For the current study, patients were excluded if they did not complete any of the baseline questionnaires (Figure 1).
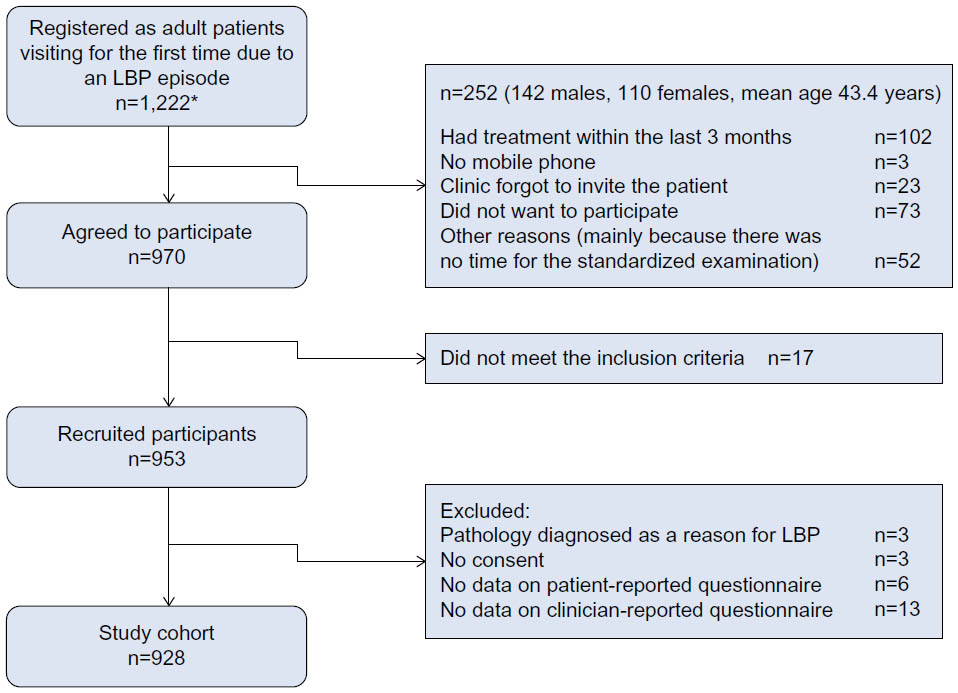 | Figure 1 Study flowchart. |
The patients included were informed about the study, written consent was obtained, and the Danish Data Protection Agency gave approval (2012-41-0762). As treatment was not affected by participation in the study, under Danish law, this study did not need ethical approval.30 The conduct of the study complied with the Declaration of Helsinki.
Due to other planned analyses, the sample size was 1,000 patients. In a systematic investigation of necessary sample sizes for LCA, Wurpts et al31 concluded that for two and three LCA subgroups, 100 is often a sufficient sample size. By extrapolating their results, 1,000 participants are likely to be sufficient for models with up to 20 subgroups.
Measured variables
Participants completed a baseline questionnaire while attending the clinic. The variables used in the LCA included pain history, screening questions, work-related questions, and selected validated questionnaires covering activity limitation, fear avoidance, depression, and other known prognostic factors (Supplementary materials 1). The variables age (years), sex (male, female), and highest educational level (no qualification, vocational training, higher education <3 years, higher education 3–4 years, higher education >4 years) were used only to describe baseline characteristics of the cohort and were not included in the LCA.
The pain-history variables were: average pain intensity during the last week for back pain and leg pain (0–10 numeric pain-rating scale), duration of current episode (0–2 weeks, 2–4 weeks, 1–3 months, >3 months), previous LBP episodes (0, 1–3, >3), and days with LBP during the last year (≤30, >30 days).
The screening questions were: ability to decrease pain (0= cannot decrease it at all; 10= can decrease it completely), recovery belief (0= likely to recover; 10= not at all likely), belief that treatment is essential to decrease pain (0= completely agree; 10= completely disagree), and social isolation (0= not at all isolated; 10= quite isolated).
The work-related variables were: physical workload (sitting, sitting and walking, light physical load, heavy physical load) and sick leave.
The validated questionnaires included were: the Danish 23-item version of the Roland–Morris Disability Questionnaire (RMDQ-23), the FABQ with its two subscales (physical activity and work), the Major Depression Inventory (MDI) and the STarT Back Tool (SBT). The score from the SBT questionnaire was dichotomized (high risk versus medium/low risk), as this reflects the tool’s clear distinction between patients with psychological barriers to recovery (high risk) and those without this aspect.
The clinician-completed questionnaire variables were: pain distribution (back pain, left- and/or right-leg pain), dominating pain (back, leg, or equal), paraspinal pain onset (yes/no), best posture is to sit (yes/no), and best activity is to walk (yes/no).32
Both the patient self-reported and clinician-reported baseline questionnaires were composites of variables from various sources. Existing validation and/or reliability studies for the included variables are referenced in “Supplementary materials 1”.
All variables were individually used in the single-item strategy, whereas the summary scores from the validated questionnaires were used in the summary-score strategy. Variables that were not part of a summary score were individually used in both strategies (Supplementary materials 1).
Preprocessing of variables
Single items from the MDI and FABQ that had more than 85% of their responses (an arbitrary threshold) in one of their six or seven response-option categories were excluded from the single-item strategy, but used as part of their respective summary scores, as the summary scores were not affected by this skewed distribution. Ordinal and continuous scales were rescored into categories if their distributions were highly skewed. Details of the content of each variable, missing data and all categorizations are reported in “Supplementary materials 1”. No data imputations were performed, as the likelihood approach of LCA accommodates the inclusion of patients with missing values.33
Health domains
The International Classification of Functioning, Disability, and Health (ICF) created by the World Health Organization was used to classify variables into four clinically relevant health domains (psychology, pain, activity, and participation). The mutually exclusive classification of variables into these four health domains was performed by the first author, based on the categorization framework accessible via the ICF browser34 and previous LBP research that had used health domains.35–37 First, the classification into health domains was performed for variables used in the summary-score strategy: the five summary scores (RMDQ-23, FABQ – physical activity, FABQ – work, MDI, SBT) and the remaining variables from the baseline questionnaires that were not part of a summary score. Second, for the single-item strategy, the summary scores were replaced by their respective single items, allowing these to be classified into a health domain different to the summary score if considered more appropriate. The remaining variables, which were not part of a summary score, did not change health domain between the two strategies. The results of the classification are shown in “Supplementary materials 1”. The authors reviewed, discussed, and reached consensus on the first author’s classification for both the summary-score strategy and the single-item strategy.
Generation of a preliminary model for a given number of subgroups and deciding on the starting model
LCA was performed using Latent GOLD 5.0 (Statistical Innovations Inc, Belmont, MA, USA)33,38 with its software settings in the default mode, except for the enabling of the inclusion of patients with missing data on some variables. Ordinal variables entered LCA as continuous variables, allowing mean and standard deviation to vary from subgroup to subgroup. For binary and categorical variables, the probability of each category could vary from subgroup to subgroup.
For both strategies, LCA was performed within each of the four health domains. The LCA fitting procedure was initially run by requesting the estimation of models of every number of subgroups, from one to 12 subgroups. That procedure was repeated ten times (with random starting values), and resulted in ten models with one subgroup each through to ten models with 12 subgroups each. From the ten estimates within each model size, the most frequent model (identified by the Bayesian information criterion [BIC]) was selected. If there were several models with the same maximal frequency, the model with the lowest BIC was chosen. Of these 12 selected preliminary models (one for each of one to 12 subgroups), the model with the lowest BIC39 – among all models, decreasing the BIC by at least 1% when adding an additional subgroup – was chosen as a “starting model” for further analysis. This resulted in eight starting models, one for each of the four domains in both strategies.
Selecting the preferred model for each health domain in both strategies
A consensus-based approach was used to select the preferred model for each domain in both strategies, which included a number of steps. First, the subgroups of the eight starting models were graphically presented in profile plots. For nominal variables, conditional probabilities were presented that summed to 1 within each subgroup. For binary variables, only the last category was displayed. For other categorical variables, all categories were displayed. For ordinal and continuous variables, means were presented rescaled on a 0–1 scale by using the minimal and maximal observed values.33 For each health domain in both strategies, the profile plot of the starting model was compared with profile plots of the remaining preliminary models with more and fewer subgroups to explore how the composition of the subgroups changed and to identify distinct characteristics. One aspect of identifying distinct characteristics was the observation of lines that crossed in the profile plot, as illustrated in Figure 2. This indicates distinctive scoring differences between the subgroups, and these were regarded as indicating a qualitative difference. If the lines did not cross between the subgroups, this indicated that the direction of scoring across variables was the same – reflecting differences in condition severity only – and thus the observed differences were regarded as purely quantitative differences. It was also agreed upon to prefer models with no subgroup size lower than 5% of the whole cohort. An exception to this was that subgroup sizes from 3% to 5% were explored further if the distinguishing characteristics were those known to be underrepresented in this chiropractic cohort compared to the general population of patients with LBP, characteristics such as depression, high-intensity leg pain, and long duration of LBP.40
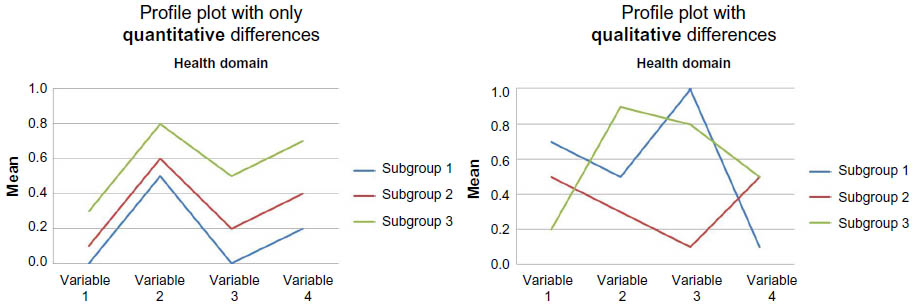 | Figure 2 Hypothetical example of the qualitative assessment of a subgroup profile plot. |
Second, the most likely candidate models were compared on: 1) subgroup size, 2) conditional probabilities for categorical and ordinal items (the probability of specific responses given subgroup membership) and means of ordinal and continuous items (Table 1), and 3) loadings (factor loadings obtained by linear approximation of the effects of the latent variables on the items).33
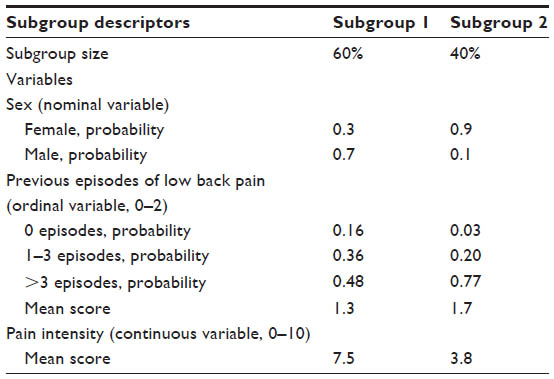 | Table 1 Hypothetical output (Latent Gold) showing subgroup sizes, conditional probabilities and means for different variable types |
Third, we developed a brief description of preferred models, including the essential characteristics of each subgroup, as observed in the profile plots and estimates. These three components of information were compiled by the first author and presented to the author group. If the author group requested clarification, the first author presented information for additional models. Each member then made suggestions about a preferred model for each domain in both strategies and included justification for this preference.
Descriptive comparison of the single-item and summary-score strategies
Within each of the four domains, the summary-score and single-item strategies were descriptively compared to assess if the preferred models from each were substantively different. First, we calculated median posterior probabilities (median, interquartile range) for both the individual subgroups and the entire health domains.41 In addition, the number of patients with a posterior probability above 0.33 for more than one subgroup was calculated and also the number of patients with posterior probability less than 0.7 for any subgroup. Both numbers are descriptors of the fraction of patients with ambiguity about their subgroup membership. In general, the posterior probability estimate indicates how likely it is that each patient belongs to a specific subgroup, and thus preferably should be close to 1.
Second, we improved the profile plots by visually grouping variables that displayed the same feature, where a feature was defined as a group of variables with 1) at least 30% difference between the highest and lowest score of the subgroups (regarded as a diverse scoring pattern), and 2) only quantitative differences, as seen by a uniform subgroup scoring pattern across variables with no crossings, or very minor crossings. In addition, to enhance the visual differences and clinical interpretability, we reverse-scored the variables when appropriate, which resulted in higher scores, indicating a more severe condition (see “Supplementary materials 1” for details of reverse-scored variables). For the multistate nominal variables, the first category (reference category) was removed from the profile plot, because it was implicit. The number of crossing subgroups per model solution was counted to emphasize qualitative and quantitative differences.
Third, we extended the description of each subgroup in the eight preferred models (one per domain for each strategy) by reporting the distribution of the variables and a brief clinical description of the characteristics distinguishing each subgroup from the others in the same health domain. Variables representing an identified feature were grouped and reported consecutively. In this descriptive component, each patient was assigned to the subgroup for which they had the largest posterior probability.
Fourth, subgroup membership was compared between the two strategies by cross-tabulation using the following principles. The largest subgroup for each row and column was marked, and if this overlap covered more than 80% of each subgroup, the row and column subgroups were considered to be “equivalent”. Any column cell covering 10% or more of a row subgroup was also marked and included in the description of the subgroup membership comparison.
All four components of this additional information were also compiled by the first author and presented to the author group. Each member then selected the preferred strategy for each health domain and provided justification for their selection.
Statistical software
In addition to the use of Latent Gold for LCA, this study also used Excel 2010 (Microsoft Corporation, Redmond, WA, USA) for coloring and adjusting the profile plots. All other analyses were performed using Stata/SE 13.1 (StataCorp LP, College Station, TX, USA).
Results
The analysis included 928 participants with both patient self-reported and clinician-reported data (Figure 1). Of these, 95% had less than 15% missing observations. Baseline characteristics of the cohort are summarized in Table 2.
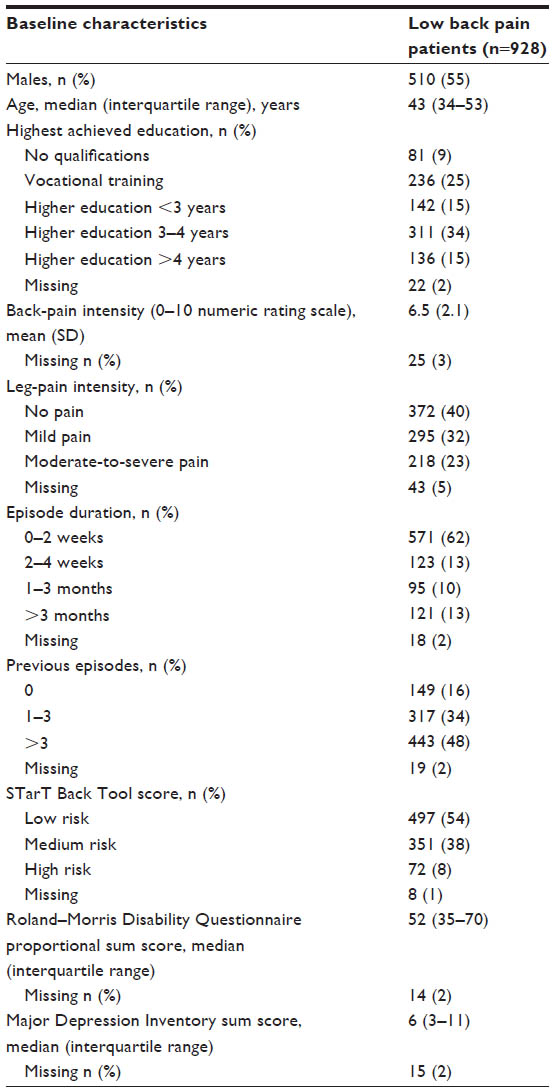 | Table 2 Baseline characteristics |
A total of 24 variables were included when the LCA used the summary-score strategy (three to nine variables in each domain) and 70 variables when using the single-item strategy (eight to 26 variables in each domain). As some questionnaires were multidimensional, their individual items could be allocated to different health domains. The items from the SBT were allocated across three domains (psychology, pain, and activity), the RMDQ and FABQ items across four domains (activity, psychology, participation, and pain), and all MDI items were allocated to the psychological domain (Supplementary materials 1).
Preliminary models for a given number of subgroups and starting model: results of the LCA
The statistical criteria defined for the LCA resulted in starting model solutions with two or three subgroups in each health domain in both strategies. For all starting models, BIC was consistent in all ten attempts of each model size (Supplementary materials 2).
Results of the consensus process selecting the preferred model for each health domain in both strategies
As a result of the consensus process, the choice of preferred models resulted in larger model solutions than the starting models. The larger models revealed distinct characteristics, which appeared to have potential clinical relevance (Figures 3–6). Six of eight chosen models had better model fit, in terms of lower BIC values, than the starting models; therefore, the BIC decrease of at least 1% as a sufficient improvement was overruled (Supplementary materials 2).
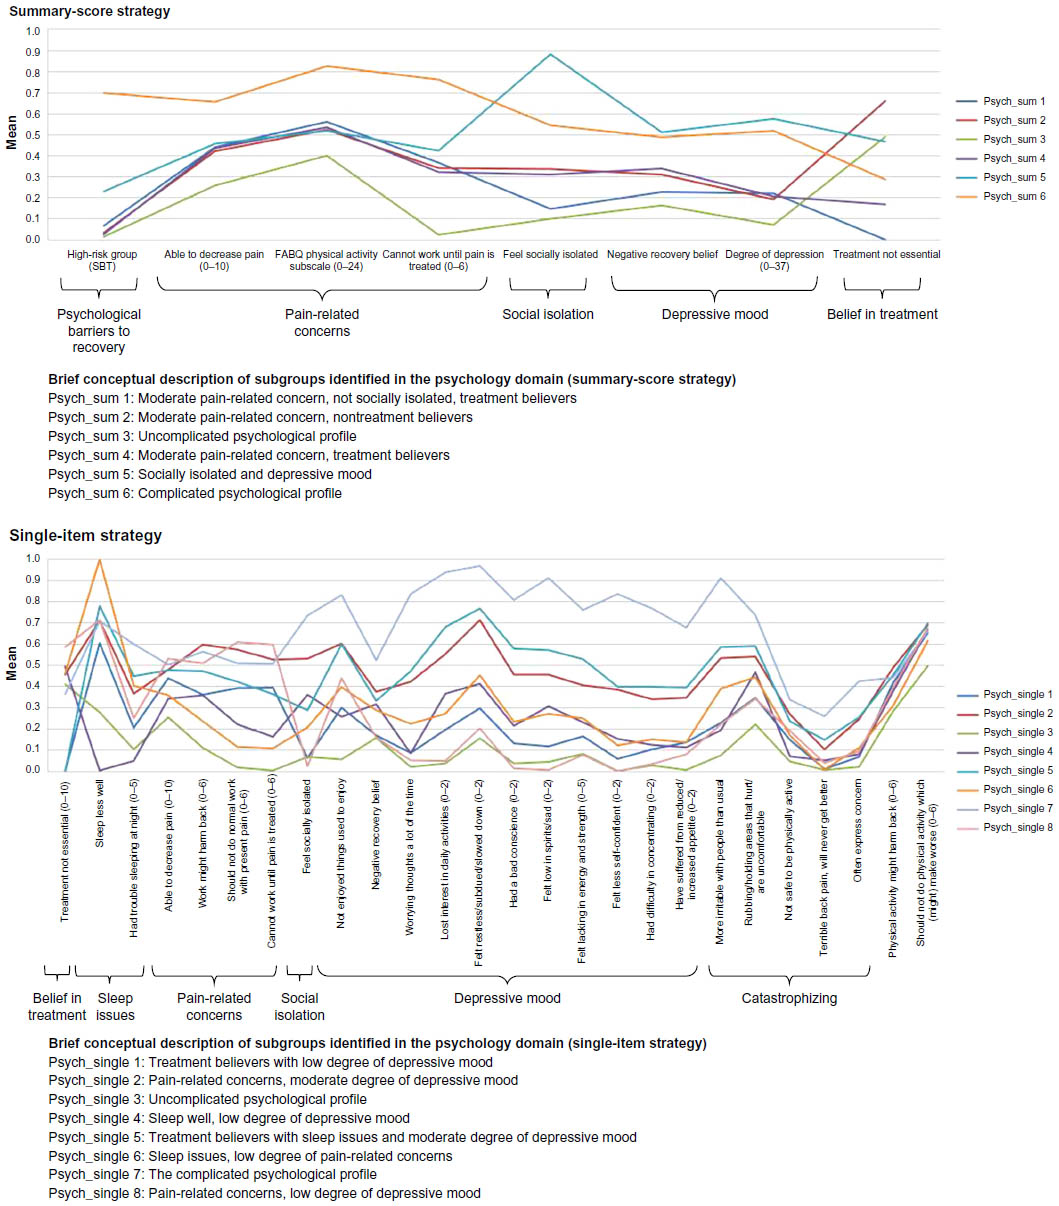 | Figure 3 Profile plots of the psychology domain and identified features. |
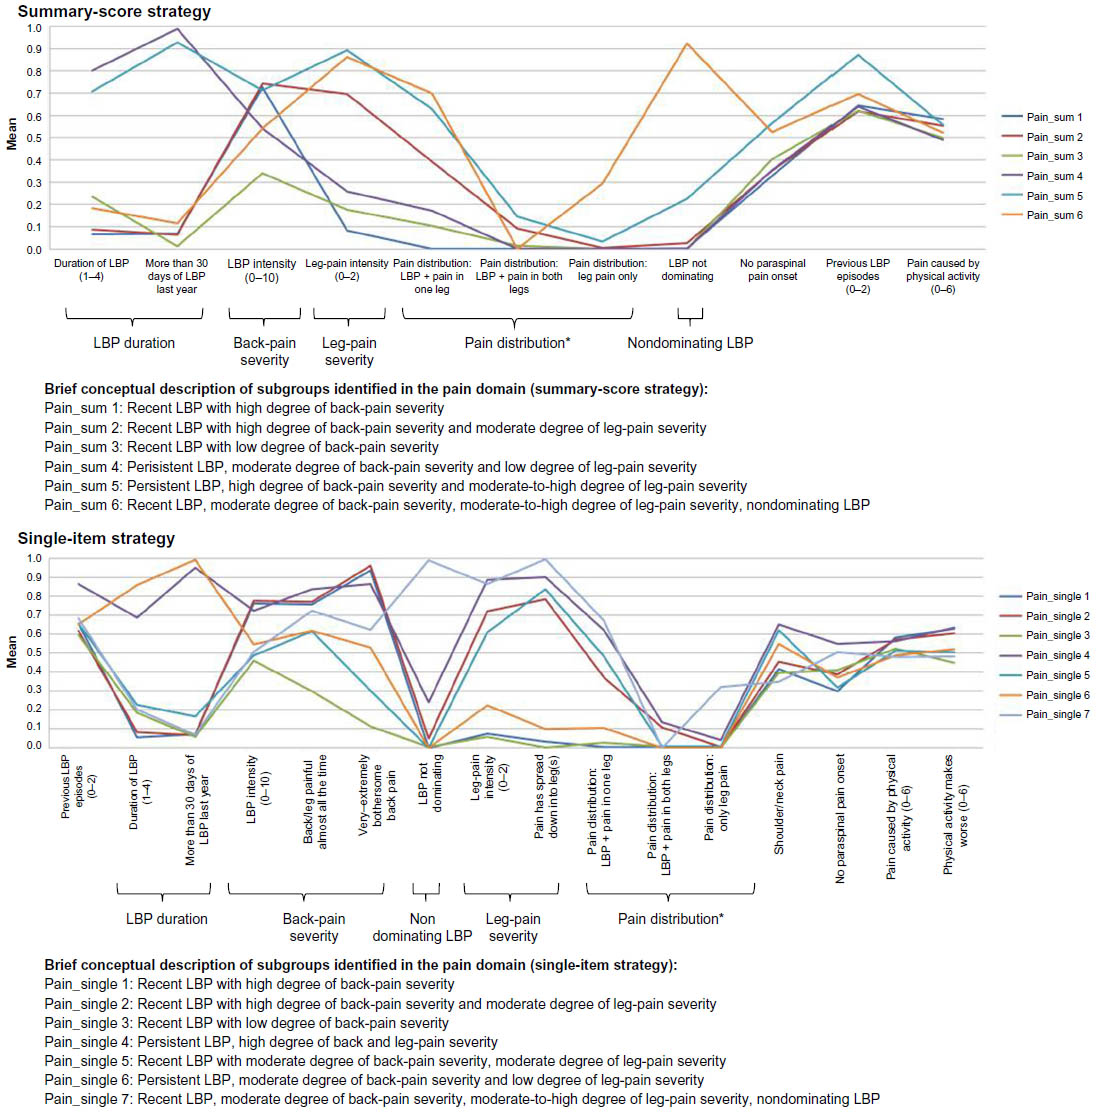 | Figure 4 Profile plots of the pain domain and identified features. |
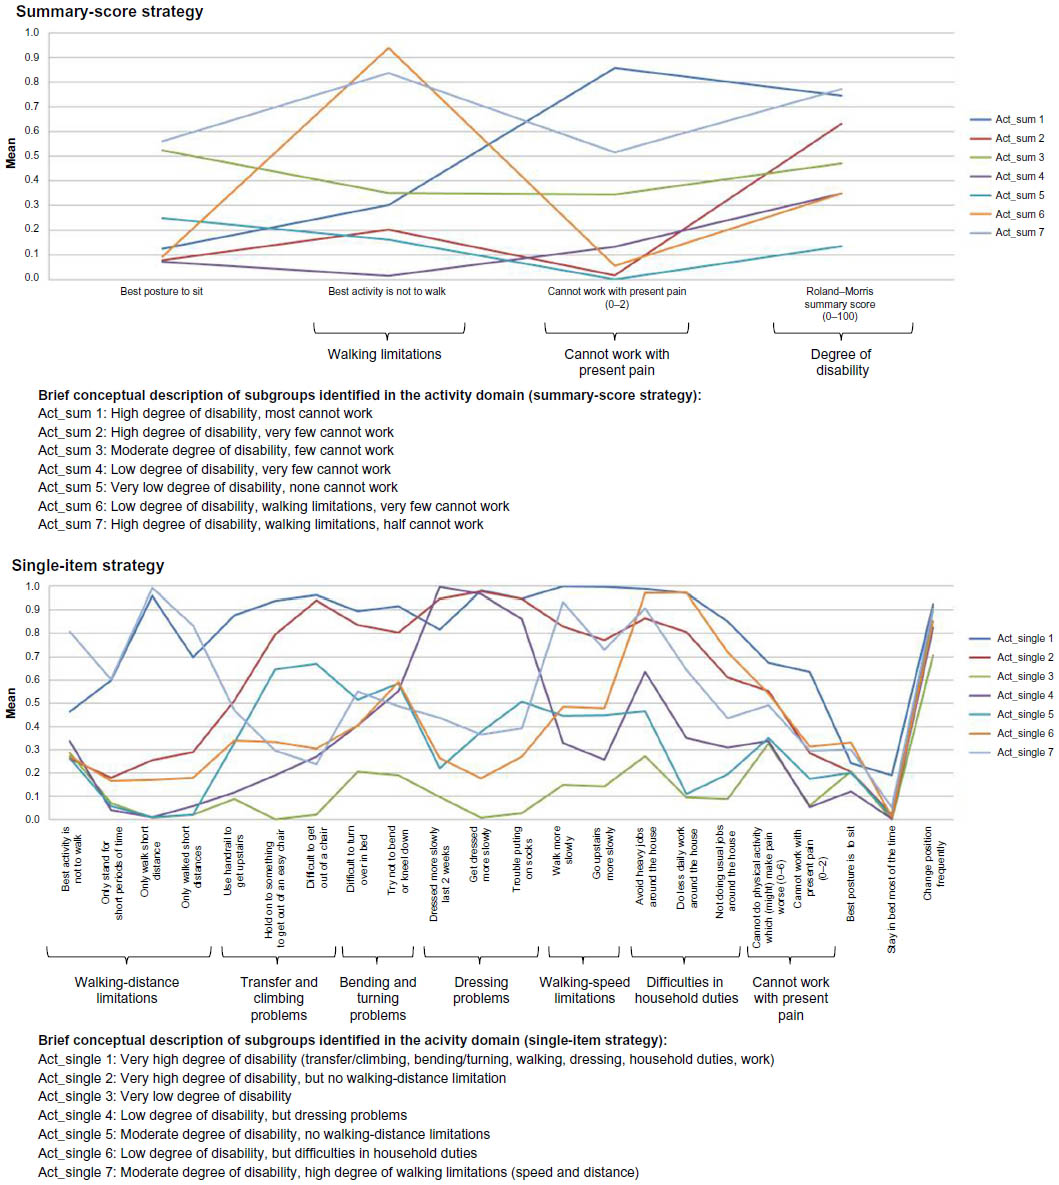 | Figure 5 Profile plots of the activity domain and identified features. |
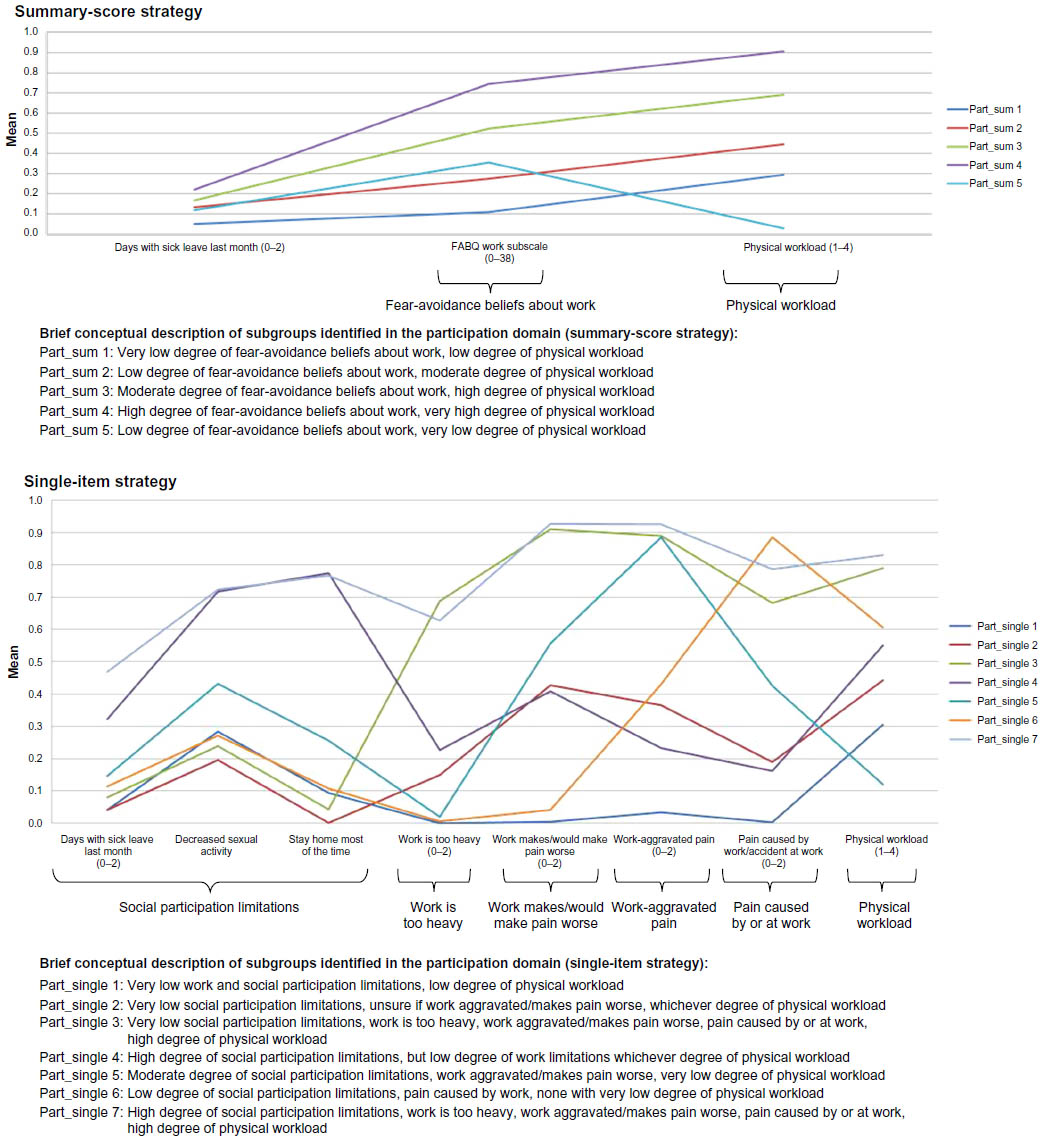 | Figure 6 Profile plots of the participation domain and identified features. |
The preferred model solutions ranged from five to seven subgroups in each health domain for the summary-score strategy and seven to eight subgroups for the single-item strategy. Only for the activity domain was the final number of subgroups the same (seven) in both strategies.
Arguments for the selected models included 1) smaller models missed subgroups that seemed to have distinct characteristics, 2) larger models only added subgroups that were minor modifications of existing ones, and 3) larger models often included very small subgroups. All LCA solutions considered in the consensus process are available regarding the summary-score strategy (Supplementary materials 3) and the single-item strategy (Supplementary materials 4).
Results of the consensus process descriptively comparing summary-score and single-item strategies
All health domains in both strategies had a reasonable distribution (prevalence) of patients across their subgroups, and none had one or two subgroups that contained the majority of patients assigned. The single-item strategy tended to have a higher average posterior probability per health domain, with the median ranging from 0.88 to 0.97 compared to 0.72–0.96 for the summary-score strategy. The single-item strategy also tended to have fewer individual participants with a posterior probability above 0.33 for more than one subgroup per health domain (6%–12% across the health domains) when compared to the summary-score strategy (10%–17%). Also, the single-item strategy had fewer participants with no posterior probability above 0.33 for any domain (1% versus 3%) in the entire cohort. For further details about each health domain, see Tables 3–6. For statistical and descriptive details about each subgroup, see “Supplementary materials 5”.
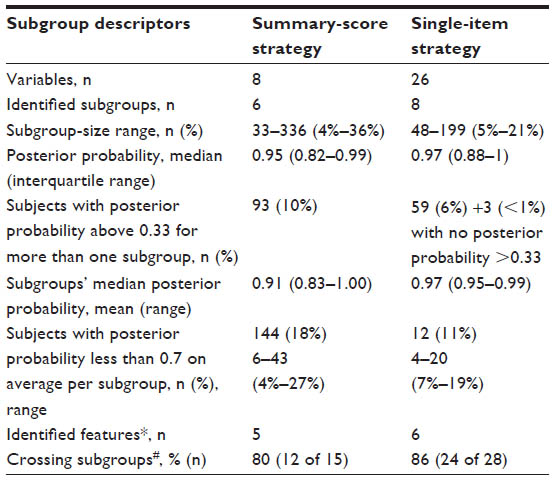 | Table 3 Comparison of strategies in the psychology domain |
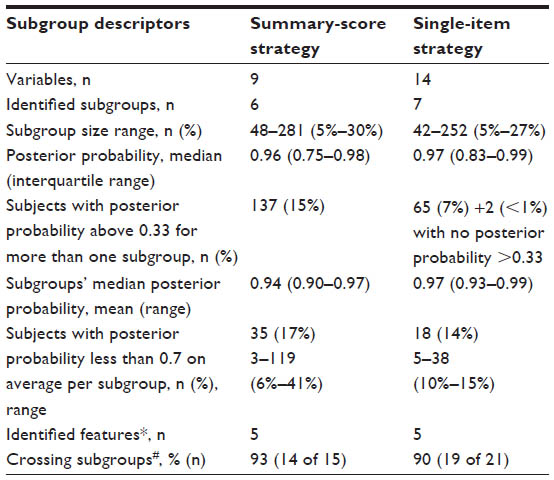 | Table 4 Comparison of strategies in the pain domain |
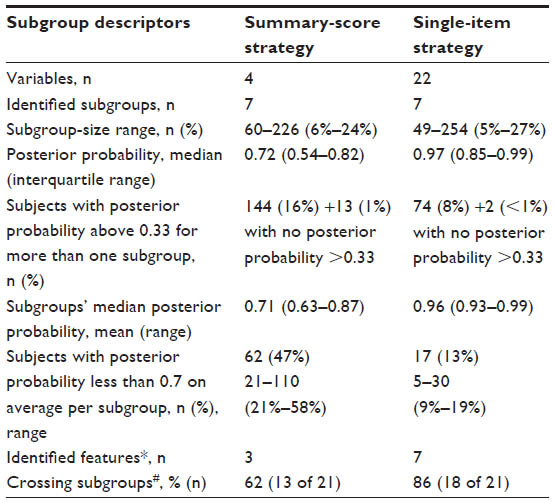 | Table 5 Comparison of strategies in the activity domain |
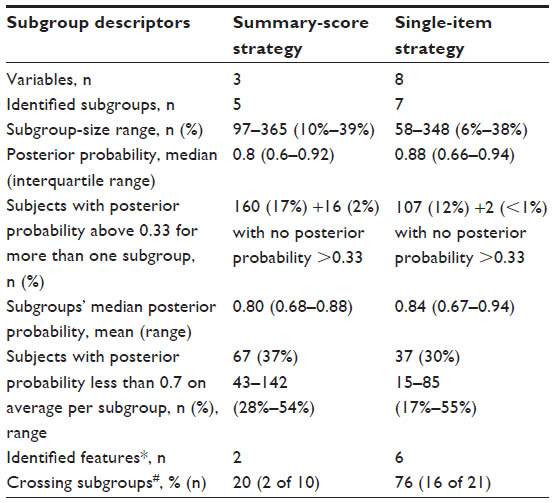 | Table 6 Comparison of strategies in the participation domain |
Clinical comparison in the psychology domain
With both LCA strategies, subgroup differences were mainly quantitative (Figure 3). In particular, the feature belief in treatment made a clear contribution to the identification of the subgroups in both strategies. The distinct features in the single-item strategy, which added additional information, when compared to the summary-score strategy were sleep issues, catastrophizing, and pain-related concern. The last item was more informative with the single-item strategy, because in the summary-score strategy, a high score on pain-related concern was only identified for subgroups scoring high on depressive mood. In contrast, social isolation seemed to inform the subgroup formation to a larger extent in the summary-score strategy than in the single-item strategy. For the single-item strategy, the proportion of subgroups that crossed in the profile plot was highest (Table 3), which emphasizes more qualitative differences identified in this strategy.
When subgroup membership was compared, all subgroups from the summary-score strategy consisted of people from two, three, or four subgroups in the single-item strategy, whereas four of eight single-item subgroups appeared to be a merger of two or more subgroups from the summary-score strategy (Table 7). Additional subgroups in the single-item strategy thus seemed not only to be a split of the summary-score subgroups, but rather an actual difference in subgroup membership.
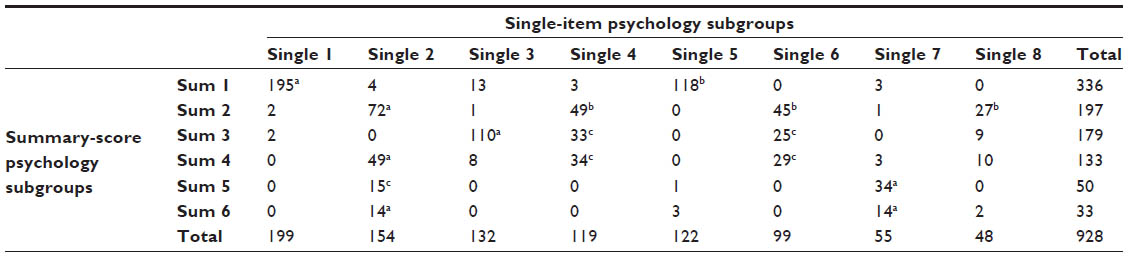 | Table 7 Psychology domain, subgroup membership comparison |
Conclusion: psychology domain
The single-item strategy identified more features that drove the formation of subgroups, resulting in a more nuanced description than the summary-score strategy.
Clinical comparison in the pain domain
In both LCA strategies, the identified pain subgroups were differentiated on the features LBP duration, LBP severity, leg-pain severity, pain distribution, and nondominating LBP (Figure 4). The feature LBP duration was an obvious similarity across both strategies, as it separated the identified subgroups into those having short duration of LBP and those with persistent LBP, including a “persistent mild” and a “persistent severe” subgroup. Among the subgroups with a short duration of LBP, a subgroup characterized by scoring moderately on LBP severity, high on leg-pain severity, and low on nondominating LBP was unique to the single-item strategy. In both strategies, nearly all subgroups crossed one another in the profile plot (Table 4), which emphasizes the similarities between the strategies.
Subgroup membership comparison confirmed the pattern of similarity, with three subgroups being equivalent for the two strategies. Each of the remaining three subgroups in the summary-score strategy consisted of patients from two or three subgroups in the single-item strategy, whereas the single-item strategy had one subgroup that was a subset of one of the summary-score subgroups, and the last three were each a merger of two subgroups from the summary-score strategy (Table 8).
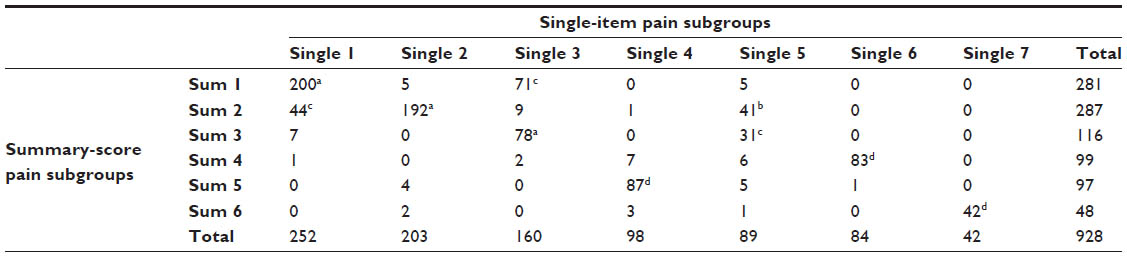 | Table 8 Pain domain, subgroup membership comparison |
Conclusion: pain domain
Despite the near-identical features, the single-item strategy resulted in a more nuanced description by identifying one additional unique subgroup.
Clinical comparison in the activity domain
Three of the four variables in the activity domain contributed to the differentiation of subgroups in the summary-score strategy (Figure 5). One feature was similar in the single-item strategy – cannot work with present pain – and in addition, another six features were identified. The single-item strategy resulted in a more nuanced description by the identification of more features. In particular, we found three subgroups (4, 6, and 7) with midrange scores for many (dichotomous) variables, indicating that subjects in these subgroups differed considerably on these variables from individual to individual, and only a few characteristics really distinguished the groups: walking-distance limitations, dressing problems, walking-speed limitations, and difficulties in household duties. The characteristics of the subgroups in the summary-score strategy were more distinct, with bigger qualitative differences and more clear-cut scores. However, for the single-item strategy, the proportion of crossing subgroups in the profile plots was highest (Table 5), which emphasizes the more nuanced description possible for this strategy.
Subgroup membership comparisons in this domain showed that four summary-score subgroups each mainly consisted of patients from two single-item subgroups, and the remaining three summary-score subgroups represented the unions of four single-item subgroups. Similarly, the seven single-item subgroups could be considered mergers of two to four summary-score subgroups (Table 9).
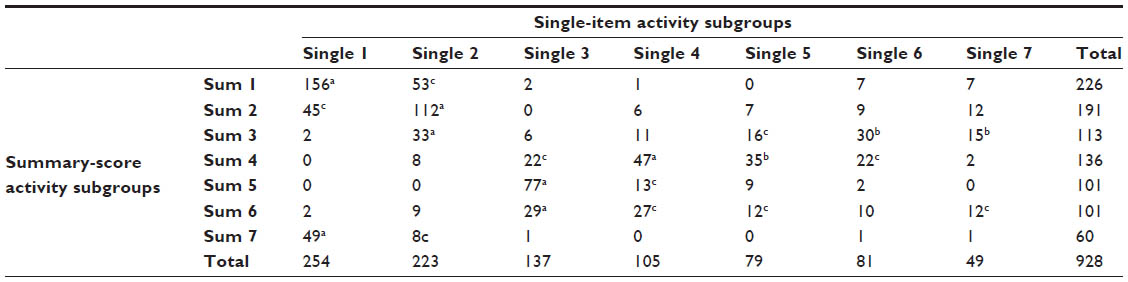 | Table 9 Activity domain, subgroup membership comparison |
Conclusion: activity domain
There were no equivalent subgroups identified by the two strategies, and they were characterized by different features.
Clinical comparison in the participation domain
The summary-score strategy showed mainly quantitative differences. The only exception was a subtle difference with one subgroup scoring moderately on FABQ – work, but lowest on the other identified feature: physical workload (Figure 6). Six features and two additional subgroups were identified in the single-item strategy. The feature social participation limitations divided the subgroups into two categories, ie, low and high scores, respectively. The latter consisted of one subgroup scoring high on all work-belief items and the other low to moderate. Subgroups with low scores on social participation limitation similarly differed on their work-belief scores. The remaining three subgroups showed combinations of high and low scores on the features of beliefs about work too heavy, work makes/would make pain worse, work-aggravated pain, or pain caused by or at work. Low scores on physical workload only appeared with low social participation limitation scores. As a result of the primarily quantitative differences in the summary-score strategy, the proportion of crossing subgroups was clearly highest in the single-item strategy (Table 6), which supported the nuanced qualitative differences identified in this strategy.
When subgroup membership was compared, two of the summary-score subgroups consisted mainly of patients from two single-item subgroups and the last three by unions of four single-item subgroups. Two of the seven single-item subgroups could be considered as mainly subsets of summary-score subgroups and the remaining five as mergers of two or three summary-score subgroups (Table 10). Additional subgroups in the single-item strategy seemed to contribute to actual differences in subgroup membership.
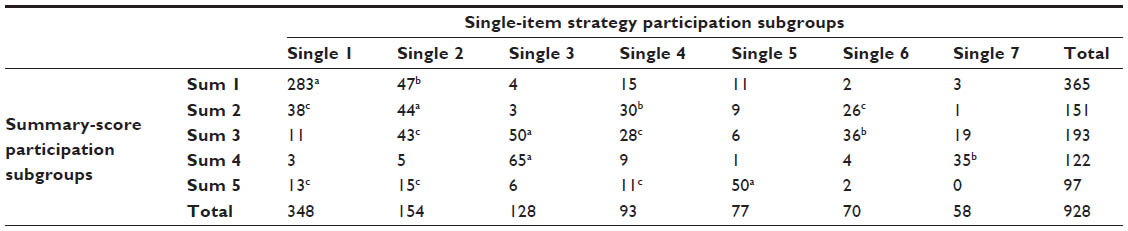 | Table 10 Participation domain, subgroup membership comparisonNotes: aLargest subgroup in each row; blargest subgroup in each column (if different to largest subgroup in row); cnot largest row or column subgroup, but number of patients still covered more than 10% of row subgroup. |
Conclusion: participation domain
The single-item strategy gave a much richer clinical picture, with more subgroups and features identified. The single-item subgroups had quite clear characteristic differences that were based on all the identified features.
Discussion
In the exploration of clinically important subgroups, LCA is increasingly being used, but it is unknown how complex questionnaire data are best analyzed. In this methodological case study, we descriptively compared the use of summary scores to the use of single items from questionnaire data, using the example of patients with LBP. In the single-item strategy, more variables were included and it was expected that this strategy would provide more information, but it was unknown if that level of detail would be valuable, indifferent, or detrimental for the identification of distinct subgroups. Hypothetically, the splitting of (validated) questionnaires, instead of using summary scores, might have limited the potential for a clear profiling of the emergent subgroups, due to the presence of excessive detail.
To our knowledge, this is the first study descriptively comparing in a systematic way the application of “single items” and “summary scores” in data preprocessing prior to using LCA. In our case, both strategies resulted in clinically interpretable and potentially meaningful solutions that all had reasonable LCA model-fit statistics. The high classification agreement across these two data-handling strategies implies that despite these very different ways of managing the variables, there were similar underlying subgroup structures that were detected by both LCA strategies. However, with our explorative approach to subgrouping in the search for previously undiscovered associations among baseline variables, the single-item strategy appeared to be preferable. The reasons were that in three of four health domains, the single-item strategy resulted in more nuanced description, in terms of subgroups characterized by more distinct features that appeared to have potentially clinical relevance. Whether these more detailed subgroup profiles provide a more useful description of subgroups must be investigated in future studies. The single-item strategy included more variables in the LCA, which recent research has indicated would improve subgroup-assignment accuracy, although not all variables had strong associations with subgroup membership,31 and this may explain why the single-item strategy appeared preferable. The single-item strategy tended to have better statistical measures, but the differences in the results were small and thus should be interpreted cautiously. In both approaches, the choice of models that appeared most informative incurred the cost of rejecting more parsimonious models, which would require consideration if generalizability to other cohorts were a priority.
As both strategies were useful, the choice of strategy in future studies might also depend on considerations about the type of research question being addressed. For example, in circumstances where data from multidimensional questionnaires are to be included in LCA, use of the single-item strategy may have advantages. This is because it seems to allow the identification of subgroups that are characterized by combinations of single items and thus explore if single questionnaire items, when combined with other variables, hold information that is not captured using the summary score. Therefore, the resultant modeling is more likely to reflect the influence that these clinical constructs have on the condition being studied. In contrast, the use of the summary-score strategy in this circumstance might potentially dilute and obscure the influence of features on the condition.
The design of a study might favor the summary-score strategy if its purpose is to identify a data structure that might be general across other data sets where summary scores are used and where clinicians in particular clinical situations might be familiar with summary scores only. However, if the purpose is to explore relationships in the data from a more causal or etiological perspective, then it could be that the increased detail available in the single-item strategy would be more revealing.
If the aim is to develop a simple screening instrument to identify a specific subgroup of patients, the single-item strategy might initially be preferable, in order to explore which variables cluster together in the profiling approach. Subsequently, a single item could be selected to identify that patient characteristic within the specific subgroup. In this way, LCA accounts for the possibility that people in one subgroup might load on one variable and people in another subgroup might load on a different variable, even though scores on those two variables are highly correlated.
From a clinical perspective, it would potentially also be an advantage if subgrouping based on a small number of the single items were demonstrated to be as useful as subgrouping based on summary scores, since it would be easier to have patients complete selected items rather than requiring them to score the equivalent full questionnaires. This assumes that not all questions contained in the summary score are informative.
In other circumstances, a hybrid approach might be appropriate. For example, it may be that a study has a particular focus on one domain of health, such as the psychology domain, but recognizes that other domains of health will also influence a patient’s total health status. Therefore, such a study may use the single-item strategy for variables within the psychology domain, but the summary-score strategy in the other domains to reduce complexity.
The result of the LBP subgrouping in this study requires further investigation to explore whether the more nuanced description identified by the single-item strategy also corresponds to a larger diversity with respect to prognosis and treatment success, making this clinically relevant. One approach would be to look at the predictive ability of the identified subgroups. Another possible next step in this explorative approach to subgrouping patients with LBP is to investigate patient profiles based on multiple health domains rather than within separate domains. A new approach to this has been proposed in which LCA is first performed within domains (as implemented in this study) and then the latent class membership from each domain is used as the items for an LCA across domains to identify patient profiles.14,42 This approach is referred to as a “two-stage” LCA. Within the second stage of LCA, it may be apparent whether the identified additional features in the single-item strategy actually inform the subgrouping of patient profiles across domains.
Strengths and limitations
A strength of this study was the use of a relatively large clinical sample with comprehensive data. A further strength was that the decision about the preferred strategy was based on the consistency of results across four disparate health domains that included different numbers and types of items. Also, we conducted a comprehensive assessment of the LCA models to investigate their potential qualities, which involved systematic descriptions of model solutions and of the similarities and differences between the models resulting from the two approaches.
In contrast, a weakness of this study is that the descriptive comparison was only based on one data set – but covering four different health domains involving separate parts of the data – which limits generalizability. Therefore, our focus was to describe these methodological considerations, outline a method pathway for descriptive comparisons, and increase awareness of the potential impact that choices about data-preprocessing strategies may have on the results.
Another weakness of this type of study is that it requires a number of subjective decisions, such as the classification of all variables into four mutually exclusive health domains, which variables to reverse-score, which variables to categorize, and how to interpret the overlap between subgroups from the different subgrouping strategies. Different choices during those decisions may have impacted the results. Most importantly, model selection that is not mainly driven by model-fit statistics involves subjective decisions, and although “conceptual meaningfulness” is often mentioned as an element of model selection within LCA,15,22,43 the selection in previous studies has generally been driven by statistical fit and model parsimony. In this study, model selection was initially guided by model fit for fixed numbers of subgroups, and subsequently selection across different model sizes was primarily based on a qualitative evaluation of the subgroups relative to models of different sizes. Therefore, other researchers might have made different decisions under the same circumstances. However, the consensus process involving all five authors adds credibility to the subjective choices that had to be made.
The emphasis on the qualitative assessment meant that less parsimonious models were most often preferred to model selection that would have been based principally on statistical evaluation. For example, using the lowest BIC as the criterion for model selection would have resulted in models with fewer subgroups in three of four domains in both approaches. The exception to this was the psychology domain, where the preferred model would have been the same in the single-item strategy, and in the summary-score strategy a model with an additional four subgroups would have been selected. However, also when using this lowest BIC, the single-item strategy resulted in a model with more subgroups than the summary-score strategy in three of the four health domains.
Since we included many conceptually related items, especially in the single-item strategy, it is likely that conditionally on the latent subgroups, some variables remained correlated. As pointed out by Suppes,44 this may have resulted in models containing more subgroups than if we had relied only on goodness-of-fit statistics for model selection. However, in this study, we performed LCA in an exploratory manner and selected the preferred models primarily on clinical interpretability (face validity). Therefore, this consideration is less of a concern.
Finally, we would like to point out that there is no established statistical methodology for comparing two model solutions selected using a subjective qualitative assessment and based on a different number of variables. Some of our approaches, like inspections of profile plots or the analysis of the overlap between subgroups (subgroup membership comparison), seem to us rather unproblematic. However, for statistically oriented criteria like median posterior probability, it might be debatable whether they reflect a difference in the solutions or just a difference in the number of variables involved. Also, there is no doubt that it would have been preferable to blind the participants of the consensus process for the type of strategy used, to avoid the possibility that attitudes about the usefulness of the approaches could influence the results. Unfortunately, due to the different types of input variables used in the two approaches, this was not possible. Despite both strategies appearing useful, it is currently unknown to what extent the merits of the single-item strategy compared to the summary-score strategy are sample-specific.
Conclusion
In this data set, application of both the summary-score strategy and the single-item strategy in the LCA subgrouping in four health domains resulted in clinically interpretable subgroups, but the single-item strategy generally revealed more distinguishing characteristics. These results 1) warrant further analyses of other data sets to determine whether these findings are consistent, and 2) warrant investigation in longitudinal data to test whether the finer detail provided by the single-item strategy results in more clinically meaningful insights into prognosis or treatment success. Also, as both methodological approaches appeared useful, each of them might have merit depending on the research questions being investigated.
Acknowledgments
The authors thank the participating patients, clinicians in the research network of the Nordic Institute for Chiropractic and Clinical Biomechanics, and the Foundation for Chiropractic Research and Post Graduate Education, Denmark. This study was funded by the Danish Foundation for Chiropractic Research and Post Graduate Education (grant no 11/1445) and the Faculty of Health Sciences, University of Southern Denmark. AMN and PK were partly and AK was fully financially supported by the Foundation for Chiropractic Research and Post Graduate Education. Additional thanks are extended to the research assistants, Jytte Johannesen and Orla Lund Nielsen, for practical help with data collection and data management.
Author contributions
AK and PK initiated the work. WV contributed to designing the statistical analysis. AMN performed the data analysis and wrote the initial draft of the manuscript. All authors were involved in the design of the study, interpretation of data, and revision of the manuscript, and all read and approved the final manuscript.
Disclosure
The authors report no conflicts of interest in this work. The funding bodies had no control over the design, conduct, data, analysis, review, reporting, or interpretation of the research conducted.
References
Leboeuf-Yde C, Manniche C. Low back pain: time to get off the treadmill. J Manipulative Physiol Ther. 2001;24(1):63–66. | |
Kent P, Keating J. Do primary-care clinicians think that nonspecific low back pain is one condition? Spine (Phila Pa 1976). 2004;29(9):1022–1031. | |
Global Burden of Disease Study 2013 Collaborators. Global, regional, and national incidence, prevalence, and years lived with disability for 301 acute and chronic diseases and injuries in 188 countries, 1990-2013: a systematic analysis for the Global Burden of Disease Study 2013. Lancet. 2015;386(9995):743–800. | |
Koch MB, Davidsen M, Juel K. De Samfundsmæssige Omkostninger ved Rygsygdomme og Rygsmerter i Danmark. [The societal costs of back disorders and back pain in Denmark]. Copenhagen: Statens Institut for Folkesundhed. [The Danish National Institute of Public Health]; 2011. Danish. | |
Walker BF, French SD, Grant W, Green S. Combined chiropractic interventions for low-back pain. Cochrane Database Syst Rev. 2010;(4):CD005427. | |
Lam M, Galvin R, Curry P. Effectiveness of acupuncture for nonspecific chronic low back pain: a systematic review and meta-analysis. Spine (Phila Pa 1976). 2013;38(24):2124–2138. | |
Kamper SJ, Apeldoorn AT, Chiarotto A, et al. Multidisciplinary bio-psychosocial rehabilitation for chronic low back pain. Cochrane Database Syst Rev. 2014;9:CD000963. | |
Rubinstein SM, Terwee CB, Assendelft WJ, de Boer MR, van Tulder MW. Spinal manipulative therapy for acute low-back pain. Cochrane Database Syst Rev. 2012;9:CD008880. | |
Rubinstein SM, van Middelkoop M, Assendelft WJ, de Boer MR, van Tulder MW. Spinal manipulative therapy for chronic low-back pain. Cochrane Database Syst Rev. 2011;(2):CD008112. | |
Keller A, Hayden J, Bombardier C, van Tulder M. Effect sizes of non-surgical treatments of non-specific low-back pain. Eur Spine J. 2007;16(11):1776–1788. | |
Koes BW, van Tulder MW, Thomas S. Diagnosis and treatment of low back pain. BMJ. 2006;332(7555):1430–1434. | |
Fergusson DM, Horwood LJ, Lynskey MT. The comorbidities of adolescent problem behaviors: a latent class model. J Abnorm Child Psychol. 1994;22(3):339–354. | |
Stern HS, Arcus D, Kagan J, Rubin DB, Snidman N. Using mixture models in temperament research. Int J Behav Dev. 1995;18(3):407–423. | |
Dewilde C. The multidimensional measurement of poverty in Belgium and Britain: a categorical approach. Soc Indic Res. 2004;68(3):331–369. | |
Coffman DL, Patrick ME, Palen LA, Rhoades BL, Ventura AK. Why do high school seniors drink? Implications for a targeted approach to intervention. Prev Sci. 2007;8(4):241–248. | |
Miaskowski C, Dunn L, Ritchie C, et al. Latent class analysis reveals distinct subgroups of patients based on symptom occurrence and demographic and clinical characteristics. J Pain Symptom Manage. 2015;50(1):28–37. | |
Lourenço S, Araájo F, Severo M, Cunha ML, Carnide F, Lucas R. Patterns of biomechanical demands are associated with musculoskeletal pain in the beginning of professional life: a population-based study. Scand J Work Environ Health. 2015;41(3):234–246. | |
Hartvigsen J, Davidsen M, Hestbaek L, Sogaard K, Roos EM. Patterns of musculoskeletal pain in the population: a latent class analysis using a nationally representative interviewer-based survey of 4817 Danes. Eur J Pain. 2013;17(3):452–460. | |
Auvinen JP, Paananen MV, Tammelin TH, et al. Musculoskeletal pain combinations in adolescents. Spine (Phila Pa 1976). 2009;34(11):1192–1197. | |
Kent P, Jensen RK, Kongsted A. A comparison of three clustering methods for finding subgroups in MRI, SMS or clinical data: SPSS TwoStep Cluster analysis, Latent Gold and SNOB. BMC Med Res Methodol. 2014;14:113. | |
Kongsted A, Kent P, Hestbaek L, Vach W. Patients with low back pain had distinct clinical course patterns that were typically neither complete recovery nor constant pain: a latent class analysis of longitudinal data. Spine J. 2015;5(5):885–894. | |
Dunn KM, Campbell P, Jordan KP. Long-term trajectories of back pain: cohort study with 7-year follow-up. BMJ Open. 2013;3(12):e003838. | |
Deyo RA, Bryan M, Comstock BA, et al. Trajectories of symptoms and function in older adults with low back disorders. Spine (Phila Pa 1976). 2015;40(17):1352–1362. | |
Barons MJ, Griffiths FE, Parsons N, et al. Matching patients to an intervention for back pain: classifying patients using a latent class approach. J Eval Clin Pract. 2014;20(4):544–550. | |
Pincus T, Kent P, Bronfort G, Loisel P, Pransky G, Hartvigsen J. Twenty-five years with the biopsychosocial model of low back pain – is it time to celebrate? A report from the twelfth international forum for primary care research on low back pain. Spine (Phila Pa 1976). 2013;38(24):2118–2123. | |
Kent P, Grotle M, Dunn KM, Albert HB, Lauridsen HH. Rasch analysis of the 23-item version of the Roland Morris Disability Questionnaire. J Rehabil Med. 2015;47(4):356–364. | |
Hill JC, Dunn KM, Lewis M, et al. A primary care back pain screening tool: identifying patient subgroups for initial treatment. Arthritis Rheum. 2008;59(5):632–641. | |
Meroni R, Piscitelli D, Bonetti F, Zambaldi M, Guccione AA, Pillastrini P. Rasch analysis of the Italian version of Fear Avoidance Beliefs Questionnaire (FABQ-I). Disabil Rehabil. 2015;37(2):151–157. | |
Eirikstoft H, Kongsted A. Patient characteristics in low back pain subgroups based on an existing classification system: a descriptive cohort study in chiropractic practice. Man Ther. 2014;19(1):65–71. | |
Danish National Committee on Biomedical Research Ethics. Act on Research Ethics Review of Health Research Projects (section 14.2). 2013. Available from: http://www.cvk.sum.dk/English/actonabiomedicalresearch.aspx. Accessed May 27, 2015. | |
Wurpts IC, Geiser C. Is adding more indicators to a latent class analysis beneficial or detrimental? Results of a Monte-Carlo study. Front Psychol. 2014;5:920. | |
Petersen T, Laslett M, Thorsen H, Manniche C, Ekdahl C, Jacobsen S. Diagnostic classification of non-specific low back pain: a new system integrating patho-anatomic and clinical categories. Physiother Theory Pract. 2003;19(4):213–237. | |
Vermunt JK, Magidson J. Latent Gold 4.0 User’s Guide. Belmont, MA: Statistical Innovations; 2005. | |
World Health Organization. ICF browser [search engine]. Available from: http://apps.who.int/classifications/icfbrowser. Accessed August 19, 2015. | |
Cieza A, Stucki G, Weigl M, et al. ICF core sets for low back pain. J Rehabil Med. 2004;(44 Suppl):69–74. | |
Grotle M, Brox JI, Vollestad NK. Functional status and disability questionnaires: what do they assess? A systematic review of back-specific outcome questionnaires. Spine (Phila Pa 1976). 2005;30(1):130–140. | |
Wang P, Zhang JM, Liao WJ, et al. Content comparison of questionnaires and scales used in low back pain based on the international classification of functioning, disability and health: a systematic review. Disabil Rehabil. 2012;34(14):1167–1177. | |
Vermunt JK, Magidson J. Latent Gold 5.0 Upgrade Manual. Belmont, MA: Statistical Innovations; 2013. | |
Nylund KL, Asparouhov T, Muthén BO. Deciding on the number of classes in latent class analysis and growth mixture modeling: a Monte Carlo simulation study. Struct Equ Modeling. 2007;14(4):535–569. | |
Hestbaek L, Munck A, Hartvigsen L, Jarbøl DE, Søndergaard J, Kongsted A. Low back pain in primary care: a description of 1250 patients with low back pain in Danish general and chiropractic practice. Int J Family Med. 2014;2014:106102. | |
Nagin DS. Group-Based Modeling of Development. Cambridge, MA: Harvard University Press; 2005. | |
Kent P, Stochkendahl MJ, Christensen HW, Kongsted A. Could the clinical interpretability of subgroups detected using clustering methods be improved by using a novel two-stage approach? Chiropr Man Therap. 2015;23:20. | |
Adamson G, Murphy S, Shevlin M, Buckle P, Stubbs D. Profiling schoolchildren in pain and associated demographic and behavioural factors: a latent class approach. Pain. 2007;129(3):295–303. | |
Suppes P. When are probabilistic explanations possible? In: Models and Methods in the Philosophy of Science: Selected Essays. Vol 226. Heidelberg: Springer; 1993:141–148. |
 © 2016 The Author(s). This work is published and licensed by Dove Medical Press Limited. The full terms of this license are available at https://www.dovepress.com/terms.php and incorporate the Creative Commons Attribution - Non Commercial (unported, v3.0) License.
By accessing the work you hereby accept the Terms. Non-commercial uses of the work are permitted without any further permission from Dove Medical Press Limited, provided the work is properly attributed. For permission for commercial use of this work, please see paragraphs 4.2 and 5 of our Terms.
© 2016 The Author(s). This work is published and licensed by Dove Medical Press Limited. The full terms of this license are available at https://www.dovepress.com/terms.php and incorporate the Creative Commons Attribution - Non Commercial (unported, v3.0) License.
By accessing the work you hereby accept the Terms. Non-commercial uses of the work are permitted without any further permission from Dove Medical Press Limited, provided the work is properly attributed. For permission for commercial use of this work, please see paragraphs 4.2 and 5 of our Terms.