")
Back to Journals » Patient Preference and Adherence » Volume 14
Using a Self-Administered Electronic Adherence Questionnaire to Identify Poor Adherence Amongst Adolescents and Young Adults on First-Line Antiretroviral Therapy in Johannesburg, South Africa
Authors Hirasen K , Evans D , Jinga N , Grabe R , Turner J, Mashamaite S, Long LC, Fox MP
Received 28 March 2019
Accepted for publication 18 September 2019
Published 22 January 2020 Volume 2020:14 Pages 133—151
DOI https://doi.org/10.2147/PPA.S210404
Checked for plagiarism Yes
Review by Single anonymous peer review
Peer reviewer comments 2
Editor who approved publication: Dr Johnny Chen
Kamban Hirasen,1,* Denise Evans,1,* Nelly Jinga,1 Rita Grabe,2 Julia Turner,2 Sello Mashamaite,2 Lawrence C Long,1,3 Matthew P Fox1,3,4
1Health Economics and Epidemiology Research Office, Department of Internal Medicine, School of Clinical Medicine, Faculty of Health Sciences, University of the Witwatersrand, Johannesburg, South Africa; 2Right to Care, Johannesburg, South Africa; 3Department of Global Health, Boston University School of Public Health, Boston, MA, USA; 4Department of Epidemiology, Boston University School of Public Health, Boston, MA, USA
*These authors contributed equally to this work
Correspondence: Denise Evans Tel +27 10 001 0637
Email [email protected]
Introduction: The best method to measure adherence to antiretroviral therapy (ART) in resource-limited settings has not yet been established, particularly among adolescents and young adults (AYAs). The use of mobile technology may address the need for standardized tools in measuring adherence in this often marginalized population.
Methods: We conducted a cross-sectional validation study among AYAs (18– 35 years) attending a South African HIV clinic between 07/2015-09/2017. We determine the diagnostic accuracy of two modes of delivering an adherence questionnaire (self-administered electronic vs interviewer-administered paper-adherence questionnaire) comprising two self-reported adherence tools (South African National Department of Health (NDoH) adherence questionnaire and the Simplified Medication Adherence Questionnaire (SMAQ)) to identify poor adherence compared to; 1) a detectable viral load (≥ 1000 copies/mL) and 2) a sub-optimal concentration of efavirenz (EFV) (EFV ≤ 1.00 μg/mL) measured by therapeutic drug monitoring (TDM).
Results: Of 278 included participants, 7.1% and 7.3% completing the electronic- and paper-questionnaires had a detectable viral load, while 14.7% and 16.5% had a sub-optimal concentration of EFV, respectively. According to viral load monitoring, the electronic-adherence questionnaire had a higher sensitivity (Se) in detecting poor adherence than the paper-based version across the NDoH adherence questionnaire (Se: 63.6% vs 33.3%) and SMAQ (Se: 90.9% vs 66.7%). In contrast, when using blood drug concentration (EFV ≤ 1.00 μg/mL), the paper-adherence questionnaire produced a higher sensitivity across both adherence tools; namely the NDoH adherence questionnaire (Se: 50.0% vs 38.1%) and SMAQ (Se: 75.0% vs 57.1%).
Conclusion: When using more accurate real-time measures of poor adherence such as TDM in this young adult population, we observe a higher sensitivity of an interviewer-administered paper-adherence questionnaire than an identical set of self-administered adherence questions on an electronic tablet. An interviewer-administered questionnaire may elicit more accurate responses from participants through a sense of increased accountability when engaging with health care workers.
Keywords: antiretroviral therapy, adherence, adolescents, virologic suppression, therapeutic drug monitoring, South Africa
Introduction
While HIV incidence has been declining worldwide in recent years,1 sub-Saharan Africa (SSA) still bears a disproportionate burden of the disease.2 There are an estimated 37 million people infected with HIV worldwide.3 Specifically, some 4 million adolescents and young adults (AYAs) aged 15 to 24 years are infected with the virus globally.4 This sub-population faces many unique challenges in HIV-treatment access, adherence and subsequently, the achievement of favorable treatment outcomes.
Adolescence is a transitionary period between child- and adulthood, and is often associated with rebelliousness, identity formation, risk-taking behaviour and sexual experimentation.5–7 Consequently, this group has been identified as being particularly susceptible to HIV infection. Moreover, due to unclear adolescent patient confidentiality policies and the possible judgement and unfriendliness of health care workers, this young population is often marginalized from mainstream health services, subsequently limiting sustained access to treatment and services.8 In turn, traditional markers of successful antiretroviral therapy (ART) such as retention in care and virologic suppression remain poorer among AYAs compared to their older adult counterparts.9–12
While optimal levels of adherence to ART have been defined, a lack of consensus surrounding the best method to measure adherence, particularly in resource-limited settings (RLS), necessitates the need for consistent/standardized measurement tools.13,14 Modes of measurement can be categorized as direct methods (e.g., biological assays and other markers in the blood, urine or body fluids that measure drug concentrations in the individual patient) and indirect methods (e.g., self-report tools such as visual analogue scales (VAS) and pill identification tests (PIT) as well as missed visits, prescription/pharmacy re-fills and electronic drug monitoring systems).15 While self-reported indirect methods tend to be commonly used in RLS (through structured patient-interviews), this mode of measurement is often subject to reporting and recall bias resulting in a general over-estimation of true adherence.16,17
A promising approach identified to specifically address the challenges unique to AYAs in RLS has been the use of mobile technologies. In particular, the use of smartphones and tablets may be especially appealing to this sub-population as they tend to be both early adopters and high impact users of such technology.18 In particular, when compared to traditional interviewer-administered paper questionnaires, self-administered electronic questionnaires may reduce response bias by allowing for more honest reporting of sensitive information and unprescribed behavior.19 This coupled with a potential reduction in data entry errors through logic checks, more accurate adherence tracking and increased efficiency in data storage and management may make the use of mobile technology a viable option in measuring adherence to ART.
While virologic and treatment failure can be attributed to drug toxicity or resistance, it is most commonly a function of poor adherence.20 As such, viral load is often considered a marker of poor adherence. However, it is important to note that discrepancies between viral load monitoring (elevated or detectable viral load) and treatment adherence (optimal levels of adherence) have previously been reported.21,22 This sub-group of patients, who are in fact truly adherent, may then report detectable levels of virus due to possible drug resistance. In South Africa, viral load is routinely used to monitor ART and identify treatment failure (standard of care).23 In routine practice, patients with a detectable viral load (≥1000 copies/mL) on first-line ART are referred for intensive adherence counselling followed by repeat viral load testing 2–4 months later. Patients who resuppress (<400 copies/mL) continue to receive the standard of care, while those who do not are switched to more expensive second-line regimens.23 In this way, viral load monitoring is used as a direct measure of treatment failure and provides only a proximal measure of adherence. In most cases, viral load monitoring is only effective after sustained periods of poor adherence which result in an elevated viral load above a pre-determined threshold (early detection of treatment failure but late detection of potential poor adherence – late response).
Therapeutic drug monitoring (TDM), on the other hand, has not been routinely implemented due to high costs, accessibility and complexity which makes its application in RLS challenging.24–26 TDM does however provide more robust real-time estimates of poor adherence as actual blood drug concentrations are measured (early detection). Therefore, the combined use of both these measures, viral load monitoring and TDM, may provide a better estimate of poor adherence.
In this study we compare the sensitivity (Se), specificity (Sp), positive (PPV) and negative predictive value (NPV) of two modes of delivering an adherence questionnaire (1) a self-administered self-reported electronic tablet-based adherence questionnaire (EAQ) vs (2) standard of care interviewer-administered self-reported paper-based adherence questionnaire (PAQ) comprising two different adherence tools (South African National Department of Health (NDoH) adherence questionnaire and the Simplified Medication Adherence Questionnaire (SMAQ)) to identify poor adherence compared to; 1) a detectable plasma viral load (≥1000 copies/mL) and 2) a sub-optimal concentration of efavirenz (EFV) (EFV ≤1.00 µg/mL) in serum measured by TDM.
Methods
Study Design and Population
We conducted a cross-sectional validation study among HIV-positive AYAs (18–35 years at study enrollment) on first-line ART for ≥12 weeks at a large urban HIV outpatient clinic, located at a secondary hospital in Johannesburg, South Africa. Participants had to be returning to the clinic for a routine viral load test between 07/2015-09/2017 as per national guidelines (first viral load test administered at 6 months post-ART initiation, followed by at 12 months and 12 monthly thereafter).23 Study eligibility was based on participants’ ability to speak and understand English, willingness to use an electronic tablet for the completion of an ART adherence questionnaire and to provide an extra blood sample for TDM. Participants who were pregnant at enrollment were ineligible to participate due to potentially altered and highly variable pharmacokinetics,27,28 which may have affected TDM results. Participants who were too sick and those with a previously elevated viral load result in the 12 weeks preceding enrollment were also excluded as we wanted to restrict the study to participants returning for routine viral load monitoring (i.e., only consider the first elevated viral load ≥1000 copies/mL) and not those returning to confirm virologic failure.26–30
Study Site
HIV care and treatment at the study site follows the South African NDoH ART Guidelines.23,29–32 Through support of a non-governmental organization (NGO), an adolescent clinic within the study site provides additional counselling to AYAs during clinic visits. All demographic, longitudinal clinical and laboratory data are captured on an electronic patient management system called TherapyEdge-HIV™ (TE).33 Laboratory data (e.g., CD4 counts and viral load results) were obtained daily through an automated download of electronic records held by the National Health Laboratory Services (NHLS), the primary provider of laboratory services for South Africa’s public sector clinics. During the study period, South Africa introduced a universal test and treat (UTT) policy within its public-sector HIV treatment program (2016) which called for ART initiation among all known HIV-positive persons, irrespective of CD4 cell count.32 While this change may have occurred during study enrollment, first-line ART regimens and treatment monitoring (timing of viral load tests) remained the same during the study period and therefore no direct impact of guideline changes was observed during study procedures.
Procedures
A convenience sample was obtained by approaching patients who presented at the clinic on a daily basis (Monday–Friday). Interviewers screened and confirmed eligibility prior to obtaining written informed consent. Once participants provided informed consent, interviewers assigned a unique study ID and also recorded the medical record ID so that responses to the adherence questionnaire could be linked to the participants’ electronic medical records.
To minimize variability of socio-demographic and clinical characteristics between respective modes of delivery (electronic- vs paper-adherence questionnaire), block randomization using Microsoft Excel was used to assign eligible participants to respective adherence questionnaires (each participant completed only one questionnaire, either the electronic- or paper-adherence questionnaire). To reduce selection bias, the outcome of the randomization was only revealed after participants had provided consent to participate and were enrolled in the study. While study analysts were aware of the randomization pre-consent, patient interviewers and participants became aware of the randomization outcome post-consent, and laboratory personnel processing and managing viral load and TDM results remained blinded throughout the study period.
The two different modes of delivering an adherence questionnaire (self-administered electronic vs interviewer-administered paper-adherence questionnaire) comprised two different adherence tools; 1) South African National Department of Health adherence questionnaire and 2) Simplified Medication Adherence Questionnaire based on the modified Morisky scale of adherence.34 Adherence tools included items for self-reported adherence during the period preceding the assessment (missed doses up to 3 months), a visual analogue scale in which participants classified their adherence as a measure from 0–10 (0 being not good at all, and 10 being very good), forgetfulness, routine, effects of adverse reactions and pill identification tests (i.e., questions about the name of the medication, number of pills per dose, time the medication is taken and if the patient knows any additional instructions such as storage in a refrigerator, take with food or avoid other medications) (see Figure 1).35
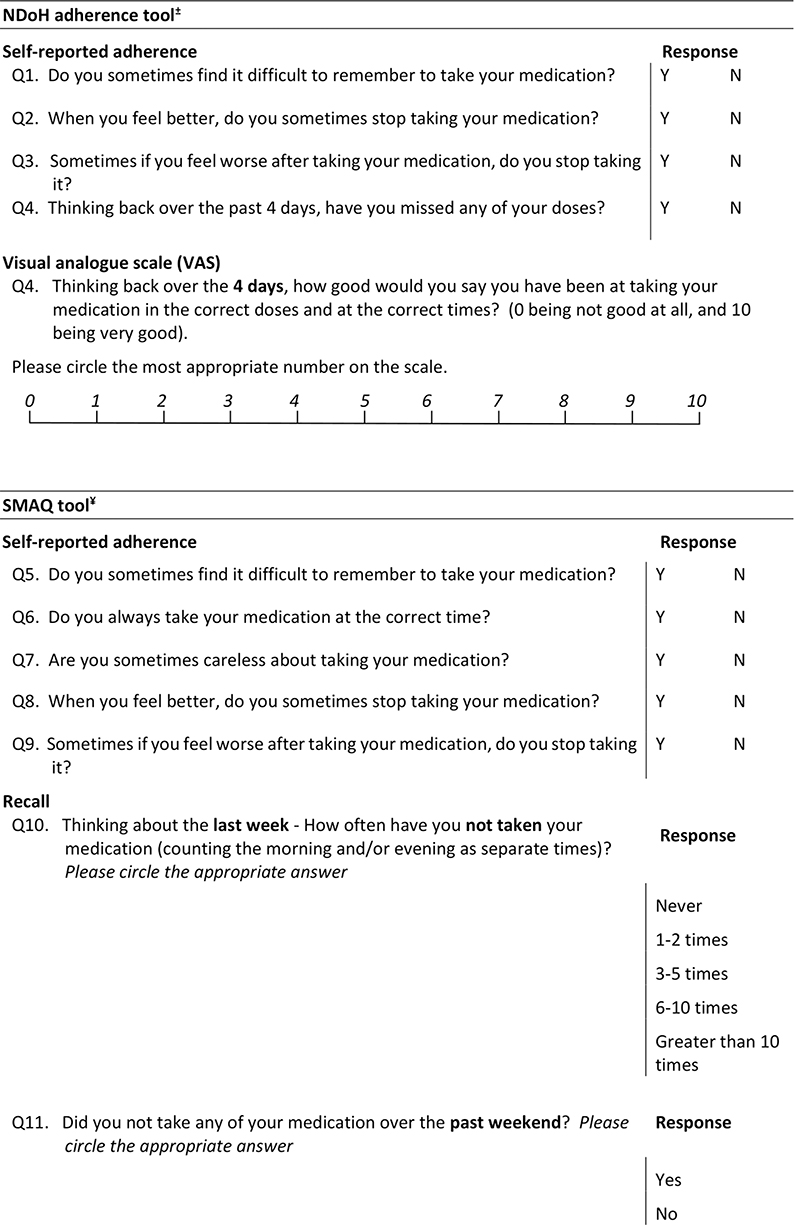 |
Figure 1 Continued.. |
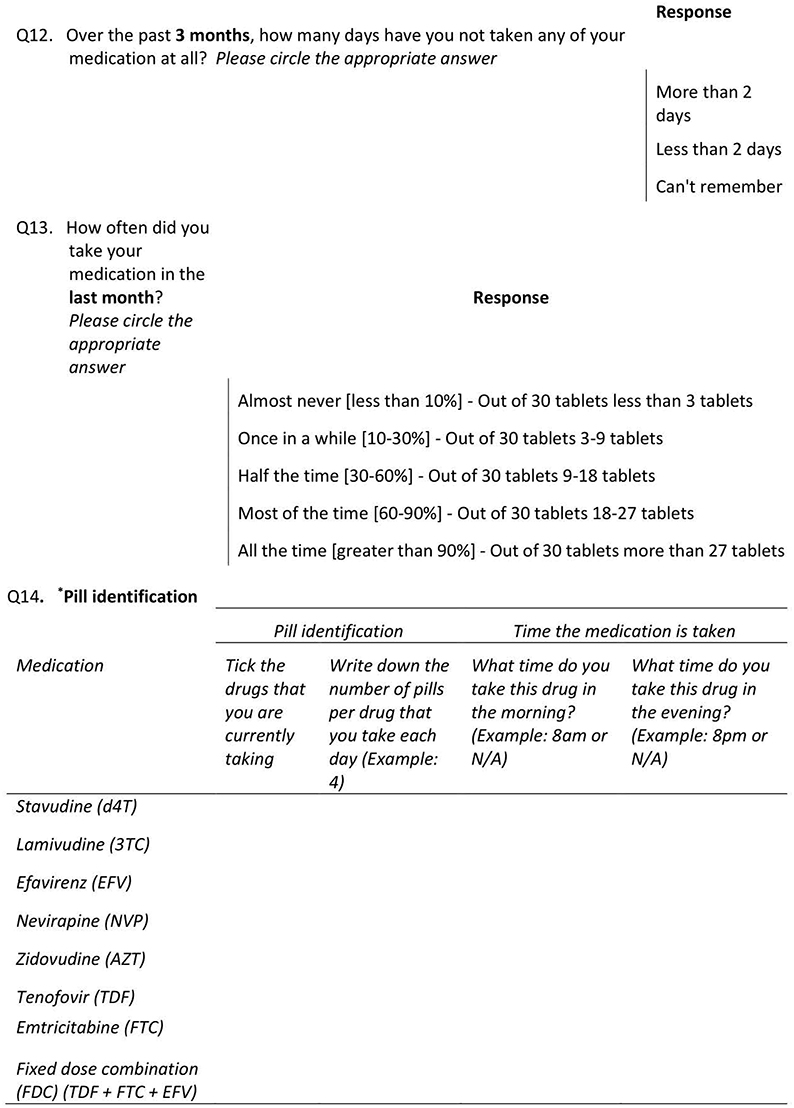 |
Figure 1 Poor adherence by South African National Department of Health (NDoH) adherence tool vs Simplified Medication Adherence Questionnaire (SMAQ) tool. Notes: *Pill identification questions appear once in each questionnaire (electronic- vs paper-adherence questionnaire) but are included in definitions of poor adherence in both the NDoH tool and SMAQ tool. ±Poor adherence defined by the NDoH adherence tool: "Yes" response to Q1, Q2, Q3, Q4 or reported <8 in Q5, or could not identify more than two thirds of their prescribed antiretroviral (ARVs) drugs, nor identify the correct time their medication should be taken or the number of pills to be taken (Q14). ¥Poor adherence defined by the SMAQ adherence tool: "Yes" response to Q5, Q7, Q8, Q9, Q11 or "No" reponse to Q6 or non- "Never" response to Q10 or "More than 2 days" response to Q12 or non- "Out of 30 tablets more than 27 tablets" response to Q13 or could not identify more than two thirds of their prescribed antiretroviral (ARVs) drugs (Q14). Data from Knobel et al.34 |
To assess the feasibility of the different modes of delivery (self-administered electronic vs interviewer-administered paper-adherence questionnaire), an identical set of six 5-point Likert scale questions (strongly agree, agree, neutral, disagree, strongly disagree) were also included in each questionnaire (see Table S1). Additionally, we explored eight open-ended questions at the end of each questionnaire to understand participants’ likes/dislikes of adherence counselling and experiences with the electronic- or paper-based adherence questionnaire (see Table S1). When analysing qualitative data, we conducted a spell-check and rapid assessment to address consistency of language (this included spelling errors and adjusting from common short message service (SMS) writing format (e.g., bcos=because; hv=have; nd=and; ppl=people, etc.)). We used NVivo 11 and report on the most common responses and provide a few illustrative examples from each question. When appropriate we compared the difference between the electronic- vs paper-adherence questionnaire. All questionnaires were administered in English.
Participants randomized to complete the self-administered electronic-adherence questionnaire did so with minimal assistance from interviewers. Information cards with step-by-step instructions and graphics were available to participants while completing their adherence assessment. Participants completed the electronic-adherence questionnaire in a private study room, away from the general clinic population. The electronic-adherence questionnaire was modified to be administered on a touch screen Samsung Galaxy 3 10.1 inch P5200 Tablet, and designed on iFormBuilder, a universal, cloud-based mobile data collection platform from Zerion software.36 Upon completion of the electronic-adherence questionnaire, participants had to select the “Done” option at the end of the questionnaire at which time all patient-related data were encrypted, uploaded to iFormBuilder and removed from the Samsung tablet through an automated process built-in to the software.
Participants randomized to the counsellor/interviewer-administered paper-adherence questionnaire met with an interviewer who asked adherence questions (NDoH and SMAQ adherence tools) and completed a paper-based form, as is the standard of care at the clinic. As with the electronic-adherence questionnaire, all interviews were conducted in a private room, away from the general clinic population. Patient interviewers later entered data from paper-based forms into iFormBuilder.
After completing either the electronic- or paper-based questionnaire, participants were referred to the clinics blood room for routine viral load monitoring. Clinic staff subsequently conducted the routine viral load blood draw and drew an extra blood sample for TDM. Viral load blood samples were sent directly to NHLS for processing and results were returned generally within 14 days from the date of blood draw. Viral load results were merged with adherence data via unique study identifiers.
TDM blood samples collected at the time of viral load blood draw were stored on site at room temperature and collected daily by Central Laboratory Services (CLS). On arrival at CLS, samples were centrifuged at approximately 1500 g for 10 mins, decanted into labeled cryovials (“P” for primary and “D” for duplicate) and stored at −20 degrees Celsius. Samples were then shipped overnight on dry-ice to the Division of Clinical Pharmacology, University of Cape Town (UCT), and stored until testing. Each sample was tested using a validated liquid chromatography (LC) mass spectrometry (MS)/MS semi-quantitative method for the determination of EFV. Each sample tested was classified into four distinct categories; <0.02 µg/mL; 0.02 µg/mL - 0.05 µg/mL; 0.05 µg/mL - 1.00 µg/mL; and >1.00 µg/mL (personal communication Jennifer Norman, Laboratory Director, Routine TDM Service, Division of Clinical Pharmacology).
All participants (randomized to complete either the electronic- or paper-adherence questionnaire) were reimbursed ZAR100.00 for their time and travel costs. Reimbursement was only disclosed after the screening process to prevent participants from providing inaccurate information regarding their study eligibility.
Study Variables
Patient demographic and clinical characteristics at study enrollment including sex, age, education, employment and current first-line ART regimen were extracted from the electronic patient medical record and respective adherence questionnaires. Time on ART was calculated from the date of ART initiation (obtained from patient medical records) to study enrollment and categorized between 3–12 months and ≥12 months. Monitoring bloods such as CD4 cell count was available from the electronic patient record and measured closest to date of study enrollment (12 months before to 14 days post-study enrollment to capture the latest available results as prescribed by national guidelines).
In keeping with standardized definitions across adherence tools, non/poor adherence according to the NDoH adherence protocol35,37 and SMAQ protocol34 was defined through a combination of responses (see Figure 1).
Statistical Analysis
Patient demographic and clinical characteristics at study enrollment were summarized using frequencies for categorical variables and median and interquartile range (IQR) for continuous variables. Where necessary we cross-tabulated proportions of categorical variables. Sensitivity, specificity, positive and negative predictive value of each mode of delivery (electronic- vs paper-adherence questionnaire) and of the different tools (NDoH and SMAQ) were determined against laboratory definitions of poor adherence; 1) a detectable viral load (≥1000 copies/mL) and 2) sub-optimal concentration of EFV in the blood (EFV ≤1.00 µg/mL) (personal communication with Taryn Pillay from NHLS, 26 September 2018).
Results
Cohort Description
During the study period, a total of 290 participants met eligibility criteria and were enrolled. A total of 160/290 (55.2%) and 130/290 (44.8%) participants were enrolled and randomized to complete either the electronic- or paper-adherence questionnaire, respectively. Following enrollment, 3/160 (1.9%) participants completing the electronic- and 3/130 (2.3%) participants completing the paper-adherence questionnaire were found to be ineligible through data/eligibility verification via electronic medical record review (previously elevated viral load in the 12 weeks preceding enrollment/re-enrolled). Of the remaining 157 participants completing the electronic- and 127 participants completing the paper-adherence questionnaire, 3/157 (1.9%) and 3/127 (2.4%) had missing viral load results at study enrollment (unsuitable/contaminated sample) and were subsequently excluded from the analysis. The final analytic sample comprised of 278 participants; 154 (55.4%) completing the electronic- and 124 (44.6%) completing the paper-adherence questionnaire (see Figure 2).
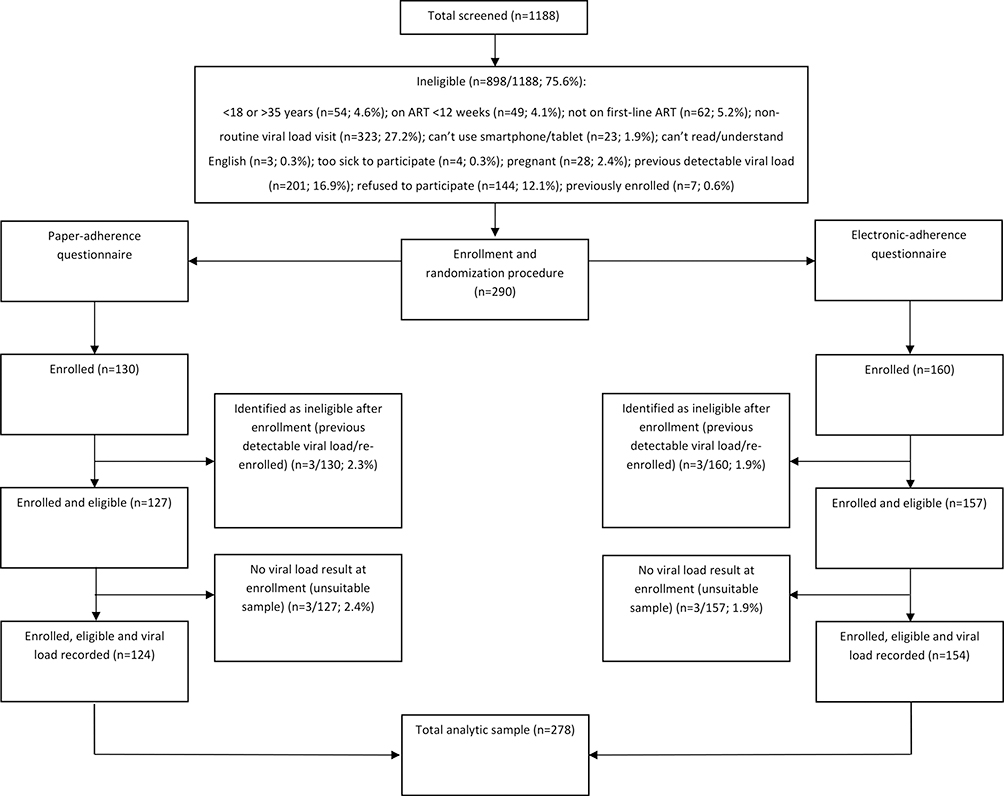 |
Figure 2 Screening, randomization and enrollment procedure. |
Demographic and Clinical Characteristics
The proportion female was similar between participants completing the electronic- and paper-adherence questionnaire, respectively (78.6% vs 79.0%) as was the median age at initiation (30.7 vs 31.8 years), median time on ART (42.0 vs 42.3 months) and current first-line ART regimen (89.5% vs 92.7% on a fixed-dose combination (FDC)). Participants completing the electronic-adherence questionnaire had higher levels of tertiary education (24.0% vs 12.1%) and employment (55.2% vs 49.2%). The CD4 count categories (closest to study enrollment) were similar between those randomized to electronic- vs paper-adherence questionnaire, respectively (<100 cells/mm3; 0.8% vs 1.1%, 100–350 cells/mm3; 26.9% vs 23.1% and ≥350 cells/mm3; 72.3% vs 75.8%) (see Table 1).
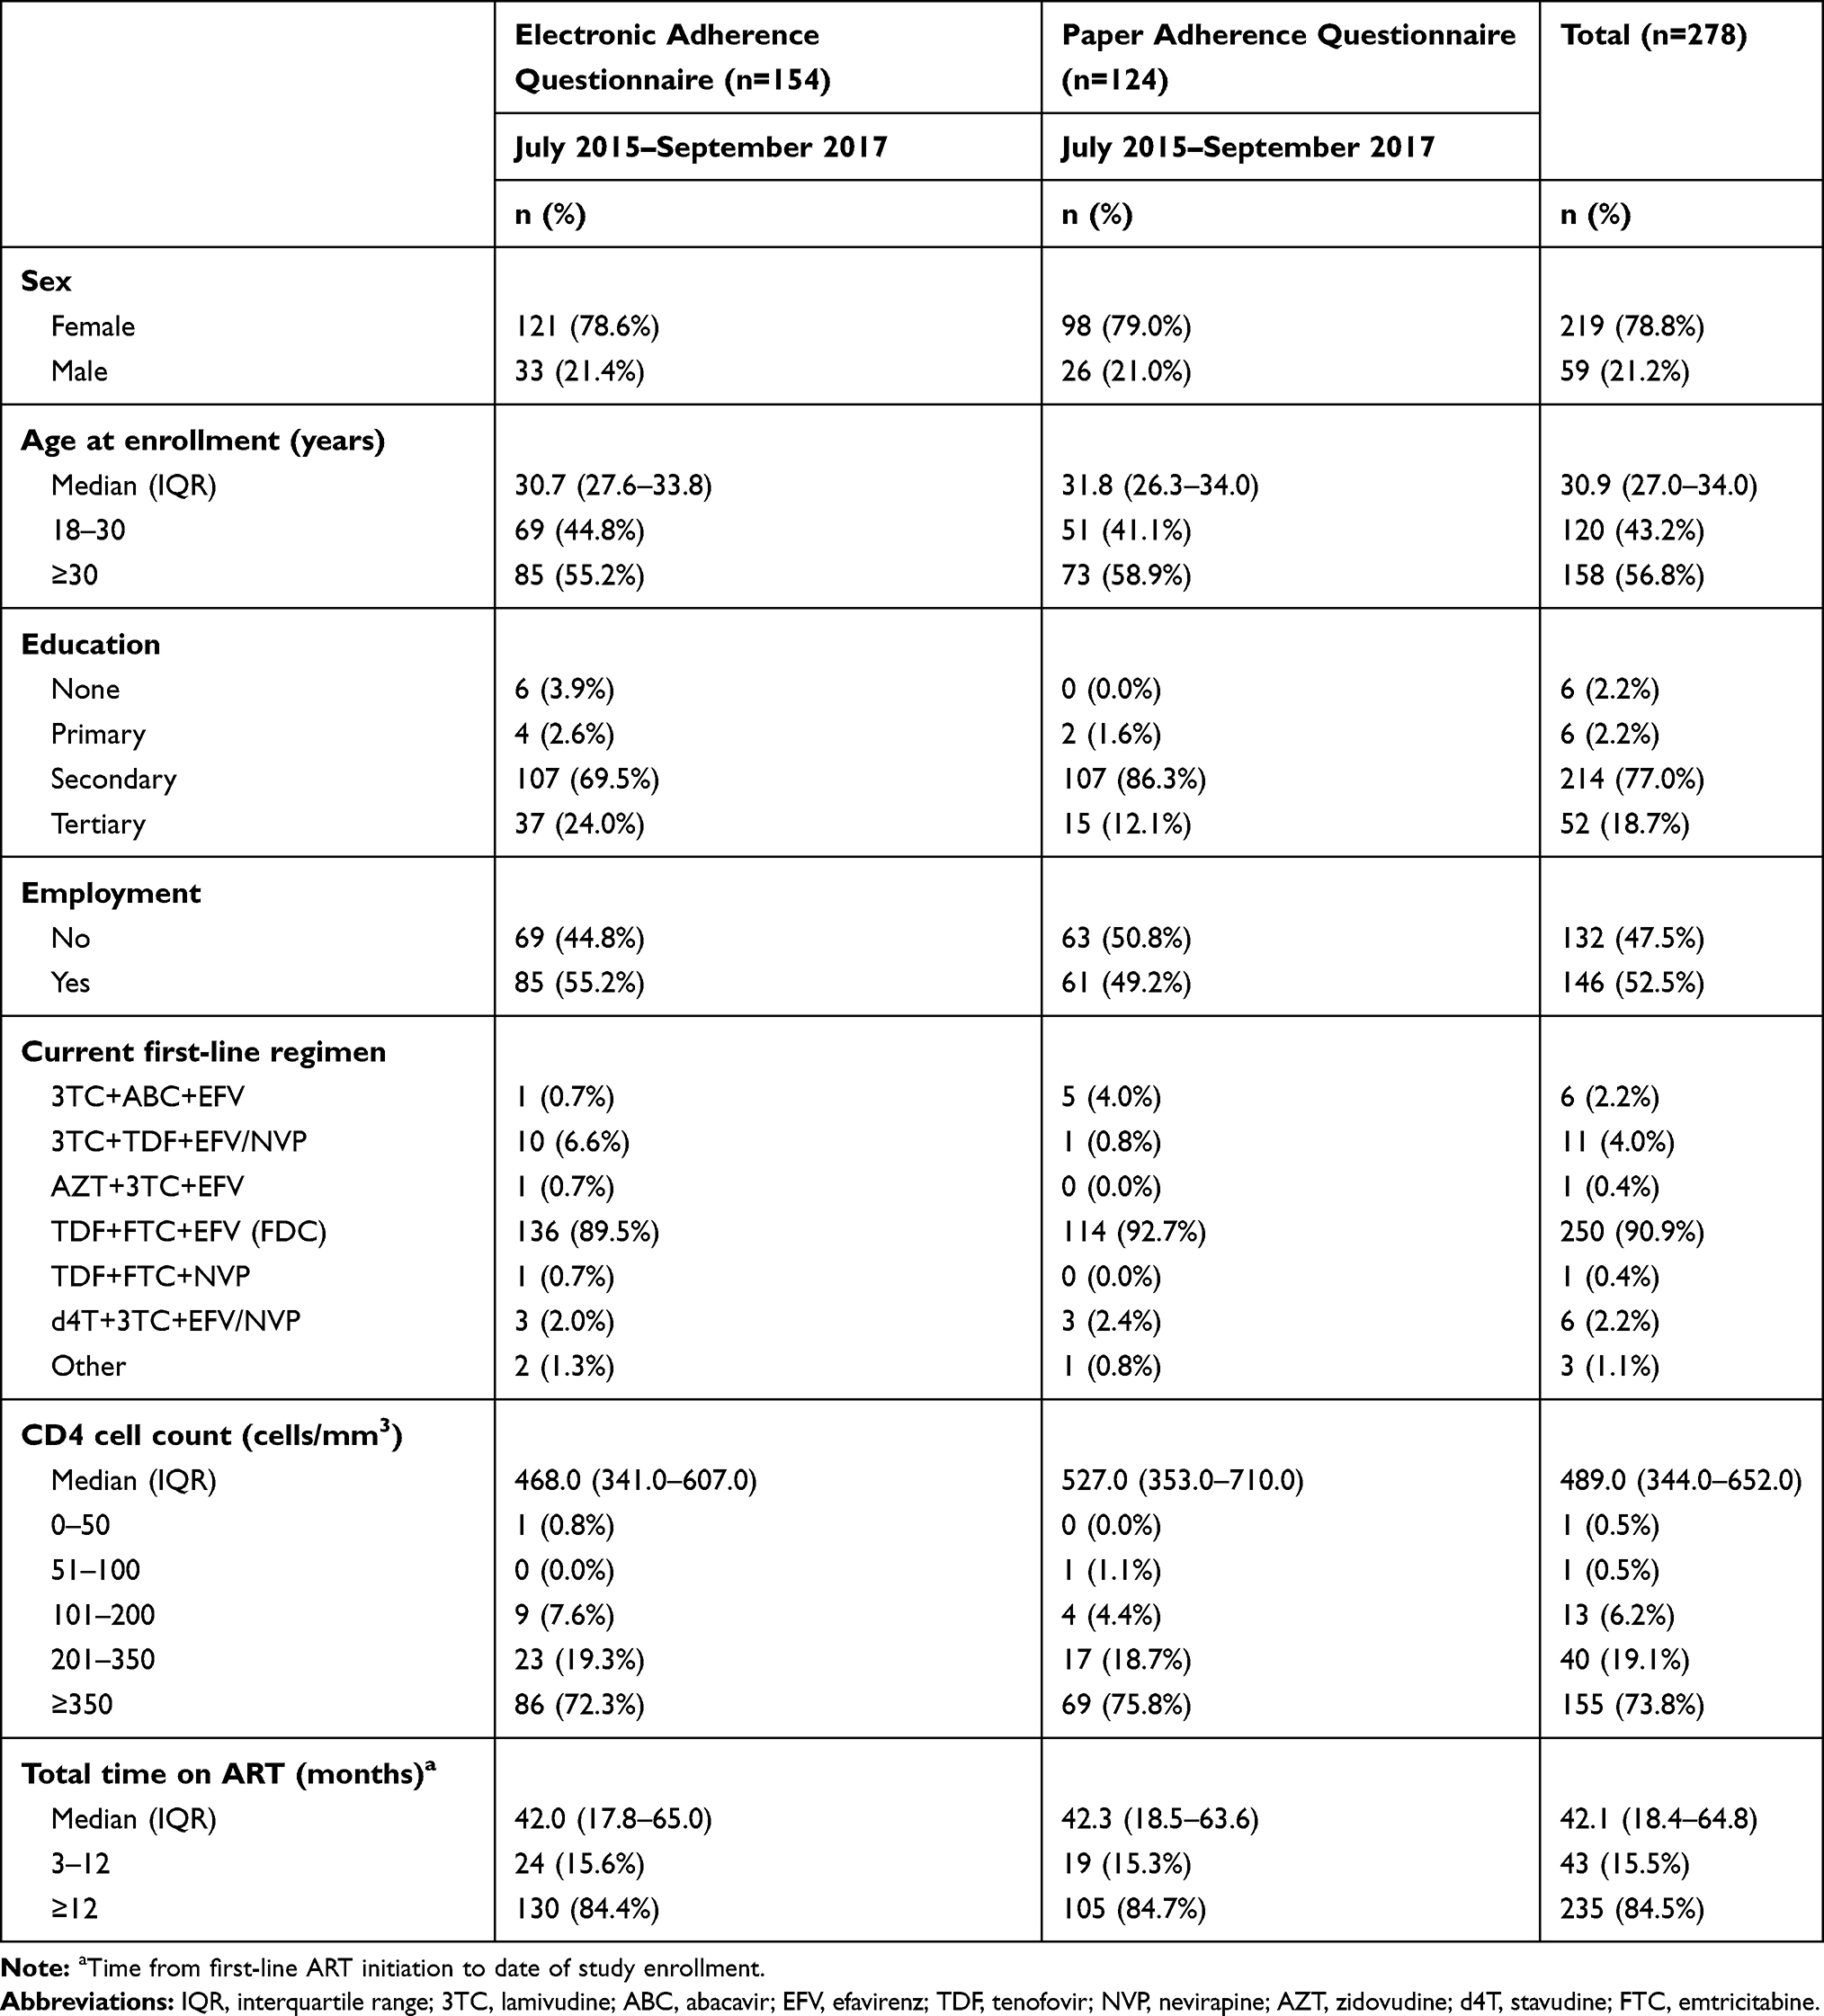 |
Table 1 Demographic and Clinical Characteristics of Patients Completing Either a Self-Administered Electronic or Interviewer Administered Paper-Adherence Questionnaire at Study Enrollment (N=278) |
Diagnostic Accuracy of Adherence Tools
Detectable Viral Load (≥1000 copies/mL) (Standard of Care – Late Response)
The proportion of participants with a detectable viral load (≥1000 copies/mL) was similar between participants completing the electronic-adherence questionnaire (7.1%) and paper-adherence questionnaire (7.3%). Overall, 7.2% of all participants (20/278) had a detectable viral load at study enrollment (see Table 2).
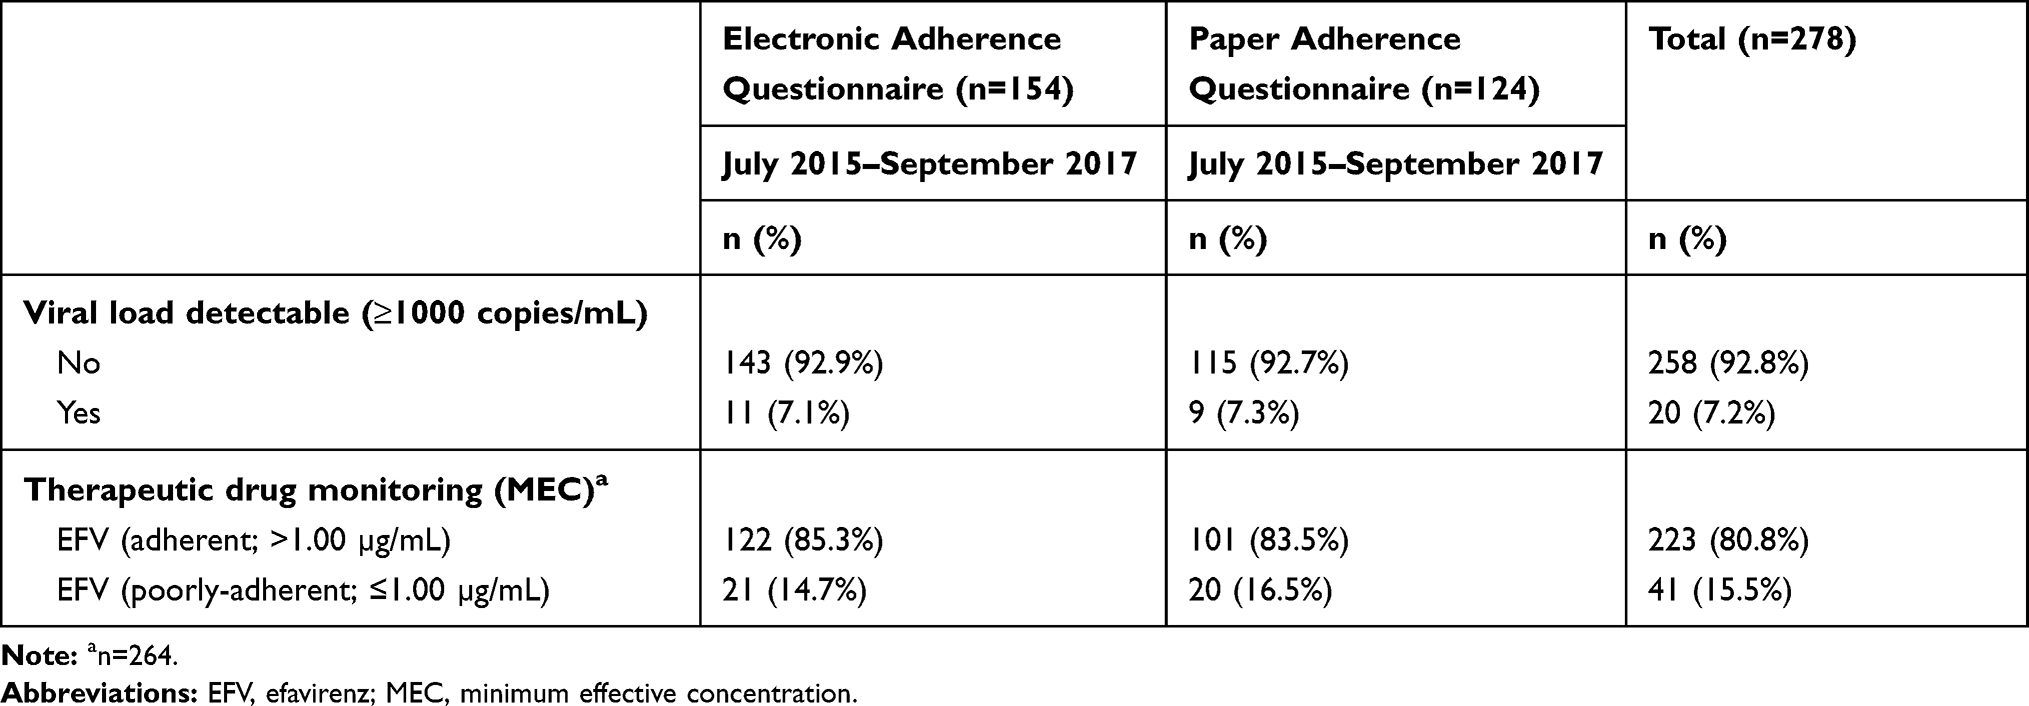 |
Table 2 Measures of ART Adherence Among Patients Completing Either a Self-Administered Electronic or Interviewer Administered Paper Adherence Questionnaire at Study Enrollment (N=278) |
The sensitivity of the NDoH adherence tool in detecting poor adherence defined by a detectable viral load (≥1000 copies/mL) at study enrollment was 50% (95% confidence interval (CI): 28.9–71.1). When stratified by mode of delivery, it was higher among participants completing the electronic-adherence questionnaire (63.6% (95% CI: 33.6–87.2)) compared to those who completed the paper-adherence questionnaire (33.3% (95% CI: 9.3–66.8)). The sensitivity of the SMAQ adherence tool was 80.0% (95% CI: 58.5–93.3). As with the NDoH, this was higher among participants completing the electronic-adherence questionnaire (90.9% (95% CI: 62.7–99.5)) when compared to participants randomized to complete the paper-adherence questionnaire (66.7% (95% CI: 33.2–90.7)). The PPV of the adherence tools were low, with the highest reported for the NDoH tool on an electronic adherence questionnaire (11.7%). In contrast, NPVs ranged from 93.1%–98.5% indicating that those AYAs who report good adherence were in fact truly adherent (see Table 3).
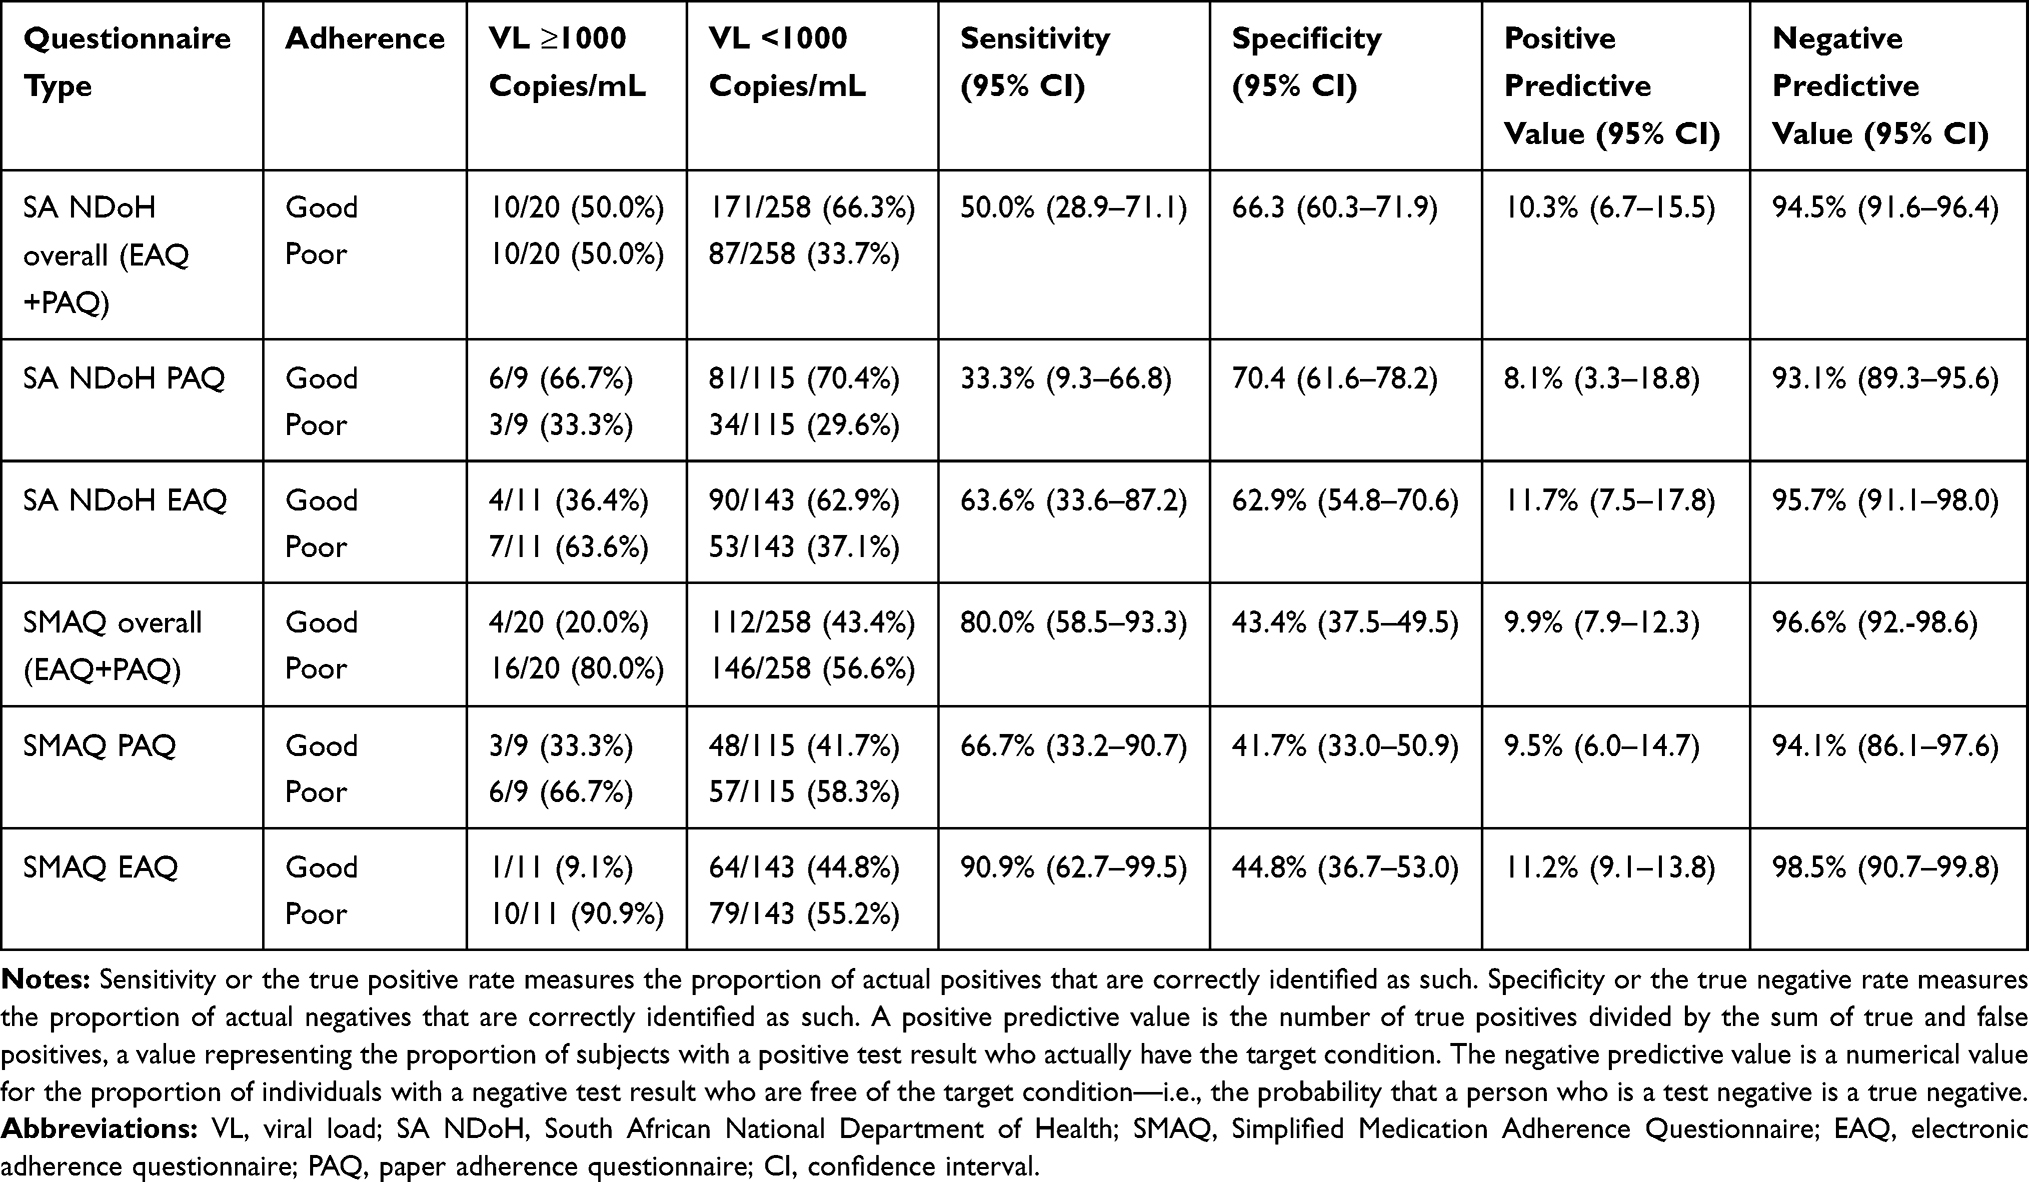 |
Table 3 Sensitivity and Specificity of Questionnaire Type in Detecting Poor Adherence by Viral Load Response at Study Enrollment (N=278) |
Therapeutic Drug Monitoring (Early Response)
A sixth of participants had a sub-optimal drug concentration (EFV ≤1.00 µg/mL) at enrollment (41/264; 15.5%). When disaggregated by mode of delivery, this was similarly reported among participants completing the electronic- and paper-adherence questionnaire (21/143; 14.7% and 20/121; 16.5%, respectively) (see Table 2).
Similar to viral load response, the sensitivity of the NDoH adherence tool in detecting poor adherence confirmed by TDM (EFV ≤1.00 µg/mL) at study enrollment was 43.9% (95% CI: 28.5–60.3). However, when stratified by mode of delivery, it was higher among participants completing the paper-adherence questionnaire (50.0% (95% CI: 27.2–72.8)) than among those who completed the electronic version (38.1% (95% CI: 18.1–61.6)). The sensitivity of the SMAQ was 65.9% (95% CI: 49.4–79.9). As with the NDoH, this was higher among participants completing the paper-adherence questionnaire (75.0% (95% CI: 50.9–91.3)) when compared to those randomized to complete the electronic-adherence questionnaire (57.1% (95% CI: 34.0–78.2)) (see Table 4). When defining poor adherence through TDM, the PPV of the adherence tools were higher than that of viral load, with the highest value observed for the NDoH tool on a paper-adherence questionnaire (28.6%). Similar to viral load monitoring, NPVs were high when defining poor adherence through TDM, ranging from 85.3%–90.0% (see Table 4).
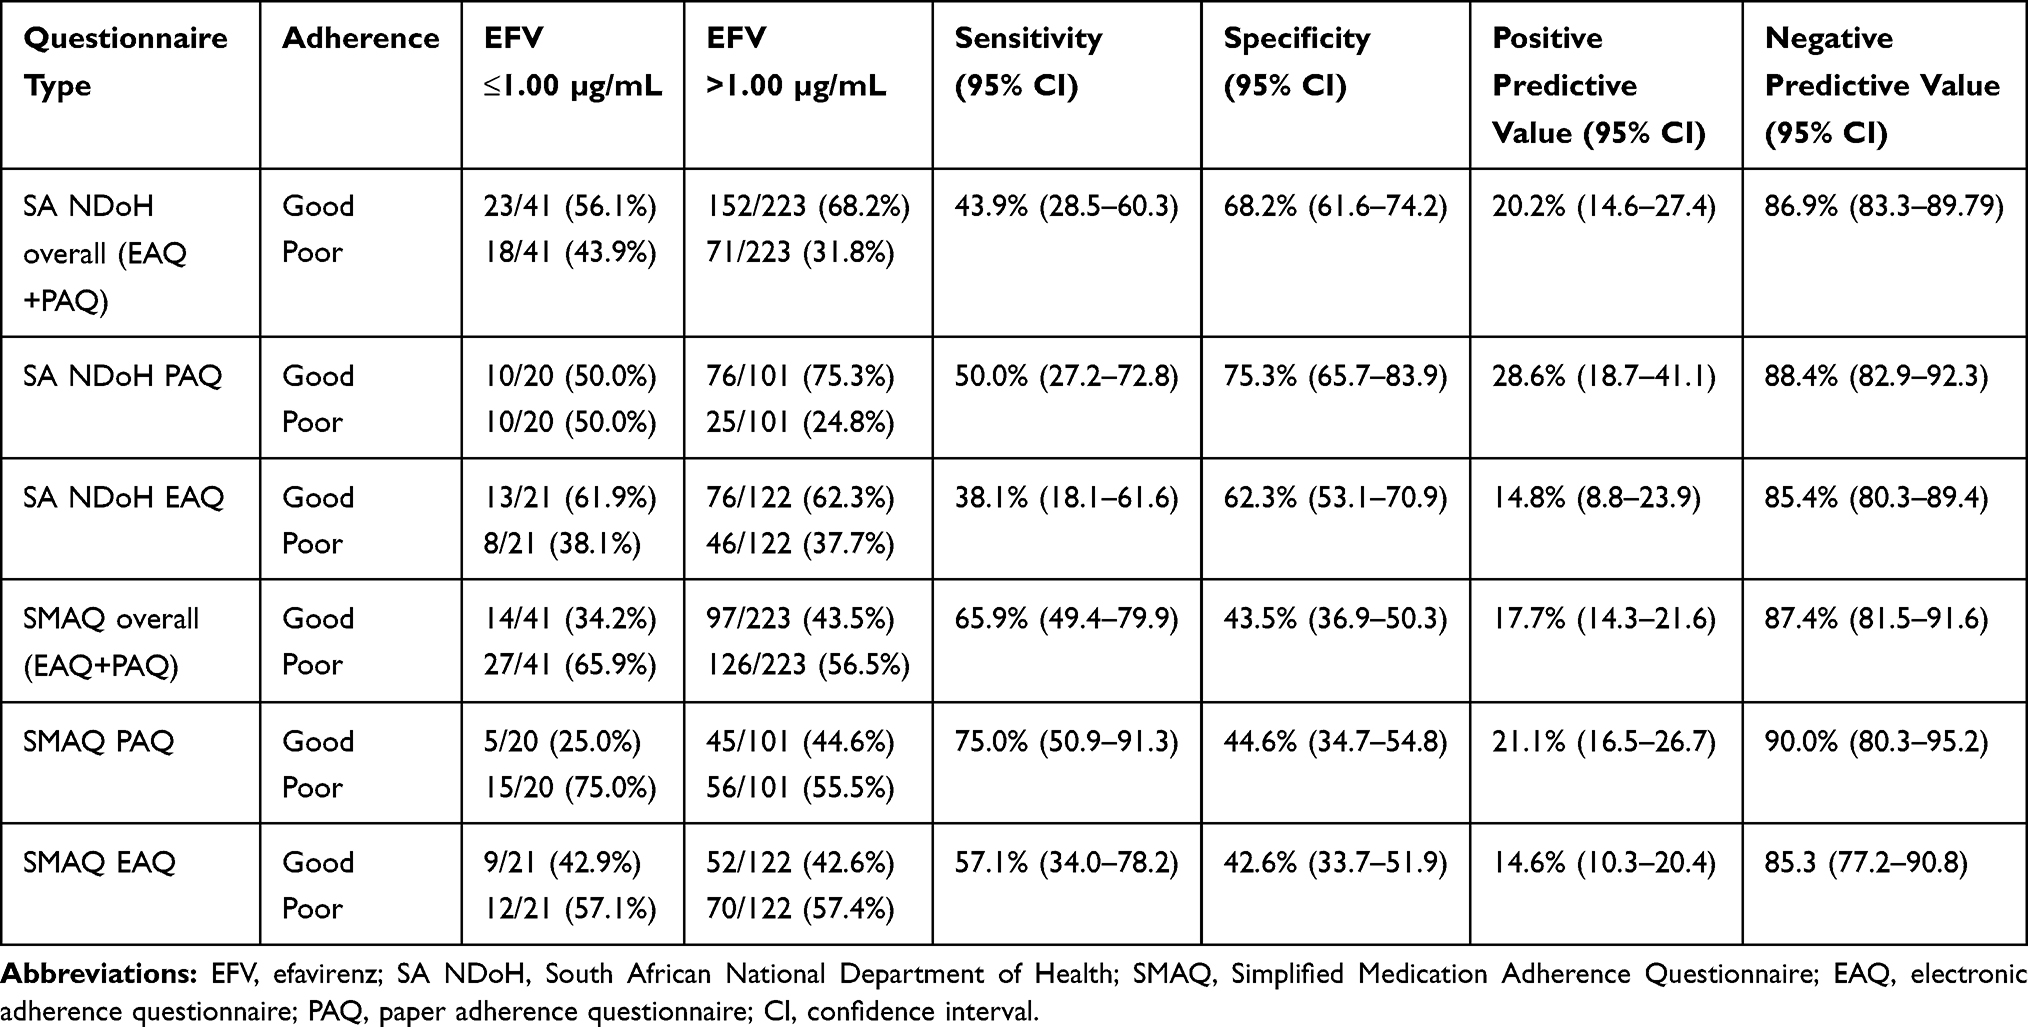 |
Table 4 Sensitivity and Specificity of Questionnaire Type in Detecting Poor Adherence by Therapeutic Drug Monitoring Response at Study Enrollment (N=264) |
Measures of Agreement – Viral Load Response by Therapeutic Drug Monitoring
For the majority of participants (80.3%), there was an agreement between the viral load measurement and TDM result. A total of 4/264 (1.5%) participants reported a detectable viral load (≥1000 copies/mL) and sub-optimal drug concentrations measured by EFV ≤1.0 µg/mL. In contrast, majority of participants (208/264; 78.8%) had both an undetectable viral load (<1000 copies/mL) as well as drug concentration levels above the minimum threshold (EFV >1.0 µg/mL). Under one-fifth of participants reported an undetectable viral load and sub-optimal drug concentrations (37/264; 14.0%) or a detectable viral load but sufficient drug concentrations (15/264; 5.7%) (see Table 5).
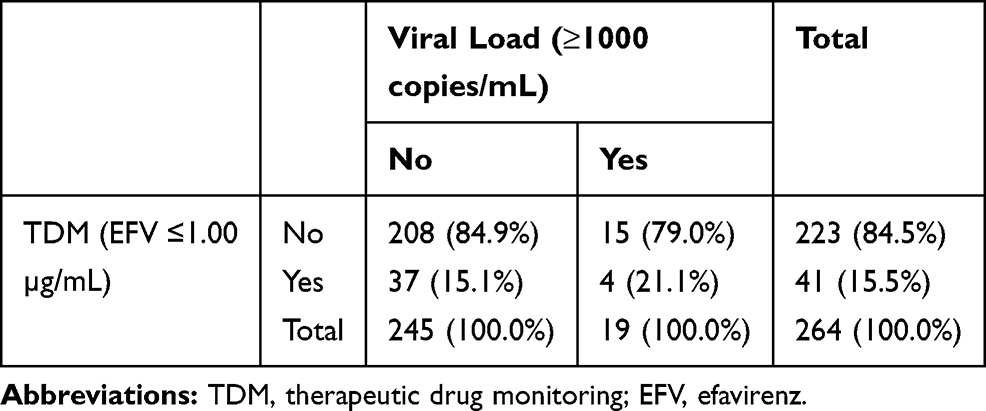 |
Table 5 Viral Load Response by Therapeutic Drug Monitoring (N=264) (N, Col %) |
Feasibility of Mode of Delivery
Majority of participants strongly agreed/agreed that they would prefer a self-administered questionnaire over a counsellor/social worker administered one (67.5% completing the electronic- vs 71.0% completing the paper-adherence questionnaire). A total of 125 (81.2%) of those completing the electronic- and 64 (51.6%) of paper-adherence questionnaire participants strongly agreed/agreed that they would prefer an electronic questionnaire on a tablet/smartphone instead of a paper form. Additionally, 139 (90.3%) of electronic- and 55 (71.4%) of paper-adherence questionnaire participants were comfortable using a smartphone/tablet. With regard to confidentially, less than half of electronic-adherence questionnaire participants (67; 43.5%) and 63 (50.8%) of paper-adherence questionnaire participants had concerns surrounding the confidentially of their information on a smartphone/tablet (see Table 6).
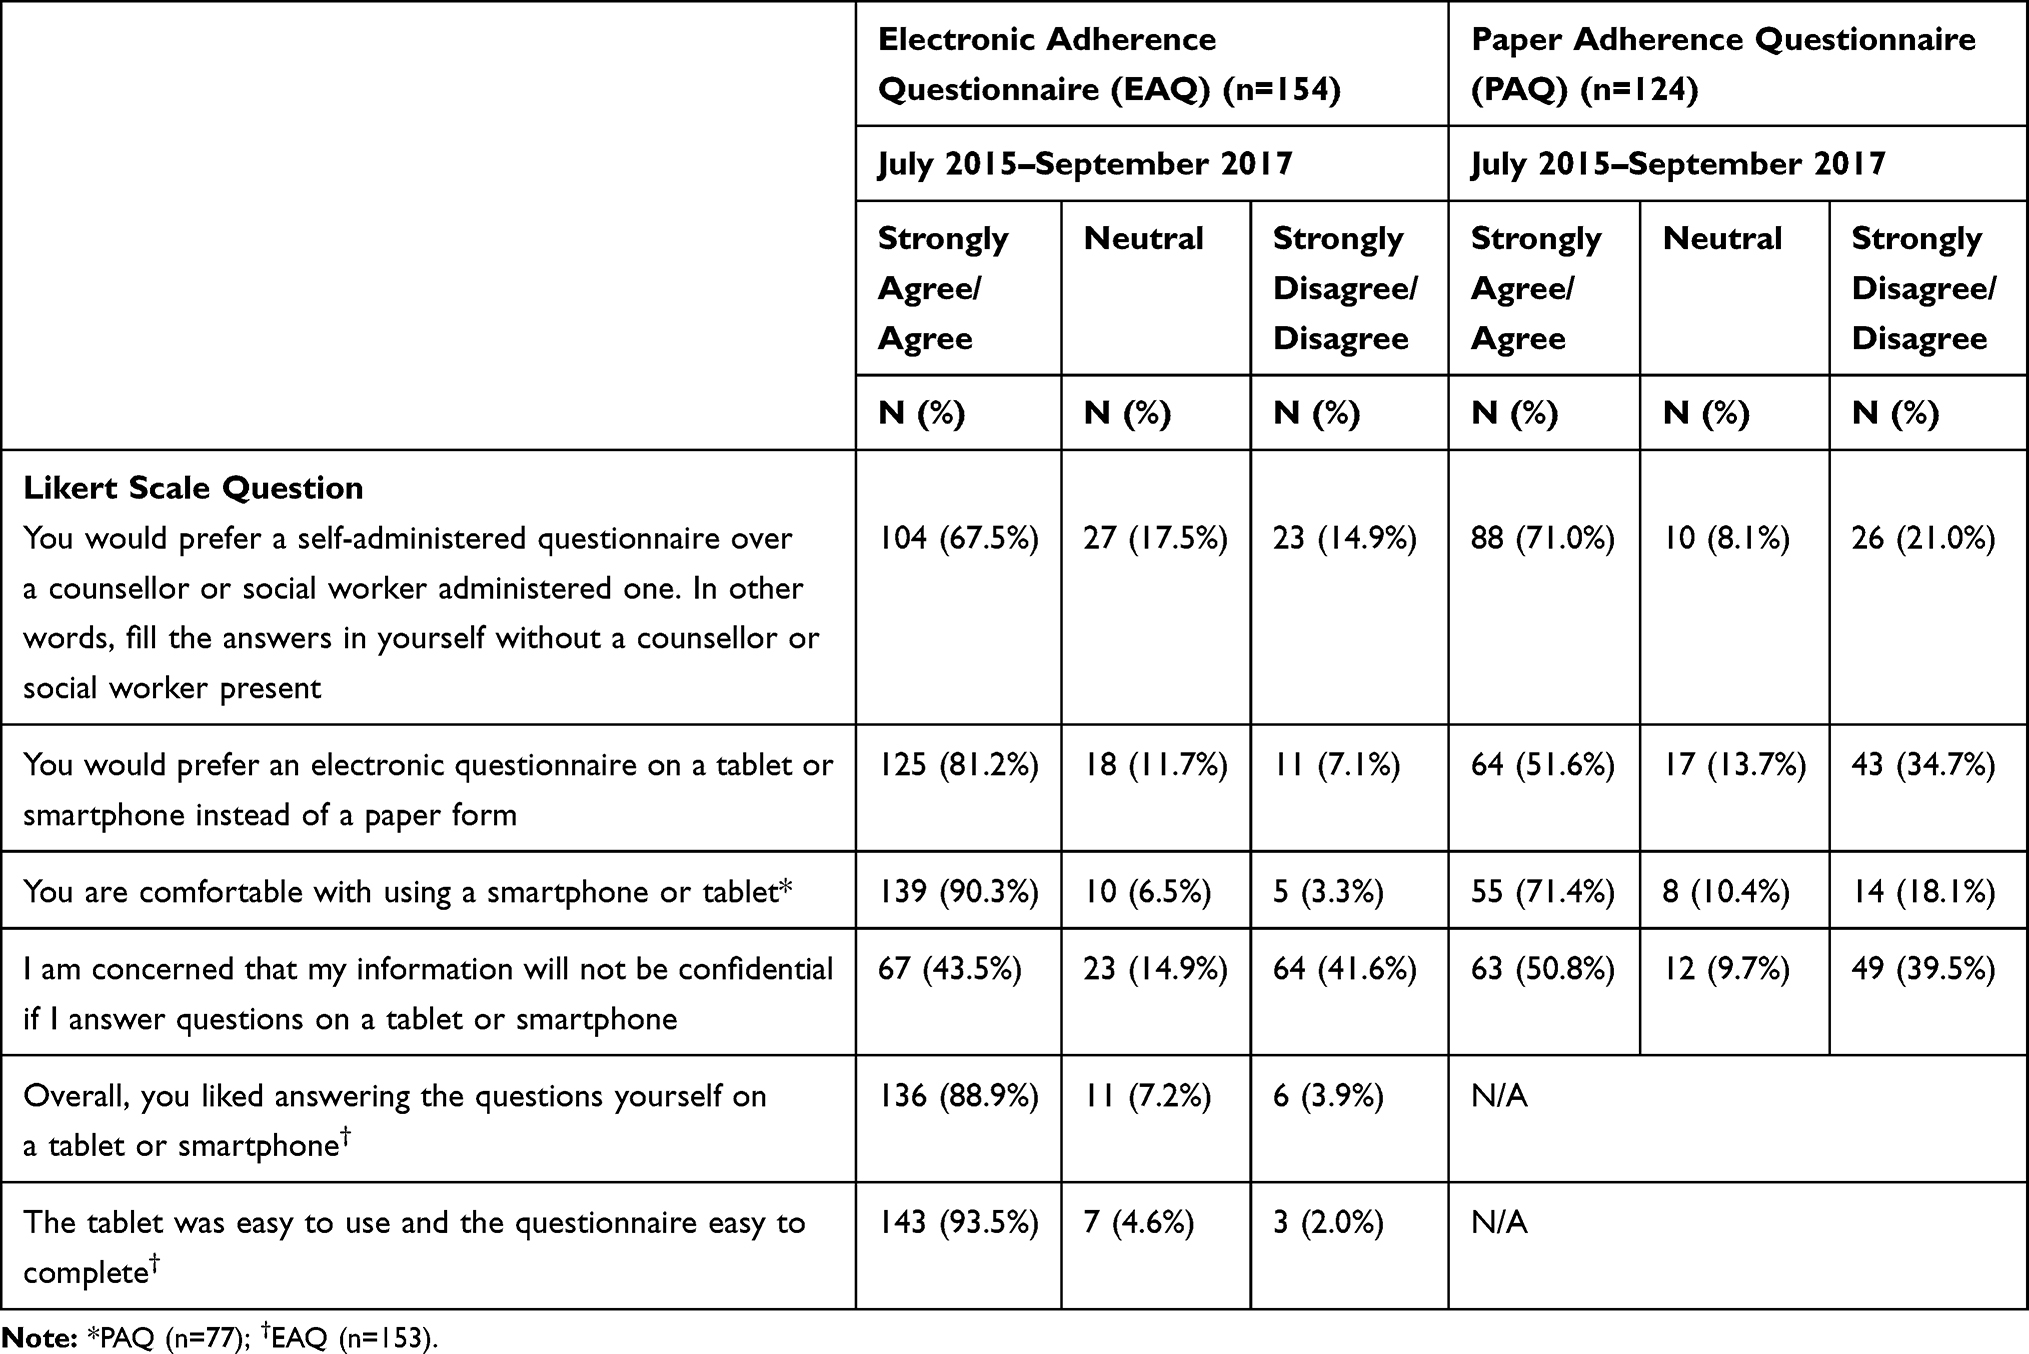 |
Table 6 Feasibility of Mode of Adherence Measurement by Patients Completing Either a Self-Administered Electronic or Interviewer Administered Paper-Adherence Questionnaire at Study Enrollment (N=278) |
When asked if they would prefer a self-administered adherence questionnaire (in the absence of a counsellor/social worker), participants completing the electronic-adherence questionnaire said, “Yes because it makes me … as honest as possible” (PID 15229, Female, 24y) and “On my own because whenever you speak to a counsellor or nurse you … feel as if you are being judged for not adhering” (PID 15045, Female, 29y). In contrast, some patients also raised concerns of confidentially and misunderstanding saying, “I don’t feel my information is safe on the iPad [tablet], I feel it’s good when I speak to someone” (PID 15214, Male, 33y) and, “No because I needed clarity with some of the questions” (PID 15120, Male, 35y). Patients completing the paper-adherence questionnaire said, “Either way, but if there’s something I don’t understand at least I’ll have someone to explain it to me when being asked by a counsellor” (PID 15048, Female, 30y), “ … I like to interact to a social worker or counsellors who inform me with positive views” (PID 15095, Female, 25y) and, “As long as the person is friendly it’s okay unless the person is not friendly then I would say I prefer to answer on my own” (PID 15004, Female, 29y).
When patients who completed the electronic-adherence questionnaire were asked about their likes of such an adherence measurement tool, the relative ease of use, convenience of typing, flexibility in changing responses and quickness of the tool were cited as primary reasons. In contrast, dislikes included the absence of someone to help clarify misunderstanding and the electronic tablet running out of power while being used (see Table 7).
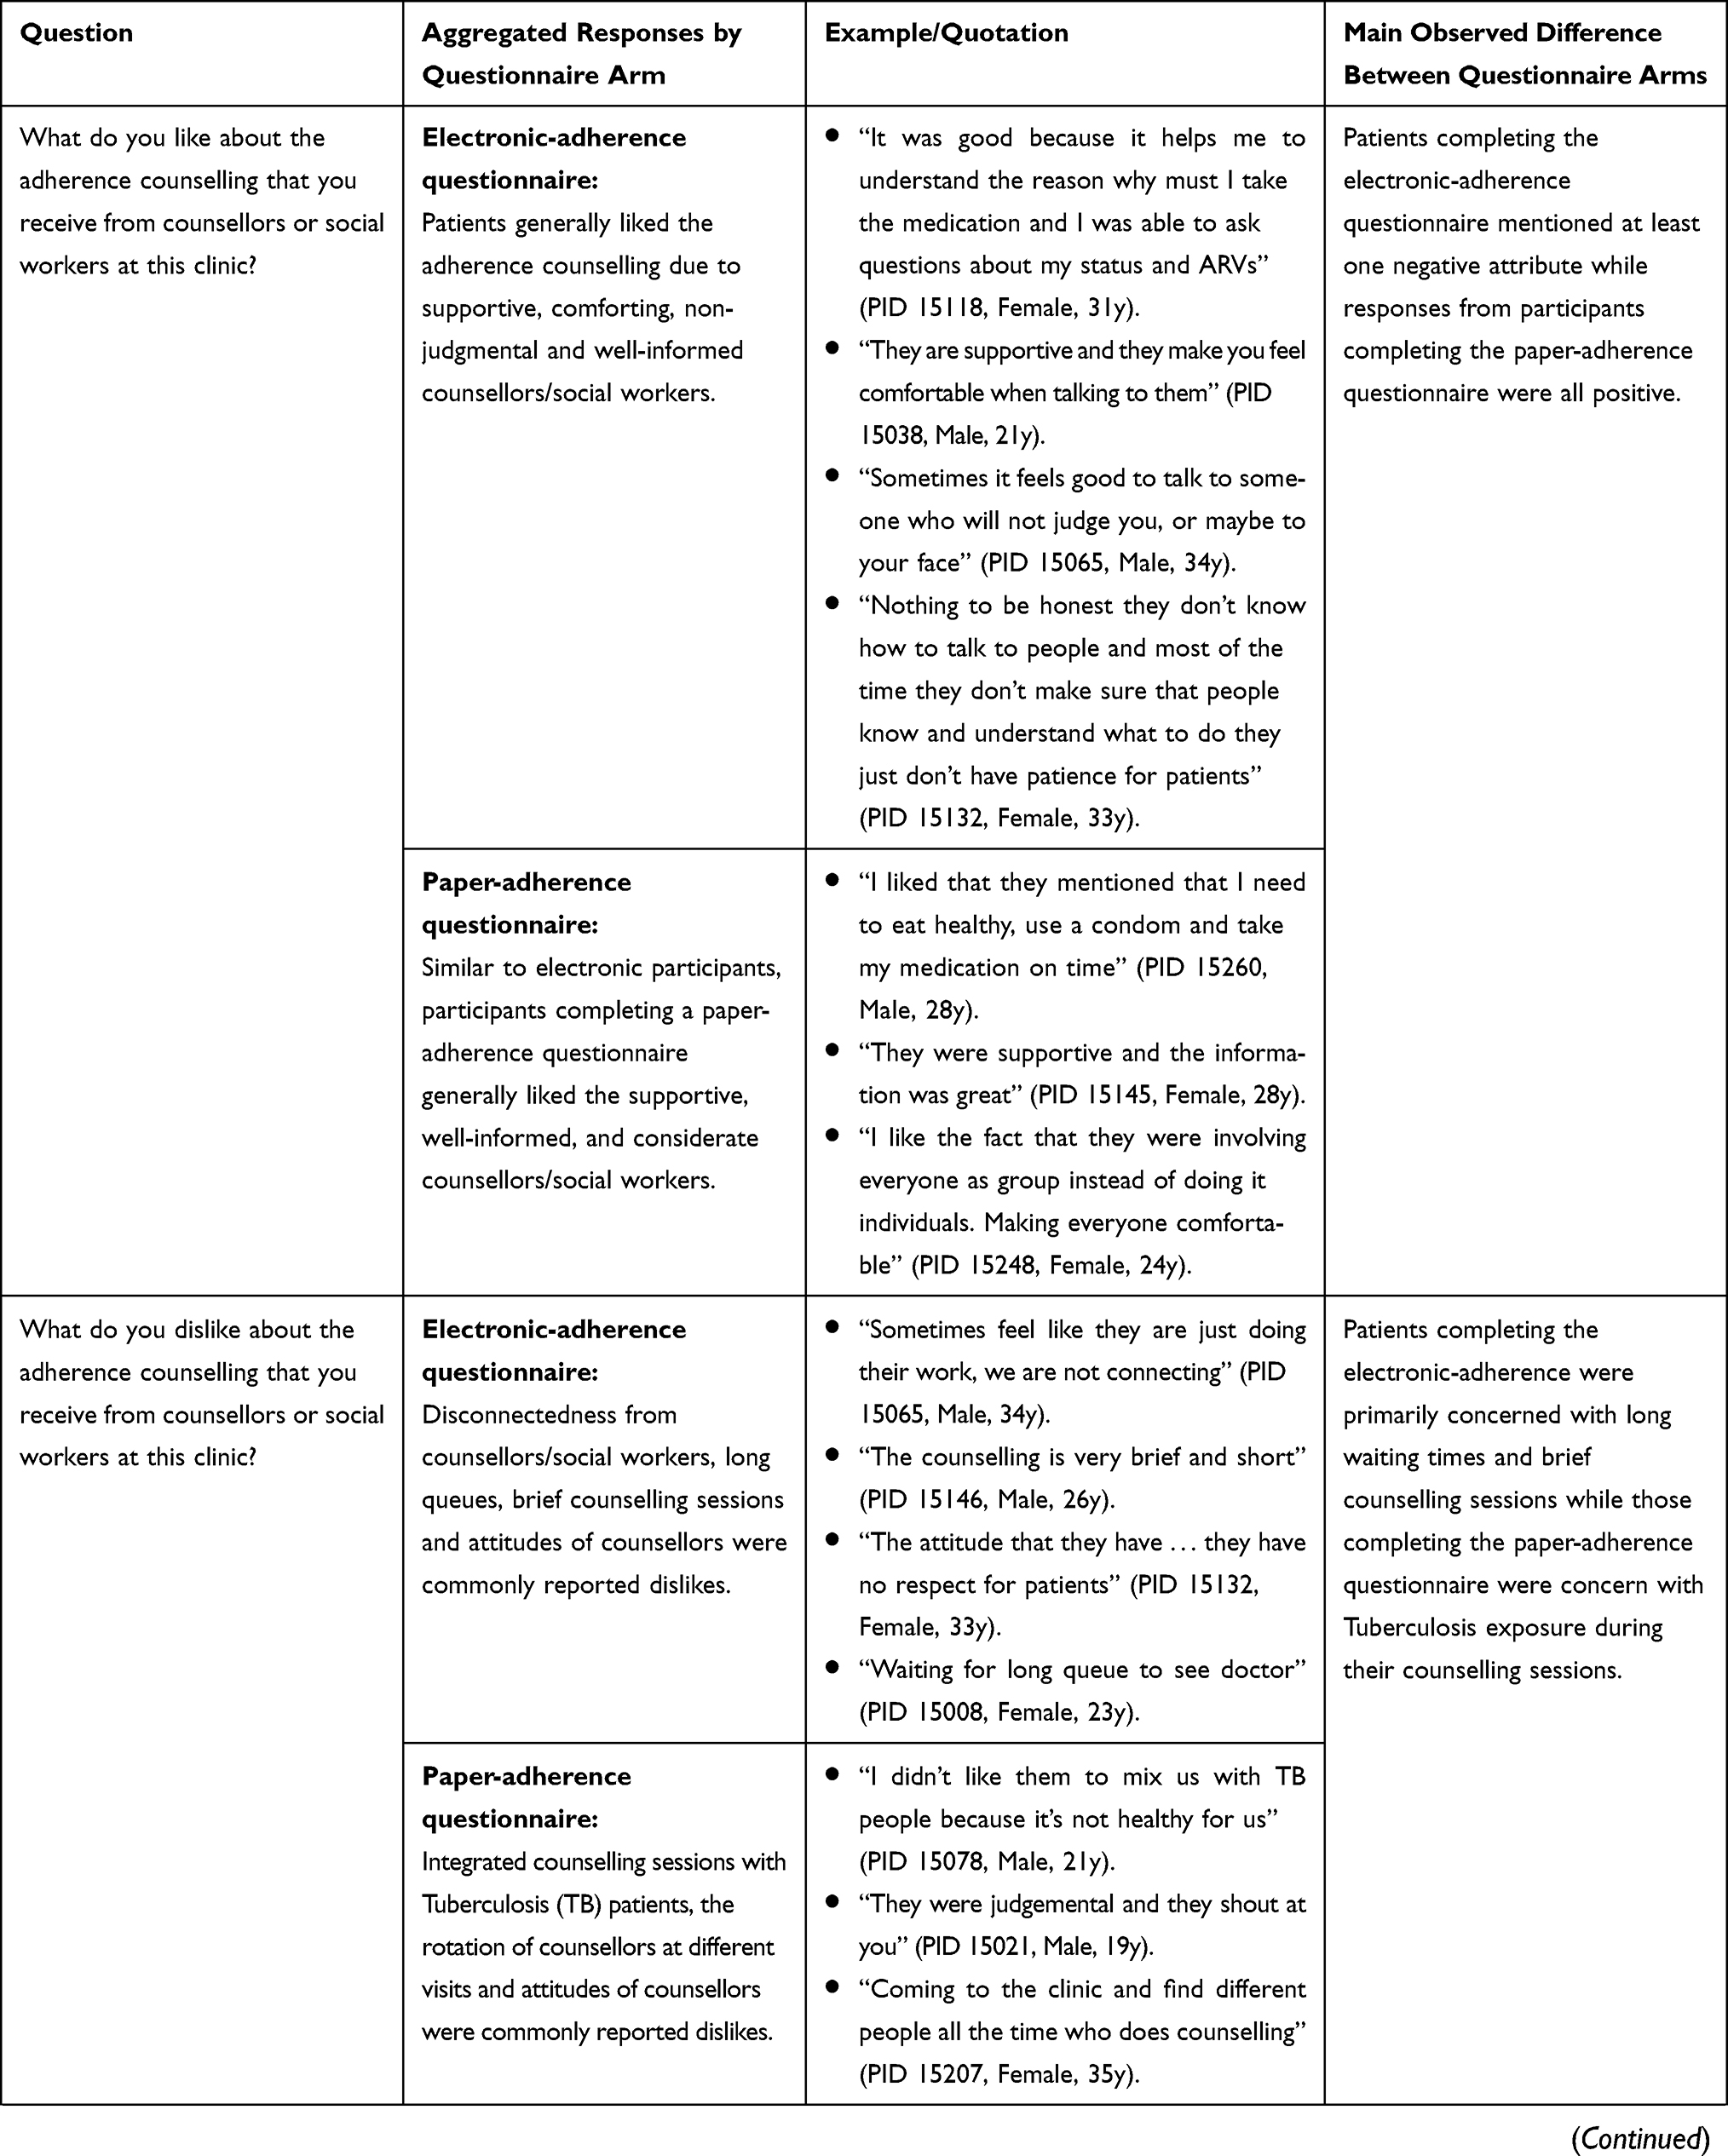 | 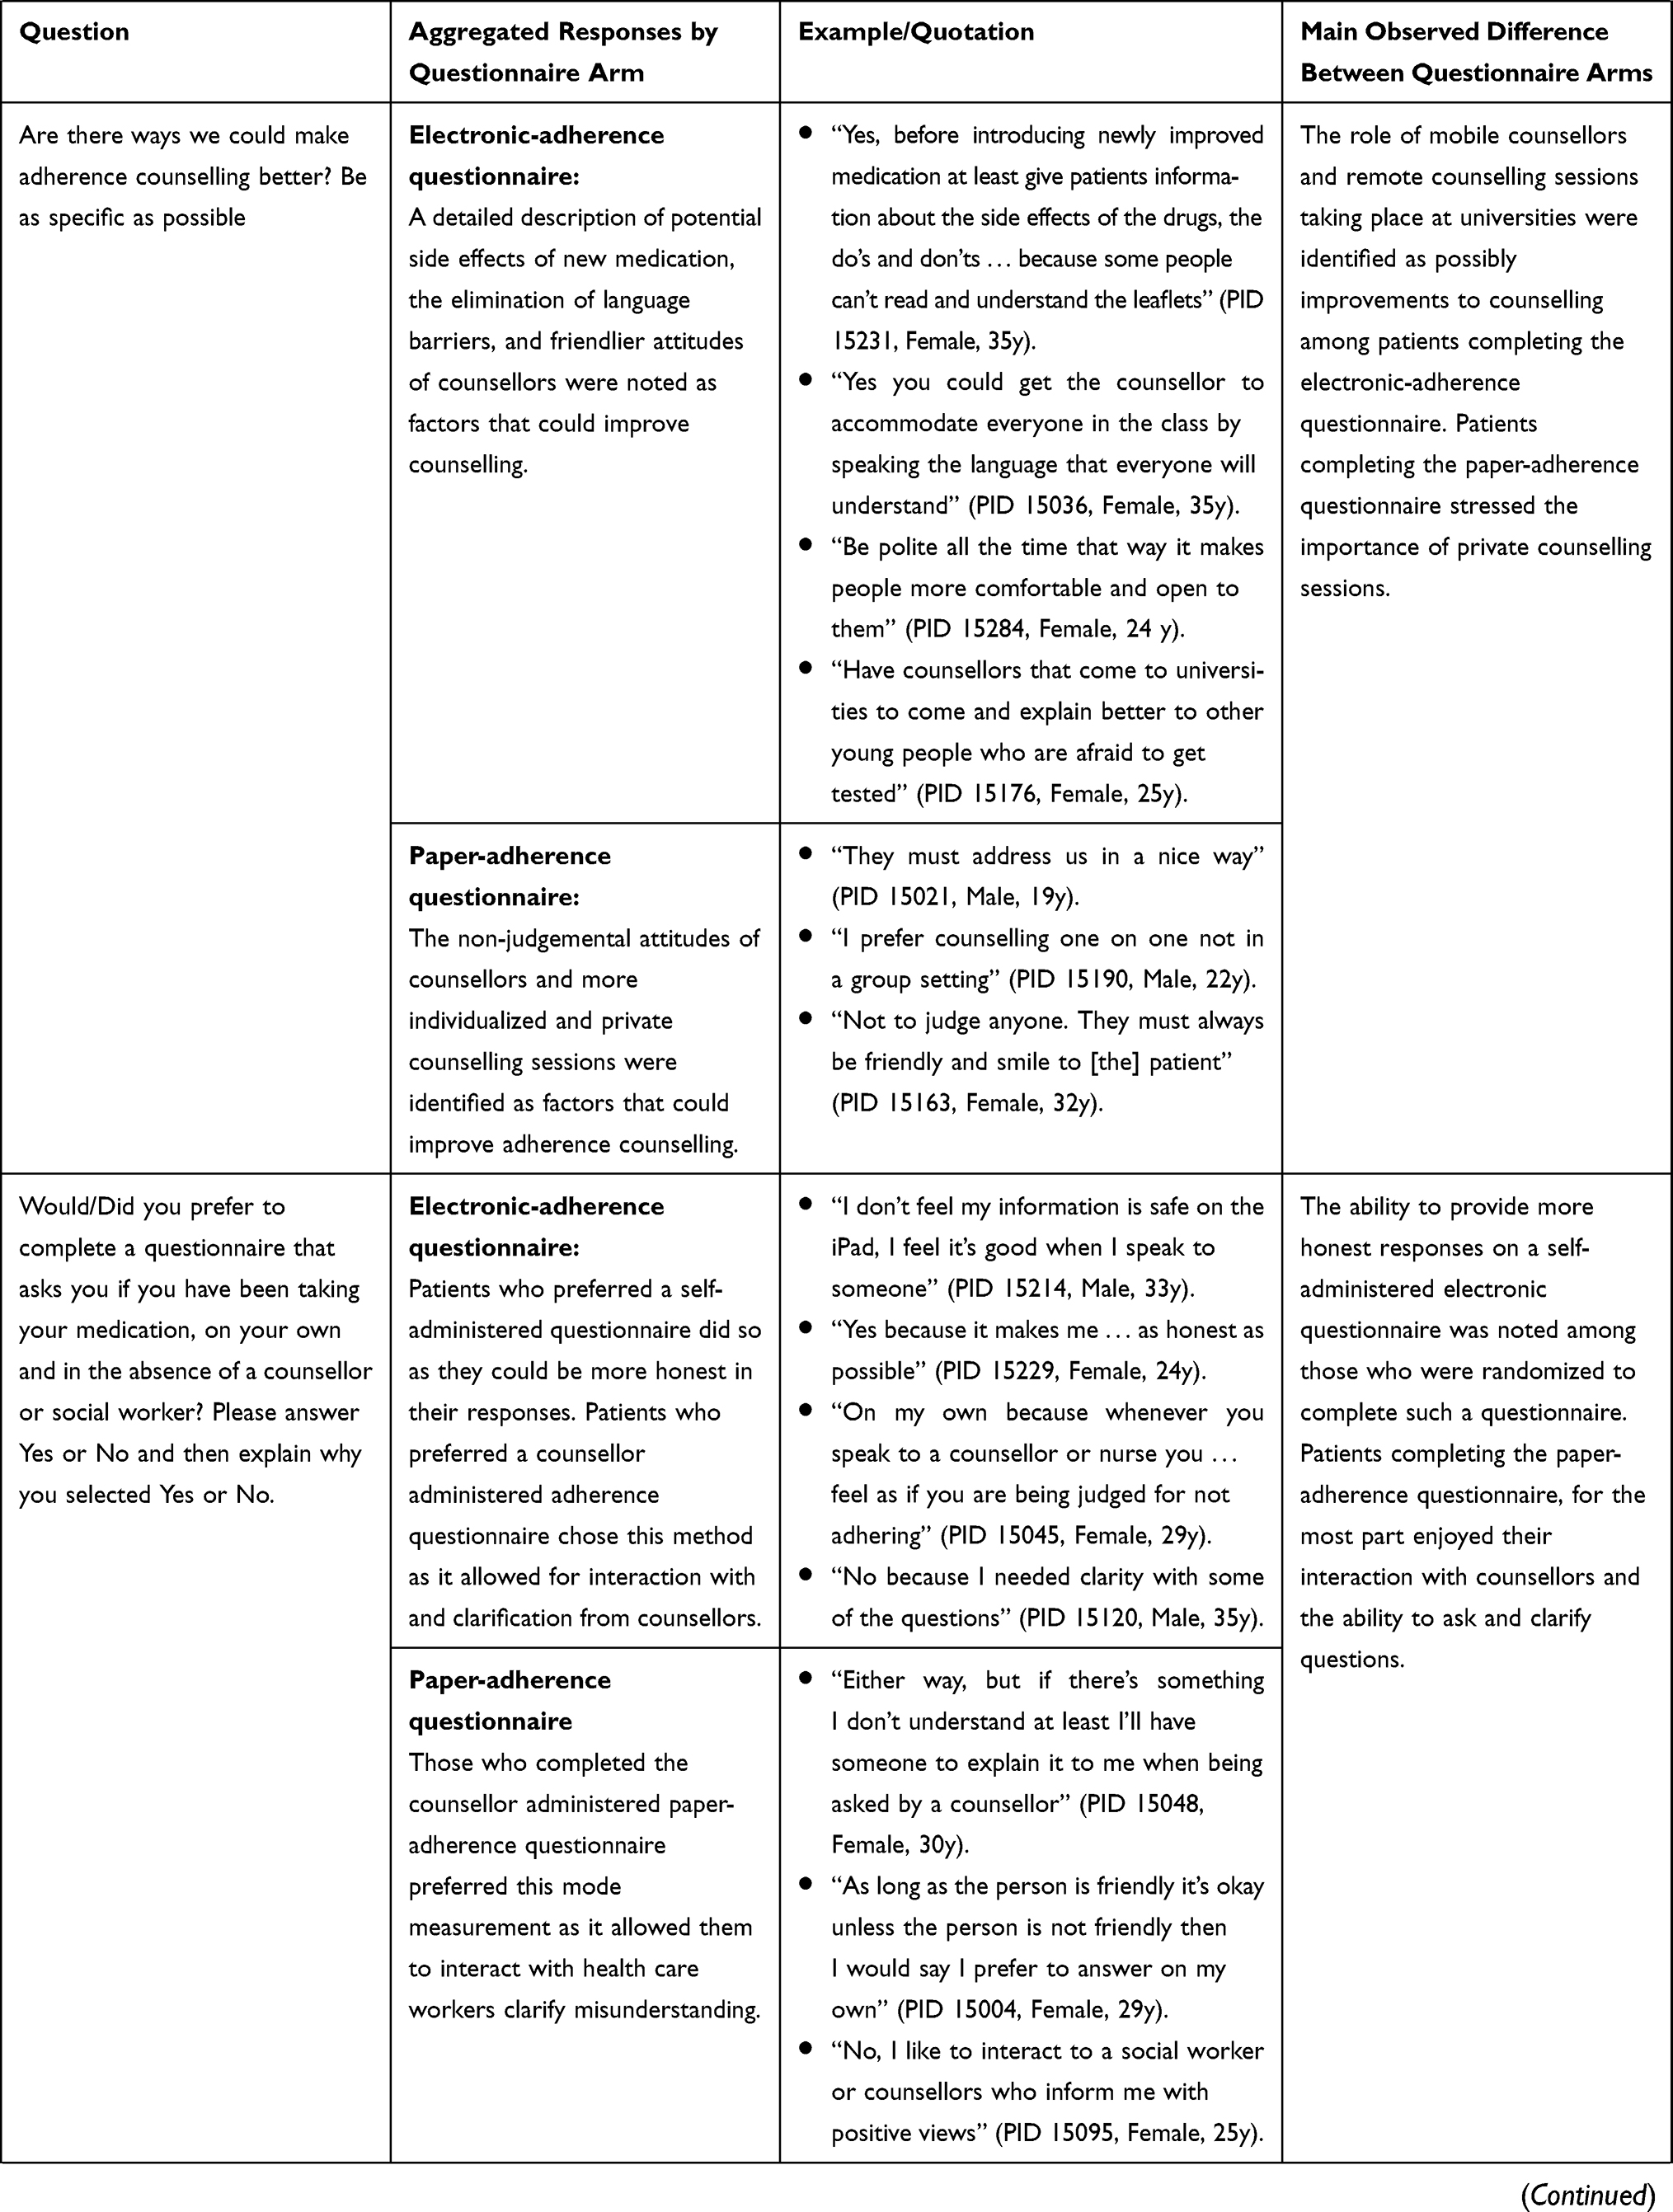 | 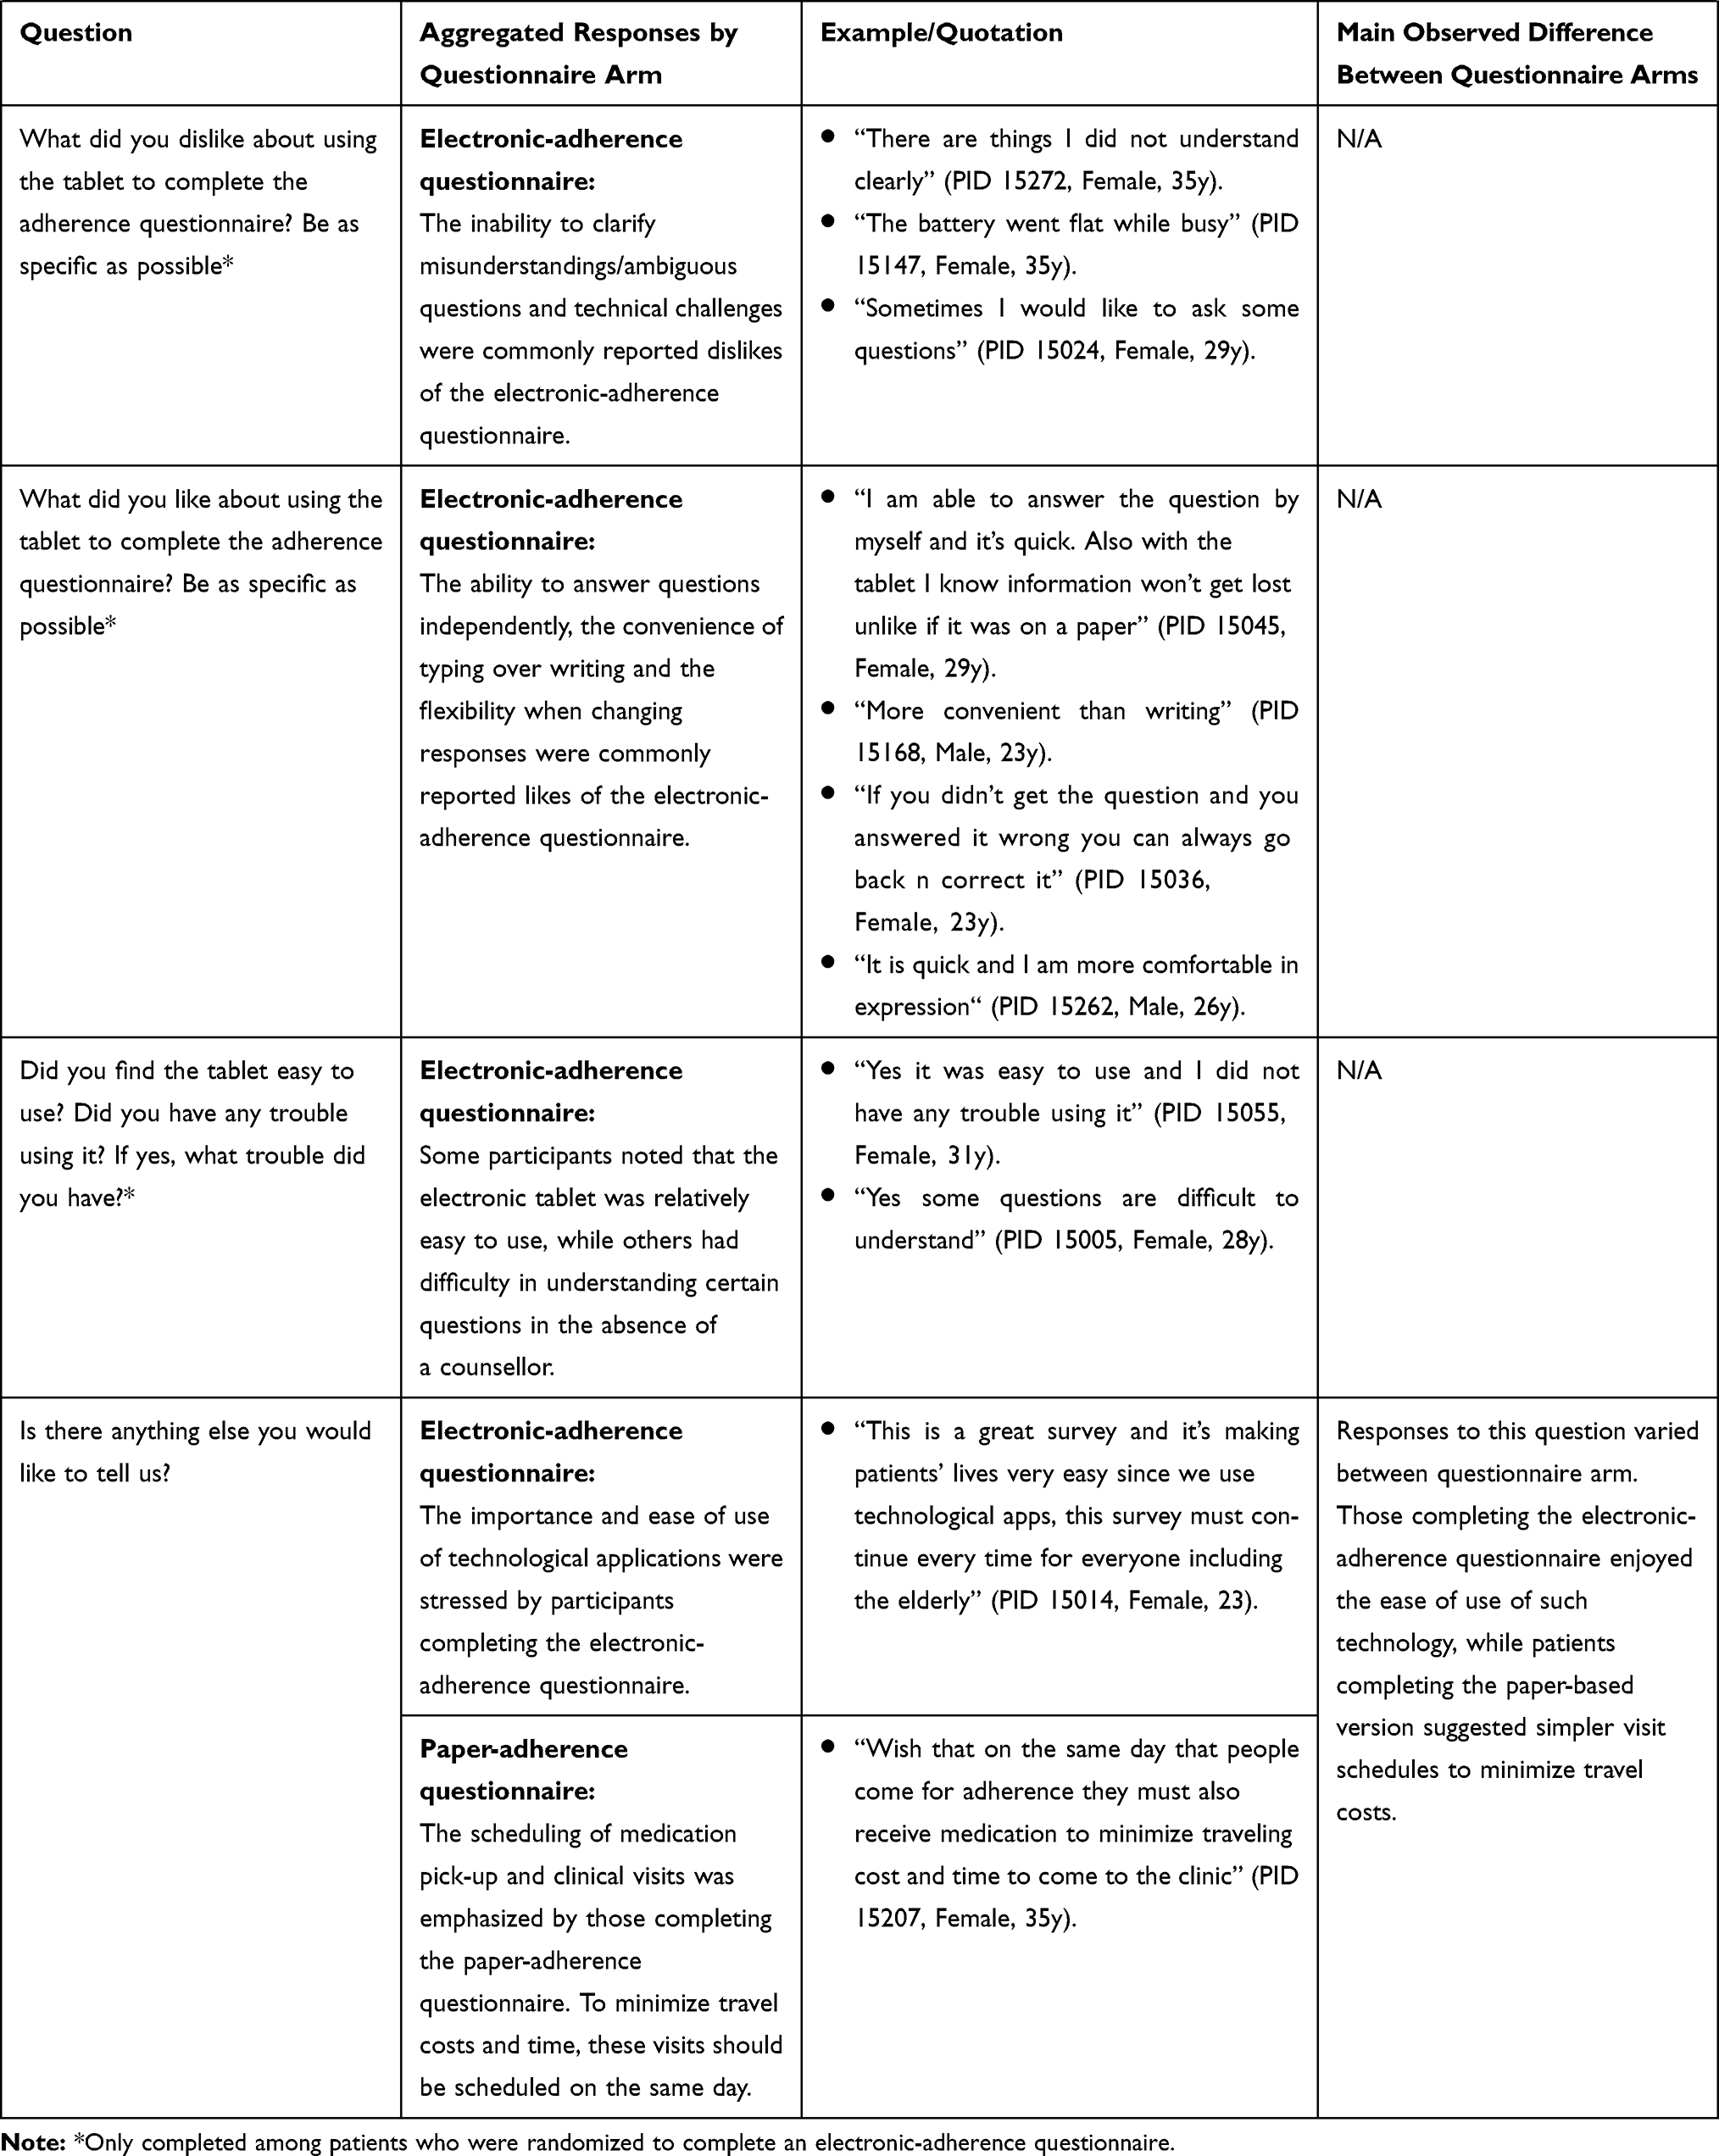 |
Table 7 Qualitative Responses Assessing the Feasibility of a Self-Administered Electronic-Adherence Questionnaire vs Interviewer Administered Paper-Adherence Questionnaire |
Discussion
Due to the unique challenges faced by adolescents and young adults in resource-limited settings in achieving optimal ART adherence and subsequently favorable HIV-treatment outcomes, we set out to explore the accuracy and feasibility of an electronic ART adherence questionnaire in detecting poor adherence. We compare the diagnostic accuracy of a self-administered electronic-adherence questionnaire vs standard of care patient-interviewer administered paper-adherence questionnaire to identify poor adherence defined 1) as a detectable viral load (≥1000 copies/mL) and 2) as ART blood drug levels lower than the minimum effective concentration measured by TDM (EFV ≤1.00 µg/mL). To our knowledge, no other study in South Africa or Africa has assessed the diagnostic accuracy of different adherence delivery modes (electronic vs paper) across two standard adherence tools (NDoH and SMAQ) to identify poor adherence, defined by either viral load monitoring or TDM, among adolescents and young adults.
Although in widespread use in RLS, particularly due to its feasibility, self-reports are prone to distortion when assessing socially undesirable topics/outcomes.19,38 This method of assessment has commonly led to the under-reporting of behaviours in contrast to social norms and regulations and the over-reporting of prescribed activities.19 To increase the validity of self-reports of sensitive issues, computerized/electronic modes of delivery have been suggested to increase respondents’ anonymity, consequently resulting in more truthful responses.39 Moreover, elimination of the patient-interviewer from respective assessments has been repeatedly linked to increases in disclosure of sensitive behaviours and reductions in social desirability responses.40
In this study, the electronic-adherence questionnaire (completed independently, with minimal contact with patient interviewers) (SMAQ Se: 90.9%; 95% CI: 62.7–99.5; NDoH Se: 63.6%; 95% CI: 33.6–87.2) had a higher sensitivity in detecting poor adherence by a detectable viral load (≥1000 copies/mL) when compared to the interviewer-administered paper-adherence questionnaire (SMAQ Se: 66.7%; 95% CI: 33.2–90.7; NDoH Se: 33.3%; 95% CI: 9.3–66.8) (although estimates prove imprecise). Participants completing the electronic-adherence questionnaire may then report non-prescribed/undesirable behaviours such as poor adherence more truthfully whilst independently completing an adherence questionnaire, than those being formally interviewed by a patient-interviewer. Similarly, when asked about their preferences of electronic- vs paper-adherence questionnaires, some participants mentioned that an electronic-adherence questionnaire allows them to be as honest as possible in their responses and not have to face possible judgment from counsellors.
However, the use of viral load monitoring may not provide an accurate account of adherence due to the potential lag between periods of non-adherence and the consequential increase in viral load. In a study examining the timing of virologic rebound after treatment cessation, 54% of participants on a non-nucleoside reverse transcriptase inhibitor (NNRTI)-based regimen remained virally suppressed four weeks after treatment interruption (<1000 copies/mL).41 As participants in this study were on a first-line NNRTI-based ART regimen at study enrollment, the effects of poor adherence to ART, let alone treatment cessation may not necessarily translate into detectable viral load in the weeks following the interruption/period of non-adherence. Viral load then provides a late detection of proximal adherence (importantly, only among those without confirmed drug resistance). A more robust measure of adherence may take the form of TDM which measures blood drug concentration levels. In this study, TDM detected a greater level of poor adherence when compared to viral load monitoring (15.5% vs 7.2%, respectively). TDM provides a more real-time estimate of actual drug concentration and not a measure of the effects (viral load) of sustained sub-optimal drug concentrations/drug resistance. Furthermore, TDM ensures a more accurate account of adherence due to the inadvertent detection of potential drug resistance (i.e., patients who report optimal adherence and whose TDM results detect optimal blood drug concentrations, but whose viral load is in the detectable range).
When assessing the sensitivity of modes of delivery by TDM (EFV ≤1.00 µg/mL), the paper-adherence questionnaire (SMAQ Se: 75.0%; 95% CI: 50.9–91.3; NDoH Se: 50.0%; 95% CI: 27.2–72.8) had a higher sensitivity in detecting poor adherence when compared to the self-administered electronic-adherence questionnaire (SMAQ Se: 57.1%; 95% CI: 34.0–78.2; NDoH Se: 38.1%; 95% CI: 18.1–61.6). Similarly, the positive predictive value of mode of delivery (electronic vs paper) defined by TDM was more than double that of poor adherence defined by detectable viral load (range 14.6%–28.6% vs 8.1%–11.7%, respectively). Unlike the self-administered electronic-adherence questionnaire, patients completing a paper-adherence questionnaire were formally interviewed. Contrary to reports on the effects of social desirability bias/response bias, the presence of the interviewer may then elicit more accurate reporting of adherence as patients may feel more accountable when engaging with health care workers. Additionally, the presence of the interviewer may also allow for the clarification of adherence questions compared to completing an adherence assessment independently. When asked if they would like to complete an adherence assessment independently (in the absence of a counsellor/social worker), patients completing the paper-adherence questionnaire said they prefer the interaction with health care workers as it allows them to clarify misunderstandings. Similarly, among participants completing the electronic-adherence questionnaire, some of the reported dislikes of the questionnaire included; the misunderstanding of questions and the inability to clarify such misunderstandings with someone.
When stratified by adherence tool, sensitivity of detecting poor adherence by detectable viral load was higher in the SMAQ (electronic-adherence questionnaire Se: 90.9%; 95% CI: 62.7–99.5 and paper-adherence questionnaire Se: 66.7%; 95% CI: 33.2–90.7) when compared to the NDoH questionnaire (electronic-adherence questionnaire Se: 63.6%; 95%: 33.6–87.2 and paper-adherence questionnaire Se: 33.3%; 95%: 9.3–66.8), irrespective of mode of delivery (electronic vs paper). A similar trend was observed when poor adherence was defined by TDM; SMAQ (electronic-adherence questionnaire Se: 57.1%; 95% CI: 34.0–78.2 and paper-adherence questionnaire Se: 75.0%; 95% CI: 50.9–91.3) when compared to the NDoH questionnaire (electronic-adherence questionnaire Se: 38.1%; 95%: 18.1–61.6 and paper-adherence questionnaire Se: 50.0%; 95%: 27.2–72.8), irrespective of mode of delivery (electronic vs paper).
The generally high sensitivity of the SMAQ in detecting poor adherence to ART confirmed by virologic outcome has been described previously (>72%).34 Various attributes of the SMAQ could lead to the higher sensitivity, much of which is beyond the scope of this study. However, at a descriptive level, the SMAQ consists of two more items than the NDoH tool (10 vs 8 items, respectively). Furthermore, the SMAQ consists of multi-time point recall adherence questions spanning the three months preceding the assessment (with measurement at various time-points such as the past weekend, week and month), while the NDoH only assesses adherence up to a maximum of four days prior to the assessment. The increased time-span of adherence measurement in the SMAQ may then address the effects of “white-coat adherence”, a well-documented phenomenon in which patients improve their adherence prior to a scheduled appointment with a health care worker.42
Limitations
Although viral load monitoring is considered the standard of care in determining first-line ART treatment failure, it may only provide a proximal delayed measured of ART adherence. Moreover, studies from resource-limited settings indicate that between 18% (74/407) to 52% (33/64) of patients experiencing virologic failure (≥1000 copies/mL) also had one or more NNRTI drug-resistant mutation.43,44 While resistance testing was beyond the scope of this study and not routinely administered in first-line therapy,23 the effects of drug-resistance may then be a key determinant of virologic failure among patients who are in fact truly adherent. However, while the cyclic relationship may be difficult to assess here, sub-optimal adherence has often been identified as a risk factor in developing drug-resistance.45
The limitations of TDM have been well described in literature and the concentration of the drug can be influenced by other factors (e.g. mal-absorption, concomitant medication, low bioavailability of the drug, incorrect dosage, etc.)46 For TDM, blood samples should be obtained at the end of the dosing interval as close to Cmin as possible to enable comparison of a measured concentration with a measure of central tendency (mean or median) for Cmin published in the individual product monographs (using pharmacokinetic data from HIV-infected volunteers). However, we could only obtain samples during the clinic visit (as participants could not return later in the afternoon or after clinic hours), which may have influenced the accuracy of the TDM results and underestimated the number of participants with poor adherence. Therefore, while estimates of poor adherence defined by TDM proved two times higher than that of viral load, this measure is still conservative and a potentially higher proportion of participants in this study could have blood drug concentrations lower than the minimum effective concentration. It should also be noted that although the sensitivities for both the NDoH and SMAQ paper-adherence questionnaire were higher than the electronic-adherence questionnaire, both sensitivities were lower than that observed when compared to the standard of care (i.e. viral load), possibly as a result of misclassification when using TDM method to define poor adherence.
While participants completing the electronic-adherence questionnaire did so with minimal patient–interviewer interaction and for the most part did so independently, those randomized to the complete the paper-adherence questionnaire were formally interviewed by study interviewers. A third arm, self-administered paper-adherence questionnaire was not included in this study, and therefore the effect of response bias could not be assessed here.
Furthermore, results from this study are from a single site which may be dependent on individual staff attitudes, training and willingness to engage and interact with AYAs. Results from this study may then differ from other HIV treatment clinics in Johannesburg and more broadly, Gauteng province.
Although the ability to speak and understand English was considered an eligible criterion, we did not assess the general level of language proficiency among participants. Therefore, participants could have misunderstood particular questions leading to imprecise reporting of their adherence. However, with the higher level of tertiary education recorded among participants randomized to complete the electronic-adherence questionnaire (24.0% vs 12.1%), the effects of lower education among patients completing the paper-adherence questionnaire could have been mediated by the presence of the interviewer.
A total of six participants were excluded from the analysis after study enrollment (unsuitable viral load sample). The suitability of viral load samples only become known post viral load draw and therefore could only be accounted for post-enrollment. The limitations of routinely collected data have been well documented.47 Those excluded, either because of a previous elevated load or a missing viral load result were equally distributed between the electronic- and paper-adherence questionnaire arms so we consider the risk of bias to be minimal.
Conclusion
When using more accurate real-time measures of poor adherence such as TDM (EFV ≤1.00 µg/mL), we observe a higher sensitivity of an interviewer-administered paper-adherence questionnaire than an identical set of self-administered adherence questions on an electronic tablet. The electronic- and paper-adherence questionnaire comprised questions from two standard adherence tools (South African National Department of Health adherence questionnaire and the Simplified Medication Adherence Questionnaire, with the latter achieving a higher sensitivity regardless of mode of delivery (electronic vs paper) or definition of poor adherence (detectable viral load vs EFV ≤1.00 µg/mL). Interviewer-administered paper-adherence questionnaire may elicit more accurate responses from participants through a sense of increased accountability when engaging with health care workers.
Ethical Approval
All procedures performed in studies involving human participants were in accordance with the ethical standards of the institutional and/or national research committee and with the 1964 Helsinki declaration and its later amendments or comparable ethical standards.
Ethical approval for the use of data was provided by the Human Research Ethics Committee (Medical) of the University of the Witwatersrand (M141186). All participants provided written informed consent to participate in the study.
Acknowledgments
We wish to thank Busisiwe Mcnube, Hazel Molefe, Michael Mothapo, Nkamoheleng Mokhesi and Sinethemba Madlala for their assistance in study enrollment. We thank Fiona Shahim and Nomfundo Maduna from Central Laboratory Services, Taryn Pillay and Derryn Legg-Esilva from National Health Laboratory Services, Jennifer Norman from Division of Clinical Pharmacology, University of Cape Town and Joshua Murphy from the Health Economics and Epidemiology Research Office.
Author Contributions
DE, KH and MPF conceptualised the study. KH and NJ facilitated study enrollment while RG, JT and SM facilitated the clinical management of patients. KH and DE analysed the data and drafted the manuscript. NJ, RG, JT, SM, LCL and MPF critically reviewed the analysis, interpreted study data and edited the manuscript. All authors read and approved the final manuscript. All authors are in agreement to be accountable for all aspects of the work in ensuring that questions related to the accuracy or integrity of any part of the work are appropriately investigated and resolved.
Disclosure
Lawrence C Long report grants from USAID, during the conduct of the study; Julia Turner reports personal fees from Jansen, Viiv, Virology Education, Abbvie, and Mylan, outside the submitted work. The authors report no other conflicts of interest in this work.
References
1. Joint United Nations Programme on HIV/AIDS (UNAIDS). UNAIDS report on the global AIDS epidemic; 2013. Available from: http://files.unaids.org/en/media/unaids/contentassets/documents/epidemiology/2013/gr2013/UNAIDS_Global_Report_2013_en.pdf.
2. Joint United Nations Programme on HIV/AIDS (UNAIDS). UNAIDS report on the global AIDS epidemic; 2012. Available from: http://www.unaids.org/sites/default/files/media_asset/20121120_UNAIDS_Global_Report_2012_with_annexes_en_1.pdf
3. Joint United Nations Programme on HIV/AIDS (UNAIDS). Global HIV & AIDS statistics — 2019 fact sheet 2019. Available from: http://www.unaids.org/en/resources/fact-sheet.
4. Joint United Nations Programme on HIV/AIDS (UNAIDS). Update - Active involvement of young people is key to ending the AIDS epidemic by 2030. Available from: https://www.unaids.org/en/resources/presscentre/featurestories/2015/august/20150812_PACT. Accessed December 16, 2019.
5. Machado JK, Sant’Anna MJ, Coates V, et al. Brazilian adolescents infected by HIV: epidemiologic characteristics and adherence to treatment. Sci World J. 2009;9:1273–1285. doi:10.1100/tsw.2009.136
6. Mavedzenge SMN, Doyle AM, Ross DA. HIV prevention in young people in sub-Saharan Africa: a systematic review. J Adolesc Health. 2011;49(6):568–586. doi:10.1016/j.jadohealth.2011.02.007
7. Sawyer SM, Afifi RA, Bearinger LH, et al. Adolescence: a foundation for future health. Lancet. 2012;379(9826):1630–1640. doi:10.1016/S0140-6736(12)60072-5
8. Schwarz SW. Adolescent Reproductive and Sexual Health: Facts for Policymakers. 2010. Available from: http://www.nccp.org/publications/pdf/text_931.pdf. Accessed December 16, 2019.
9. Bygrave H, Mtangirwa J, Ncube K, et al. Antiretroviral therapy outcomes among adolescents and youth in rural Zimbabwe. PLoS One. 2012;7(12):e52856. doi:10.1371/journal.pone.0052856
10. Evans D, Menezes C, Mahomed K, et al. Treatment outcomes of HIV-infected adolescents attending public-sector HIV clinics across Gauteng and Mpumalanga, South Africa. AIDS Res Hum Retroviruses. 2013;29(6):892–900. doi:10.1089/aid.2012.0215
11. Janssen N, Ndirangu J, Newell M-L, Bland RM. Successful paediatric HIV treatment in rural primary care in Africa. Arch Dis Child. 2009. p. adc. 2009.169367.
12. Nglazi MD, Kranzer K, Holele P, et al. Treatment outcomes in HIV-infected adolescents attending a community-based antiretroviral therapy clinic in South Africa. BMC Infect Dis. 2012;12(1):21. doi:10.1186/1471-2334-12-21
13. Simoni JM, Kurth AE, Pearson CR, et al. Self-report measures of antiretroviral therapy adherence: a review with recommendations for HIV research and clinical management. AIDS Behav. 2006;10(3):227–245. doi:10.1007/s10461-006-9078-6
14. Vreeman RC, Wiehe SE, Pearce EC, Nyandiko WM. A systematic review of pediatric adherence to antiretroviral therapy in low-and middle-income countries. Pediatr Infect Dis J. 2008;27(8):686–691. doi:10.1097/INF.0b013e31816dd325
15. Liu H, Golin CE, Miller LG, et al. A comparison study of multiple measures of adherence to HIV protease inhibitors. Ann Intern Med. 2001;134(10):968–977. doi:10.7326/0003-4819-134-10-200105150-00011
16. Adefolalu AO, Nkosi ZZ. The complex nature of adherence in the management of HIV/AIDS as a chronic medical condition. Diseases. 2013;1(1):18–35. doi:10.3390/diseases1010018
17. Buscher A, Hartman C, Kallen MA, Giordano TP. Validity of self-report measures in assessing antiretroviral adherence of newly diagnosed, HAART-naive, HIV patients. HIV Clin Trials. 2011;12(5):244–254. doi:10.1310/hct1205-244
18. Haberer JE, Kiwanuka J, Nansera D, Wilson IB, Bangsberg DR. Challenges in using mobile phones for collection of antiretroviral therapy adherence data in a resource-limited setting. AIDS Behav. 2010;14(6):1294–1301. doi:10.1007/s10461-010-9720-1
19. Gnambs T, Kaspar K. Disclosure of sensitive behaviors across self-administered survey modes: a meta-analysis. Behav Res Methods. 2015;47(4):1237–1259. doi:10.3758/s13428-014-0533-4
20. Glass TR, Sterne JA, Schneider M-P, et al. Self-reported nonadherence to antiretroviral therapy as a predictor of viral failure and mortality. Aids. 2015;29(16):2195–2200. doi:10.1097/QAD.0000000000000782
21. Metzner KJ, Giulieri SG, Knoepfel SA, et al. Minority quasispecies of drug-resistant HIV-1 that lead to early therapy failure in treatment-naive and-adherent patients. Clin Infect Dis. 2009;48(2):239–247. doi:10.1086/595703
22. Sethi AK, Celentano DD, Gange SJ, Moore RD, Gallant JE. Association between adherence to antiretroviral therapy and human immunodeficiency virus drug resistance. Clin Infect Dis. 2003;37(8):1112–1118. doi:10.1086/378301
23. Department of Health Republic of South Africa. National consolidated guidelines – for the prevention of mother-to-child transmission of HIV (PMTCT) and the management of HIV in children, adolescents and adults; 2015. Available from: http://www.sahivsoc.org/Files/ART%20Guidelines%2015052015.pdf.
24. Kredo T, Van der Walt JS, Siegfried N, Cohen K. Therapeutic drug monitoring of antiretrovirals for people with HIV. In: Cochrane Database of Systematic Reviews. 2009:3.
25. Pretorius E, Klinker H, Rosenkranz B. The role of therapeutic drug monitoring in the management of patients with human immunodeficiency virus infection. Ther Drug Monit. 2011;33(3):265–274. doi:10.1097/FTD.0b013e31821b42d1
26. van Luin M, Kuks PF, Burger DM. Use of therapeutic drug monitoring in HIV disease. Curr Opin HIV AIDS. 2008;3(3):266–271. doi:10.1097/COH.0b013e3282f82c1b
27. Feghali M, Venkataramanan R, Caritis S, editors. Pharmacokinetics of drugs in pregnancy. In: Seminars in Perinatology. Elsevier; 2015;39(7):512–9.
28. Olagunju A, Bolaji O, Amara A, et al. Pharmacogenetics of pregnancy‐induced changes in efavirenz pharmacokinetics. Clin Pharmacol Ther. 2015;97(3):298–306. doi:10.1002/cpt.43
29. Department of Health Republic of South Africa. National antiretroviral treatment guidelines. 2004. Available from: http://www0.sun.ac.za/ruralhealth/ukwandahome/rudasaresources2009/DOH/1.%20Antiretroviral.pdf.
30. Department of Health Republic of South Africa. Circular on new criteria for initiating adults on ART at CD4 count of 350 cells/mL and below. 2011. [letter].
31. Department of Health Republic of South Africa. National antiretroviral treatment guidelines; 2013. Available from: http://www.sahivsoc.org/Files/2013%20ART%20Guidelines-Short%20Combined%20FINAL%20draft%20guidelines%2014%20March%202013.pdf.
32. Department of Health Republic of South Africa. Implementation of the universal test and treat strategy for HIV positive patients and differentiated care for stable patients 2016. Available from: http://www.sahivsoc.org/Files/22%208%2016%20Circular%20UTT%20%20%20Decongestion%20CCMT%20Directorate.pdf.
33. Fox MP, Maskew M, MacPhail AP, et al. Cohort profile: the themba lethu clinical cohort, Johannesburg, South Africa. Int J Epidemiol. 2013;42:2. doi:10.1093/ije/dys029
34. Knobel H, Alonso J, Casado JL, et al. Validation of a simplified medication adherence questionnaire in a large cohort of HIV-infected patients: the GEEMA study. Aids. 2002;16(4):605–613. doi:10.1097/00002030-200203080-00012
35. Berg KM, Arnsten JH. Practical and conceptual challenges in measuring antiretroviral adherence. J Acquir Immune Defic Syndr. 2006;43(Suppl 1):S79. doi:10.1097/01.qai.0000248337.97814.66
36. Zerion Software. Best apps for data collection 2018; 2018. Available from: https://www.zerionsoftware.com/best-apps-for-data-collection/.
37. Mbengue MAS, Chasela C, Onoya D, Mboup S, Fox MP, Evans D. Clinical predictor score to identify patients at risk of poor viral load suppression at six months on antiretroviral therapy: results from a prospective cohort study in Johannesburg, South Africa. Clin Epidemiol. 2019;11:359. doi:10.2147/CLEP.S197741
38. Chan D. So why ask me? Are self-report data really that bad. Statistical and Methodological Myths and Urban Legends: Doctrine, Verity and Fable in the Organizational and Social Sciences. 2009;309–336.
39. Trau RN, Härtel CE, Härtel GF. Reaching and hearing the invisible: organizational research on invisible stigmatized groups via web surveys. Br J Manage. 2013;24(4):532–541. doi:10.1111/j.1467-8551.2012.00826.x
40. Ye C, Fulton J, Tourangeau R. More positive or more extreme? A meta-analysis of mode differences in response choice. Public Opin Q. 2011;75(2):349–365. doi:10.1093/poq/nfr009
41. Li JZ, Etemad B, Ahmed H, et al. The size of the expressed HIV reservoir predicts timing of viral rebound after treatment interruption. AIDS. 2016;30(3):343.
42. Lam WY, Fresco P. Medication adherence measures: an overview. Biomed Res Int. 2015;2015.
43. Boullé C, Guichet E, Kouanfack C, et al. editors. Virologic failure and human immunodeficiency virus drug resistance in rural Cameroon with regard to the UNAIDS 90- 90-90 Treatment targets. In:Open Forum Infectious Diseases. Oxford University Press; 2016.
44. Zuo Z, Liang S, Sun X, et al. Drug resistance and virological failure among HIV-infected patients after a decade of antiretroviral treatment expansion in eight provinces of China. PLoS One. 2016;11(12):e0166661. doi:10.1371/journal.pone.0166661
45. Bangsberg DR. Preventing HIV antiretroviral resistance through better monitoring of treatment adherence. J Infect Dis. 2008;197(Supplement_3):S272–S278. doi:10.1086/533415
46. Enara M. Therapeutic drug monitoring (TDM) pitfalls and limitations. MOJ Toxicol. 2014;1(1):9–10. doi:10.15406/mojt
47. Benchimol EI, Smeeth L, Guttmann A, et al. The REporting of studies Conducted using Observational Routinely-collected health Data (RECORD) statement. PLoS Med. 2015;12(10):e1001885. doi:10.1371/journal.pmed.1001885
 © 2020 The Author(s). This work is published and licensed by Dove Medical Press Limited. The full terms of this license are available at https://www.dovepress.com/terms.php and incorporate the Creative Commons Attribution - Non Commercial (unported, v3.0) License.
By accessing the work you hereby accept the Terms. Non-commercial uses of the work are permitted without any further permission from Dove Medical Press Limited, provided the work is properly attributed. For permission for commercial use of this work, please see paragraphs 4.2 and 5 of our Terms.
© 2020 The Author(s). This work is published and licensed by Dove Medical Press Limited. The full terms of this license are available at https://www.dovepress.com/terms.php and incorporate the Creative Commons Attribution - Non Commercial (unported, v3.0) License.
By accessing the work you hereby accept the Terms. Non-commercial uses of the work are permitted without any further permission from Dove Medical Press Limited, provided the work is properly attributed. For permission for commercial use of this work, please see paragraphs 4.2 and 5 of our Terms.