")
Back to Journals » Diabetes, Metabolic Syndrome and Obesity » Volume 12
Usefulness Of Surrogate Markers Of Body Fat Distribution For Predicting Metabolic Syndrome In Middle-Aged And Older Korean Populations
Received 29 May 2019
Accepted for publication 8 October 2019
Published 1 November 2019 Volume 2019:12 Pages 2251—2259
DOI https://doi.org/10.2147/DMSO.S217628
Checked for plagiarism Yes
Review by Single anonymous peer review
Peer reviewer comments 3
Editor who approved publication: Dr Konstantinos Tziomalos
Video abstract presented by Young-Joo Kim.
Views: 217
Kyung-A Shin,1 Young-Joo Kim2
1Department of Clinical Laboratory Science, Shinsung University, Chungnam, Republic of Korea; 2Department of Exercise Rehabilitation Welfare Soojung Campus, Sungshin University, Seoul, Republic of Korea
Correspondence: Young-Joo Kim
Department of Exercise Rehabilitation Welfare Soojung Campus, Sungshin University, 2, Bomun-ro 34da-gil, Seoungbuk-gu, Seoul 02844, South Korea
Tel/Fax + 822-920-7942
Email [email protected]
Background: Obesity markers, the lipid accumulation product (LAP), visceral adiposity index (VAI), triglyceride and glucose (TyG) index, and waist-to-height ratio (WHtR) are useful for assessing the risk of obesity-related cardiovascular disease. However, no previous study has assessed the usefulness of these four indices as predictors of metabolic syndrome among middle-aged and older Korean populations.
Purpose: To investigate the usefulness of LAP, VAI, TyG index, and WHtR as predictors of metabolic syndrome in middle-aged and older Korean populations.
Methods: This study included 15,490 male and female adults aged 40 years or older who underwent a medical check-up in a general hospital located in a Korean metropolitan area between January 2015 and December 2016. The diagnostic criteria for metabolic syndrome suggested by the American Heart Association/National Heart Lung and Blood Institute were used. LAP, VAI, and TyG index were computed based on the suggested mathematical models. WHtR was computed by dividing waist circumference by height. The independent sample t-test, one-way analysis of variance, Scheffe test, chi-square test, Pearson’s correlation analysis, and logistic regression were used to analyze the data.
Results: LAP, VAI, TyG index, and WHtR were significantly related to metabolic syndrome in both sexes. Receiver operating characteristic curve analysis showed the following optimal cutoffs for LAP, VAI, TyG index, and WHtR: 33.97, 1.84, 8.81, and 0.51, respectively. After adjusting for latent confounding variables (age, systolic blood pressure, diastolic blood pressure, and waist circumference), LAP, VAI, TyG index, and WHtR were significantly correlated with metabolic syndrome. Area under the curve (AUC) values based on ROC curves showed that LAP, VAI, TyG index, and WHtR were reliable predictors of metabolic syndrome. LAP had the greatest AUC, suggesting that it was a more useful predictor than the other markers (AUC=0.917, 95% confidence interval: 0.913–0.922).
Conclusion: LAP, VAI, TyG index, and WHtR are useful predictors of metabolic syndrome in middle-aged and older Koreans, but LAP had the greatest diagnostic accuracy.
Keywords: metabolic syndrome, LAP, VAI, TyG index, WHtR
Introduction
Metabolic syndrome (MetS) is condition characterized by a cluster of type 2 diabetes and cardiovascular disease (CVD) risk factors, such as abdominal obesity, elevated blood pressure, impaired glucose tolerance, and dyslipidemia, where obesity and insulin resistance are suggested as the major causes.1,2 The prevalence of MetS has rapidly increased worldwide,3 with that among Koreans aged 30 years or older reported to be 28.8%.4 Obesity, a risk factor of MetS, is estimated based on anthropometric parameters, such as body mass index (BMI), waist circumference (WC), and the waist-to-hip ratio.5,6 However, these parameters only provide limited information about body fat distribution and cannot appropriately reflect visceral fat distribution.5,6 To address this shortcoming, other parameters that consider fat accumulation and distribution have been reported and are described as follows.
Lipid accumulation product (LAP) is an index for excessive accumulation of abdominal fat based on the triglyceride (TG) level and WC.7 Visceral adiposity index (VAI) is an index for assessing fat distribution and function using WC, BMI, TG level, and high-density lipoprotein (HDL) cholesterol (HDL-C) level.8 LAP and VAI are predictors of cardiovascular and cerebrovascular risks,8,9 and are considered as clinical indicators of MetS.10
TG and glucose (TyG) index, which combines the mediating variables of fasting blood glucose and TG, has recently been reported to be a useful index for insulin resistance.11 A study on the Korean population also confirmed its association with diabetes.12
Adjusting for WC by height in determining obesity is useful for assessing visceral fat distribution or the risk of MetS.13 These indices have been developed based on the western population, and body composition tends to vary across cultures. Nevertheless, no previous study has assessed the usefulness of these four indices as predictors of MetS in the Korean population. Furthermore, because Asians have an increased risk of diabetes and metabolic disorders despite lower BMI than westerners, it is crucial to confirm whether the criteria set against westerners are also appropriate for the Korean population.14
Therefore, this study aimed to investigate whether LAP, VAI, TyG index, and waist-to-height ratio (WHtR) can be useful predictors of MetS among middle-aged and older Koreans.
Materials And Methods
Subjects
Male and female adults aged 40 years or older who underwent a medical check-up in a general hospital located in a Korean metropolitan area between January 2015 and December 2016 were enrolled. After excluding patients with thyroid disease; patients with liver disease including those with anti-hepatitis C virus antibody or hepatitis B surface antigen positivity; patients with gout, patients with kidney disease; and patients with stroke, myocardial infarction, and angina based on a self-reported survey; as well as patients with missing values for any of the parameters, 15,490 participants were enrolled. This study was approved by the Institutional Review Board (IRB) of Bundang Jesaeng Hospital in Seongnam-city Gyeonggi-do in Korea (IRB number: DMC 2019-02-005). In accordance with the guidelines of the 1975 Declaration of Helsinki. This study was conducted retrospectively and approved an IRB with waiver of participant written informed consent.
Anthropometry And Blood Pressure Measurement
Height and weight were measured via bioimpedance analysis with the participant standing using a body composition analyzer (Inbody 720; Biospace Co., Seoul, Korea), and BMI was computed by dividing weight (kg) by height squared (m2). WC was measured at the narrowest point in the middle of the lower border of rib cage and top of the iliac crest to 0.1 cm as the participant breathed out with legs opened about 25–30 cm apart to distribute body weight. LAP was computed as (WC–65)×TG level for men and (WC–58)×TG level for women.7 VAI was computed using the equation [WC/39.68+(1.88×BMI)]×(TG level/1.03)×(1.31/HDL level) for men and [WC/36.58+(1.89×BMI)] (TG level/0.81)×(1.52/HDL level)] for women.8 TyG index was computed using the equation Ln (TG level [mg/dL]×fasting plasma glucose level [mg/dL]/2).15,16 WHtR was computed by dividing WC (cm) by height (cm). Systolic and diastolic blood pressures (BPs) were measured using an aneroid barometer (Medisave UK Ltd., Weymouth, UK). Systolic and diastolic blood pressures (BPs) were measured using an aneroid sphygmomanometer (Medisave UK Ltd., Weymouth, UK) in a seated position after 5 mins of rest. Initially, blood pressure was measured in both arms and then again in the arm with higher blood pressure. Blood pressure was measured at least two times at intervals of 1 to 2 mins, and the average value was used as data.
Diagnostic Criteria And Blood Analysis
The diagnostic criteria for metabolic syndrome suggested by the American Heart Association/National Heart Lung and Blood Institute were used. The Per the diagnostic criteria for MetS suggested by the American Heart Association/National Heart Lung and Blood Institute, patients were diagnosed with MetS when they met at least three of the five MetS conditions. The five conditions for MetS are as follows: fasting blood glucose level ≥100 mg/dL, TG level ≥150 mg/dL, low-density cholesterol level <40 mg/dL for men and <50 mg/dL for women, systolic BP ≥130 mmHg or diastolic BP ≥85 mmHg, and WC ≥90 cm for men and ≥80 cm women as abdominal obesity criterion for the western Pacific region suggested by the World Health Organization.3,17 Blood was sampled from participants in the morning after at least 8 hrs of fasting. Participants were asked to refrain from caffeine, alcohol, smoking and strenuous activities for 8 hrs prior to blood sampling. Serum levels of total cholesterol, TG, HDL-C, low-density lipoprotein cholesterol, fasting blood glucose, uric acid, and high-sensitivity C-reactive protein were analyzed with an automated biochemical analyzer (TBA-200FR NEO; Toshiba, Tokyo, Japan). hs-CRP was quantitatively analyzed on the basis of the turbidimetric immunoassay (TIA). Glycated hemoglobin A1c was measured with high-performance liquid chromatography using Variant II (Bio-Rad, Hercules, CA, USA), and insulin was measured with electrochemiluminescence immunoassay using Roche Modular Analytics E170 (Roche, Mannheim, Germany). The homeostasis model assessment-insulin resistance (HOMA-IR) was computed using the equation [fasting insulin concentration (µIU/mL)×fasting blood glucose level (mmol/L)/22.5].18
Statistical Analysis
Data were statistically analyzed using the IBM SPSS Statistics 24.0 software program (IBM Corp., Armonk NY, USA). Differences of anthropometric and biochemical parameters according to sex and MetS were analyzed with the independent sample t-test. Differences of LAP, VAI, TyG index, and WHtR according to the number of MetS conditions met were analyzed with one-way analysis of variance (ANOVA). Variables found to be significant in the one-way ANOVA were analyzed with the Scheffe test as a post hoc test (multiple comparisons). Categorical variables were analyzed with the chi-square test. The associations of LAP, VAI, TyG index, and WHtR with MetS components were analyzed with Pearson's correlation analysis. The differences in the incidence of MetS according to the quartiles of LAP, VAI, TyG index, and WHtR were analyzed with logistic regression, and the results are presented as an odds ratio (OR) and 95% confidence interval (CI). Further, the predictive power of LAP, VAI, TyG index, and WHtR for MetS was analyzed by computing the area under curve (AUC) value using their receiver operating characteristic (ROC) curve. The optimum cutoff values for LAP, VAI, TyG index, and WHtR for predicting MetS were determined by the maximum sum of sensitivity and specificity. Statistical significance was set at p<0.05 for all analyses.
Results
Among 15,490 participants, 9,742 (62.9%) were men and 5,748 (37.1%) were women. The prevalence of MetS was 12.2% (n=1,888). LAP, VAI, TyG index, and WHtR were higher among women than among men, and higher in the MetS group than in the non-MetS group (p<0.001). The prevalence of each condition of MetS was higher in the MetS group than in the non-MetS group (p<0.001) (Table 1). As shown in Figure 1, LAP, VAI, TyG index, and WHtR increased proportionately to the number of MetS components (p<0.001). Obesity indicators LAP, VAI, TyG index, and WHtR were positively correlated with WC, systolic and diastolic BPs, TG, and fasting blood glucose level while negatively correlated with HDL-C for all participants as well as for both sexes (p<0.001) (Table 2). The adjusted ORs (95% CIs) of obesity indicators for MetS are shown in Table 3. After adjusting for age, systolic and diastolic blood pressure and waist circumference in men, the third and fourth quartiles (Q3 and Q4) of LAP, VAI, TyG index, and WHtR were higher in prevalence of MetS. Q3 of LAP was at 2.105 (1.129–3.132) and Q4 was at 3.120 (1.180–4.155), indicating a higher risk for MetS compared to first quartile (Q1) of LAP. For VAI, Q3 was at 2.012 (1.362–4.454) and Q4 was at 3.944 (2.952–8.281), indicating a higher risk for MetS compared to Q1. The adjusted odds ratios of obesity indicators associated with metabolic syndrome are shown in Table 3. Table 4 shows the AUC values (95% CI) of the obesity indicators for predicting MetS in middle-aged Koreans. LAP had the highest AUC value and WHtR had the lowest AUC values in both sexes. The optimal cutoff values of LAP, VAI, TyG index, and WHtR for predicting MetS were found to be 33.97, 1.84, 8.81, and 0.51, respective, based on their ROC curves.
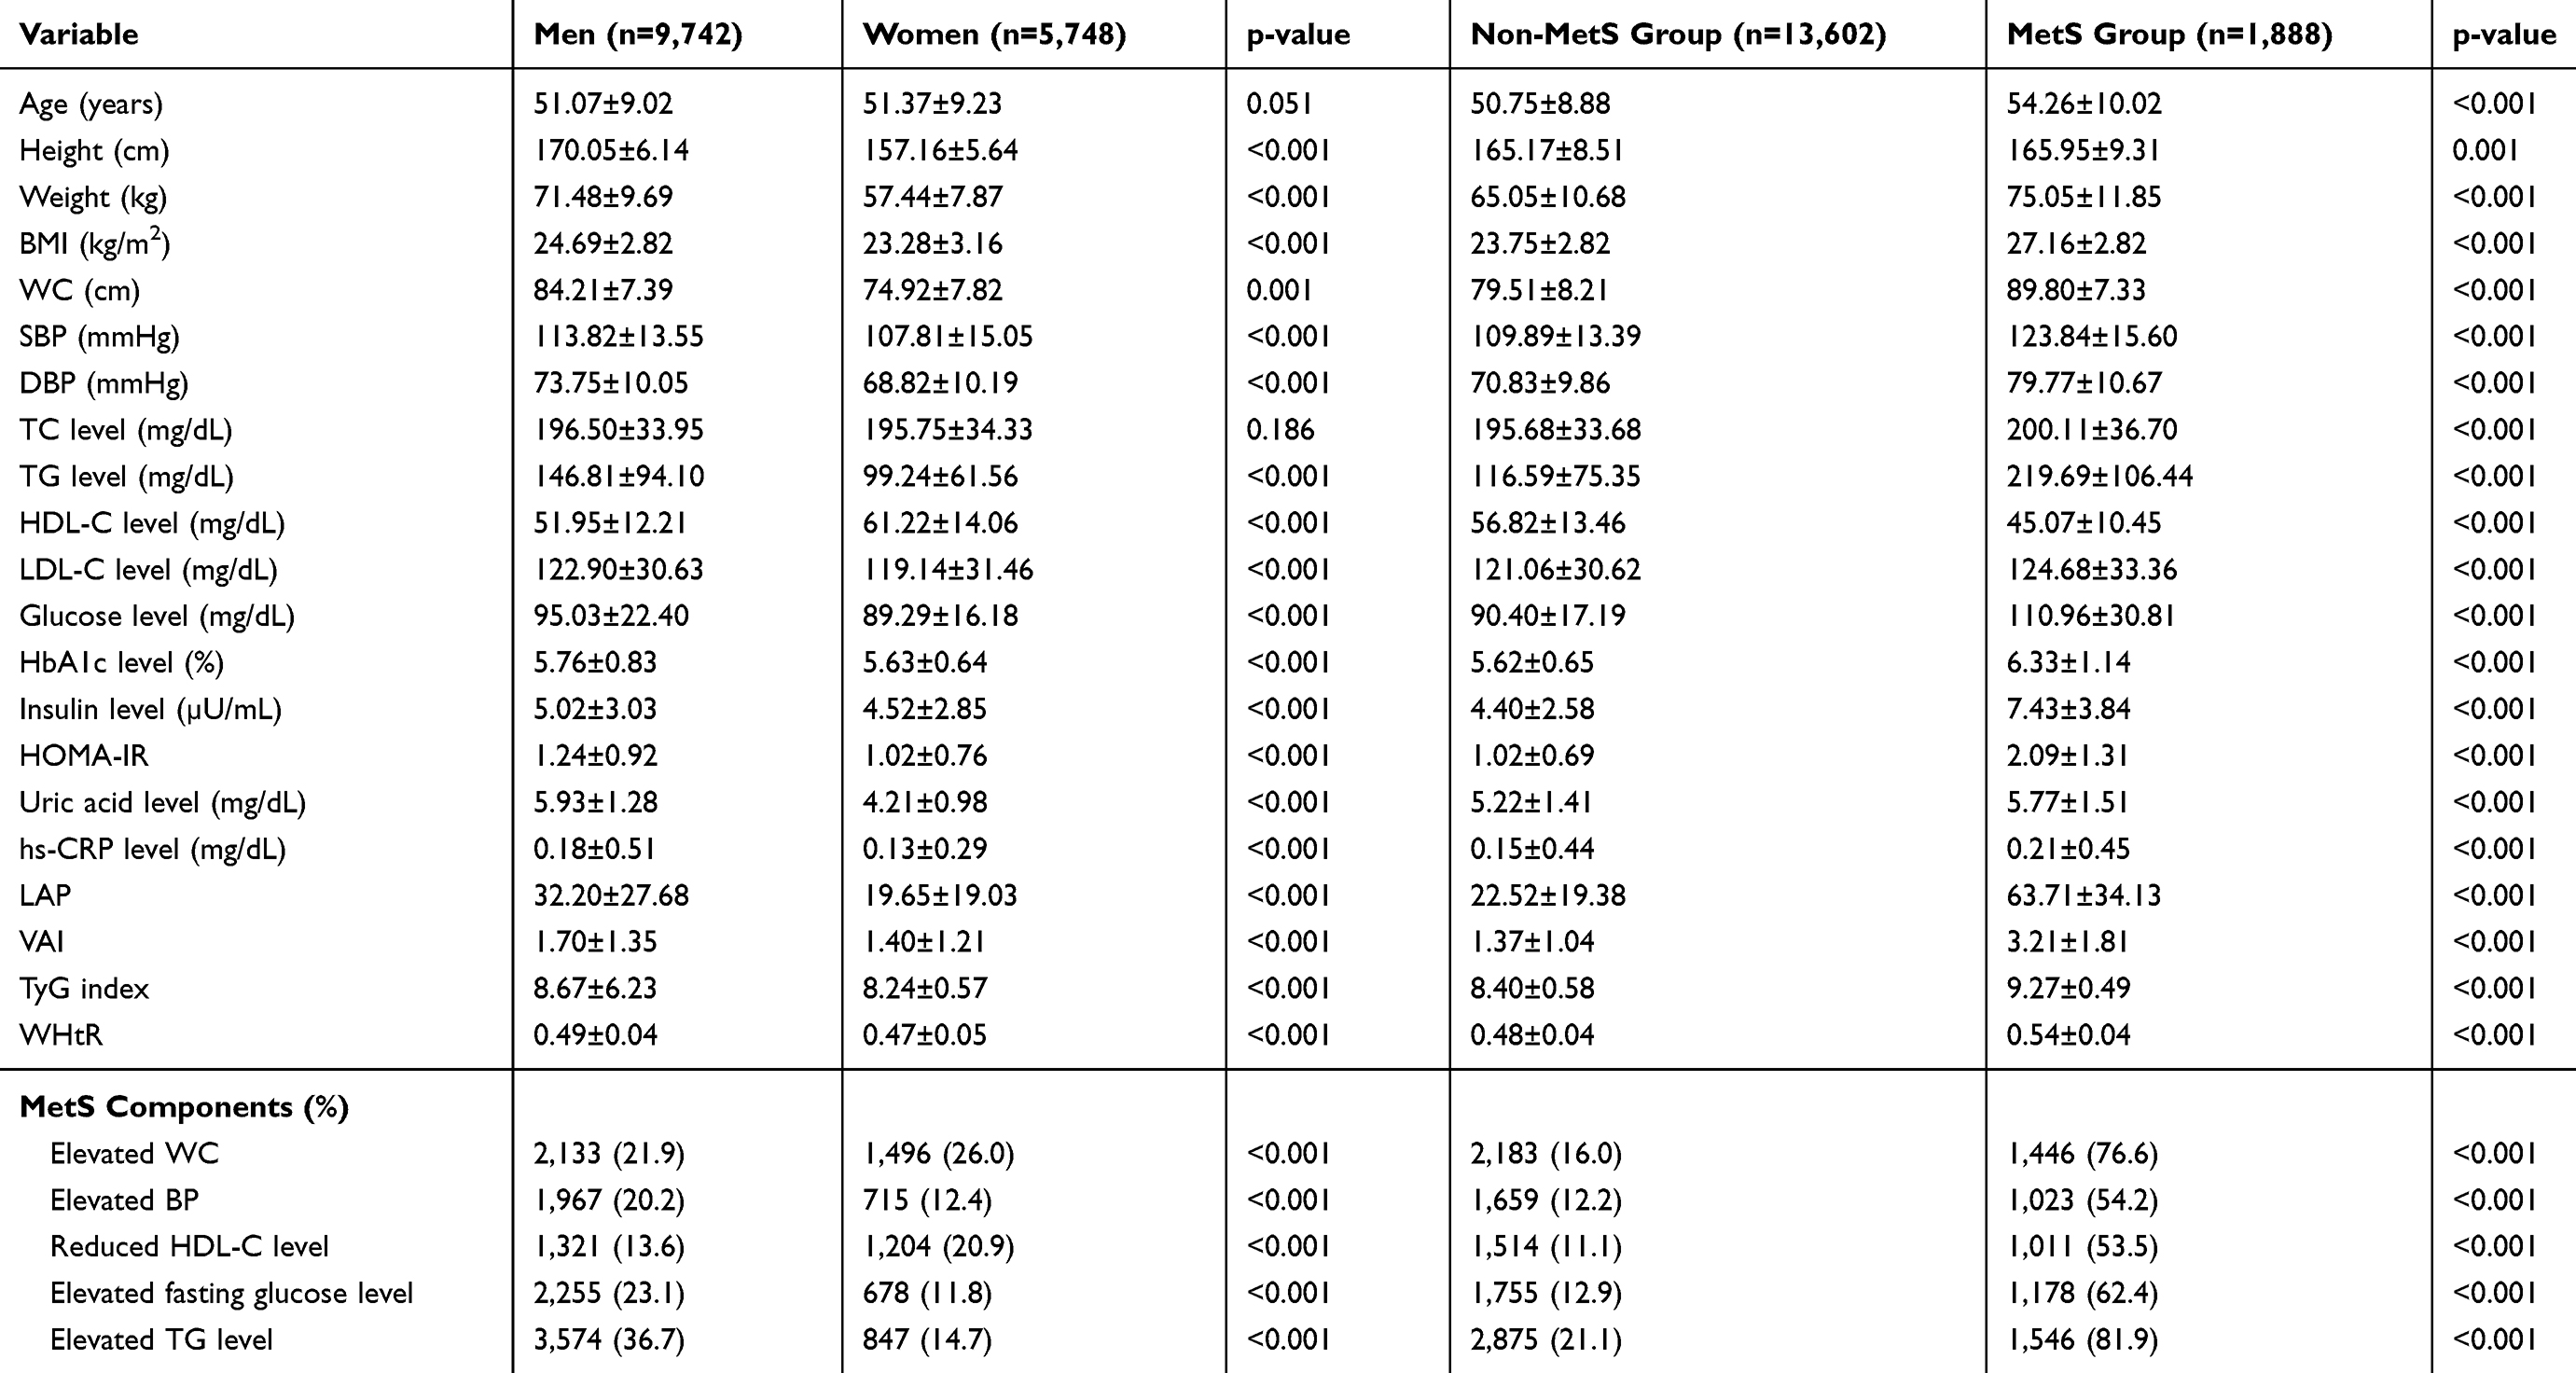 |
Table 1 Characteristics Of The Study Participants According To Sex And The Presence Of Metabolic Syndrome |
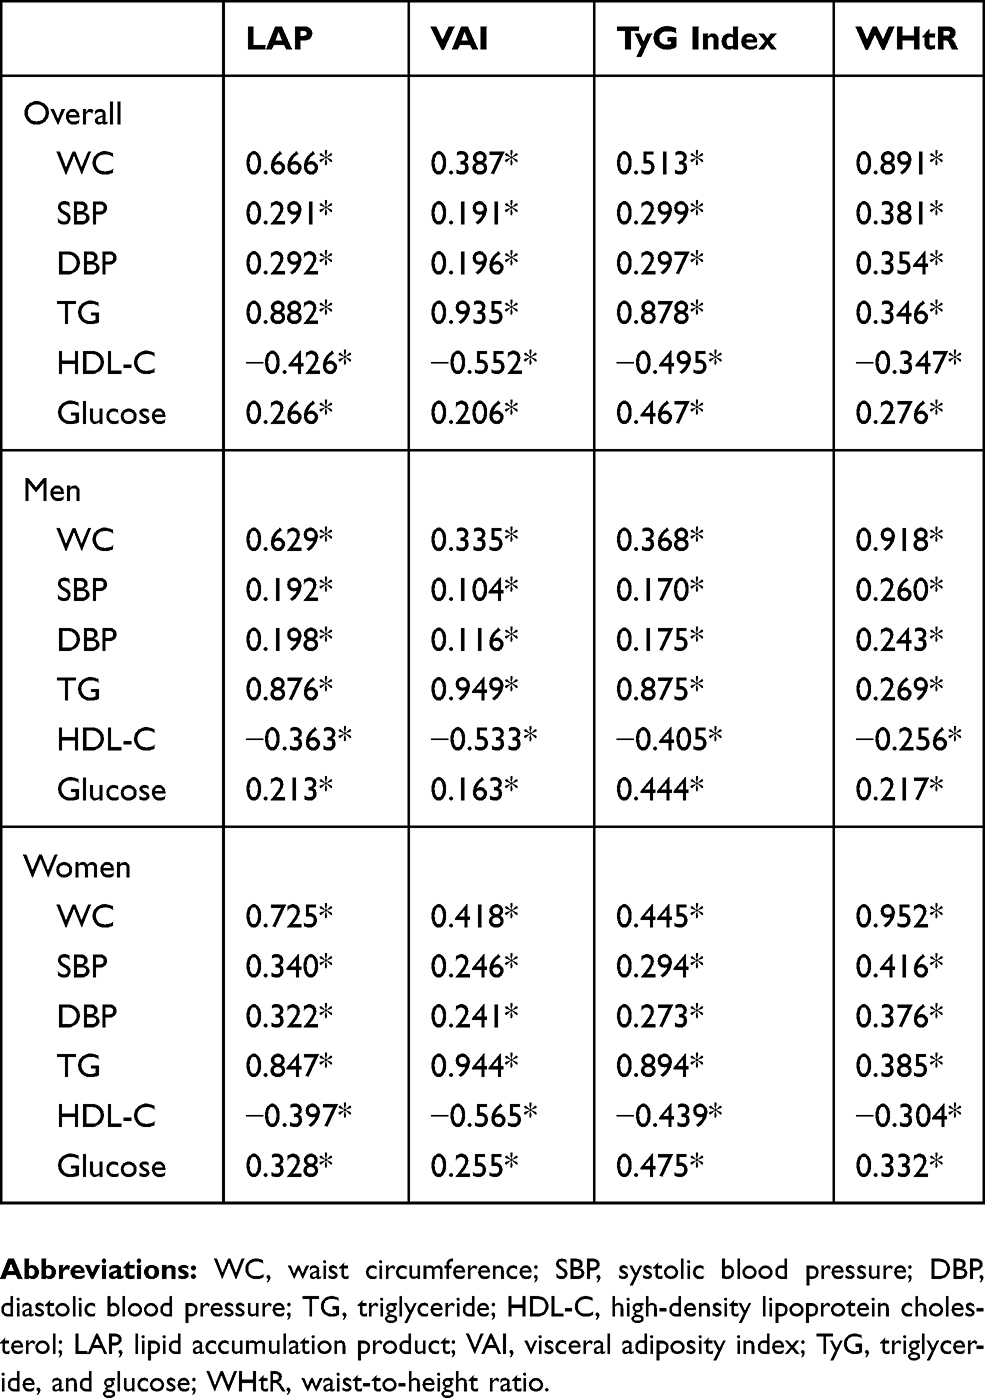 |
Table 2 Correlations Between The Obesity Indicators And Metabolic Syndrome Components |
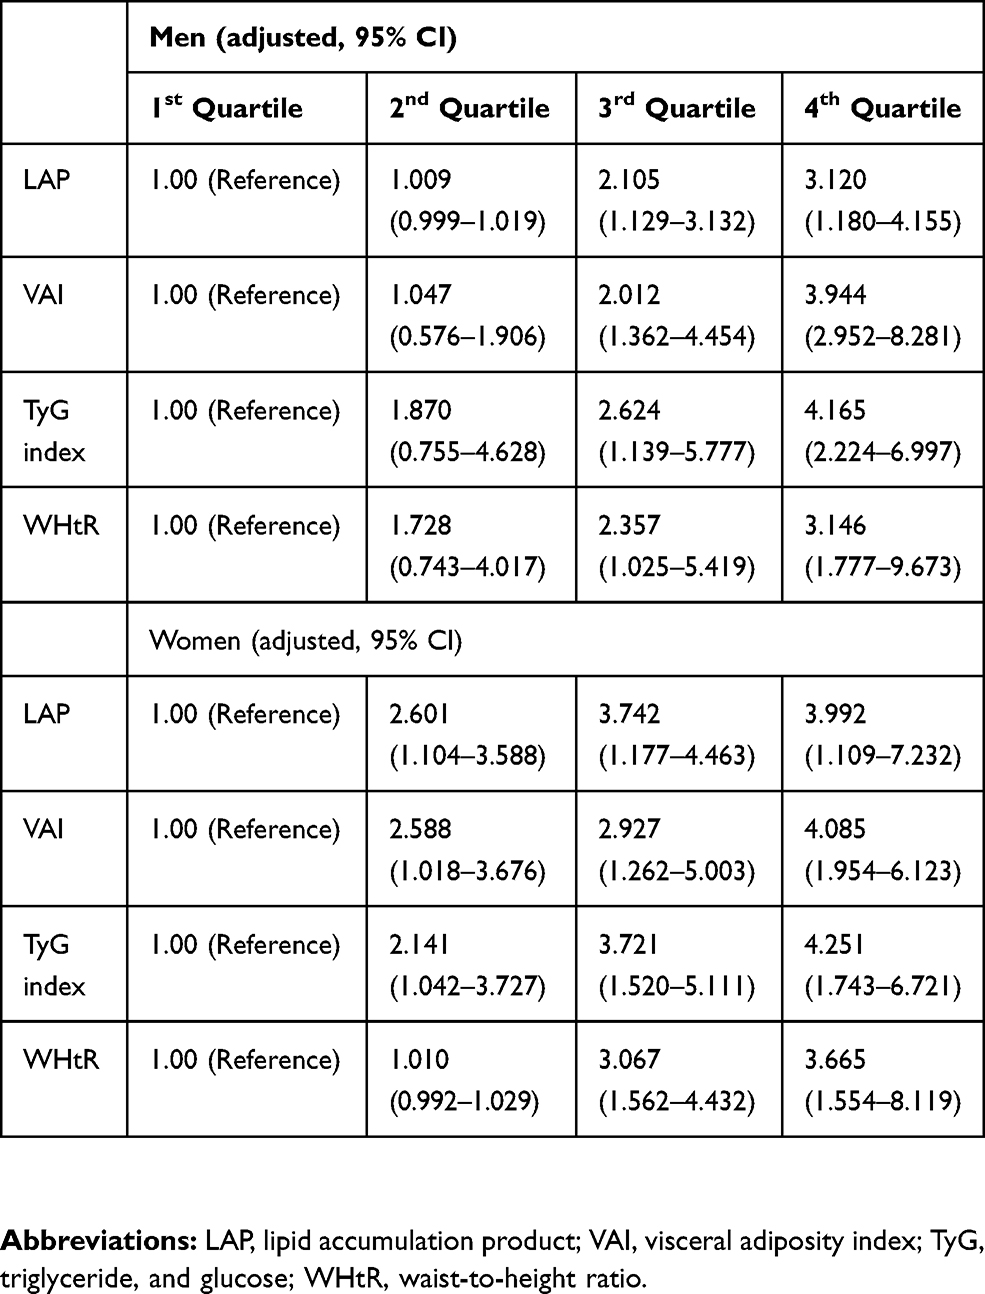 |
Table 3 Adjusted Odds Ratios Of Obesity Indicators Associated With Metabolic Syndrome |
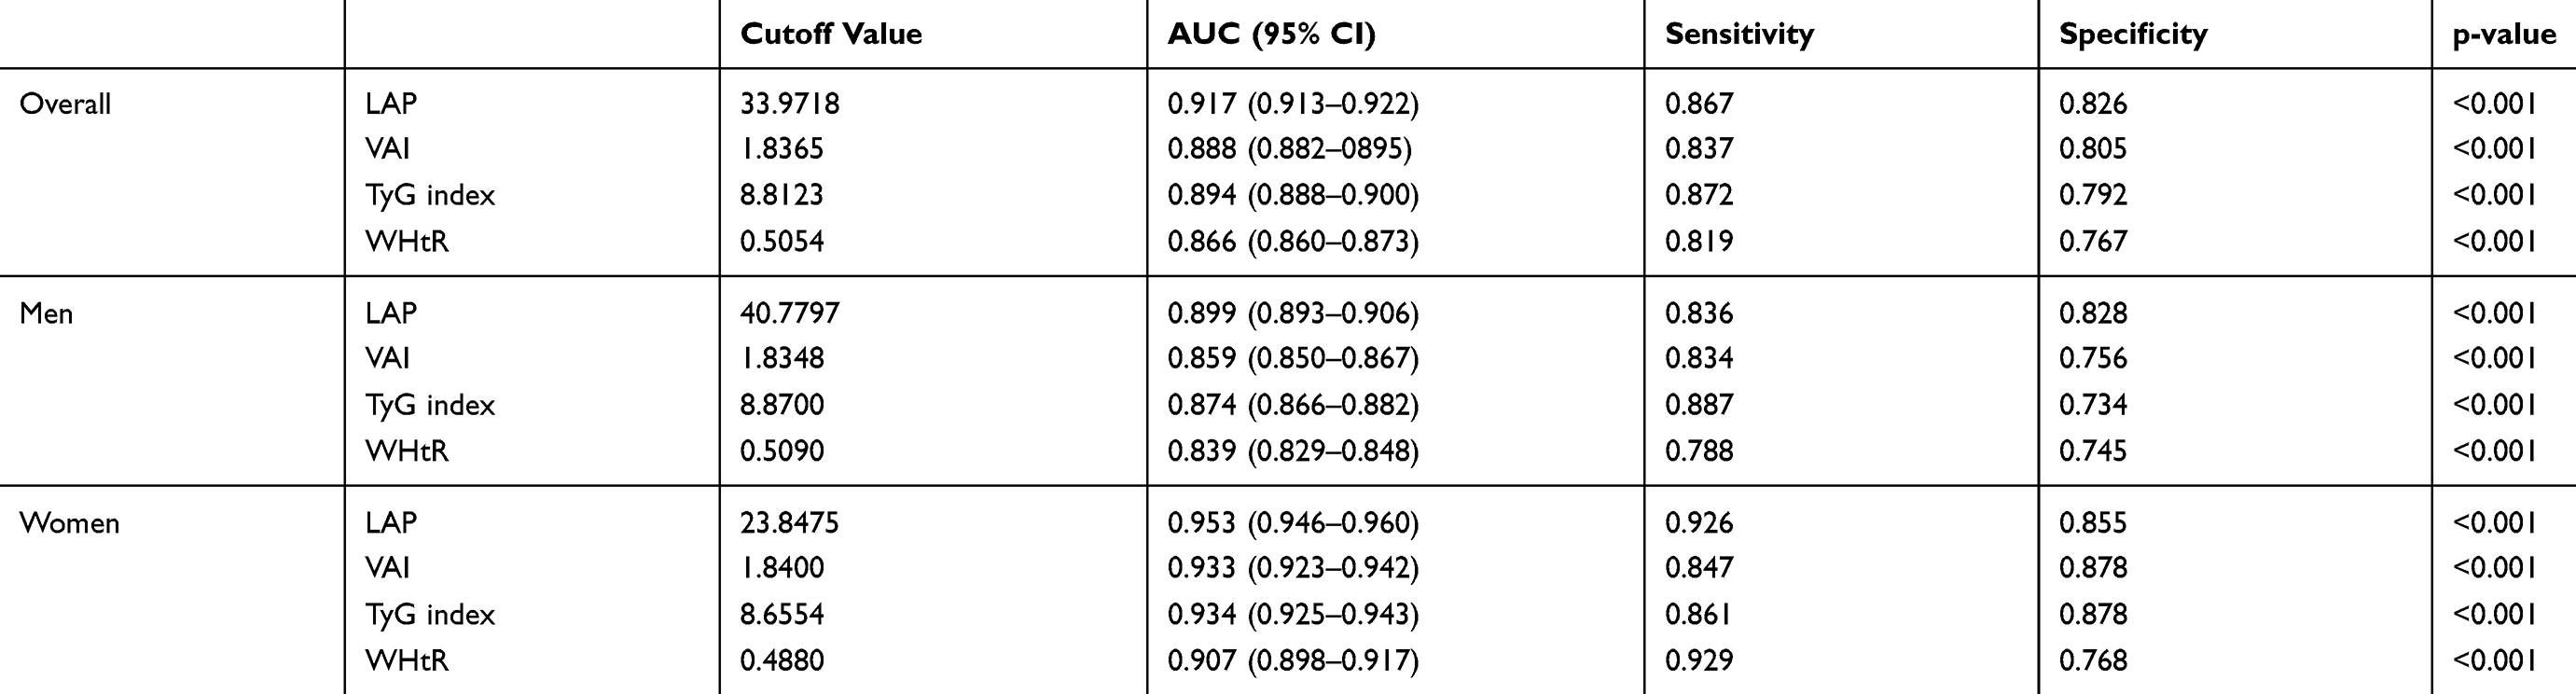 |
Table 4 Areas Under The Receiver Operating Characteristic Curve For Predicting Metabolic Syndrome |
 |
Figure 1 Differences in obesity indicators according to the number of risk factors for metabolic syndrome; (A) LAP, (B) VAI, (C) TyG index. Abbreviations: LAP, lipid accumulation product; VAI, visceral adiposity index; TyG, triglyceride, and glucose; WHtR, waist-to-height ratio; MetS, metabolic syndrome. |
Discussion
In this cross-sectional analysis on middle-aged and older Korean men and women, LAP, VAI, TyG index, and WHtR were significantly associated with MetS in both sexes. Furthermore, ROC curve analysis revealed that LAP, VAI, TyG index, and WHtR are useful predictors of MetS, with LAP having the greatest diagnostic accuracy. Establishing clinical indicators for effectively and easily diagnosing MetS is crucial for screening out MetS.10
LAP is reported to be associated with MetS, type 2 diabetes, hypertension, and cardiovascular disease in American adults, patients with polycystic ovary syndrome, and non-diabetic patients with a high CVD risk.7,9,19–24 In the present study, Q4 of LAP showed a 3.1 times higher metabolic risk in men and 4.0 times higher risk in women compared to Q1 of LAP. As determined based on the AUC of the ROC curve, LAP had a greater predictive power for MetS than VAI, TyG index, and WHtR, and diagnostic power was higher in women than in men. Furthermore, the optimal cutoff values for predicting MetS were 40.78 for men and 23.85 for women. This finding was similar to the previous finding by Li et al10 that LAP is a better predictor of MetS than VAI and TyG index in the middle-aged Chinese population. Taverna et al19 reported that the LAP cutoff values for MetS risk assessment in Spanish adults were 48.09 for men and 31.77 for women. Furthermore, the cutoff for MetS among menopausal women is suggested to be 47.63.25 Herein, the optimal cutoff for predicting MetS was lower than that found in other studies, and this is believed to be due to the differences in race, age, and diagnostic criteria for MetS.
VAI is an important index for visceral obesity and insulin resistance and is associated with CVD risk.8 In the present study, Q4 of VAI showed a 3.9 times (men) and 4.1 times (women) higher risk for MetS compared to Q1 of VAI. However, these results were predicted, as the variables used for computing VAI include the components of MetS.26 The association between VAI and MetS has been documented among the Peruvian adult population, older Brazilian population, and patients with obstructive sleep apnea.27–29 Furthermore, Amato et al8 reported an optimal cutoff value of 1.9 or higher for predicting MetS among Caucasians. Herein, the optimal cutoff of VAI for predicting MetS was 1.84. Although VAI is not a diagnostic tool for cardiovascular and cerebrovascular diseases, it can be easily used for assessing visceral fat by examining WC, BMI, TG, and HDL-C.8 Therefore, VAI can be a useful tool for assessing MetS and CVD risk, which are related to visceral fat.
In a study on the Chinese population, Du et al11 reported that TyG index is a better early indicator of insulin resistance than VAI and LAP. Although not superior to HOMA-IR, TyG index is known as an alternative index for insulin resistance when insulin cannot be measured.16 Furthermore, Lee et al12 confirmed the association between TyG index and diabetes among Koreans. In the present study, TyG index increased with the number of MetS components in both sexes, and VAI had a higher diagnostic accuracy for MetS than WHtR. However, Li et al10 reported that TyG index has a poorer predictive power for MetS than VAI. They suggested that such result is attributable to the fact that TyG index is a combination of fasting blood glucose and TG and does not include WC, which is an important marker for MetS.10 Herein, the optimal TyG index cutoff for MetS was 8.81, and the AUC was 0.894, showing that it is a useful predictor of MetS. Moon et al30 reported the optimal cutoff of TyG index to be 8.45 for Korean adolescents. Our findings and Moon et al results show that the cutoff for TyG index is higher for middle-aged adults than for adolescents. TG concentration is known to vary across races, so additional studies are needed to assess TyG index in other populations.16
WHtR has been suggested as a better predictor of CVD risk than WC.31 Even in people with the same WC, shorter individuals may have a higher risk for CVD than taller individuals, so WC was adjusted with height.32 A meta-analysis reported that WHtR is a superior predictor of diabetes, dyslipidemia, hypertension, and CVD compared with WC and BMI.8,31,33 AUC values determined using ROC curves showed that WHtR has a poorer diagnostic accuracy for MetS than LAP, VAI, and TyG index. This finding suggests that the inclusion of biochemical parameters increases the predictive accuracy of a parameter for MetS, as opposed to using only anthropometric parameters.34 In this study, LAP, VAI, TyG index, and WHtR were higher in the MetS group than in the Non-Mets group, also increased proportionally as the number of metabolic syndrome components increased.
Two strengths of this study are that it had a relatively large sample and that it compared the predictive powers of four obesity markers for MetS. However, this study has a few limitations. First, because of the nature of a retrospective cross-sectional study, we could not confirm the casual relationships of LAP, VAI, TyG index, and WHtR with MetS. Second, the findings can be applied to only Koreans aged 40 years or older and not to other races and age groups. Third, we could not analyze information about lifestyle that may have an impact on MetS, such as smoking, drinking, and exercise, due to the low accuracy of the relevant data. Third, we could not analyze information about lifestyle that may have an impact on MetS, such as smoking, drinking, and exercise, due to the low accuracy of the relevant data. Third, we could not analyze information about lifestyle that may have an impact on MetS, such as smoking, drinking, and exercise, due to the low accuracy of the relevant data. Third, Data on lifestyle such as smoking, drinking, and exercise, that could affect Mets and, socio-economic factors were not included in the study due to uncertainty. In addition, inflammatory-related tests, excluding endocrine disorders and hs-CRP, were not analyzed in this study. Fourth, for women, we could not consider their menopausal state. Nevertheless, this study is meaningful in that it is the first large-scale study to confirm that LAP, VAI, TyG index, and WHtR are reliable predictors of MetS risk in middle-aged and older Korean populations.
Conclusions
LAP, VAI, TyG index, and WHtR were significantly correlated with MetS in middle-aged and older Korean men and women. Furthermore, LAP, VAI, TyG index, and WHtR were found to be reliable predictors of the risk of MetS. In particular, LAP was the best predictor of MetS. Thus, these obesity parameters can be used for screening MetS in middle-aged and older Koreans.
Abbreviations
MetS, metabolic syndrome; CVD, cardiovascular disease; BMI, body mass index; WC, waist circumference; LAP, lipid accumulation product; TG, triglyceride; VAI, visceral adiposity index; glucose; WHtR, waist-to-height ratio; IRB, institutional review board; BP, blood pressure; HOMA-IR, homeostasis model assessment-insulin resistance; ANOVA, analysis of variance; OR, odds ratio; CI, confidence interval; AUC, area under curve; ROC, receiver operating characteristic; Q1, first quartile; Q3, third quartile; Q4, fourth quartile.
Author Contributions
Both authors conceived the presented idea. Professor Shin developed the theory and performed the computations. Professor Kim verified the analytical methods. Both authors discussed the results and contributed to the final manuscript. Both authors contributed to data analysis, drafting or revising the article, gave final approval of the version to be published, and agree to be accountable for all aspects of the work.
Disclosure
The authors whose names listed in this study report no relationships that could be considered as conflict of interest.
References
1. Reaven GM. Banting lecture 1988. Role of insulin resistance in human disease. Diabetes. 1988;37:1595–1607. doi:10.2337/diab.37.12.1595
2. Kim MK, Park JH. Metabolic syndrome. J Korean Med Assoc. 2012;55:1005–1013. doi:10.5124/jkma.2012.55.10.1005
3. Grundy SM, Cleeman JI, Daniels SR, et al. Diagnosis and management of the metabolic syndrome: an American Heart Association/National Heart, Lung, and Blood Institute Scientific Statement. Circulation. 2005;112:2735–2752.
4. Korea Ministry of Health and Welfare. Korean national health and nutrition examination survey ‘07~’10 [Internet]. Sejong: Ministry of Health and Welfare; 2012 [
5. Haslam DW, James WP. Obesity. Lancet. 2005;366:1197–1209.
6. Pouliot MC, Després JP, Lemieux S, et al. Waist circumference and abdominal sagittal diameter: best simple anthropometric indexes of abdominal visceral adipose tissue accumulation and related cardiovascular risk in men and women. Am J Cardiol. 1994;73:460–468.
7. Kahn HS. The “lipid accumulation product” performs better than the body mass index for recognizing cardiovascular risk: a population-based comparison. BMC Cardiovasc Disord. 2005;5:26.
8. Amato MC, Giordano C, Galia M, et al.; AlkaMeSy Study Group. Visceral adiposity index: a reliable indicator of visceral fat function associated with cardiometabolic risk. Diabetes Care. 2010;33:920–922.
9. Ioachimescu AG, Brennan DM, Hoar BM, Hoogwerf BJ. The lipid accumulation product and all-cause mortality in patients at high cardiovascular risk: a PreCIS database study. Obesity (Silver Spring). 2010;18:1836–1844.
10. Li R, Li Q, Cui M, et al. Clinical surrogate markers for predicting metabolic syndrome in middle-aged and elderly Chinese. J Diabetes Investig. 2018;9:411–418. doi:10.1111/jdi.12708
11. Du T, Yuan G, Zhang M, Zhou X, Sun X, Yu X. Clinical usefulness of lipid ratios, visceral adiposity indicators, and the triglycerides and glucose index as risk markers of insulin resistance. Cardiovasc Diabetol. 2014;13:146. doi:10.1186/1475-2840-13-80
12. Lee SH, Kwon HS, Park YM, et al. Predicting the development of diabetes using the product of triglycerides and glucose: the Chungju Metabolic Disease Cohort (CMC) study. PLoS One. 2014;9:e90430. doi:10.1371/journal.pone.0090430
13. Hsieh SD, Yoshinaga H, Muto T. Waist-to-height ratio, a simple and practical index for assessing central fat distribution and metabolic risk in Japanese men and women. Int J Obes Relat Metab Disord. 2003;27:610–616. doi:10.1038/sj.ijo.0802259
14. James WP, Chunming C, Inoue S. Appropriate Asian body mass indices? Obes Rev. 2002;3:139. doi:10.1046/j.1467-789X.2002.00063.x
15. Simental-Mendia LE, Rodriguez-Moran M, Guerrero-Romero F. The product of fasting glucose and triglycerides as surrogate for identifying insulin resistance in apparently healthy subjects. Metab Syndr Relat Disord. 2008;6:299–304. doi:10.1089/met.2008.0034
16. Guerrero-Romero F, Simental-Mendía LE, González-Ortiz M, et al. The product of triglycerides and glucose, a simple measure of insulin sensitivity. Comparison with the euglycemic-hyperinsulinemic clamp. J Clin Endocrinol Metab. 2010;95:3347–3351. doi:10.1210/jc.2010-0288
17. World Health Organization. The Asia-Pacific Perspective: Redefining Obesity and Its Treatment. Sydney, Australia: Health Communications Australia; 2000:19–20.
18. Moon K, Sung SH, Chang YK, et al. The association between Apolipoprotein E genotype and lipid profiles in healthy woman workers. J Prev Med Public Health. 2010;43:213–221. doi:10.3961/jpmph.2010.43.3.213
19. Taverna MJ, Martínez-Larrad MT, Frechtel GD, Serrano-Ríos M. Lipid accumulation product: a powerful marker of metabolic syndrome in healthy population. Eur J Endocrinol. 2011;164:559–567. doi:10.1530/EJE-10-1039
20. Kahn HS. The lipid accumulation product is better than BMI for identifying diabetes: a population-based comparison. Diabetes Care. 2006;29:151–153. doi:10.2337/diacare.29.1.151
21. Gao X, Wang G, Wang A, Xu T, Tong W, Zhang Y. Comparison of lipid accumulation product with body mass index as an indicator of hypertension risk among Mongolians in China. Obes Res Clin Pract. 2013;7:e308–314. doi:10.1016/j.orcp.2012.02.002
22. Hosseinpanah F, Barzin M, Mirbolouk M, Abtahi H, Cheraghi L, Azizi F. Lipid accumulation product and incident cardiovascular events in a normal weight population: tehran lipid and glucose study. Eur J Prev Cardiol. 2016;23:187–193. doi:10.1177/2047487314558771
23. Xiang S, Hua F, Chen L, Tang Y, Jiang X, Liu Z. Lipid accumulation product is related to metabolic syndrome in women with polycystic ovary syndrome. Exp Clin Endocrinol Diabetes. 2013;121:115–118. doi:10.1055/s-0032-1333261
24. Mirmiran P, Bahadoran Z, Azizi F. Lipid accumulation product is associated with insulin resistance, lipid peroxidation, and systemic inflammation in type 2 diabetic patients. Endocrinol Metab (Seoul). 2014;29:443–449. doi:10.3803/EnM.2014.29.4.443
25. Namazi Shabestari A, Asadi M, Jouyandeh Z, Qorbani M, Kelishadi R. Association of lipid accumulation product with cardio-metabolic risk factors in postmenopausal women. Acta Med Iran. 2016;54:370–375.
26. Elisha B, Messier V, Karelis A, et al. The visceral adiposity index: relationship with cardiometabolic risk factors in obese and overweight postmenopausal women-a MONET group study. Appl Physiol Nutr Metab. 2013;38:892–899. doi:10.1139/apnm-2012-0307
27. Chen GP, Qi JC, Wang BY, et al. Applicability of visceral adiposity index in predicting metabolic syndrome in adults with obstructive sleep apnea: a cross-sectional study. BMC Pulm Med. 2016;16:37.
28. Goldani H, Adami FS, Antunes MT, Rosa LH, Fassina P, Quevedo Grave MT, Morelo Dal Bosco S. Applicatility of the visceral adiposity index (VAI) in the prediction of the components of the metabolic syndrome in elderly. Nutr Hosp. 2015;32:1609–1615.
29. Knowles KM, Paiva LL, Sanchez SE, et al. Waist circumference, body mass index, and other measures of adiposity in predicting cardiovascular disease risk factors among Peruvian adults. Int J Hypertens. 2011;2011:931402.
30. Moon S, Park JS, Ahn Y. The cut-off values of triglycerides and glucose index for metabolic syndrome in American and Korean adolescents. J Korean Med Sci. 2017;32:427–433.
31. Ashwell M, Gunn P, Gibson S. Waist-to-height ratio is a better screening tool than waist circumference and BMI for adult cardiometabolic risk factors: systematic review and meta-analysis. Obes Rev. 2012;13:275–286.
32. Hsieh SD, Yoshinaga H. Do people with similar waist circumference share similar health risks irrespective of height? Tohoku J Exp Med. 1999;188:55–60.
33. Bergman RN, Stefanovski D, Buchanan TA, et al. A better index of body adiposity. Obesity (Silver Spring). 2011;19:1083–1089.
34. Chiang JK, Koo M. Lipid accumulation product: a simple and accurate index for predicting metabolic syndrome in Taiwanese people aged 50 and over. BMC Cardiovasc Disord. 2012;12:78.
 © 2019 The Author(s). This work is published and licensed by Dove Medical Press Limited. The full terms of this license are available at https://www.dovepress.com/terms.php and incorporate the Creative Commons Attribution - Non Commercial (unported, v3.0) License.
By accessing the work you hereby accept the Terms. Non-commercial uses of the work are permitted without any further permission from Dove Medical Press Limited, provided the work is properly attributed. For permission for commercial use of this work, please see paragraphs 4.2 and 5 of our Terms.
© 2019 The Author(s). This work is published and licensed by Dove Medical Press Limited. The full terms of this license are available at https://www.dovepress.com/terms.php and incorporate the Creative Commons Attribution - Non Commercial (unported, v3.0) License.
By accessing the work you hereby accept the Terms. Non-commercial uses of the work are permitted without any further permission from Dove Medical Press Limited, provided the work is properly attributed. For permission for commercial use of this work, please see paragraphs 4.2 and 5 of our Terms.