")
Back to Journals » OncoTargets and Therapy » Volume 9
Use of micro-positron emission tomography with 18F-fallypride to measure the levels of dopamine receptor-D2 and 18F-FDG as molecular imaging tracer in the pituitary glands and prolactinomas of Fischer-344 rats
Authors Li P, Gui S, Cao L, Gao H, Bai J, Li C, Zhang Y
Received 8 August 2015
Accepted for publication 24 October 2015
Published 6 April 2016 Volume 2016:9 Pages 2057—2068
DOI https://doi.org/10.2147/OTT.S94057
Checked for plagiarism Yes
Review by Single anonymous peer review
Peer reviewer comments 3
Editor who approved publication: Dr Faris Farassati
Ping Li,1–3,* Songbai Gui,2,* Lei Cao,2 Hua Gao,1 Jiwei Bai,2 Chuzhong Li,1 Yazhuo Zhang1
1Beijing Neurosurgical Institute, 2Department of Neurosurgery, Beijing Tiantan Hospital, Capital Medical University, Beijing, 3Department of Neurosurgery, The Second Affiliated Hospital of Anhui Medical University, Cerebral Vascular Disease Research Center, Anhui Medical University, Hefei, People’s Republic of China
*These authors contributed equally to this work
Abstract: Dopamine receptor-D2 (DRD2) is the most important drug target in prolactinoma. The aim of this current study was to investigate the role of using micro-positron emission tomography (micro-PET) with 18F-fallypride and 18F-fluorodeoxyglucose (18F-FDG) as molecular imaging tracer in the pituitary glands and prolactinomas of Fischer-344 (F344) rats and detect the difference of the levels of DRD2 in the pituitary glands and prolactinomas of F344 rat prolactinoma models. Female F344 rat prolactinoma models were established by subcutaneous administration of 15 mg 17β-estradiol for 8 weeks. The growth of tumors was monitored by the small-animal magnetic resonance imaging and micro-PET. A series of molecular biological experiments were also performed 4 and 6 weeks after pump implantation. The micro-PET molecular imaging with 18F-fallypride revealed a decreased expression of DRD2 in F344 rat prolactinoma models, but the micro-PET molecular imaging with 18F-FDG presented an increased uptake in the prolactinoma compared with the pituitary gland. A decreasing trend of levels of DRD2 in F344 rat prolactinoma models was also detected by molecular biological experiments. From this, we can conclude that micro-PET with 18F-fallypride and 18F-FDG can be used to assess tumorigenesis of the prolactinomas in vivo and molecular imaging detection of DRD2 level in prolactinoma may be an indication of treatment effect in the animal experiment.
Keywords: pituitary prolactin, dopamine agonists, prolactinoma
Introduction
Prolactinomas are the most common hormone-secreting pituitary tumors.1 Dopamine agonists (DAs) are the first-line treatment for prolactinomas, but treatment responses are often variable. The majority of prolactinoma patients treated with DAs respond with a normalization of the pituitary prolactin (PRL) levels and a reduction in tumor volume. However, more than 10% of prolactinoma are resistant to DAs.2,3 Studies of in vitro cell preparations show that the dopamine receptor-D2 (DRD2) of resistant tumors are decreased in number but have normal affinity.4 The PRL secretory cells predominantly express the DRD2.5,6 Evaluation of the DRD2 level in prolactinoma based on molecular imaging could help determine whether drug treatment with DAs is effective or not. But little research has been done to detect the DRD2 level in pituitary tumors by using noninvasive molecular imaging methods.
Positron emission tomography (PET) is a valuable method for the diagnosis and staging of tumorigenesis as well as for monitoring the therapeutic effectiveness of various treatment modalities. One of direct binding probes targeting DRD2/dopamine receptor-D3 imaging agent is 18F-fallypride and one of indirect imaging probes is 18F-fluorodeoxyglucose (18F-FDG). Using 18F-FDG in PET imaging over the last 2 decades increased the detection of incident of the pituitary tumors.7 Among the PET D2/D3 antagonist radioligands, three have been utilized in studies with human subjects and have continued to appear in recent literature. These are 11C-raclopride, 11C-FLB457, and 18F-fallypride;8 18F-fallypride is suitable for studying DRD2/dopamine receptor-D3 in both the human and the nonhuman brain. During the last decade, 18F-fallypride has led to considerable interest from clinical and pharmacological research perspectives.9
The chronic diethylstilbestrol or estrogen treatment induces prolactinoma in rat models. Development of prolactinoma is highly dependent on the rodent strain, with the Fischer-344 (F344) rats being the most susceptible.10 To further elucidate the prolactinoma tumorigenesis, the estrogen-induced F344 rat prolactinoma models were successfully established. Piroli et al11 described that the female F344 rats more easily induced prolactinoma than male F344 rats and female F344 rats implanted with a single 20 mg diethylstilbestrol pellet usually developed pituitary tumors within 30–45 days. Heaney et al12 reported that induced by 17β-estradiol for 4 weeks, all ovariectomized female F344 rats developed prolactinoma, associated with increased PRL messenger RNA (mRNA) levels, pituitary weight, and serum PRL levels.
Our goal in this study was to evaluate the feasibility of 18F-fallypride and 18F-FDG to visualize the distribution and the changed level of DRD2 in F344 rat prolactinoma models compared with the pituitary glands. Small-animal magnetic resonance imaging (MRI) was also used for determining the volume of the prolactinomas in rat models. Polymerase chain reaction (PCR) and Western blot were used to evaluate the mRNA and protein expression of DRD2. Our research will provide basic evidence to the in-depth research in rat prolactinoma models.
Materials and methods
Ethics statement
All experimental protocols followed the National Institutes of Health guidelines for the use and care of animals and were approved by the Institutional Review Board and the Animal Care and Use Committee of Capital Medical University. Animal execution was performed according to Capital Medical University guidelines.
Animals
One hundred 4-week-old female F344 rats (60–70 g of bodyweight) were obtained from Vital River Laboratories (Beijing, People’s Republic of China). The animals were housed under controlled conditions of light (lights on from 7 am to 7 pm) and temperature (20°C–25°C), with water and food available ad libitum. One week later, after all of the rats adapted to the environment, the ovariectomy was performed. Penicillin was administered intramuscularly for 3 days. One week after the surgery and wound healing, the animals underwent chronic estrogen treatment using the following regimen: ALZET osmotic pumps (model 2006, DURECT Corporation, Cupertino, CA, USA) containing 15 mg of 17β-estradiol (Sigma-Aldrich Co., St Louis, MO, USA) in 50% (v/v) glycerol/50% (v/v) dimethylsulfoxide solution were implanted subcutaneously to induce prolactinoma. Control animals were implanted with pumps containing only vehicle. The animals were divided into two groups: 50 rats as control group and 50 rats as tumor group.
MRI scanning
MRI was performed using a 7.0T (Bruker Optik GmbH, Ettlingen, Germany) small-animal MRI machine. On follow-up 4 and 6 weeks after the pump implantations, small-animal MRI was used to detect the growth of the prolactinomas in all rats of tumor and control groups. T1-weighted spin-echo images were obtained in the coronal and sagittal planes at 3 mm sections. T1-weighted-enhanced images were then obtained after tail vein intravenous administration of 100 μL/25 g (rat weight) of Gadospin™ M Gd-DTPA (Miltenyi Biotec, Bergisch Gladbach, Germany) as a contrast-enhanced agent.
18F-fallypride and 18F-FDG synthesis
The PET tracers, 18F-fallypride and 18F-FDG, were prepared by the reaction of 18F with precursors, according to published methods.13,14 The decay corrected radiochemical yield was ~24%; the specific radioactivity was greater than 100 TBq/mmol at the moment of injection, and the radiochemical purity was greater than 98%. The 18F-fallypride and 18F-FDG solutions had a pH of 6.0–7.0.
PET scanning
On follow-up 4 and 6 weeks after the pump implantations, the pituitary masses had substantially increased in size. PET was performed at the same time intervals using 18F-fallypride, which targets to DRD2 mainly expressed in pituitary and prolactinoma. In addition, 18F-FDG PET imaging monitoring in the two groups was performed next day.
According to the groups, all rats were fasted for more than 2 hours prior to the test. PET was performed using a micro-PET scanner (Inveon; Siemens, Munich, Germany) that was equipped with a micro-PET Manager for data acquisition in a list mode and ASI Pro VM™ software for preparing sinograms and image construction. Thirty minutes after tail vein injections of 0.5 to 0.6 mCi of 18F-fallypride or 18F-FDG, images were obtained using the small-animal PET scanner with a 10-minute emission scan. Two experienced nuclear medicine doctors evaluated the 18F-fallypride and 18F-FDG PET images on a high-resolution computer screen. Regions of interest were also drawn over the pituitary in the control group and the prolactinoma in the tumor group. For quantitative analysis, regions of interests on the micro-PET images were drawn by a single individual to minimize variation in region selection. Tracer uptake was expressed as percentage of injected radioactivity dose per gram of tissue (%ID/g).
Experimental protocol and preparation of tissues
At the interval of 4 or 6 weeks, female F344 rats were anesthetized by intraperitoneal injection using 10% chloral hydrate 400 mg/kg in each group. Then, the tail vein blood was collected, and the serum was separated by centrifugation and stored at −80°C until the measurement of serum PRL and the pituitary tissue was removed, weighed, measured, and photographed. Each group had ten rats’ fresh pituitary glands that were carefully isolated and kept in liquid nitrogen until the rest of the PCR (n=10 in each group at one time interval of 4 weeks (Ws)/6Ws) and Western blot procedures (n=10 in each group at one time interval of 4Ws/6Ws). Another five rats in each group were executed, and the specimen of pituitary or tumor was collected for paraffin sections and frozen sections (n=5 in each group at one time interval of 4Ws/6Ws).
Measurement of PRL in rat serum
Rat serum PRL concentrations were determined using an ELISA kit (Pulilai, Beijing, People’s Republic of China) based on the double antibody method. The lower limit of the assay sensitivity was 1.0 ng/mL. Inter- and intra-assay coefficients of variations were both less than 10%.
Reticular fiber staining, hematoxylin and eosin staining, and VEGF immunohistochemistry staining
Paraffin-embedded F344 rat pituitary tissues were cut into sections that were routinely stained with hematoxylin and eosin staining by using the hematoxylin and eosin staining kit (Beijing Yili Fine Chemicals Co. Ltd., Beijing, People’s Republic of China), reticular fiber staining (Beijing Yili Fine Chemicals Co. Ltd.), and vascular endothelial growth factor (VEGF) immunohistochemistry staining (VEGF antibody, ab46154; Abcam, Cambridge, UK). Then, the sections were observed under a Nikon inverted microscope. Then, magnification 400× fields were used to compare the differences between the control and tumor groups.
Immunofluorescence
The DRD2 and PRL expression of the pituitary glands and the prolactinomas was analyzed using immunofluorescence (PRL antibody, 1:400, Santa Cruz Biotechnology, Inc., Dallas, TX, USA; DRD2 antibody, 1:100, ab32349, Abcam). Sections were examined on a fluorescence microscopy (Leica, Heidelberg, Germany) and a C1 Plan Apo ×63/5 oil confocal laser scanning system, LSM 510 META (Leica).
Quantitative real-time PCR
Total RNA was extracted from pituitary tissue using Trizol (Thermo Fisher Scientific, Waltham, MA, USA) according to the manufacturer’s recommendations. For this experiment, 4 μg of total RNA was treated with an M-MLV reverse transcription kit (Thermo Fisher Scientific) according to the manufacturer’s recommendations. cDNA was diluted with DRD2 Taqman® gene expression assay (ID: Rn00561126_m1, DRD2, Thermo Fisher Scientific), RNAse-free water, and Taqman® gene expression Master Mix (P/N 4369016, Thermo Fisher Scientific) using an ABI 7500 HT Real-Time PCR System (Thermo Fisher Scientific) according to the manufacturer’s recommendations. PCR was amplified in duplicates and three independent experiments using a Glyceraldehyde-3-Phosphate Dehydrogenase (GAPDH) Taqman® gene expression assay (ID: Rn01775763_g1, GAPDH, Thermo Fisher Scientific) as endogenous controls. PCR amplification was performed in 96-well optical reaction plates for 40 cycles, with each cycle at 95°C for 15 seconds and 60°C for 1 minute. Fold changes were calculated using the 2−ΔΔCt method.
Western blot
The pituitary tissue was washed once in phosphate-buffered saline and lysed in RIPA lysis buffer. The pituitary tissue samples from the rat tumor and the control groups were cut into small pieces and homogenized in 100 μL lysis buffer containing protease inhibitors (Pulilai). The concentration of protein was determined by BCA (Pierce, Rockford, IL, USA). Aliquots (40 μg) were separated on a 10% sodium dodecyl sulfate polyacrylamide gel electrophoresis and transferred to polyvinylidene fluoride membranes. The nonspecific binding of immunoproteins was blocked with 5% nonfat dry milk for 1 hour at room temperature. After blocking, the membranes were incubated with primary antibodies overnight at 4°C. The primary antibody that recognizes DRD2 was ab32349 (1:1,000), an anti-DRD2 antibody purchased from Abcam. The membrane was rinsed in Tris-buffered saline containing 0.1% polysorbate 20 minutes followed by 1 hour of incubation with horseradish peroxidase-conjugated secondary antibody (rabbit antigoat IgG) at room temperature. An enhanced chemiluminescence detection solution was applied (Santa Cruz Biotechnology, Inc.). The protein bands were visualized on X-ray films. The optical density of the protein bands was quantified using ImageJ (National Institutes of Health, Bethesda, MD, USA) and standardized to GAPDH (1:1,000, Sigma-Aldrich Co.).
Statistical analysis
The results are expressed as the mean ± standard deviations. All the tests were performed in triplicate and repeated three times. Statistical analyses were performed using one-way analysis of variance or the Student’s t-test. A level of P<0.05 was considered to be statistically significant (SPSS Inc., 17.0, Chicago, IL, USA).
Results
Tumor visualization of MR imaging
In our study, 17β-estradiol-induced prolactinoma developed in 100% of the female F344 rats. Tumors were clearly visible on the MRI scans (Figure 1). Four weeks after subcutaneously implanted the capsule, it can be seen that the prolactinomas were obviously larger than the normal pituitary, and the surrounding brain tissues were oppressed by the tumor (Figure 1A and B). Six weeks later, the prolactinomas grew rapidly, and the MR imaging revealed that the prolactinoma were much bigger (Figure 1C). With stimulation for 8 weeks, pituitary apoplexy developed in some cases (Figure 1D), and the incidence of pituitary apoplexy was high (70%). We also performed imaging in the control and tumor groups by using Gadospin™ M Gd-DTPA contrast-enhanced agent. As shown in Figure 2, the larger pituitary tumors were clearly enhanced with the same condition that tumors at 6 weeks (Figure 2C) were much larger than the tumors at 4 weeks (Figure 2B) and normal pituitary (Figure 2A).
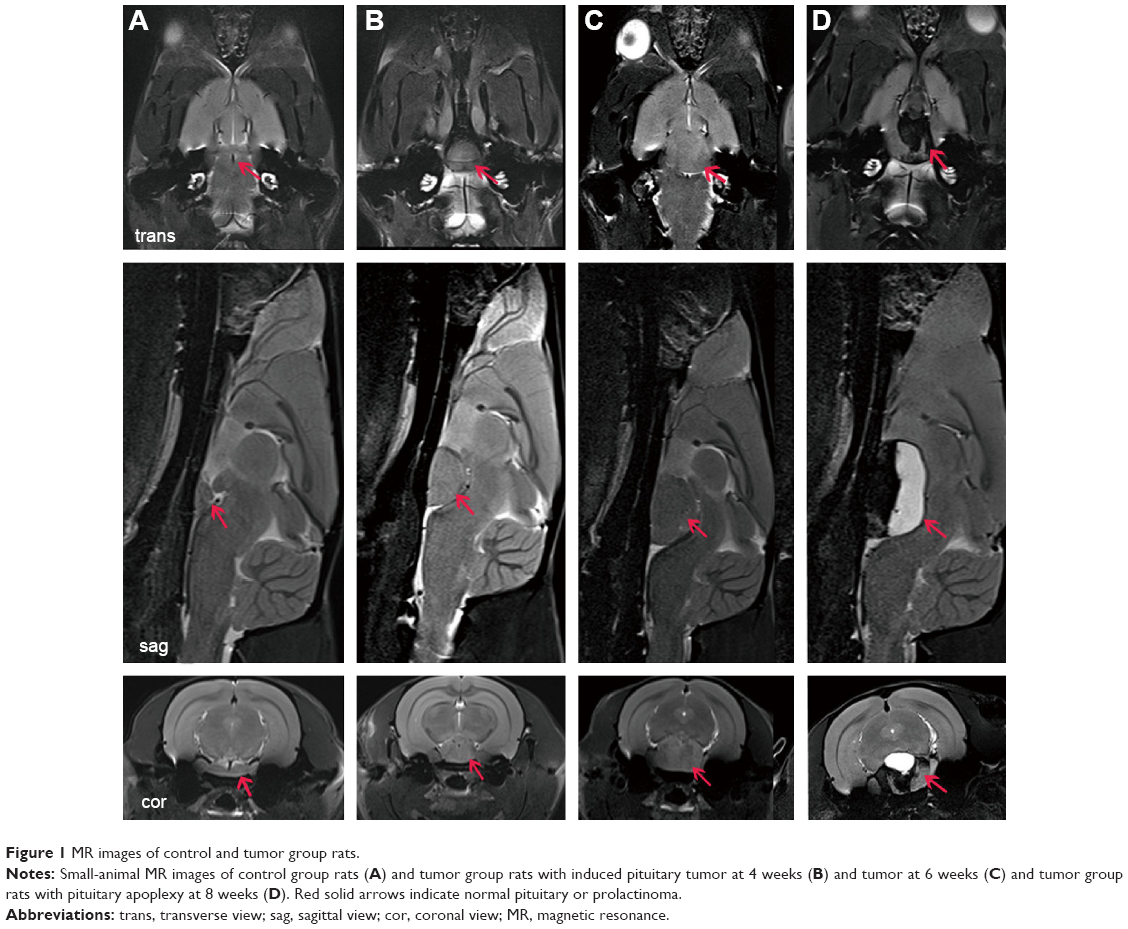 | Figure 1 MR images of control and tumor group rats. |
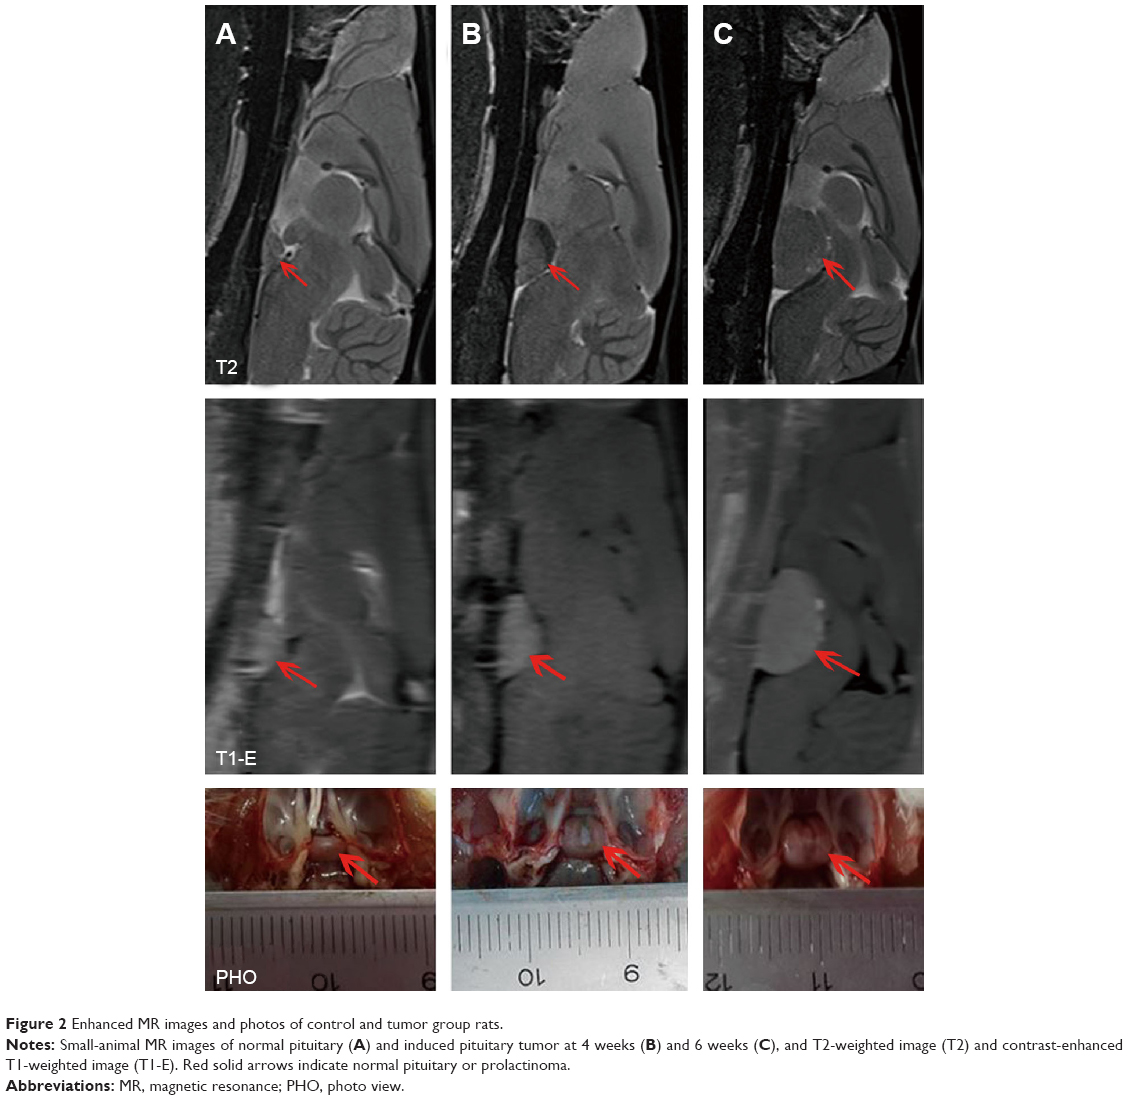 | Figure 2 Enhanced MR images and photos of control and tumor group rats. |
Uptake of 18F-fallypride and 18F-FDG in female F344 rats between control and tumor groups
Based on the imaging data and statistical analysis, when the prolactinomas were successfully induced, the volume of the rats’ prolactinomas in 4 and 6 weeks was larger than that of the controls. The 18F-fallypride is a molecular imaging tracing agent that targets to DRD2. Based on the 18F-fallypride PET imaging, the SUVmax of the DRD2 in the pituitary regions of interest of the control group (Figure 3A) was higher than that of the tumor group at 4 and 6 weeks (Figure 3B and C). This indicates that the expression of DRD2 decreased with the prolactinomas induced by 17β-estradiol. Based on the 18F-FDG imaging (Figure 4), the %ID/g in the tumor groups at 6 weeks was significantly higher than the control, which indicates that the metabolism and blood perfusion were high in the rat prolactinoma models, but it is not statistically significant between the control group and tumors at 4 weeks (P>0.05). The statistical analysis of the %ID/g in different groups and with different tracer agents is summarized in Figure 5, and a value of P<0.05 was considered to be statistically significant.
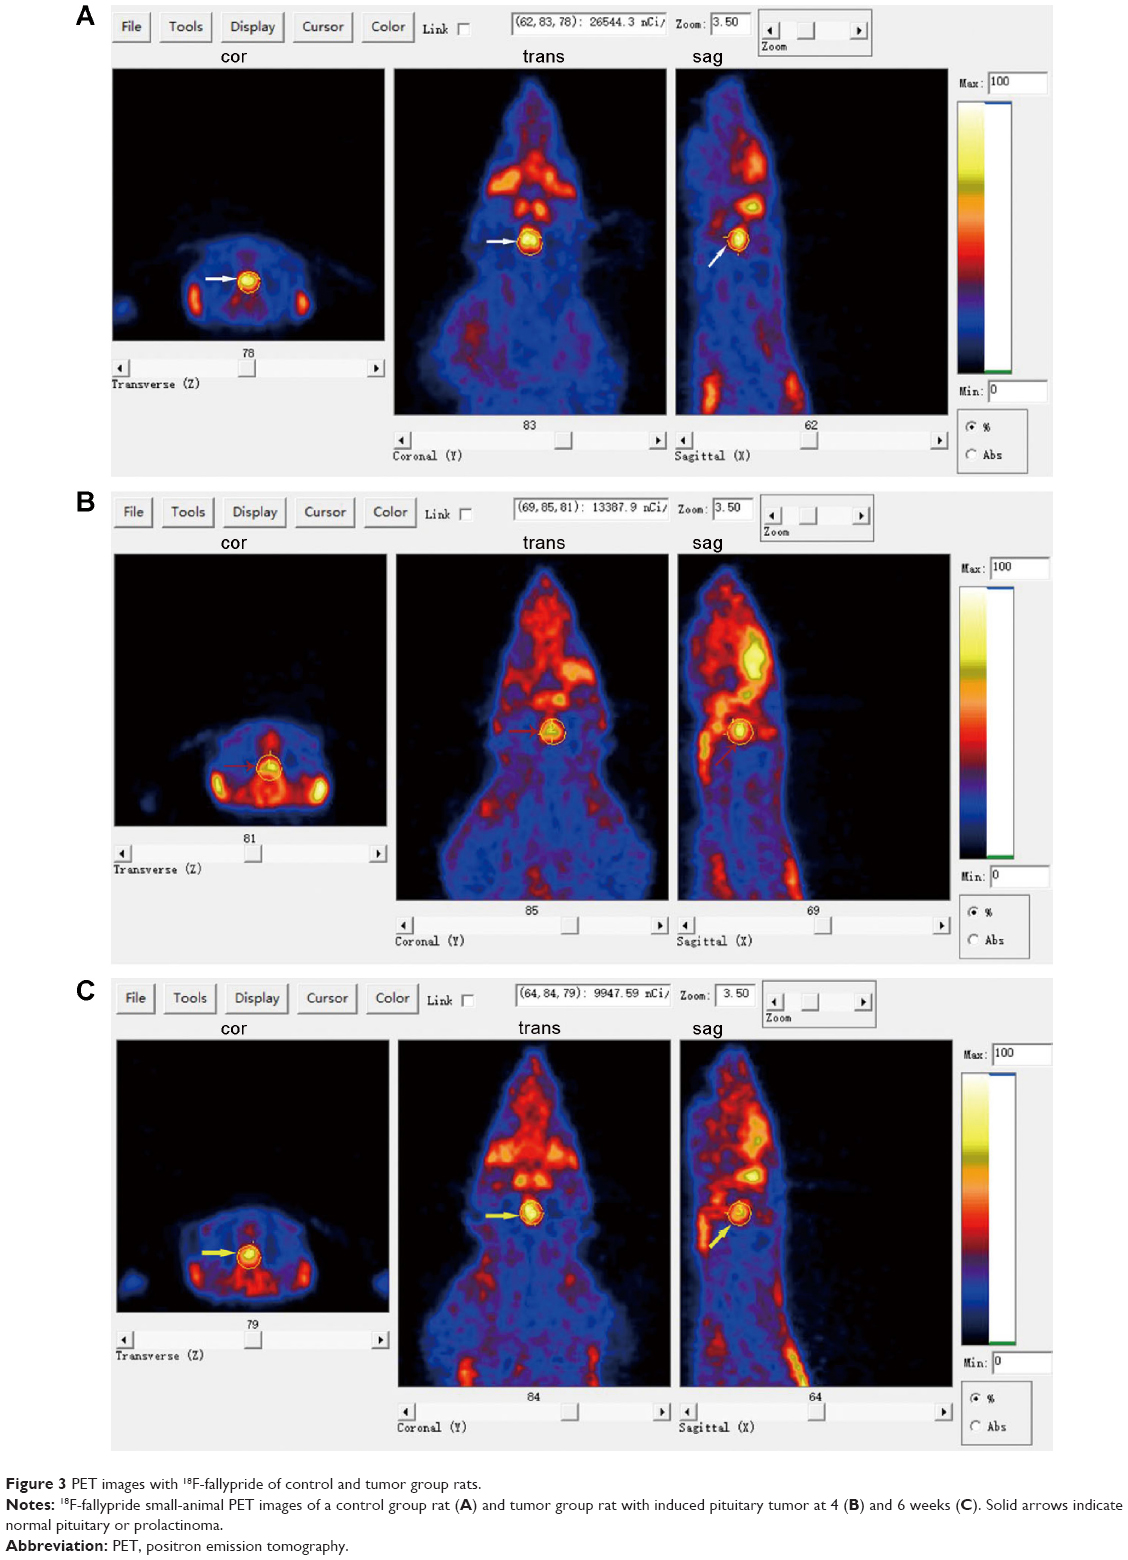 | Figure 3 PET images with 18F-fallypride of control and tumor group rats. |
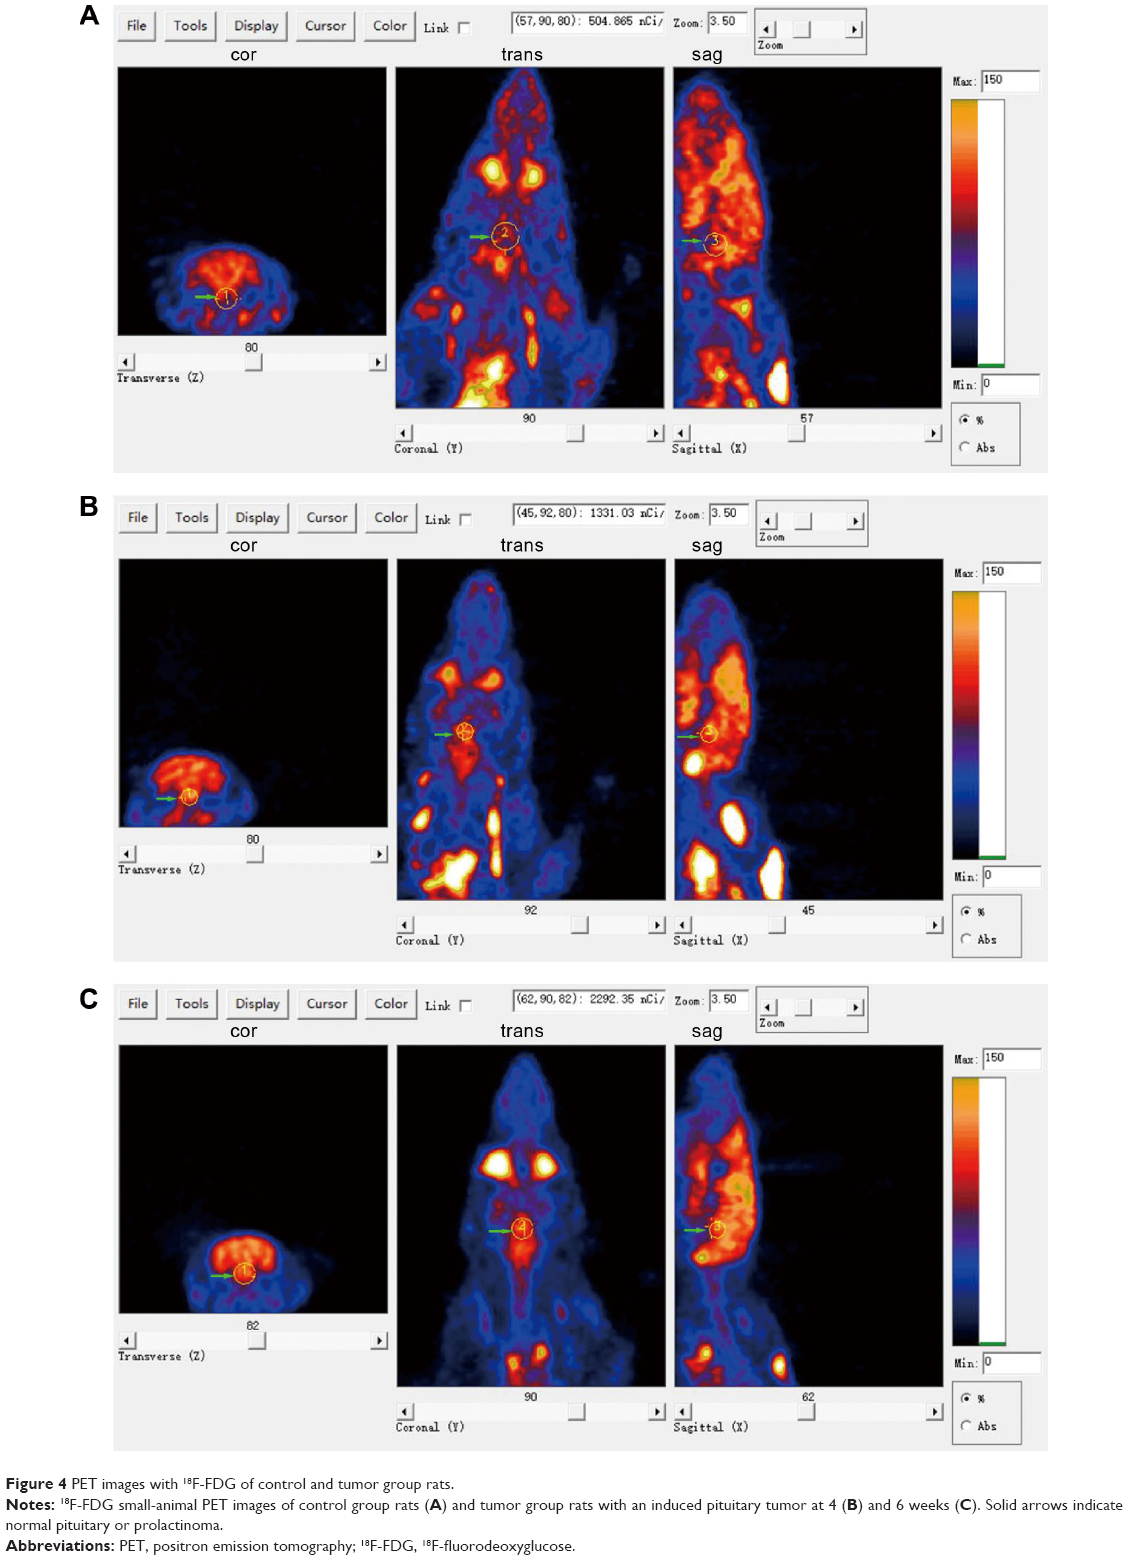 | Figure 4 PET images with 18F-FDG of control and tumor group rats. |
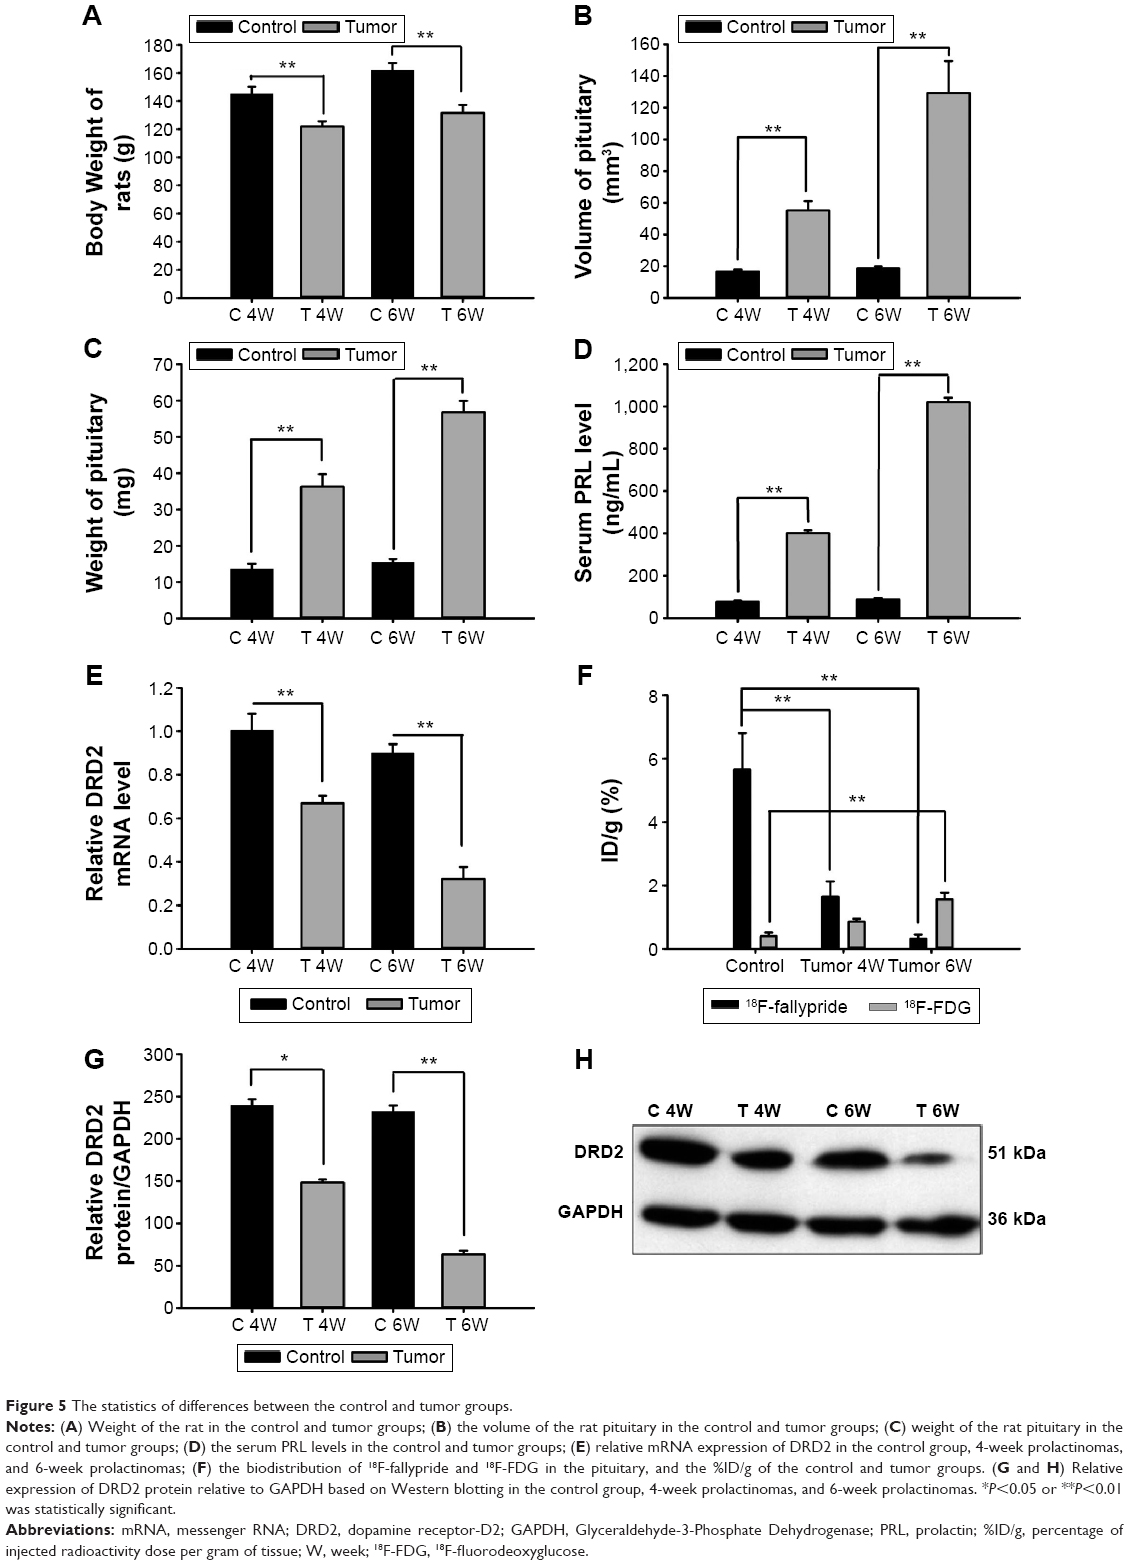 | Figure 5 The statistics of differences between the control and tumor groups. |
The different histology, immunofluorescence, and serum PRL levels between the control and tumor groups
The hematoxylin and eosin staining results are shown in Figure 6A. The control group displayed cord-like arrangement of the groups of pituitary gland cells and sinus-like capillaries. Eosinophils are more numerous, larger, and had round nuclei and red-stained cytoplasm. In the experimental group, the pituitary tumor cells have abnormal morphology, disordered structure, differed in shape and size, and exhibited nuclear atypia, with unclear nuclear staining and structure, and violet-stained cytoplasm. The reticular fiber staining shows (Figure 6B): the control group display clear and complete reticular fibers, pituitary tumor cells of the tumor group have unclear and incomplete reticular fibers and the reticular fibers are fewer in number. Figure 6C shows the expression of VEGF is higher in the tumor groups than the control, and the VEGF expression in the 6-week tumor group is higher than that in the 4-week group.
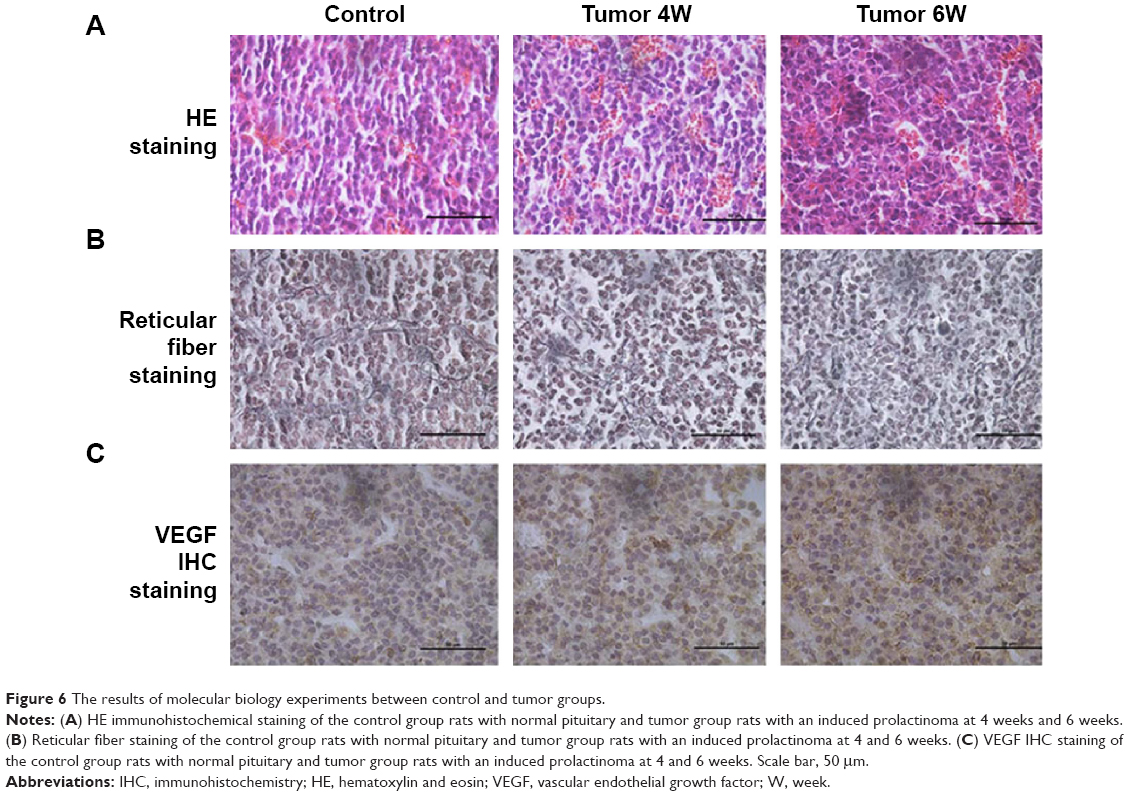 | Figure 6 The results of molecular biology experiments between control and tumor groups. |
The immunofluorescent staining confirmed the downregulation of DRD2 and PRL in the rats’ prolactinomas. As shown in Figure 7A and C, high DRD2 expression was observed in the cells from the normal pituitary, whereas low DRD2 expression was observed in the rats’ prolactinoma cells. Distinct differences of the DRD2 immunofluorescent staining were found between the control group and 6-week tumor group. Figure 7B and D shows that a high PRL expression was observed in the cells from the prolactinoma. The level of serum PRL was measured by using ELISA 4 and 6 weeks after 17β-estradiol induction. Figure 5D shows the serum PRL level was significantly increased compared to the control group and obviously a difference was found between the 4- and 6-week tumor group. The serum PRL level results of the ELISA were consistent with the immunofluorescence analysis.
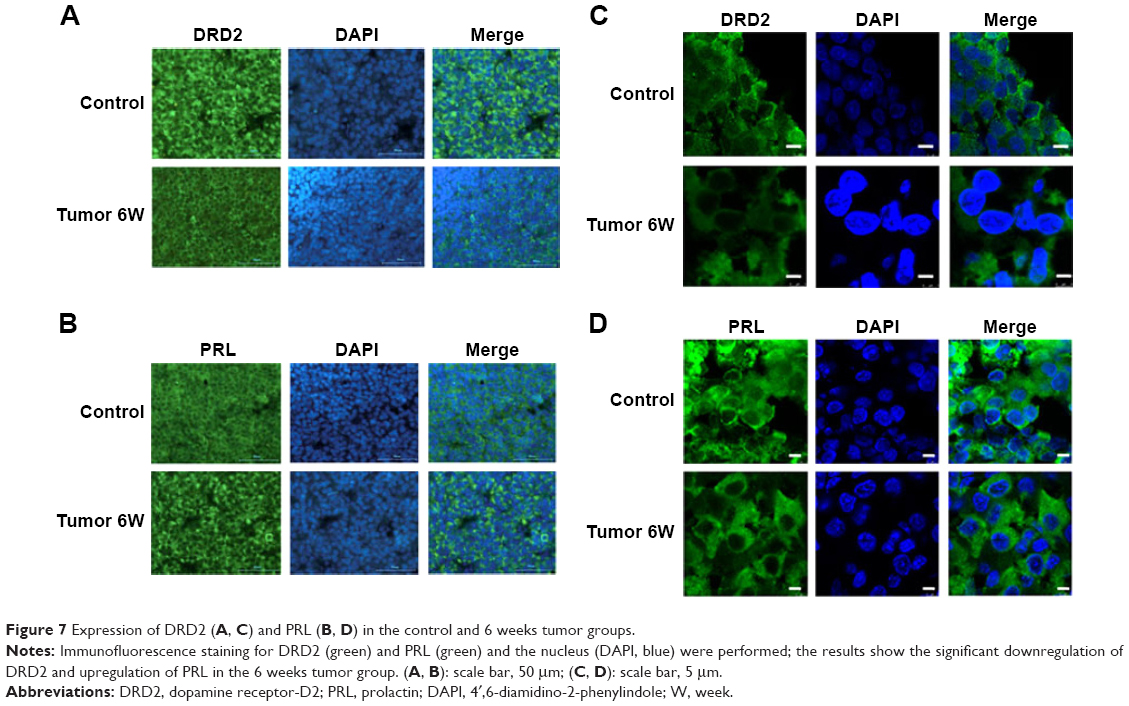 | Figure 7 Expression of DRD2 (A, C) and PRL (B, D) in the control and 6 weeks tumor groups. |
Control rats exhibited shiny fur, body hypertrophy, and good appetite. Experimental rats were small in size, slim, had dull fur, and displayed hair removal behavior and poor appetite. We can conclude that chronic 17β-estradiol stimulation lowered the growth rate in rats. The average weights of the different groups were statistically analyzed as shown in Figure 5A. Pituitary volume and weight changed as shown in Figure 5B and C.
The results of PCR and Western blot detection
We also detected the DRD2 mRNA levels by real-time PCR analysis of normal pituitary gland and prolactinoma; they were significantly lower in the prolactinoma (Figure 5E) whereas there is no significant difference between the tumor groups at 4 and 6 weeks. In addition, the DRD2 protein levels in the prolactinoma were significantly decreased compared to the control group. These findings showed that 17β-estradiol-induced DRD2 downregulated in prolactinomas (Figure 5G and H). The PCR and Western blot results further confirmed that 17β-estradiol induces prolactinoma in female F344 rats and suppresses DRD2 expression through specific molecular mechanisms.
Discussion
In this study, we have successfully established F344 rat prolactinoma models with MRI monitoring. After 17β-estradiol treatment for 6 weeks, the tumor weight, tumor volume, and serum PRL level increased obviously. Our data show a decreasing trend of the DRD2 level with gradually inducing prolactinoma in F344 rat prolactinoma models. We also have demonstrated that small-animal PET with 18F-fallypride and 18F-FDG can be used to obtain nonbiased results with expression of DRD2 and evaluate the tumorigenesis of prolactinoma in vivo. There is some potential correlation between in vitro and in vivo measurements of DRD2. We detected the level of DRD2 is lower in prolactinoma of F344 rat prolactinoma model than in normal pituitary of F344 rats by using molecular imaging technique in vivo, and the results was consistent with the detected level of DRD2 by using PCR and Western blot methods. Bodei et al15 did much research about the in vivo and in vitro detection of DRD2 in uveal melanomas, and the results of in vivo scintigraphy were in line with immunohistochemical evidence of DRD2 expression in tumor samples too.
DRD2 is mainly expressed in pituitary lactotrophs where they are involved in the inhibition of PRL release and synthesis and lactotroph proliferation.16,17 Furthermore, the level of DRD2 in the prolactinoma of estrogen-induced F344 rat prolactinoma models was decreasing significantly which was measured by using PCR and Western blot methods. These observations suggest a physiologically relevant molecular mechanism by which circulating sex hormones could modulate the DRD2 level in the pituitary.18,19 Several dopaminergic mechanisms may contribute to the experience of action–effect associations.20
In the Drd2−/− mouse, the expected phenotype of chronic hyperprolactinemia and prolactinoma development was observed, and this model proved to be valuable for studying dopamine-resistant prolactinomas where angiogenic contribute to prolactinoma development.21 The treatment of prolactinoma with DAs is partly efficacious and many studies have shown that the DRD2 expression level correlates well with the clinical response to DAs treatment in prolactinomas.22
MRI revealed a focal-enhanced mass extending over the pituitary gland, but changes were observed after 4 and 6 weeks of 17β-estradiol inducing. PET scan was performed and showed less uptake of 18F-fallypride and more uptake of 18F-FDG in tumor groups compared to the control group. We found that the tumor vessels were increasing with the 17β-estradiol-induced prolactinoma successfully, and the uptake of 18F-FDG in prolactinomas was increased, but the uptake of 18F-fallypride in prolactinoma declined.
In the pituitary, 18F-fallypride is an effective molecular imaging tracing agent that targets to DRD2 in pituitary diseases. PET imaging with 18F-FDG, an analog of glucose, tracks the glucose metabolism of tissues. The integral role of 18F-FDG-PET in oncology is indisputable.23 Small-animal PET and small-animal MRI were useful in evaluating and monitoring the tumorigenesis. Ramakrishnan et al7 demonstrated that spontaneous pituitary tumors in aged rats can be detected and distinguished from normal pituitary and brain using small-animal PET imaging with the σ-1 ligand, 11C-SA4503. With the development of high-affinity radioligands such as 11C-FLB457, 18F-desmethoxyfallypride, 18F-fallypride, and the radioligand 11C-Raclopride that have been the most widely used for binding to the DRD2/dopamine receptor-D3,24 it has become possible to noninvasively quantify extrastriatal DRD2/dopamine receptor-D3 densities during pharmacologic and nonpharmacologic paradigms.
Muhr et al25 and Muhr and Bergstrom26 performed PET studies with 11C-labeled dopamine D2 antagonists such as 11C-N-raclopride and 11C-N-methylspiperone for the in vivo measurement of D2 receptors in prolactinomas and growth hormone-secreting pituitary adenomas. They have demonstrated higher dopamine receptor binding in patients who are responsive to DAs than in therapy-resistant patients. Abi-Dargham et al27 indicated that using 123I-IBZM-SPECT could provide direct evidence of increased stimulation of DRD2 by dopamine in schizophrenia, and measuring DRD2 in patients with schizophrenia could be done using radiotracers that are either sensitive 11C-raclopride or insensitive 11C-N-methylspiperone. The introduction of newer and more receptor-specific radioligands may expand the clinical use of these techniques in the future. The availability of PET for the clinical diagnosis of pituitary tumors is still limited, but promising results have been described.
In the field of nuclear medicine, PET techniques have become available for the study of dopamine receptors, estrogen receptors, and somatostatin receptor subtype expression in many diseases. 18F-fallypride targets to D2/D3 receptors in vivo, so it could be seen widely in distribution. Not only extrastriatal, but also striatal D2/D3 receptor densities can be visualized with 18F-fallypride as a radiotracer for PET studies. But there is mainly DRD2 in the pituitary and prolactinoma; this study provides direct in vivo evidence that 18F-fallypride could be used to detect the level of DRD2 in normal pituitary and prolactinoma in animal experiments or preclinical tests. 18F-fallypride has potential value in the assessment of patients who have DAs resistance due to low levels of DRD2 in the prolactinoma.
18F-FDG is the most commonly used radioactive tracer worldwide. When 18F-FDG is administered systemically, it is accessible to essentially all tissues. As an isomer of glucose, it is usually absorbed and transported into the brain.28 In F344 rat prolactinoma models, there is more uptake of 18F-FDG in prolactinoma compared to the normal pituitary; it was consistent with the VEGF immunohistochemistry staining results. In the clinical applications, 18F-FDG was used to detect tumors in the whole human body. Conversely, another PET tracer 68Ga DOTATATE has a high affinity to somatostatin receptors, and 18F-fallypride mainly has a high affinity to DRD2 in pituitary as well. Zhao et al29 indicated that combination of 18F-FDG and 68Ga DOTATATE PET imaging is potentially valuable in the delineation between recurrent or residual pituitary adenoma and the remaining normal pituitary tissue after transsphenoidal adenomectomy. From what was mentioned above, we could predict that PET with 18F-fallypride and 18F-FDG is potentially valuable in assessing the tumorigenesis of the prolactinoma in vivo as well. Our research will provide basic evidence to the in-depth research in rat prolactinoma models, and probably could provide evidence to clinical applications in the future.
Conclusion
The negative modulation of DRD2 expression and the positive action on hyperprolactinemia in the serum by estrogen revealed the complex estrogen regulation in F344 rat prolactinoma models. PET with 18F-fallypride and 18F-FDG in assessing the tumorigenesis of the prolactinomas in vivo may be worthwhile. This method may be potentially useful for diseases associated with DRD2 and the detection of DRD2 level in prolactinoma could be an indication of chemotherapy treatment. We could predict that “noninvasive molecular imaging” like “molecular markers” will become widely and properly used in research and medicine, and benefit humanity in the future.
Acknowledgments
This work was supported by the National Natural Science Foundation of China (No 81271627), the Anhui Provincial Natural Science Foundation (No 1308085QH151), and the Beijing Natural Science Foundation (No 7144198).
Disclosure
The authors report no conflicts of interest in this work.
References
Jiang X, Zhang X. The molecular pathogenesis of pituitary adenomas: an update. Endocrinol Metab (Seoul). 2013;28(4):245–254. | ||
Oh MC, Aghi MK. Dopamine agonist-resistant prolactinomas. J Neurosurg. 2011;114(5):1369–1379. | ||
Klibanski A. Dopamine agonist therapy in prolactinomas: when can treatment be discontinued? J Clin Endocrinol Metab. 2009;94(7):2247–2249. | ||
Molitch ME. Dopamine resistance of prolactinomas. Pituitary. 2003;6(1):19–27. | ||
Colao A, di Sarno A, Pivonello R, di Somma C, Lombardi G. Dopamine receptor agonists for treating prolactinomas. Expert Opin Investig Drugs. 2002;11(6):787–800. | ||
Gatto F, Hofland LJ. The role of somatostatin and dopamine D2 receptors in endocrine tumors. Endocr Relat Cancer. 2011;18(6):R233–R251. | ||
Ramakrishnan NK, Rybczynska AA, Visser AK, et al. Small-animal PET with a sigma-ligand, 11C-SA4503, detects spontaneous pituitary tumors in aged rats. J Nucl Med. 2013;54(8):1377–1383. | ||
Mukherjee J, Yang ZY, Das MK, Brown T. Fluorinated benzamide neuroleptics – III. Development of (S)-N-[(1-allyl-2-pyrrolidinyl)methyl]-5-(3-[18F]fluoropropyl)-2, 3-dimethoxybenzamide as an improved dopamine D-2 receptor tracer. Nucl Med Biol. 1995;22(3): 283–296. | ||
Millet P, Moulin-Sallanon M, Tournier BB, et al. Quantification of dopamine D(2/3) receptors in rat brain using factor analysis corrected [18F]Fallypride images. Neuroimage. 2012;62(3):1455–1468. | ||
Wiklund J, Wertz N, Gorski J. A comparison of estrogen effects on uterine and pituitary growth and prolactin synthesis in F344 and Holtzman rats. Endocrinology. 1981;109(5):1700–1707. | ||
Piroli GG, Pietranera L, Grillo CA, De Nicola AF. Gender differences in the expression of galanin and vasoactive intestinal peptide in oestrogen-induced prolactinomas of Fischer 344 rats. J Neuroendocrinol. 2004;16(1):64–71. | ||
Heaney AP, Horwitz GA, Wang Z, Singson R, Melmed S. Early involvement of estrogen-induced pituitary tumor transforming gene and fibroblast growth factor expression in prolactinoma pathogenesis. Nat Med. 1999;5(11):1317–1321. | ||
Zhou GJ, Jiang SY, Zhang M, Gan JX, Jiang GY. Evaluation of the inflammatory response in a two-hit acute lung injury model using [F]FDG microPET. Exp Ther Med. 2013;6(4):894–898. | ||
Wang MW, Lin WY, Liu K, Masterman-Smith M, Kwang-Fu Shen C. Microfluidics for positron emission tomography probe development. Mol Imaging. 2010;9(4):175–191. | ||
Bodei L, Hofland LJ, Ferone D, et al. In vivo and in vitro detection of dopamine d2 receptors in uveal melanomas. Cancer Biother Radiopharm. 2003;18(6):895–902. | ||
Recouvreux MV, Guida MC, Rifkin DB, Becu-Villalobos D, Diaz-Torga G. Active and total transforming growth factor-beta1 are differentially regulated by dopamine and estradiol in the pituitary. Endocrinology. 2011;152(7):2722–2730. | ||
Schuff KG, Hentges ST, Kelly MA, et al. Lack of prolactin receptor signaling in mice results in lactotroph proliferation and prolactinomas by dopamine-dependent and -independent mechanisms. J Clin Invest. 2002;110(7):973–981. | ||
Sengupta A, Sarkar DK. Estrogen inhibits D2S receptor-regulated Gi3 and Gs protein interactions to stimulate prolactin production and cell proliferation in lactotropic cells. J Endocrinol. 2012;214(1):67–78. | ||
Levavi-Sivan B, Biran J, Fireman E. Sex steroids are involved in the regulation of gonadotropin-releasing hormone and dopamine D2 receptors in female tilapia pituitary. Biol Reprod. 2006;75(4):642–650. | ||
Moore JW, Schneider SA, Schwingenschuh P, et al. Dopaminergic medication boosts action-effect binding in Parkinson’s disease. Neuropsychologia. 2010;48(4):1125–1132. | ||
Garcia-Tornadu I, Perez-Millan MI, Recouvreux V, et al. New insights into the endocrine and metabolic roles of dopamine D2 receptors gained from the Drd2 mouse. Neuroendocrinology. 2010;92(4):207–214. | ||
Filopanti M, Lania AG, Spada A. Pharmacogenetics of D2 dopamine receptor gene in prolactin-secreting pituitary adenomas. Expert Opin Drug Metab Toxicol. 2010;6(1):43–53. | ||
Ozturk H, Karapolat I. Efficacy of F-fluorodeoxyglucose-positron emission tomography/computed tomography in restaging muscle-invasive bladder cancer following radical cystectomy. Exp Ther Med. 2015;9(3):717–724. | ||
Nord M, Farde L. Antipsychotic occupancy of dopamine receptors in schizophrenia. CNS Neurosci Ther. 2011;17(2):97–103. | ||
Muhr C, Bergstrom M, Lundberg PO, et al. Dopamine receptors in pituitary adenomas: PET visualization with 11C-N-methylspiperone. J Comput Assist Tomogr. 1986;10(2):175–180. | ||
Muhr C, Bergstrom M. Positron emission tomography applied in the study of pituitary adenomas. J Endocrinol Invest. 1991;14(6):509–528. | ||
Abi-Dargham A, Rodenhiser J, Printz D, et al. Increased baseline occupancy of D2 receptors by dopamine in schizophrenia. Proc Natl Acad Sci U S A. 2000;97(14):8104–8109. | ||
Luo M, Li Q, Dong W, Zhai X, Kang L. Evaluation of mild hypothermia therapy for neonatal hypoxic-ischaemic encephalopathy on brain energy metabolism using F-fluorodeoxyglucose positron emission computed tomography. Exp Ther Med. 2014;8(4):1219–1224. | ||
Zhao X, Xiao J, Xing B, et al. Comparison of 68Ga DOTATATE to 18F-FDG uptake is useful in the differentiation of residual or recurrent pituitary adenoma from the remaining pituitary tissue after transsphenoidal adenomectomy. Clin Nucl Med. 2014;39(7):605–608. |
 © 2016 The Author(s). This work is published and licensed by Dove Medical Press Limited. The full terms of this license are available at https://www.dovepress.com/terms.php and incorporate the Creative Commons Attribution - Non Commercial (unported, v3.0) License.
By accessing the work you hereby accept the Terms. Non-commercial uses of the work are permitted without any further permission from Dove Medical Press Limited, provided the work is properly attributed. For permission for commercial use of this work, please see paragraphs 4.2 and 5 of our Terms.
© 2016 The Author(s). This work is published and licensed by Dove Medical Press Limited. The full terms of this license are available at https://www.dovepress.com/terms.php and incorporate the Creative Commons Attribution - Non Commercial (unported, v3.0) License.
By accessing the work you hereby accept the Terms. Non-commercial uses of the work are permitted without any further permission from Dove Medical Press Limited, provided the work is properly attributed. For permission for commercial use of this work, please see paragraphs 4.2 and 5 of our Terms.