")
Back to Journals » OncoTargets and Therapy » Volume 13
URM1 Promoted Tumor Growth and Suppressed Apoptosis via the JNK Signaling Pathway in Hepatocellular Carcinoma
Authors Cheng X , Zhang Y, Song F, Song F, Gao C , Liang X , Wang F, Chen Z
Received 23 April 2020
Accepted for publication 15 July 2020
Published 12 August 2020 Volume 2020:13 Pages 8011—8025
DOI https://doi.org/10.2147/OTT.S258843
Checked for plagiarism Yes
Review by Single anonymous peer review
Peer reviewer comments 2
Editor who approved publication: Dr Sanjeev K. Srivastava
Xin Cheng,1,2,* Yu Zhang,1,2,* Fei Song,1,2 Fengliang Song,1,2 Cheng Gao,1,2 Xiaoliang Liang,1,2 Feiran Wang,1,2 Zhong Chen1
1Department of Hepatobiliary Surgery, Affiliated Hospital of Nantong University, Nantong 226001, People’s Republic of China; 2Medical College of Nantong University, Nantong 226001, People’s Republic of China
*These authors contributed equally to this work
Correspondence: Zhong Chen Department of Hepatobiliary Surgery
Affiliated Hospital of Nantong University, No. 20 Xisi Road, Nantong 226001, People’s Republic of China
Email [email protected]
Objective: Ubiquitin-related modifier 1 (URM1) is a member of the ubiquitin-like regulator family, which acts as a post-translational protein modifier in the oxidative emergency response mechanism. Previous studies have shown that URM1 may be involved in the process of apoptosis and may play a role in JNK signaling pathway. In this study, we aimed to investigate the role and possible mechanism of URM1 in HCC progression.
Patients and Methods: Expression of URM1 was determined in 90 pairs of matched liver cancer and adjacent non-cancerous tissues by immunohistochemistry. The impacts of URM1 on HCC cell proliferation, apoptosis, migration and invasion capacities were verified by CCK-8, colony formation, TUNEL staining, wound healing assay and transwell, respectively. Then, the effect of URM1 on subcutaneous tumor formation in vitro was explored by nude mouse xenograft model of liver cancer. Finally, the expression of apoptosis-related proteins was analyzed in URM1 knockdown samples by Western blotting.
Results: In this study, compared with paired adjacent non-cancerous tissues, the expression of URM1 was higher in liver cancer tissues (P < 0.01). Kaplan–Meier survival analysis showed that high URM1 expression was significantly associated with poor prognosis (P < 0.05). Moreover, URM1 knockdown inhibited liver cancer cell proliferation and migration. Furthermore, URM1 knockdown promoted apoptosis of liver cancer cells. At the same time, URM1 knockdown inhibited tumor growth in nude mouse xenograft model of liver cancer. In addition, URM1 knockdown downregulated the expression of the apoptosis-related factors JNK1/2 and TP53 and upregulated the phosphorylation of JNK1/2 and P53.
Conclusion: In summary, our results suggested that URM1 expression is increased in liver cancer tissues, and URM1 knockdown inhibits the proliferation and migration of liver cancer cells and accelerates apoptosis. High URM1 expression is associated with poor prognosis in patients with HCC.
Keywords: hepatocellular carcinoma, URM1, proliferation, migration, apoptosis, JNK signaling pathway
Introduction
Hepatocellular carcinoma (HCC) is the most common pathological type of primary liver cancer. According to the latest world cancer statistics, HCC is the fifth most common cancer in men and the seventh most common cancer in women. It is ranked third among cancer-related causes of death worldwide.1–3 Currently, the most effective treatment for HCC is surgical resection and liver transplantation, but the 5-year survival rate of patients is still low.4 The occurrence of HCC is a multi-gene, multi-step complex process, which is based on the accumulated effects of oncogene activation and tumor suppressor gene inactivation.5–8 Although some studies have shown that epigenetic changes occur in a number of known signaling pathway molecules in the development of HCC, the complicated molecular mechanism of liver cancer remains to be fully clarified.9 Molecular targeted drugs such as sorafenib provide a new method for the treatment of advanced HCC; however, the effectiveness of is unsatisfactory. In addition to acting on cancer cells, sorafenib also has side-effects on normal cells, so molecular targeted therapy for liver cancer remains a huge challenge.10 Thus, it is necessary to clarify the key genes and molecular mechanisms responsible for the rapid growth, tumorigenicity and metastasis of liver cancer.
Our previous research showed that voltage-dependent anion channel 1 (VDAC1) is closely related to the occurrence of HCC. VDAC1 expression is increased in HCC, and its expression level in tumor tissues is related to various clinical pathological parameters such as TNM staging, histological differentiation, and distant metastasis, which affect the prognosis of patients. We also showed that VDAC1 promotes the proliferation, migration and migration of liver cancer cells in vitro.11 However, the occurrence and development of liver cancer is a very complicated process, and the molecular mechanism by which VDAC1 affects HCC has not yet been elucidated. Therefore, we performed Affymetrix chip analysis to further investigated the role of molecules downstream of VDAC1. Combined with previous reports, we selected representative differentially expressed genes for high-throughput shRNA screening (HCS), and found that ubiquitin-related modifier 1 (URM1) significantly promoted the proliferation of liver cancer cells.
URM1 is a member of the ubiquitin-like regulator family. Studies have shown that URM1 binds to nuclear cytoplasmic shuttle factor apoptosis susceptibility proteins and participate in oxidative stress.12,13 However, the role of URM1 in HCC has not yet been reported. In this study, we demonstrated that URM1 is significantly overexpressed in liver cancer tissues. In vitro studies showed that URM1 knockdown significantly inhibited the proliferation and migration of liver cancer cells, and promoted apoptosis. By analyzing tissue specimens from liver cancer patients, we found that URM1 is related to tumor size, TNM stage and chronic hepatitis B infection. The overall survival rate of patients with high URM1 expression was significantly lower than that of patients with low expression. These findings provide a better understanding of the mechanism underlying the occurrence and development of liver cancer, and highlights novel targets for the treatment of liver cancer.
Materials and Methods
Patients and Clinical Samples
We collected liver cancer and adjacent non-cancerous tissues (>2 cm) from patients who underwent radical resection of liver cancer in the general surgery of the affiliated hospital of Nantong University (China) from January 2013 to October 2018. Freshly resected tissues were frozen at −80°C for subsequent protein extraction and RNA extraction. Formalin-immersed tissues were stored at −4°C for tissue chip production. All patients were pathologically diagnosed as hepatocellular carcinoma. Clinical and follow-up data excluded cases of Child grade B and C, positive surgical margin, preoperative radiotherapy and chemotherapy, and incomplete clinical data. Through data compilation, a total of 90 matched pairs of liver cancer and adjacent non-cancerous tissues were used to prepare tissue chips for immunohistochemical scoring. The clinical and follow-up data of patients included in the study were statistically analyzed (Table 1). All patients provided informed consent to participate in this study and the experimental procedure was approved by the Ethics Committee of the Affiliated Hospital of Nantong University.
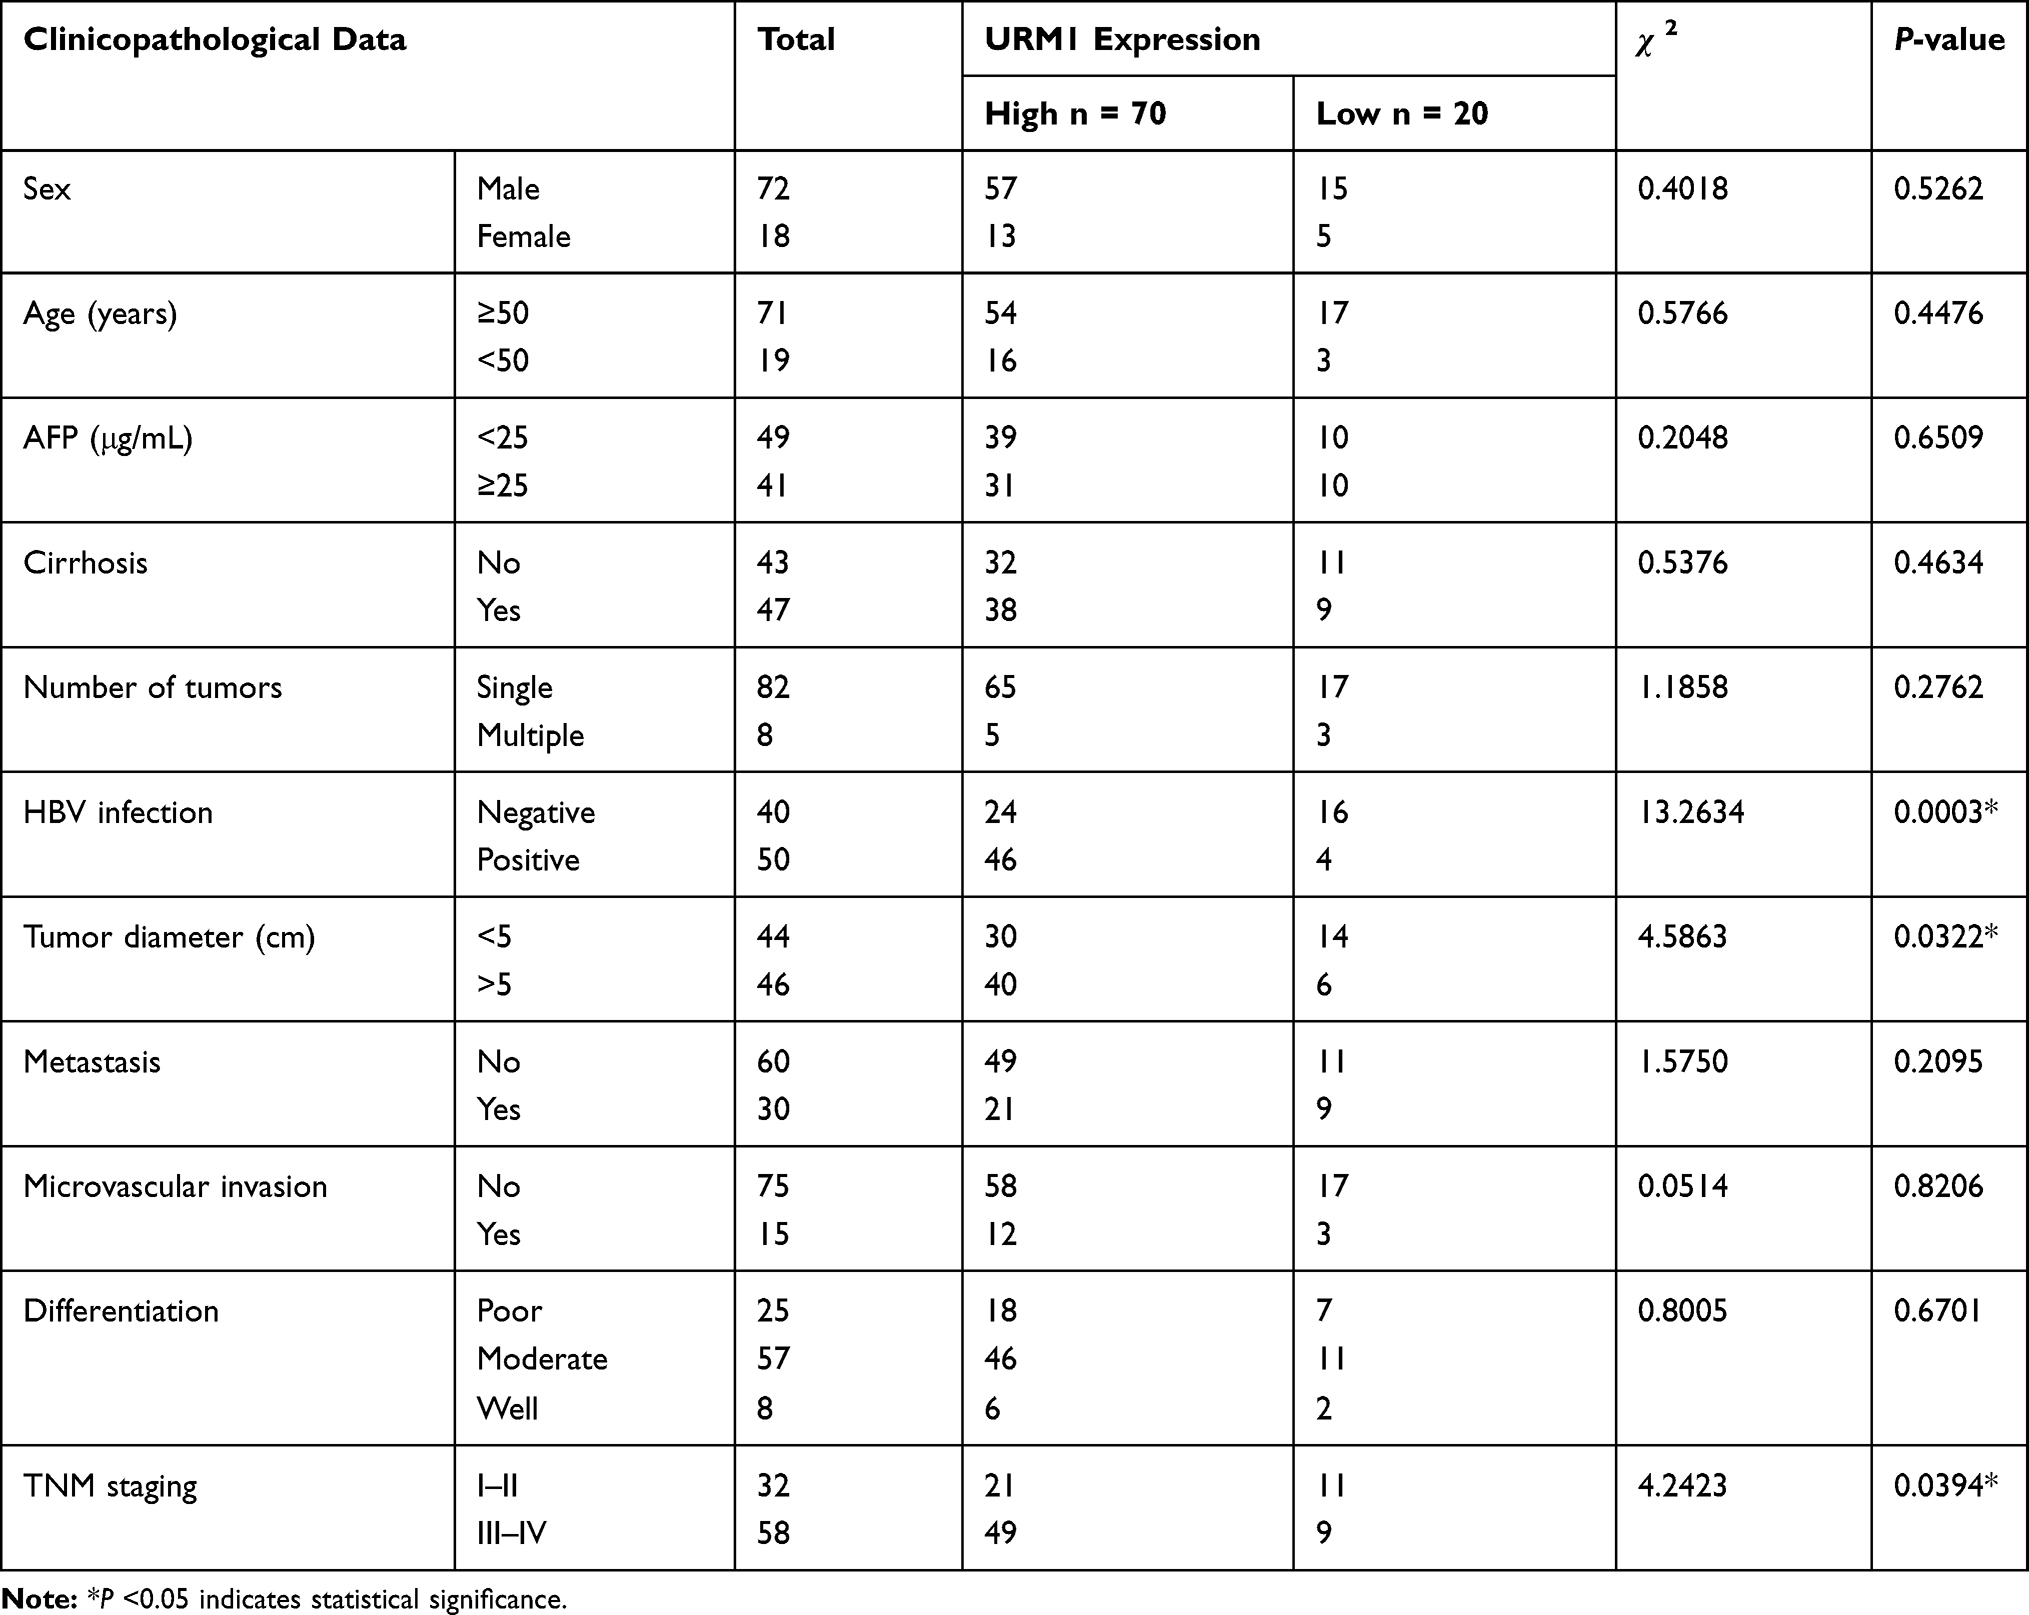 |
Table 1 Relationship Between URM1 Expression Level and Various Clinicopathological Parameters in Liver Cancer Tissues |
Cell Culture
The human liver cancer cell lines HepG2, SMMC7721, BEL-7404, SK-hep-1 and Huh7 were purchased from Shanghai Genechem Co., Ltd. (Shanghai, China). HCC-LM3, which is a highly invasive hepatocellular carcinoma cell line, was provided as a gift from the laboratory of the Eastern Hepatobiliary Surgery Hospital affiliated to the Second Military Medical University. HCC-LM3 cell line was approved by the Institute Ethics Committee at the Affiliated Hospital of Nantong University. The HCC-LM3, HepG2 and Huh7 liver cancer cell lines were cultured in Dulbecco’s modified Eagle’s medium (DMEM; Invitrogen, Carlsbad, CA, USA) supplemented with 10% fetal bovine serum (FBS; Gibco) at 37°C under 5% CO2. The liver cancer cell lines SMMC7721 and BEL-7404 were cultured in RPMI-1640 (Invitrogen, Carlsbad, CA, USA) medium with 10% FBS (Gibco) at 37°C under 5% CO2. The SK-hep-1 liver cancer cell line was cultured in MEM (Invitrogen, Carlsbad, CA, USA) supplemented with 10% FBS (Gibco) at 37°C under 5% CO2.
Lentivirus Infection
HCC-LM3, HepG2 and BEL-7404 liver cancer cells in the logarithmic growth phase were cultured in a 6-well plate (5 × 10⁴ cells/well) for one day. When the cells had settled, the cells were infected with lentivirus with URM1 RNAi (URM1 siRNA: GCTCCTGTTTGACGGTATTAA). The cells were then cultured in the presence of puromycin (10 µg/mL) for 1 week to screen for positively infected cells, which were then viewed under a fluorescence microscope. When the infection efficiency exceeded 90%, the cells were collected for use in experiments.
Affymetrix Whole Gene Expression Profile Chip
After total RNA samples were analyzed by Agilent 2100 (Agilent, CA, USA), gene amplification products (amplified RNA) were prepared using the GeneChip 3’ IVT Express Kit (Sangon, Shanghai, China). Briefly, cDNA was obtained by first-strand synthesis, and the double-stranded DNA template was obtained by second-strand synthesis. A biotin-labeled amplified RNA was obtained by in vitro inversion. The amplified RNA was purified and then fragmented for hybridization with a chip probe. After the hybridization was complete, the chip was washed and stained by GeneChip Fluidics Station 450 (Sangon, Shanghai, China). The scan and the original data were obtained by GeneChip Scanner 3000 (Sangon, Shanghai, China).
Real-Time Quantitative PCR
Total cellular RNA was extracted with TRIzol (Invitrogen) and reverse-transcribed into cDNA using RT-PCR Master Mix (DRR0036A, TaKaRa) kit. The relative expression of the target gene was determined using SYBR Green (TaKaRa) with a real-time quantitative PCR system (LightCycler 480II). The primers were synthesized by Biotech Bioengineering (Shanghai) Co., Ltd. The primer sequences are as follows:
URM1 forward: 3’-AAGAAACATCGAGTCACTTTGC-5’
URM1 reverse: 5’-GGTAGTCCAGCTCACCCAGTA-3’
β-actin forward: 3’-GGCGGCACCACCATGTACCCT-5’
β-actin reverse: 5’-AGGGGCCGGACTCGTCATACT-3’
High-Throughput shRNA Screening and Cell Growth Curve Analysis
SMMC7721 cells were infected with knockdown (KD) or normal control (NC) URM1 RNAi-lentivirus and seeded in 96-well plates (2× 10³ cells/well). The three interference sequences of 16 genes are shown in Table 2. GFP expression was observed under a fluorescence microscope. When the cells reached 80% confluence, the cells were collected for further experiments. Analysis of 2000 cells per well was performed daily using a cytology array scanning system. Cells were quantified by adjusting the input parameters based on measurements of the green fluorescent signal in each well. Data were collected and statistically analyzed using a 5-day cell proliferation curve. The cells on the scanned images were counted using image analysis software (Celigo). The number of cells at each time-point was compared with the number of cells on the first day to obtain the cell proliferation rate at each time-point in each group, and the cell growth curve was generated using the change in the multiplication factor. The cell proliferation rate was calculated as follows: fold change (NC vs KD group) = NC group day 5 proliferation rate/KD group day 5 proliferation rate. The changes in two or more cell proliferation rates indicated marked inhibition of cell proliferation, and the effect of RNAi-lentivirus infection on cell proliferation was measured.
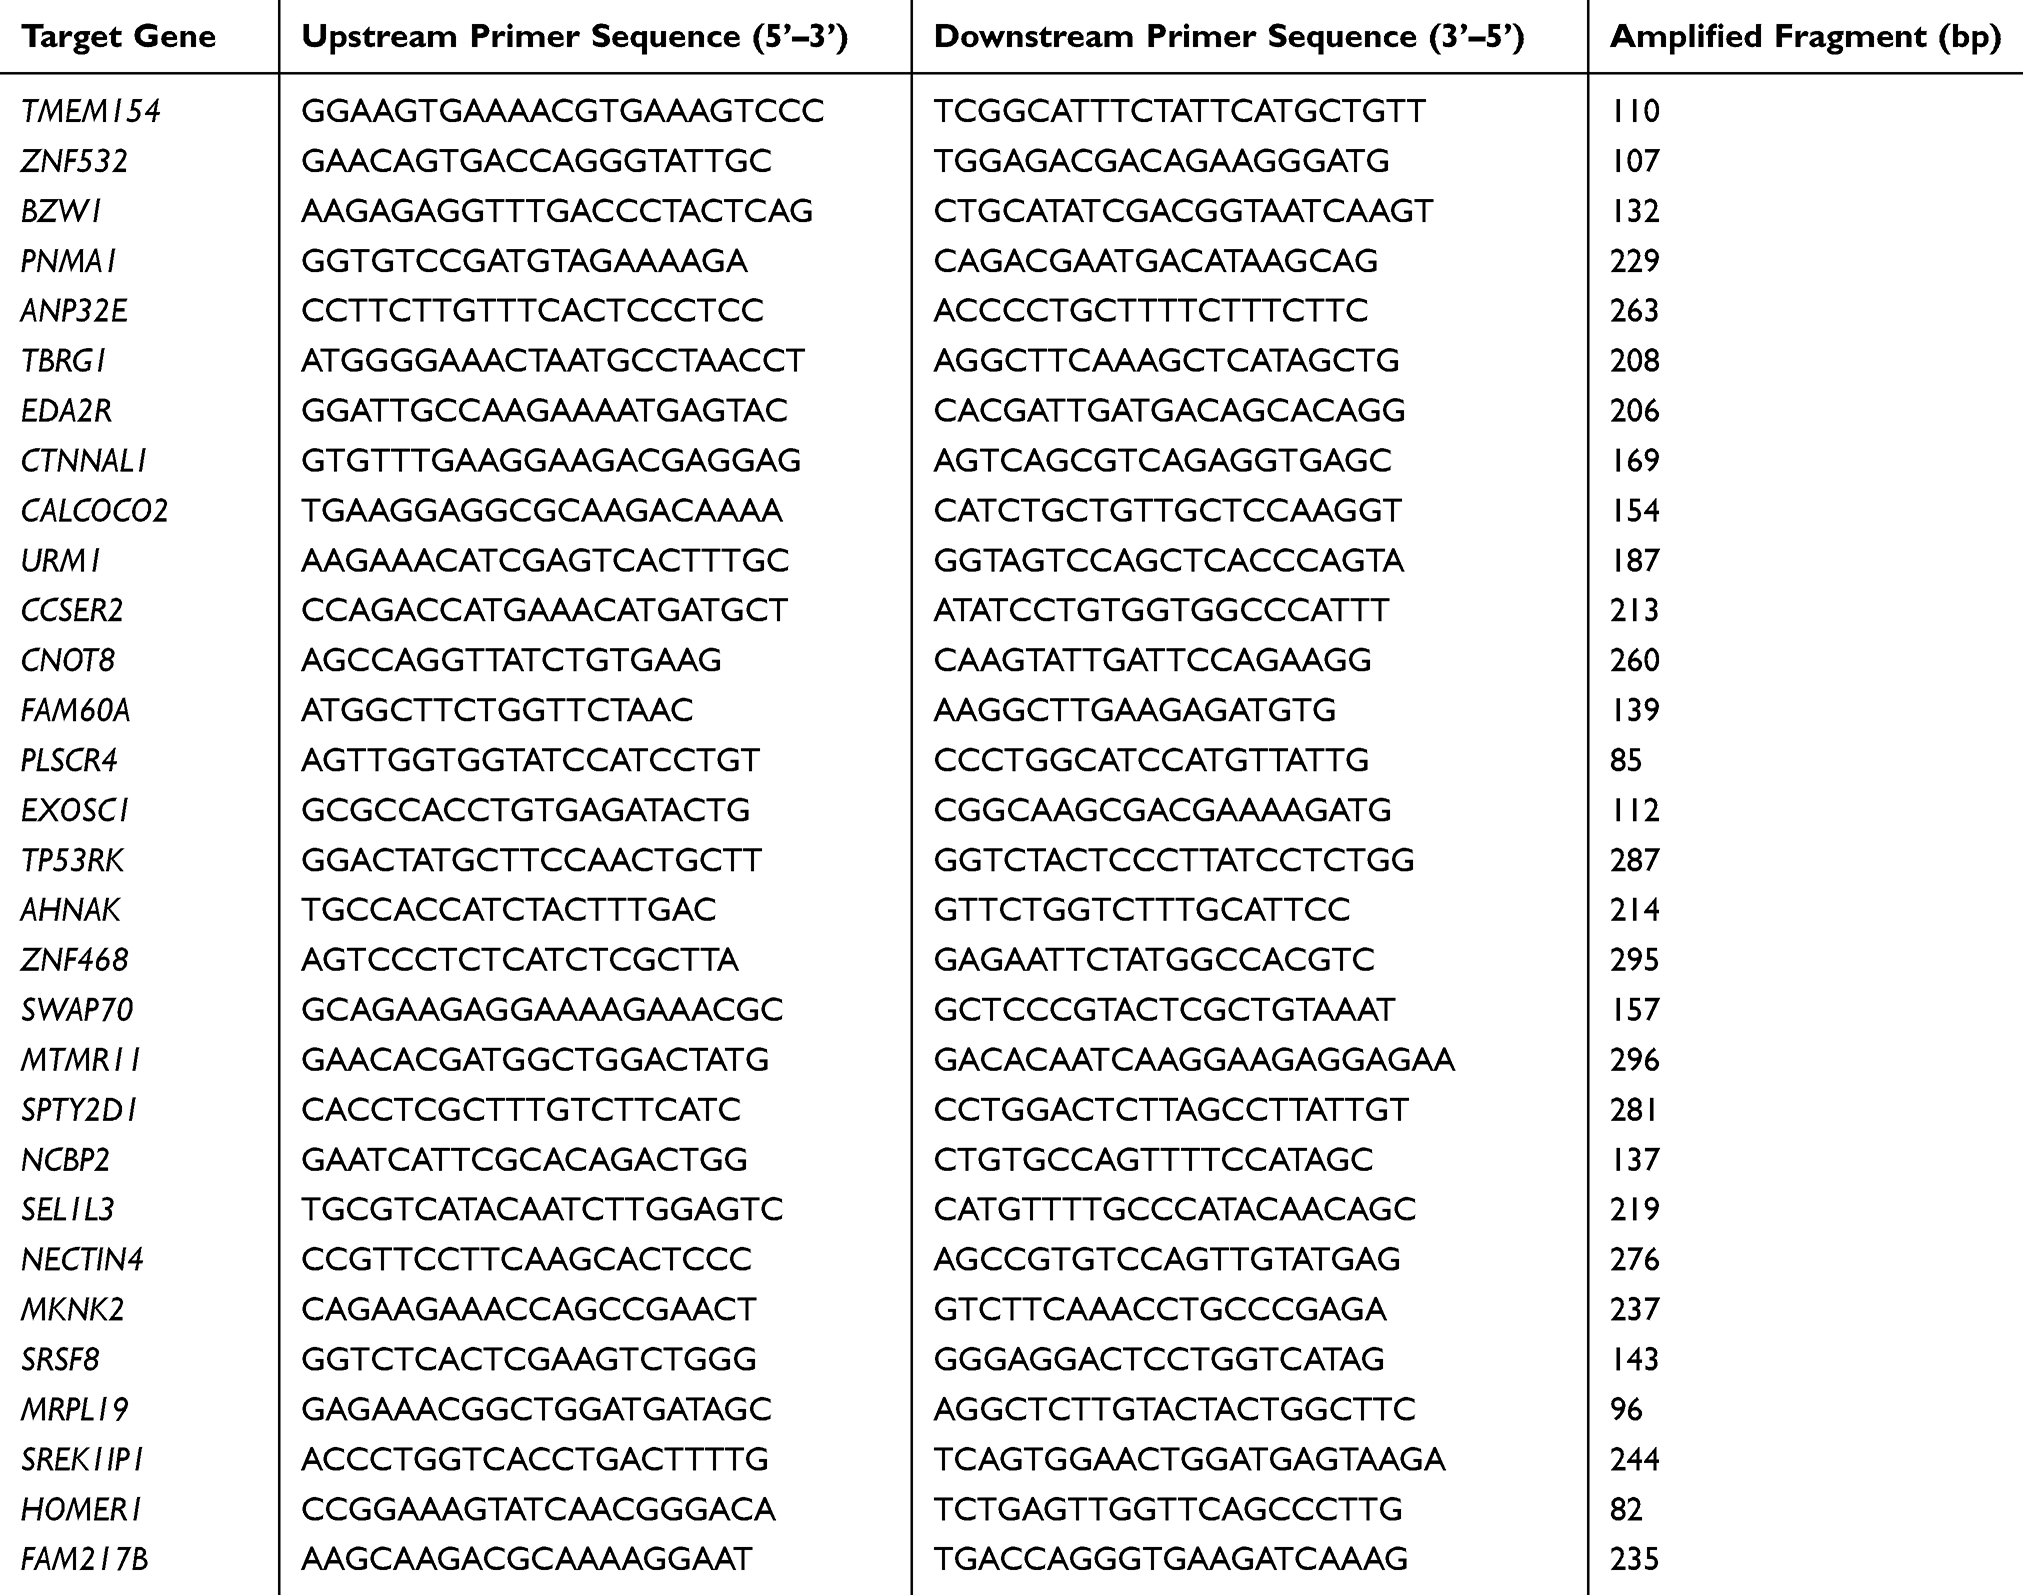 |
Table 2 Primers Designed to Validate Differentially Expressed Genes |
Immunohistochemistry (IHC) and Scoring
The anti-URM1 polyclonal antibody (diluted 1:1000, Thermo Fisher Scientific, MA, USA) was evenly dropped onto a tissue chip containing 90 matched pairs of liver cancer and adjacent non-cancerous tissues, and incubated overnight at 4°C in a wet box. The tissue chip was then incubated with the corresponding diluted secondary antibody (1:1000, goat anti-rabbit IgG) at room temperature for 30 min. Senior pathologists were invited to perform double-blind readings, and three representative images were captured for each sample. The URM1 immunostaining was assigned a score from 0 to 12, which was calculated as the product of the percentage of positively stained tumor cells and the staining intensity; this score was used as the criterion for evaluation of URM1 expression. The URM1 expression level was defined as follows: intensity of staining (no staining, 0 points; mild staining, 1 point; moderate staining, 2 points; severe staining, 3 points); The percentage of stained cells in the cell count (<5%, 0 points; 5–25%, 1 point; 26–50%, 2 points; 51–75%, 3 points; >75%, 4 points). A total score greater than 6 was defined as high URM1 high expression, and a score less than or equal to 6 was defined as low URM1 expression.
Colony Formation Experiment
LM3 and BEL-7404 cells in the logarithmic growth phase (URM1-knockdown and negative control groups) were placed in 6-well plates (500 cells/well) and cultured until the number of cells in most monoclonal colonies exceeded 50. Next, 4% paraformaldehyde was added to each well and the colonies were stained for 10 min with Giemsa. After several washes with ddH2O, the colonies were dried and images were obtained with a digital camera for colony counting.
Cell Proliferation Experiment (CCK-8 Experiment)
HepG2, LM3, and BEL-7404 cells in logarithmic growth phase after lentiviral infection were cultured in 96-well plates (5000 cells/well) with six replicates per group. After incubating for 24, 48, 72 and 96 h, CCK-8 reagent was added and the cells were harvested after 1 hr incubation. Cell proliferation was measured by spectrophotometry using a microplate reader (Tecan Infinite F200).
Cell Invasion Experiment (Transwell)
A 24-well Transwell plate (pore size 8 mm, Corning Life Sciences) was coated with a matrix gel (1 mg/mL, BD Sciences). HCC-LM3 and BEL-7404 cells were cultured in the upper chamber (1 × 10⁴ cells/well) in 200 μL serum-free medium, and 500 μL 10% fetal calf serum was added to the lower chamber to induce cell invasion. After incubation for 24 h, the cells on the surface of the filter were fixed with 4% formaldehyde, stained with 0.5% crystal violet, placed under the microscope and counted.
Apoptotic Analysis by TUNEL Staining
Apoptosis was detected using a TUNEL staining kit (C1090, Beyotime) according to the manufacturer’s instructions. TUNEL-positive cells were observed under an inverted fluorescence microscope.
Wound Healing Assay
LM3 and BEL-7404 cells in the logarithmic growth phase after infection were cultured in 6-well plates (5 × 10⁴ cells/well). After the cells reached confluence, scratches in the monolayer were made with a 20 μL pipette tip, and the cells were washed with PBS. Cells were incubated in serum-free medium and imaged at 0, 24, 48, and 72 h. The average distance between the cells on either side of the scratch was calculated using Image J software.
Nude Mouse Xenograft Model of Liver Cancer
Male 4-week-old Balb/c nude mice were purchased from Shanghai SLAC Laboratory Animal Co. Ltd (Shanghai, China). All mice were raised in a barrier environment specified by the Animal Research Center of Nantong University. Each nude mouse was injected subcutaneously above the right scapula with 1 × 10⁷ infected LM3 hepatoma cells or negative control cells. After 14 days, tumor size and animal weight were measured weekly. According to animal welfare ethical guidelines, tumor growth was not allowed to exceed 20 mm in diameter. Six weeks after the start of measurement, experimental mice were euthanized with an overdose of 2% pentobarbital sodium, and cervical spine dislocation was performed to confirm death. The animals were placed on a white board, and digital images of the animal were obtained using a ruler as a scale marker. The animal research in this study was approved by the Laboratory Animal Center of NTU, all experiments were performed according to the guidelines for Care and Use of Laboratory Animals of “National Institutes of Health”.
Flow Cytometric Analysis
LM3 liver cancer cells or negative control cells were digested with 0.25% trypsin (Invitrogen) and fixed in 70% ethanol for 48 h. The cell samples were then washed three times with PBS before incubation with 1 mg/mL RNase A for 30 min. Next, the samples were incubated with 50 μg/mL propidium iodide. Cell cycle distribution was measured by flow cytometry using a Becton Dickinson FACScan. Cell fragments, double peaks and clumps were excluded by gating.
Western Blot Analysis
LM3 cells in the experimental and control groups were lysed with RIPA buffer (P0013B, Beyotime) containing protease inhibitors (P1005, Beyotime). The lysates were harvested by centrifugation (12,000 rpm) at 4ºC for 15 min. Approximately 20 μg protein samples were then separated by 10% sodium dodecyl sulfate polyacrylamide gel electrophoresis and transferred onto a polyvinylidene fluoride membrane. After blocking the non-specific binding sites for 60 min with 5% non-fat milk, the membranes were incubated overnight at 4°C with the following primary antibodies: anti p-P53 (1:1000;CST; #2528), anti-Bax (1:5000; Proteintech; 500599-2-lg), anti-JNK1/2 (1:1000; CST; 9592), anti p-JNK (1:1000; CST; 9251S), anti-TP53 (1:500; CST; #2527), and anti-GAPDH (Santa Cruz, sc-32233). The secondary antibodies were as follows: anti-rabbit IgG (1:2000; CST; #7074), and anti-mouse IgG (1:2000; CST; #7076). The membranes were then washed three times with TBST (Tris-buffered saline with Tween-20) for 10 min and probed with the horseradish peroxidase (HRP)-conjugated rabbit anti-goat IgG antibody (1:5000; CST; #7074) at 37ºC for 1 h. After three washes, the protein bands were visualized using an ECL system.
Statistical Analysis
All data were analyzed using SPSS 22.0 statistical software, and graphs were generated using GraphPad Prism 6 software. Data were expressed as the mean ± standard deviation (SD). Differences between groups were analyzed by independent sample t-test. Analysis of the between URM1 expression levels in liver cancer tissues and the clinicopathological data of patients was performed by chi-squared test. Using the Kaplan–Meier Plotter (http://kmplot.com/analysis/), Kaplan–Meier survival curves were constructed to evaluate the effect of URM1 expression on the 5-year survival of patients. P-values <0.05 were considered to indicate a statistically significant difference.
Results
Affymetrix Expression Profiling Chip to Screen for Differentially Expressed Genes After VCAD1 Gene Knockdown
To explore the genes downstream of VDAC1 that play a key role in the development of HCC, we used Affymetrix expression profiling microarray analysis to compare the expression profiles of three VDAC1-knockout and negative control HCC cell samples. Compared to the negative control sample, there were 205 upregulated mRNAs and 347 downregulated mRNAs in the VDAC1 knockout samples (Figure 1A). We selected 30 representative differentially expressed genes for PCR verification, of which 16 genes were consistent with the results of mRNA microarray analysis (Figure 1B). All 16 candidate genes were then silenced in SMMC7721 cells to examine their potential effects on the proliferation of hepatoma cells in vitro. URM1-knockdown had a greater impact on the reduction of proliferation; therefore, we focused on URM1 in the follow-up study (Figure 1C and D).
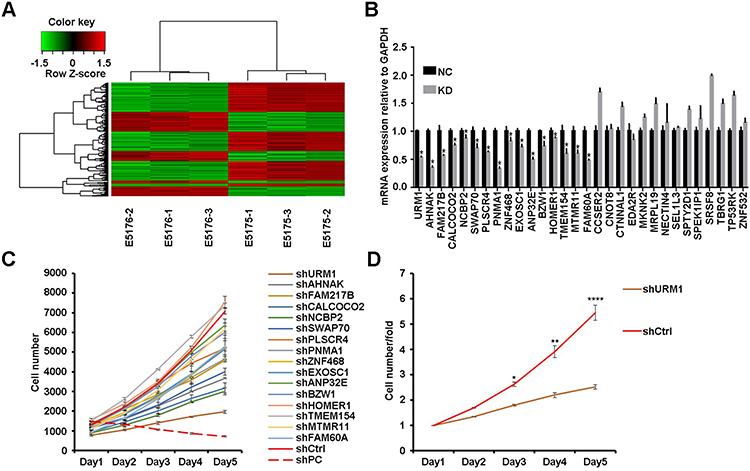 |
Figure 1 Affymetrix gene expression profile and high-throughput shRNA screening (HCS), proliferation screening. (A) Cluster analysis of differential genes after VDAC1 interference (red: gene upregulation; green: suppressor gene; black: altered gene; gray: undiscovered gene); (B) PCR expression of representative differentially expressed genes (*P <0.05); (C, D) Proliferation of corresponding differentially expressed genes was detected on the HCS platform (*P <0.05, **P <0.01, ****P <0.0001). |
The Relationship Between URM1 Expression in Liver Cancer Tissues and Prognosis of Patients with Liver Cancer
URM1 staining was mainly distributed in the cytoplasm and nucleus. Cells with high URM1 expression showed brown and brownish-yellow particles. URM1 expression was higher in liver cancer tissues than that in adjacent non-cancerous tissues (Figure 2A). Tissue chips generated from 90 matched pairs of liver cancer and adjacent non-cancerous tissues were used to detect the expression of URM1 by immunohistochemical staining. We identified differences in the expression of URM1 among these matched pairs of tissue samples (χ2 = 15.05, P <0.001) (Figure 2B). Among the liver cancer tissues, 70 (77.8%) showed high URM1 expression, and the remaining 20 (22.2%) showed low URM1 expression. Among the corresponding 90 cases of adjacent non-cancerous tissues, 45 (50%) showed high URM1 expression, and 45 (50%) showed low or no URM1 expression. Furthermore, analysis of the data in TCGA database also showed significantly higher URM1 expression in liver cancer tissues than that in adjacent tissues (Figure 2C). URM1 expression levels were also be significantly related to HBV infection, maximum tumor diameter, and TNM stage (P <0.05) as well as other clinicopathological factors, such as serum alpha-fetoprotein level, liver cirrhosis, tumor number, and tumor metastasis. There was no correlation between URM1 expression levels and microvascular invasion (P >0.05, Table 1). The relationship between URM1 expression levels and patient survival was further analyzed by constructing Kaplan–Meier survival curves. The results showed that the overall survival rate at 1, 3, and 5 years after liver resection was significantly lower in patients with high URM1 expression than in those with low URM1 expression (P = 0.04; Figure 2D).
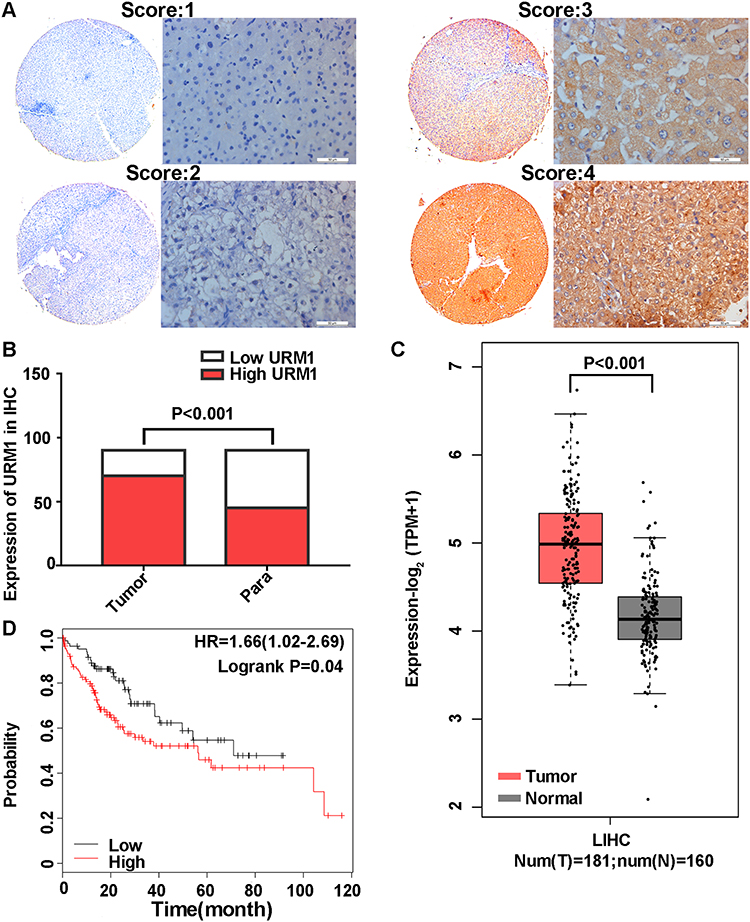 |
Figure 2 URM1 immunohistochemical staining and Kaplan–Meier survival curves of HCC and adjacent tissues. (A) Staining intensity of liver cancer and adjacent non-cancerous tissues (no staining, 0 points; mild staining, 1 point; moderate staining, 2 points; severe staining, 3 points); (B) URM1 expression in liver cancer and adjacent non-cancerous tissues (P <0.001); (C) URM1 expression in HCC tissues (n = 181) and adjacent non-cancerous tissues (n = 160) in the TCGA database; URM1 expression was higher in HCC tissues than that in adjacent non-cancerous tissues (P <0.001); (D) Kaplan–Meier survival curve (P = 0.04). |
URM1 Promotes Cell Proliferation, Migration, and Inhibits Apoptosis in vitro
To investigate the effect of URM1 expression in liver cancer cell lines, we used qPCR to detect the background URM1 expression in six liver cancer cell lines (Figure 3A). HepG2, HCC-LM3, and BEL-7404 cell lines express high levels of URM1; therefore, we used these cell lines to knock down URM1 expression by URM1-shRNA infection. The infection efficiency was close to 100% and the knockdown efficiency for HepG2, HCC-LM3, and BEL-7404 cell lines was 85%, 96%, and 85%, respectively (Figure 3B and C). The morphology and viability of cells were checked under a microscope, and were found to be normal. Through CCK-8 assay analysis of cell growth (Figure 3D) and colony formation experiments (Figure 3E), we confirmed that URM1 knockdown inhibited the proliferation of HCC cells. We also found that URM1 knockdown shortened the DNA synthesis phase (S phase) and the post-synthesis DNA synthesis phase (G2 phase), and prolonged the pre-DNA synthesis phase (G0/G1 phase) (Figure 4A). In addition, we found that URM1 knockdown promoted apoptosis of liver cancer cells (Figure 4B).
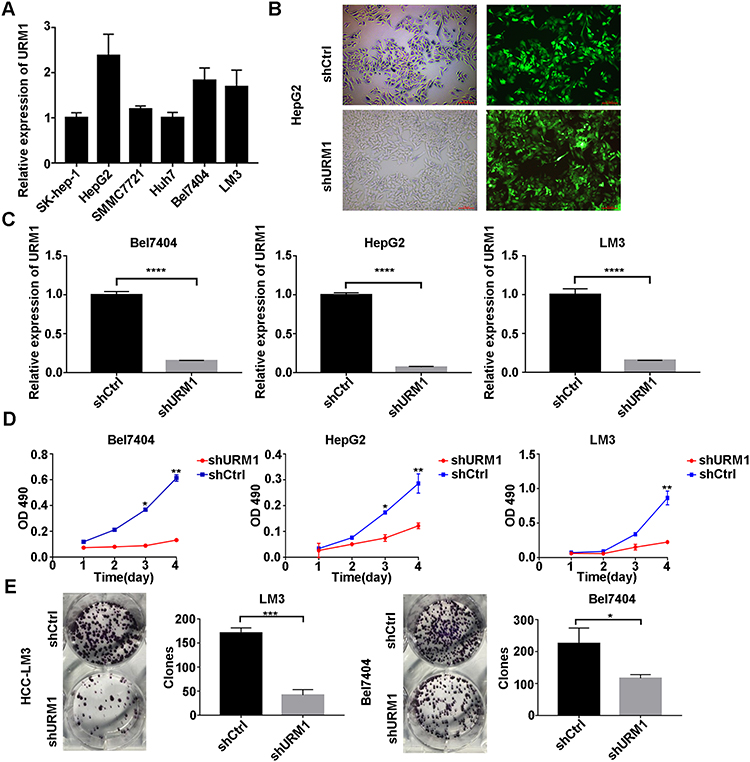 |
Figure 3 The effect of URM1 on the proliferation. (A) URM1 expression levels in HCC cell lines; (B) Efficiency of HCC-LM3 infection by lentivirus (approximately 100%); (C) URM1 knockdown efficiency in BEL7404 cells is 85% (****P <0.0001); URM1 knockdown efficiency in HepG2 cells (96%) (****P <0.0001); URM1 knockdown efficiency in HCC-LM3 cells (85%) (****P <0.0001); (D) The proliferation of BEL7404, HepG2 and HCC-LM3 cells in the URM1 knockdown and control groups. URM1 knockdown HCC cell line proliferation was significantly lower than that in the control group (*P <0.05, **P <0.01). (E) The number of clones of HCC-LM3 and BEL7404 cells shURM1 was significantly lower than that in the control group (*P <0.05, ***P <0.001). |
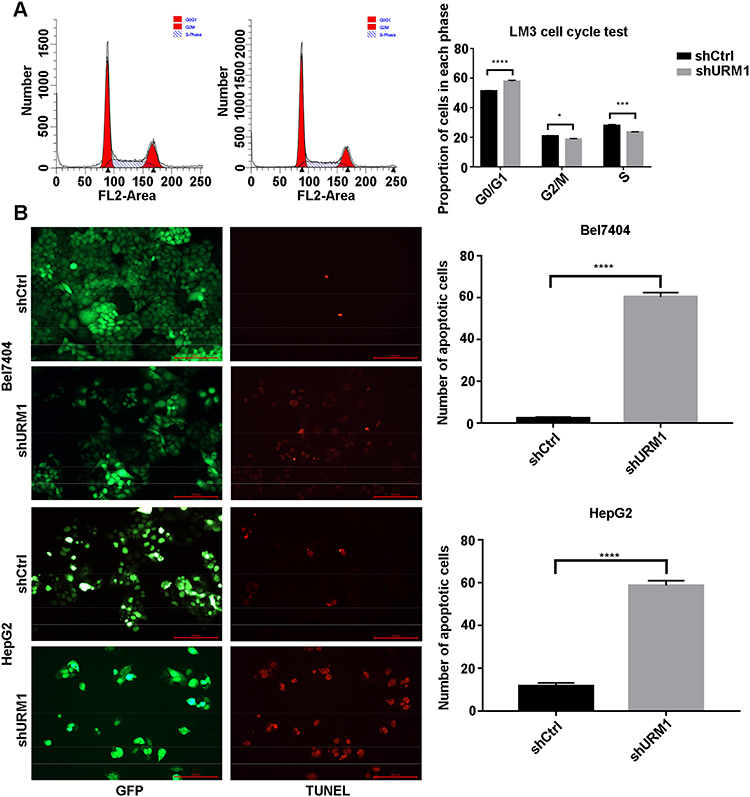 |
Figure 4 The effect of URM1 on the cell cycle and apoptosis. (A) Cell cycle distribution was analyzed by flow cytometry (left). Upon infection with shURM1, the proportion of HCC-LM3 cells decreased significantly during DNA synthesis (S phase) and late DNA synthesis (G2 phase), whereas increased significantly during pre-DNA synthesis (G0/G1) phase (right) (*P <0.05, ***P <0.001, ****P <0.0001). The proliferation index (PI) in the URM1 knockdown group was significantly lower than that in the control group (0.4965 vs. 0.5345, respectively). (B) Fluorescence field of BEL7404 and HepG2 cells in the URM1 knockdown and control groups; apoptotic cells are marked by red fluorescence. The proportion of apoptotic cells in the shURM1 group was significantly higher than that in the control group (****P <0.0001). |
We further evaluated the potential role of URM1 in cell migration and invasion through wound healing and Transwell migration experiments. The results showed that URM1 knockdown inhibited HCC cell migration (Figure 5A and B), but had no effect on the cell invasion ability (Figure 5C and D).
 |
Figure 5 The effect of URM1 on the migration and invasion. (A) HCC-LM3 cell wound healing (scratches) in the URM1 knockdown and control groups at 0, 24, 48, and 72 h (****P <0.0001); (B) Bel7404 cell wound healing (scratches) in the URM1-knockdown and control groups at 0, 24, 48, and 72 h (**P <0.01, **** P <0.0001); (C) BEL7404 cell invasion in the URM1-knockdown and control groups; (D) HCC-LM3 cell invasion in the URM1-knockdown and control groups. |
Effect of URM1 on Subcutaneous Tumor Formation in a Nude Mouse Xenograft Model of Liver Cancer
To further explore the effects of URM1 on HCC cell proliferation in vivo, we established a nude mouse xenograft model of human liver cancer. Compared with the control group, the tumor diameter and weight of mice in the shURM1 group were significantly smaller than those in the control group (Figure 6A and B).
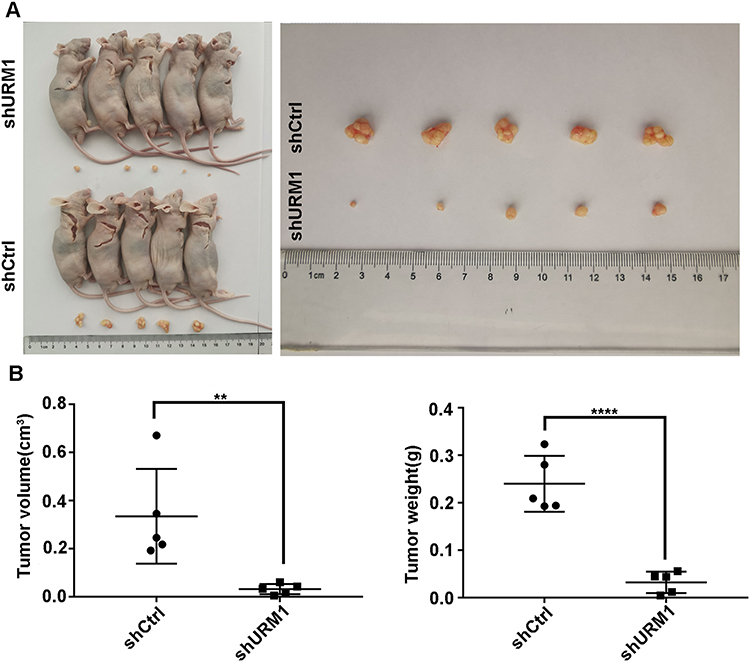 |
Figure 6 The effect of URM1 on subcutaneous tumor formation in a nude mouse xenograft model of liver cancer. (A) Representative images of tumors in the URM1-knockdown and the control groups; (B) URM1 depletion leds to a significant decrease in tumor volume and weight, compared with control group (**P <0.01, **** P<0.0001). |
URM1 Inhibits Apoptosis by Inhibiting the JNK Signaling Pathway
To further clarify the effect of URM1 knockdown on the HCC cell proliferation and apoptosis, we examined the expression of apoptosis-related proteins by Western blotting. We found that after URM1 knockdown, expression of the apoptosis-related factors JNK1/2 and TP53 was significantly reduced, whereas the expression of p-JNK1/2, p-P53 and Bax was significantly elevated (Figure 7). These findings were consistent with the results of in vitro functional studies showing that URM1 knockdown increased liver cancer cell apoptosis.
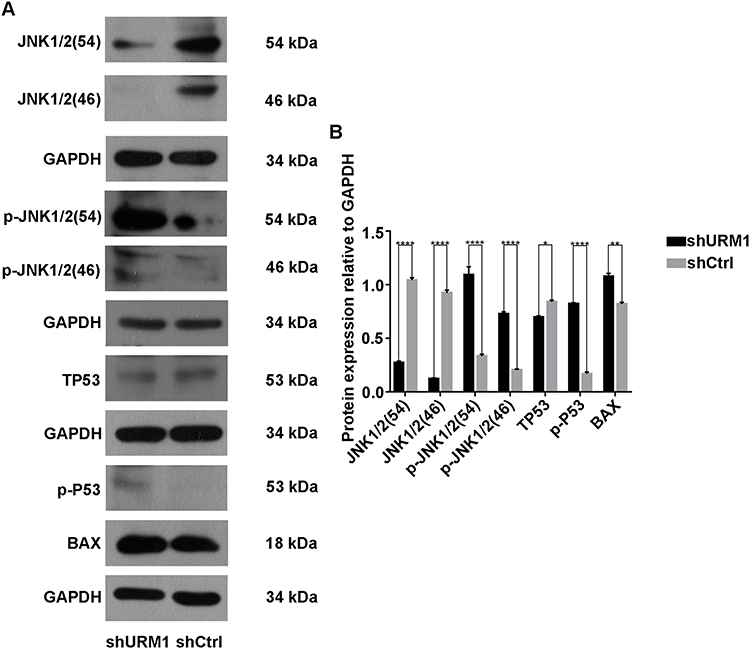 |
Figure 7 Expression of apoptosis-related proteins. (A) Western blot detection of JNK1/2, p-JNK1/2, TP53, p-P53, and Bax protein expression in the URM1-knockdown and control groups; (B) Gray analysis (*P <0.05, **P <0.01, ****P <0.0001). |
Discussion
Hepatocellular carcinoma is a common malignant tumor worldwide that is associated with a high mortality rate. The mechanism of the occurrence and development of liver cancer is complex, and is not yet fully understood. Our previous research showed that the expression level of VDAC1 is closely related to hepatocarcinogenesis and that silencing of VDAC1 expression significantly inhibits the proliferation and invasion of liver cancer cells, thus confirming the tumor-promoting function of VDAC1 in liver cancer cells. VDAC1 is a 31 kDa porogenic protein present on the outer mitochondrial membrane in all eukaryotic cells.14 The mitochondrial outer membrane channel composed of VDAC1 regulates the release of many apoptotic molecules, such as cytochrome C, apoptosis inducing factor (AIF), serine peptidase 2 (HTRA2), and endonuclease G (Endo G).15 VDAC1 overexpression may be involved in processes such as metabolism in energy-intensive tumor cells;16,17 however, the specific role of VDAC1 in liver cancer metabolism has not yet been elucidated.
In this study of the molecules downstream of VDAC1, we found that URM1 promotes the proliferation of liver cancer cells through Affymetrix expression profiling chip and high-throughput cell proliferation functional screening. URM1 is a member of the ubiquitin-like protein family. Ubiquitin-like proteins are small post-translational modifiers that regulate a variety of cellular processes through covalent coupling to target substrates.18–21 URM1 plays an important role in the induction of specific oxidative stress in protein coupling. URM1 modifies proteins to protect them from oxidative damage and retain their function by recognizing oxidized lysine residues. URM1 then labels these proteins as damaged, induces proteolysis, or release of danger signals that are recognized by other cells. In the latter case, URM1 may act as a sensor of redox balance and release indicators of intracellular or extracellular damage as signals.12 There are no reports about the role of URM1 in tumors. Therefore, we focused our subsequent studies on URM1. We investigated the expression of URM1 in liver cancer and its relationship with clinicopathological indicators, and the long-term survival after liver cancer resection. We then analyzed URM1 expression levels in 90 matched pairs of liver cancer and adjacent non-cancerous tissues, and found that URM1 was highly expressed in liver cancer tissues. In our analysis of the data in TCGA database, we found that URM1 expression was significantly higher in liver cancer tissues than in adjacent tissues. These findings implicate URM1 as a tumor-promoting gene that plays an important role in the occurrence and development of liver cancer. Our analysis of the relationship between URM1 expression and clinical indicators showed that URM1 is related to tumor size, TNM stage and chronic hepatitis B infection. Furthermore, the long-term survival rate of patients with high URM1 expression was significantly lower than that of patients with low URM1 expression. These findings demonstrated the importance of clarifying the role and mechanism of URM1 in the occurrence and development of liver cancer.
In this study, we examined the relative expression of URM1 in several common liver cancer cell lines compared with that in normal liver cells. The URM1 expression levels in HepG2, LM3 and Bel7404 cells were higher than those of other cell lines; therefore, we chose these three high-expressing cell lines for follow-up research. The expression of URM1 in these three cell lines was downregulated by lentiviral infection to investigate effects of modified URM1 expression on the biological functions of liver cancer cells. Our investigations showed that after downregulation of URM1, the proliferation ability of HepG2, LM3, and Bel7404 was significantly reduced, and the tumorigenic potential of Bel7404 and LM3 was weakened. Cell cycle experiments carried out to further investigate the cause of the decline in proliferative capacity showed that URM1 knockdown significantly prolonged the phases of DNA synthesis and late DNA synthesis, and shortened the phase of early DNA synthesis. The proliferation index of cells in shURM1 group was significantly lower than that in control group. In addition, apoptosis was significantly increased in LM3 and Bel7404 cell lines transfected with shURM1. In nude mice tumor formation experiments, the tumor weight and diameter in the shURM1 group were smaller than those in the control group. These observations indicate that URM1 promotes tumor proliferation in liver cancer, and inhibition of URM1 expression promotes tumor cell apoptosis. Thus, URM1 is implicated as a novel therapeutic target in liver cancer.
The specific molecular mechanism by which inhibition of URM1 promotes tumor cell apoptosis is unknown. URM1 has been shown to negatively regulate the JNK signaling pathway in Drosophila, resulting in the resistance to oxidative stress of URM1-deficient Drosophila.22 The JNK signaling pathway can be activated by a variety of extracellular stimuli, including growth factors, cytokines, and stress conditions, and is widely involved in regulating cellular processes, such as apoptosis, proliferation, metabolism, energy production, and DNA damage repair.23–26 Some studies have shown that the loss of JNK expression leads to an increase in the number of tumors and a faster growth rate in mice. It is believed that the JNK pathway may inhibit tumorigenesis by inducing tumor cell apoptosis.27,28 The mechanism by which JNK inhibits tumor formation may be related to its pro-apoptotic function or the effect CD8+ T lymphocytes in the immune surveillance of tumors.29 The kinases MEK4 and MEK7 directly activate JNK by double phosphorylation of Thr183 and Tyr185. JNK1 is preferentially phosphorylated at Tyr185, whereas JNK2 is preferentially phosphorylated at Thr183. Therefore, the pattern of JNK signaling pathway can be roughly summarized as: stress, ultraviolet and other stimulating factors → germinal center kinase (GCK) → MEKK → MEK4/7 → JNK → apoptosis, proliferation, differentiation, etc. Multiple signaling pathways collectively trigger the necessary reprogramming required for cells to withstand stress, of which JNK, p38, MAPK, p53, and Nrf2 are considered the most important.30 The Western blot analysis conducted in this study showed that after URM1 knockdown, expression of the apoptosis-related factors JNK1/2 and TP53 was significantly reduced, whereas the expression of p-JNK1/2, p-P53 and Bax was significantly elevated, further supporting the negative regulatory effects of URM1 on the apoptosis-related JNK signaling pathway. Therefore, URM1 inhibits cell apoptosis by inhibiting the JNK apoptotic signaling pathway, thereby promoting HCC cell proliferation.
JNK is mainly located in the cytoplasm. Following activation, some of the activated JNK translocates to the nucleus and activates nuclear transcription factors through phosphorylation, thereby promoting the transcription of relevant target genes and the synthesis of proteins that exert biological effects.31–34 In this study, immunohistochemical studies showed that URM1 is distributed mainly in the cytoplasm and nucleus. URM1 knockdown led to increased phosphorylation expression of JNK1/2, and increased levels of the downstream apoptosis-related protein Bax, suggesting that URM1 inhibits apoptosis by inhibiting the JNK signaling pathway, thereby promoting HCC cell proliferation. Therefore, we infer that URM1, a molecule downstream of VDAC1, inhibits the phosphorylation of JNK1 and JNK2 in the nucleus, leading to the inhibition of P53 phosphorylation in the JNK signaling pathway, which in turn reduces the level of apoptosis-related protein Bax on the mitochondria and inhibits apoptosis (Figure 8).
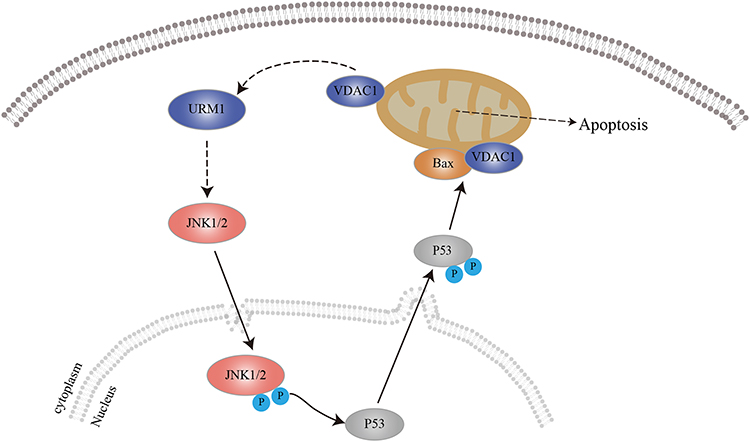 |
Figure 8 Predicted mechanism by which URM1 inhibits cell apoptosis. URMI blocks the JNK apoptotic signaling pathway, thereby promoting HCC cell proliferation. |
In summary, our study showed that URM1, as an important proto-oncogene, inhibits HCC cell apoptosis and promotes HCC cell proliferation by negatively regulating the JNK pathway. More importantly, we confirmed the biological role of URM1 gene in tumors. Upregulation of URM1 expression is associated with poor prognosis in patients with HCC, which highlights the importance of further studies on the role of URM1 gene expression in tumors.
Data Sharing Statement
The datasets used and/or analyzed during the current study are available from the corresponding author on reasonable request.
Ethics Approval
The study was approved by the Institute Ethics Committee at the Affiliated Hospital of Nantong University (2018-L006).
Author Contributions
All authors made substantial contributions to conception and design, acquisition of data, or analysis and interpretation of data; took part in drafting the article or revising it critically for important intellectual content; agreed to submit to the current journal; gave final approval of the version to be published; and agree to be accountable for all aspects of the work.
Disclosure
It should be understood that none of the authors have any financial or scientific conflicts of interest with regard to the research described in this manuscript. The authors report no conflicts of interest for this work.
References
1. Bray F, Ferlay J, Soerjomataram I, Siegel RL, Torre LA, Jemal A. Global cancer statistics 2018: GLOBOCAN estimates of incidence and mortality worldwide for 36 cancers in 185 countries. CA Cancer J Clin. 2018;68:394–424. doi:10.3322/caac.21492
2. Torre LA, Bray F, Siegel RL, Ferlay J, Lortet-Tieulent J, Jemal A. Global cancer statistics, 2012. CA Cancer J Clin. 2015;65:87–108. doi:10.3322/caac.21262
3. Jemal A, Bray F, Center MM, Ferlay J, Ward E, Forman D. Global cancer statistics. CA Cancer J Clin. 2011;61:69–90. doi:10.3322/caac.20107
4. Olsen SK, Brown RS, Siegel AB. Hepatocellular carcinoma: review of current treatment with a focus on targeted molecular therapies. Therap Adv Gastroenterol. 2010;3:55–66. doi:10.1177/1756283X09346669
5. Thomas MB, Jaffe D, Choti MM, et al. Hepatocellular carcinoma: consensus recommendations of the National Cancer Institute Clinical Trials Planning Meeting. J Clin Oncol. 2010;28:3994–4005. doi:10.1200/JCO.2010.28.7805
6. Wang D, Chang R, Wang G, Hu B, Qiang Y, Chen Z. Polo-like kinase 1-targeting chitosan nanoparticles suppress the progression of hepatocellular carcinoma. Anticancer Agents Med Chem. 2017;17. doi:10.2174/1871520616666160926111911
7. Wu H, Shi X-L, Zhang H-J, et al. Overexpression of ST3Gal-I promotes migration and invasion of HCCLM3 in vitro and poor prognosis in human hepatocellular carcinoma. Onco Targets Ther. 2016;9:2227–2236. doi:10.2147/OTT.S96510
8. Wang G, Chen J-H, Qiang Y, Wang D-Z, Chen Z. Decreased STAT4 indicates poor prognosis and enhanced cell proliferation in hepatocellular carcinoma. World J Gastroenterol. 2015;21:3983–3993. doi:10.3748/wjg.v21.i13.3983
9. Patel A, Sun W. Molecular targeted therapy in hepatocellular carcinoma: from biology to clinical practice and future. Curr Treat Options Oncol. 2014;15:380–394. doi:10.1007/s11864-014-0291-7
10. Kim DW, Talati C, Kim R. Hepatocellular carcinoma (HCC): beyond sorafenib-chemotherapy. J Gastrointest Oncol. 2017;8:256–265. doi:10.21037/jgo.2016.09.07
11. Wang F, Qiang Y, Zhu L, et al. MicroRNA-7 downregulates the oncogene VDAC1 to influence hepatocellular carcinoma proliferation and metastasis. Tumor Biol. 2016;37:10235–10246. doi:10.1007/s13277-016-4836-1
12. Van der Veen AG, Schorpp K, Schlieker C, et al. Role of the ubiquitin-like protein Urm1 as a noncanonical lysine-directed protein modifier. Proc Natl Acad Sci U S A. 2011;108:1763–1770. doi:10.1073/pnas.1014402108
13. Wang F, Liu M, Qiu R, Ji C. The dual role of ubiquitin-like protein Urm1 as a protein modifier and sulfur carrier. Protein Cell. 2011;2:612–619. doi:10.1007/s13238-011-1074-6
14. Benz R. Permeation of hydrophilic solutes through mitochondrial outer membranes: review on mitochondrial porins. Biochim Biophys Acta Rev Biomembr. 1994;1197:167–196. doi:10.1016/0304-4157(94)90004-3
15. Forte M, Blachly-Dyson E. VDAC channels. IUBMB Life. 2001;52:113–118. doi:10.1080/15216540152845902
16. Shoshan-Barmatz V, De Pinto V, Zweckstetter M, Raviv Z, Keinan N, Arbel N. VDAC, a multi-functional mitochondrial protein regulating cell life and death. Mol Aspects Med. 2010;31:227–285. doi:10.1016/j.mam.2010.03.002
17. Camara AKS, Zhou Y, Wen P-C, Tajkhorshid E, Kwok W-M. Mitochondrial VDAC1: a key gatekeeper as potential therapeutic target. Front Physiol. 2017;8:460. doi:10.3389/fphys.2017.00460
18. Ulrich HD. Degradation or maintenance: actions of the ubiquitin system on eukaryotic chromatin. Eukaryot Cell. 2002;1:1–10. doi:10.1128/EC.1.1.1-10.2002
19. Pickart CM, Fushman D. Polyubiquitin chains: polymeric protein signals. Curr Opin Chem Biol. 2004;8:610–616. doi:10.1016/j.cbpa.2004.09.009
20. Sun L, Chen ZJ. The novel functions of ubiquitination in signaling. Curr Opin Cell Biol. 2004;16:119–126. doi:10.1016/j.ceb.2004.02.005
21. Furukawa K, Mizushima N, Noda T, Ohsumi Y. A protein conjugation system in yeast with homology to biosynthetic enzyme reaction of prokaryotes. J Biol Chem. 2000;275:7462–7465. doi:10.1074/jbc.275.11.7462
22. Khoshnood B, Dacklin I, Grabbe C. Urm1: an essential regulator of JNK signaling and oxidative stress in Drosophila melanogaster. Cell Mol Life Sci. 2015;73:1939–1954. doi:10.1007/s00018-015-2121-x
23. Dougherty CJ, Kubasiak LA, Frazier DP, et al. Mitochondrial signals initiate the activation of c-JunN-terminal kinase (JNK) by hypoxia-reoxygenation. FASEB J. 2004;18:1060–1070. doi:10.1096/fj.04-1505com
24. Johnson GL, Nakamura K. The c-jun kinase/stress-activated pathway: regulation, function and role in human disease. Biochim Biophys Acta. 2007;1773:1341–1348. doi:10.1016/j.bbamcr.2006.12.009
25. Lin MT, Beal MF. Mitochondrial dysfunction and oxidative stress in neurodegenerative diseases. Nature. 2006;443:787–795. doi:10.1038/nature05292
26. Vallerie SN, Hotamisligil GS. The role of JNK proteins in metabolism. Sci Transl Med. 2010;2:60rv65–60rv65. doi:10.1126/scitranslmed.3001007
27. Kennedy NJ, Sluss HK, Jones SN, Bar-Sagi D, Flavell RA, Davis RJ. Suppression of Ras-stimulated transformation by the JNK signal transduction pathway. Genes Dev. 2003;17:629–637. doi:10.1101/gad.1062903
28. Bai L, Yoon SO, King PD, Merchant JL. ZBP-89-induced apoptosis is p53-independent and requires JNK. Cell Death Differ. 2004;11:663–673. doi:10.1038/sj.cdd.4401393
29. Tao J, Gao Y, Li MO, et al. JNK2 negatively regulates CD8+ T cell effector function and anti-tumor immune response. Eur J Immunol. 2007;37:818–829. doi:10.1002/eji.200636726
30. Finkel T, Holbrook NJ. Oxidants, oxidative stress and the biology of ageing. Nature. 2000;408:239–247. doi:10.1038/35041687
31. Bogoyevitch MA, Kobe B. Uses for JNK: the many and varied substrates of the c-Jun N-terminal kinases. Microbiol Mol Biol Rev. 2006;70:1061–1095. doi:10.1128/MMBR.00025-06
32. Carboni S, Antonsson B, Gaillard P, Gotteland J-P, Gillon J-Y, Vitte P-A. Control of death receptor and mitochondrial-dependent apoptosis by c-Jun N-terminal kinase in hippocampal CA1 neurones following global transient ischaemia. J Neurochem. 2005;92:1054–1060. doi:10.1111/j.1471-4159.2004.02925.x
33. Pan J, Zhao Y-X, Wang Z-Q, Jin L, Sun Z-K, Chen S-D. Expression of FasL and its interaction with Fas are mediated by c-Jun N-terminal kinase (JNK) pathway in 6-OHDA-induced rat model of Parkinson disease. Neurosci Lett. 2007;428:82–87.
34. Eferl R, Wagner EF. AP-1: a double-edged sword in tumorigenesis. Nat Rev Cancer. 2003;3:859–868.
 © 2020 The Author(s). This work is published and licensed by Dove Medical Press Limited. The full terms of this license are available at https://www.dovepress.com/terms.php and incorporate the Creative Commons Attribution - Non Commercial (unported, v3.0) License.
By accessing the work you hereby accept the Terms. Non-commercial uses of the work are permitted without any further permission from Dove Medical Press Limited, provided the work is properly attributed. For permission for commercial use of this work, please see paragraphs 4.2 and 5 of our Terms.
© 2020 The Author(s). This work is published and licensed by Dove Medical Press Limited. The full terms of this license are available at https://www.dovepress.com/terms.php and incorporate the Creative Commons Attribution - Non Commercial (unported, v3.0) License.
By accessing the work you hereby accept the Terms. Non-commercial uses of the work are permitted without any further permission from Dove Medical Press Limited, provided the work is properly attributed. For permission for commercial use of this work, please see paragraphs 4.2 and 5 of our Terms.