")
Back to Journals » Drug Design, Development and Therapy » Volume 9
Urine metabolomics in rats after administration of ketamine
Authors Wen C, Zhang M, Ma J, Hu L, Wang X, Lin G
Received 3 November 2014
Accepted for publication 25 November 2014
Published 3 February 2015 Volume 2015:9 Pages 717—722
DOI https://doi.org/10.2147/DDDT.S76898
Checked for plagiarism Yes
Review by Single anonymous peer review
Peer reviewer comments 2
Editor who approved publication: Prof. Dr. Wei Duan
Congcong Wen,1 Meiling Zhang,2 Jianshe Ma,2 Lufeng Hu,3 Xianqin Wang,2 Guanyang Lin3
1Laboratory Animal Centre, 2Analytical and Testing Center, 3First Affiliated Hospital of Wenzhou Medical University, Wenzhou, People’s Republic of China
Abstract: In this study, we developed a urine metabonomic method, based on gas chromatography–mass spectrometry (GC-MS), to evaluate the effect of ketamine on rats. Pattern recognition analysis, including both principal component analysis and partial least squares discriminate analysis revealed that ketamine (50 mg/kg) induced metabolic perturbations. Compared with the control group, at day 7, the level of alanine, butanoic acid, glutamine, butanedioic, trimethylsiloxy, L-aspartic acid, D-glucose, cholesterol, acetamide, and oleic acid of the ketamine group was increased, while the level of 2,3,4-trihydroxybutyric acid, benzeneacetic acid, threitol, ribitol, xylitol, and glycine decreased. At day 14, the level of alanine, ethanedioic acid, L-proline, glycerol, tetradecanoic acid, l-serine, l-phenylalanine, L-aspartic acid, d-glucose, cholesterol, heptadecanoic acid, and acetamide in rat urine of the ketamine group was increased, while the 2,3,4-trihydroxybutyric acid, benzeneacetic acid, d-ribose, threitol, ribitol, glycine, pyrazine, and oleic acid levels decreased. Our results indicate that metabonomic methods based on GC-MS may be useful to elucidate ketamine abuse, through the exploration of biomarkers.
Keywords: GC-MS, abuse, biomarker, metabolite
Introduction
Ketamine (2-(2-chlorophenyl)-2-methylamino-cyclohexan-1-one) was first synthesized in 1962 as an anesthetic for human and animal therapeutic use.1,2 It is a noncompetitive N-methyl-D-aspartate (NMDA) receptor antagonist and binds to the phencyclidine receptor, thereby blocking the NMDA receptor channel.3,4 The sedative, amnesic, and analgesic properties of the drug have been well characterized due to its use as a recreational drug.5,6 Ketamine is also used recreationally as a “club drug”,7,8 and there is a concern that ketamine may be used to facilitate sexual assault.9 The use of ketamine as an antidepressant may not be well known but has seen low-dose ketamine emerge as a novel, rapid-acting antidepressant.10 Anesthesiologists use ketamine predominantly as an anesthetic or induction agent and as an analgesic in acute and chronic pain – until recently the two most important indications for ketamine treatment.11 Studies performed by psychiatrists and behavioral scientists in patients with clinical depression, and studies in chronic pain patients showed that ketamine has significant and long-lasting antidepressant effects with a rapid onset of action.12–14
Metabolomics, a global, nontargeted approach to the study of biochemical processes and metabolic networks,15 has been used to identify disease-specific metabolic profiles and biomarkers of central nervous system (CNS) disorders, including major depressive disorder.16–18 Recent studies in patients with major depressive disorder have also investigated changes in metabolomic patterns produced by administration of selective 5-hydroxytryptamine (5-HT) reuptake inhibitors (SSRI) and performed pharmacogenetic analysis to identify glycine and glycine dehydrogenase as citalopram/escitalopram response markers.19,20 Gas chromatography (GC)–mass spectrometry (MS) is an analytic method used frequently in metabolomics studies to examine low-molecular-weight metabolites because GC-MS provides heightened equipment stability and user-friendly tools for data analysis.21,22 This paper evaluates, through the use of GC-MS-based metabolomics, the effect of ketamine abuse on the metabolic profiles of rats.
Material and methods
Chemicals and reagents
N-Methyl-N-(trimethylsilyl) trifluoroacetamide (MSTFA) and trimethylchlorosilane (TMCS) were purchased from Sigma-Aldrich Corp (St Louis, MO, USA). Methylhydroxylamine hydrochloride and pyridine were purchased from Aladdin Industrial, Inc (People’s Republic of China). High-performance liquid chromatography (HPLC)-grade acetonitrile and n-heptane were purchased from Tedia Co, Inc (Fairfield, OH, USA).
Instrumentation and conditions
Agilent Technologies, Inc (Santa Clara, CA, USA) supplied the Agilent 6890N-5975B GC-MS. The column was a HP-5MS (0.25 mm ×30 m ×0.25 mm; Agilent). The GC oven was initially set at 80°C and was kept at this temperature for 5 minutes. The temperature was then gradually increased to 260°C at a rate of 10°C/min and then kept at 260°C for 10 minutes. MS detection was conducted first in EI mode with electron energy of 70 eV, then in full-scan mode with m/z of 50–550, and finally, by splitless injection mode.
Animal treatment and sample collection
Male Sprague Dawley® rats, with weights of 250±20 g, were obtained from the Shanghai SLAC Laboratory Animal Co, Ltd (Shanghai, People’s Republic of China). The animal license number was SCXK (Shanghai) 2012-0005. All thirty rats were housed at the Laboratory Animal Research Center of Wenzhou Medical University, Wenzhou, People’s Republic of China, under the controlled conditions of a temperature of 22°C and a natural light–dark cycle. All experimental procedures were conducted according to the Institutional Animal Care Guidelines and were approved as ethical by the Administration Committee of Experimental Animals at the Laboratory Animal Center of Wenzhou Medical University.
Thirty male Sprague Dawley rats were randomly divided into two groups, the control group (n=15) and the ketamine abuse group (n=15). To create a model of ketamine abuse,23,24 the experimental group received a single intraperitoneal (IP) injection of ketamine hydrochloride dissolved in 500 μL saline, at 9 am each day. At the same time, the control group received a single IP injection of 500 μL saline. All rats were weighed every day to adjust the quantity of ketamine administrated. The rats in the ketamine group continued to receive a daily IP injection of ketamine (50 mg/kg) for 14 days. The rats in the control group received daily IP injection of saline for 14 days. Rats in the ketamine group presented with cataleptic immobility within 1 minute after administration of 50 mg/kg ketamine IP. This was followed by ataxia (head and body swaying) after about 15 minutes, then with falling over and staying still for approximately 1 hour until recovery.24
Urine samples were collected from the rats from the control group and ketamine group for 12 hours (from 8 pm until 8 am the following day) on day 7, 14, and 16, respectively. The urine samples were collected over ice into 0.1 mL of 1% sodium azide solution and then centrifuged for 10 minutes at 4°C. The supernatant was stored at −80°C until measurement.
Sample preparation
The 250 μL of acetonitrile was added to 100 μL of urine, kept in an ice bath for 15 minutes, and then, 10,000 g were centrifuged for 10 minutes at 4°C. Then, 150 μL of the supernatant were transferred to a GC vial and evaporated to dryness under a stream of nitrogen gas. Methoximation was carried out at 70°C for 24 hours after 50 μL of methylhydroxylamine hydrochloride (15 mg/mL in pyridine) was added. Finally, 50 μL of MSTFA (with 1% TMCS as the catalyst) was added and kept at 70°C for another hour, and then vortexed after adding 150 μL n-heptane.25
Data analysis
The GC-MS data was exported into Microsoft Excel®, with the peaks normalized to the total sum of spectrum prior to multivariate analyses. The resulting data was processed through principal component analysis and partial least squares discriminate analysis (PLS-DA) using SIMCA-P 12 software (Umetrics, Umea, Sweden). PLS-DA was used to reveal the differences in urine composition of two different groups; the corresponding loading plots, where each point represented a metabolite, were used to identify which variables contributed to the separation of the samples on the scores plot.
Statistical analysis
Statistical analysis was carried out using SPSS for Windows software (Version13.0; SPSS, Inc, Chicago, IL, USA). Independent samples t-test was applied in order to detect significant differences in all metabolites between two groups. A P-value of <0.05 was considered statistically significant.
Results and discussion
Analytical characteristics of global profiling methods
Figure 1 provides the typical metabolic profiles of urine acquired through the GC-MS technique. Metabolic profile data pretreatment resulted in a final data set consisting of 56 metabolic features from GC-MS analyses. The six quality control samples first investigated the reproducibility of the metabolic features. The GC-MS analysis showed that more than 70% of the 46 metabolic features had a coefficient of variance (CV%) of no more than 30%. The endogenous metabolites in the urine were identified using the National Institute of Standards and Technology (NIST) 2005 MS database.
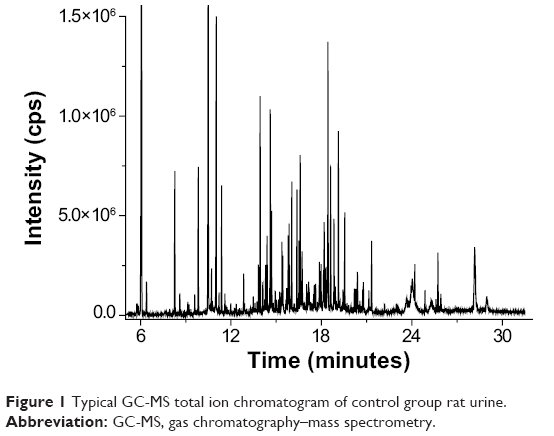 | Figure 1 Typical GC-MS total ion chromatogram of control group rat urine. |
Metabolomics study
Principal component analysis of the results of ketamine abuse provided an unsatisfactory separation of data between the ketamine group and the control group. To improve the classification of the ketamine group and control group, we subsequently used a multivariate PLS-DA classification method to maximize metabolite variations and to identify the metabolites responsible for such variations.
Ketamine, a noncompetitive antagonist of the N-methyl-D-aspartate receptor, was developed in the 1960s as part of an effort to find a safer anesthetic alternative to phencyclidine.26 It was used for the induction and maintenance of general anesthesia for more than 30 years. However, early reports of its untoward central effects, especially hallucinogenic and dissociative experiences in patients anaesthetized with ketamine, have limited its current use to pediatric, geriatric, and veterinary anesthesia.23,27
Ketamine is rapidly metabolized in the liver, by microsomal enzymes, into a series of compounds among which norketamine and hydroxynorketamine are considered the most important.11 However, norketamine, hydroxynorketamine, and ketamine were not observed in the full scan GC-MS profile of ketamine group rat urine. In order to explore the metabolic profile changes from ketamine abuse in rats during different time periods, we compared the PLS-DA for the GC-MS spectrum of the ketamine group, at day 7 and 14, with that of the rats in the control group (Figure 2). The PLS-DA score chart (Figure 2) showed the first principal components of the rats in the ketamine group (at 2 days after the final dose, ie day 16) that were distinguished from the rats in the control group. The corresponding load diagram at day 7 showed that the major metabolites that differed from the control group were pentaric acid, xylitol, butanedioic, alanine, ethanedioic acid, and D-glucose.
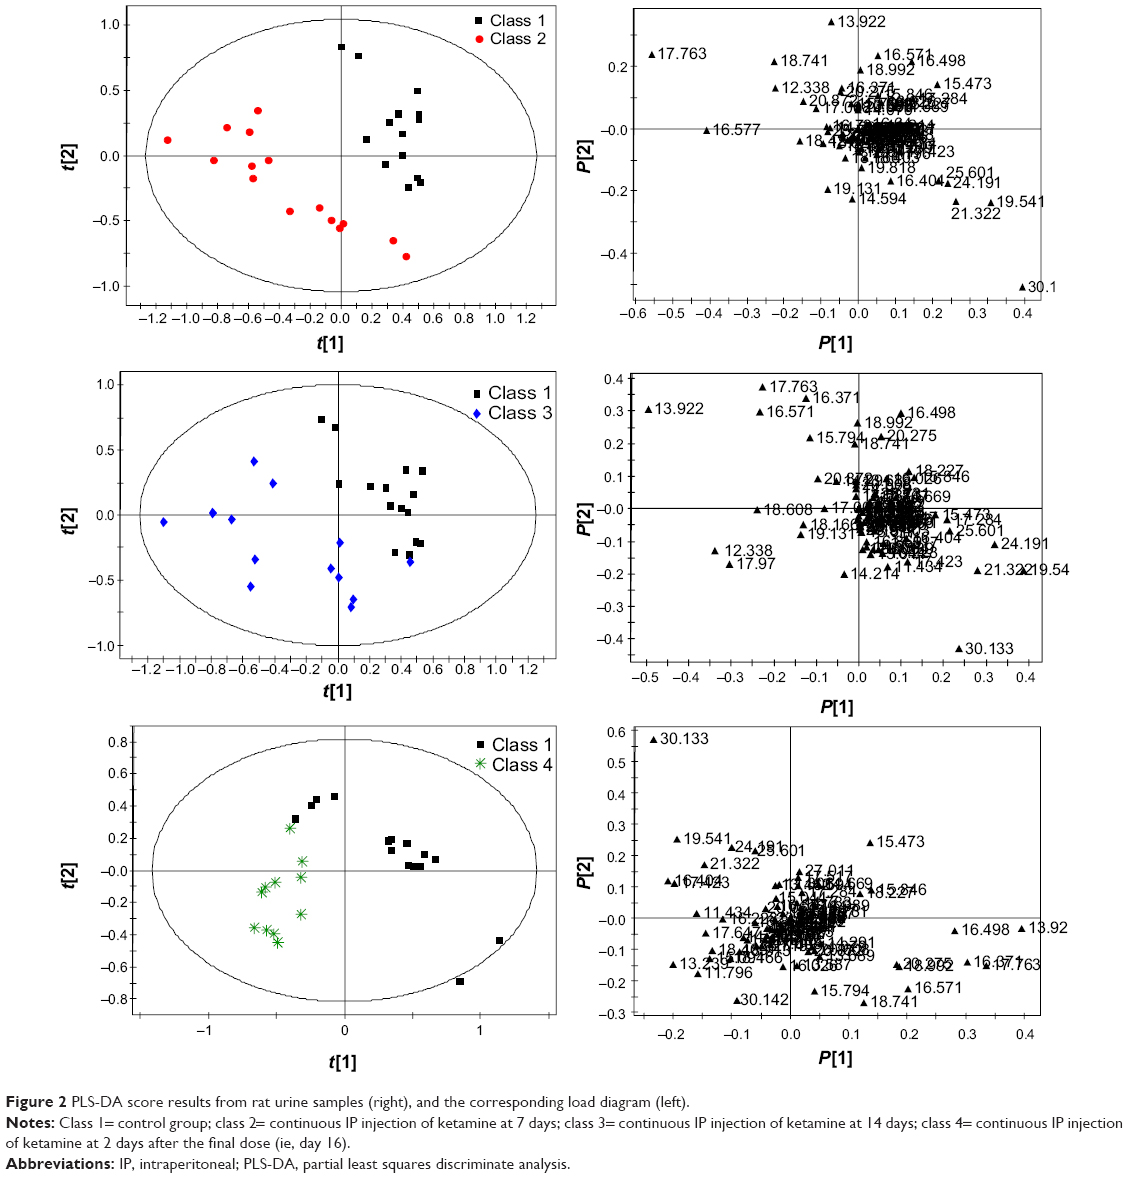 | Figure 2 PLS-DA score results from rat urine samples (right), and the corresponding load diagram (left). |
As demonstrated in Figure 2, the PLS-DA scores for the ketamine group after administration of ketamine for 14 continuous days and the control group were different. The corresponding load diagram better distinguishes the metabolites of the two groups. Figure 2 shows that at day 14, the major metabolites that differed from the control group were ethanedioic acid, tetradecanoic acid, alanine, D-glucose, and heptadecanoic acid. As demonstrated in Figure 2, the PLS-DA score showed that at 2 days after the final dose (day 16), the ketamine group and the control group differed. The corresponding load diagram better distinguishes the metabolites of the two groups. Figure 2 shows the major metabolites that differed from control group were propanoic acid, ethanedioic acid, L-proline, pentanedioic acid, benzeneacetic acid, d-ribose, hexanedioic acid, ribitol, xylitol, D-glucose, pentaric acid, and pyrazine.
Changes in metabolites
The changes in the metabolites between the ketamine groups and their control group were shown in Table 1. Compared with the control group, the level of alanine, butanoic acid, glutamine, butanedioic, trimethylsiloxy, L-aspartic acid, D-glucose, cholesterol, acetamide, and oleic acid of the ketamine group increased after administration for 7 continuous days, while the level of 2,3,4-trihydroxybutyric acid, benzeneacetic acid, threitol, ribitol, xylitol, and glycine decreased. The level of alanine, ethanedioic acid, L-proline, glycerol, tetradecanoic acid, L-serine, L-phenylalanine, L-aspartic acid, d-glucose, cholesterol, heptadecanoic acid, and acetamide in urine of the ketamine group was increased at day 14, while the 2,3,4-trihydroxybutyric acid, benzeneacetic acid, d-ribose, threitol, ribitol, glycine, pyrazine, and oleic acid levels were decreased. D-glucose levels on day 7, 14, and 16 were all different from those of the control group; however, the direction of the change varied. The direction of change at day 7 and 14 was the same but on day 16 was different, maybe representing a withdrawal reaction.
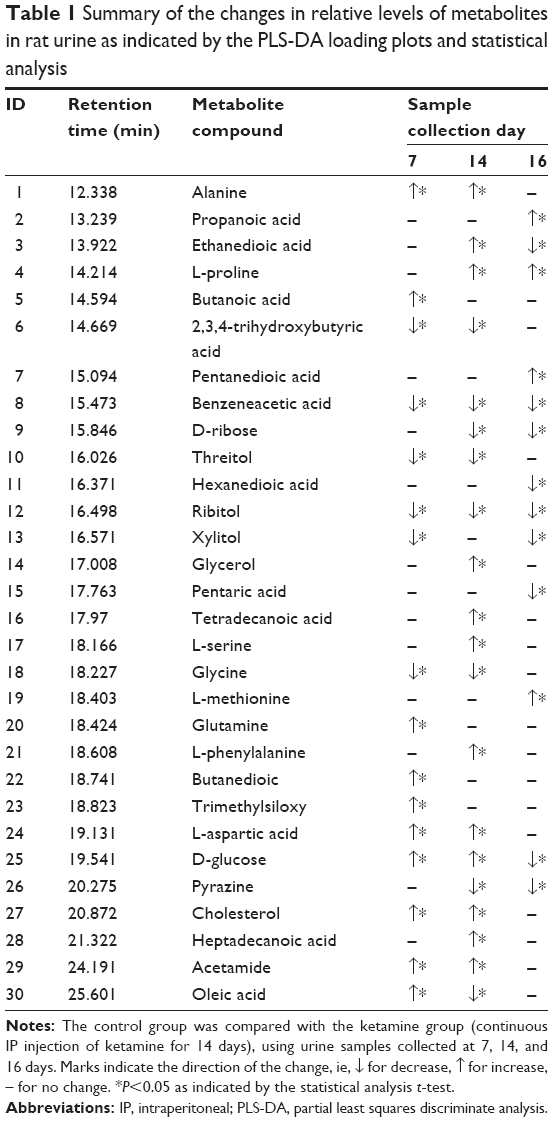 | Table 1 Summary of the changes in relative levels of metabolites in rat urine as indicated by the PLS-DA loading plots and statistical analysis |
Villaseñor et al28 reported the plasma metabolomic patterns in patients receiving ketamine for the treatment of bipolar depression. The major observation was that the differences in the metabolomics patterns observed between patients who responded to treatment and those who did not were not produced by ketamine administration. Instead, the differences appear to set up a biochemical basis for the pharmacological response to ketamine. Thus, pretreatment metabolomics screening may be a guide to the prediction of response and a potential approach for the individualization of ketamine therapy in bipolar depression.28 In this study, we found alanine, 2,3,4-trihydroxybutyric acid, benzeneacetic acid, threitol, ribitol, glycine, L-aspartic acid, D-glucose, cholesterol, and acetamide at different levels between the ketamine and control group. These findings may be useful new evidence in the study of ketamine abuse. Long-term ketamine abuse induces phosphorylation of transgelin in the bladder wall, and this might play an important role in the pathogenesis of ketamine-associated cystitis.23 Additional prospective studies will be required to better understand these observations.
Conclusion
These biomarkers (alanine, 2,3,4-trihydroxybutyric acid, benzeneacetic acid, threitol, ribitol, glycine, L-aspartic acid, D-glucose, cholesterol, and acetamide) were the additional evidence. We demonstrated that metabonomic analysis based on GC-MS could provide a useful tool for exploring biomarkers, to elucidate ketamine abuse in drug therapy.
Acknowledgments
This study was supported by grants from the Zhejiang Provincial Education Department project funding, Y201432003 and Y201431334; the Science and Technology Committee of Shanghai Municipality, People’s Republic of China, No. KF1405.
Disclosure
The authors report no conflict of interest in this work.
References
Domino EF, Chodoff P, Corssen G. Pharmacologic effects of CI-581, a new dissociative anesthetic, in man. Clin Pharmacol Ther. 1965;6:279–291. | ||
White PF, Way WL, Trevor AJ. Ketamine – its pharmacology and therapeutic uses. Anesthesiology. 1982;56(2):119–136. | ||
Fisher K, Coderre TJ, Hagen NA. Targeting the N-methyl-D-aspartate receptor for chronic pain management. Preclinical animal studies, recent clinical experience and future research directions. J Pain Symptom Manage. 2000;20(5):358–373. | ||
Richebé P, Rivat C, Rivalan B, Maurette P, Simonnet G. [Low doses ketamine: antihyperalgesic drug, non-analgesic]. Ann Fr Anesth Reanim. 2005;24(11–12):1349–1359. French. | ||
Lenton S, Boys A, Norcross K. Raves, drugs and experience: drug use by a sample of people who attend raves in Western Australia. Addiction. 1997;92(10):1327–1337. | ||
Fendrich M, Wislar JS, Johnson TP, Hubbell A. A contextual profile of club drug use among adults in Chicago. Addiction. 2003;98(12):1693–1703. | ||
Kenyon SL, Ramsey JD, Lee T, Johnston A, Holt DW. Analysis for identification in amnesty bin samples from dance venues. Ther Drug Monit. 2005;27(6):793–798. | ||
Leong HS, Tan NL, Lui CP, Lee TK. Evaluation of ketamine abuse using hair analysis: concentration trends in a Singapore population. J Anal Toxicol. 2005;29(5):314–318. | ||
Turfus SC, Parkin MC, Cowan DA, et al. Use of human microsomes and deuterated substrates: an alternative approach for the identification of novel metabolites of ketamine by mass spectrometry. Drug Metab Dispos. 2009;37(8):1769–1778. | ||
Naughton M, Clarke G, O’Leary OF, Cryan JF, Dinan TG. A review of ketamine in affective disorders: current evidence of clinical efficacy, limitations of use and pre-clinical evidence on proposed mechanisms of action. J Affect Disord. 2014;156:24–35. | ||
van Velzen M, Dahan A. Ketamine metabolomics in the treatment of major depression. Anesthesiology. 2014;121(1):4–5. | ||
Sigtermans MJ, van Hilten JJ, Bauer MC, et al. Ketamine produces effective and long-term pain relief in patients with complex regional pain syndrome type 1. Pain. 2009;145(3):304–311. | ||
Berman RM, Cappiello A, Anand A, et al. Antidepressant effects of ketamine in depressed patients. Biol Psychiatry. 2000;47(4):351–354. | ||
Murrough JW. Ketamine as a novel antidepressant: from synapse to behavior. Clin Pharmacol Ther. 2012;91(2):303–309. | ||
Kaddurah-Daouk R, Kristal BS, Weinshilboum RM. Metabolomics: a global biochemical approach to drug response and disease. Annu Rev Pharmacol Toxicol. 2008;48:653–683. | ||
Schwarz E, Bahn S. The utility of biomarker discovery approaches for the detection of disease mechanisms in psychiatric disorders. Br J Pharmacol. 2008;153 Suppl 1:S133–S136. | ||
Kaddurah-Daouk R, Krishnan KR. Metabolomics: a global biochemical approach to the study of central nervous system diseases. Neuropsychopharmacology. 2009;34(1):173–186. | ||
Quinones MP, Kaddurah-Daouk R. Metabolomics tools for identifying biomarkers for neuropsychiatric diseases. Neurobiol Dis. 2009;35(2):165–176. | ||
Ji Y, Hebbring S, Zhu H, et al. Glycine and a glycine dehydrogenase (GLDC) SNP as citalopram/escitalopram response biomarkers in depression: pharmacometabolomics-informed pharmacogenomics. Clin Pharmacol Ther. 2011;89(1):97–104. | ||
Abo R, Hebbring S, Ji Y, et al. Merging pharmacometabolomics with pharmacogenomics using ‘1000 Genomes’ single-nucleotide polymorphism imputation: selective serotonin reuptake inhibitor response pharmacogenomics. Pharmacogenet Genomics. 2012;22(4):247–253. | ||
Hiller K, Hangebrauk J, Jäger C, Spura J, Schreiber K, Schomburg D. MetaboliteDetector: comprehensive analysis tool for targeted and nontargeted GC/MS based metabolome analysis. Anal Chem. 2009;81(9):3429–3439. | ||
Tsugawa H, Tsujimoto Y, Arita M, Bamba T, Fukusaki E. GC/MS based metabolomics: development of a data mining system for metabolite identification by using soft independent modeling of class analogy (SIMCA). BMC Bioinformatics. 2011;12:131. | ||
Gu D, Huang J, Shan Z, Yin Y, Zheng S, Wu P. Effects of long-term ketamine administration on rat bladder protein levels: a proteomic investigation using two-dimensional difference gel electrophoresis system. Int J Urol. 2013;20(10):1024–1031. | ||
Gu D, Huang J, Yin Y, Shan Z, Zheng S, Wu P. Long-term ketamine abuse induces cystitis in rats by impairing the bladder epithelial barrier. Mol Biol Rep. 2014;41(11):7313–7322. | ||
Zhang M, Deng M, Ma J, Wang X. An evaluation of acute hydrogen sulfide poisoning in rats through serum metabolomics based on gas chromatography-mass spectrometry. Chem Pharm Bull (Tokyo). 2014;62(6):505–507. | ||
Harrison NL, Simmonds MA. Quantitative studies on some antagonists of N-methyl D-aspartate in slices of rat cerebral cortex. Br J Pharmacol. 1985;84(2):381–391. | ||
Muetzelfeldt L, Kamboj SK, Rees H, Taylor J, Morgan CJ, Curran HV. Journey through the K-hole: phenomenological aspects of ketamine use. Drug Alcohol Depend. 2008;95(3):219–229. | ||
Villaseñor A, Ramamoorthy A, Silva dos Santos M, et al. A pilot study of plasma metabolomic patterns from patients treated with ketamine for bipolar depression: evidence for a response-related difference in mitochondrial networks. Br J Pharmacol. 2014;171(8):2230–2242. |
 © 2015 The Author(s). This work is published and licensed by Dove Medical Press Limited. The full terms of this license are available at https://www.dovepress.com/terms.php and incorporate the Creative Commons Attribution - Non Commercial (unported, v3.0) License.
By accessing the work you hereby accept the Terms. Non-commercial uses of the work are permitted without any further permission from Dove Medical Press Limited, provided the work is properly attributed. For permission for commercial use of this work, please see paragraphs 4.2 and 5 of our Terms.
© 2015 The Author(s). This work is published and licensed by Dove Medical Press Limited. The full terms of this license are available at https://www.dovepress.com/terms.php and incorporate the Creative Commons Attribution - Non Commercial (unported, v3.0) License.
By accessing the work you hereby accept the Terms. Non-commercial uses of the work are permitted without any further permission from Dove Medical Press Limited, provided the work is properly attributed. For permission for commercial use of this work, please see paragraphs 4.2 and 5 of our Terms.