")
Back to Journals » Journal of Asthma and Allergy » Volume 13
Urinary Metabolomic Profiling Reveals Biological Pathways and Predictive Signatures Associated with Childhood Asthma
Authors Li S, Liu J, Zhou J, Wang Y, Jin F, Chen X, Yang J , Chen Z
Received 9 September 2020
Accepted for publication 20 November 2020
Published 18 December 2020 Volume 2020:13 Pages 713—724
DOI https://doi.org/10.2147/JAA.S281198
Checked for plagiarism Yes
Review by Single anonymous peer review
Peer reviewer comments 2
Editor who approved publication: Dr Amrita Dosanjh
Shuxian Li,1,* Jinling Liu,1,* Junfen Zhou,1,2 Yingshuo Wang,1 Fang Jin,1 Xiaoyang Chen,3 Jun Yang,4,5 Zhimin Chen1
1Department of Pulmonology, Children’s Hospital, Zhejiang University School of Medicine, National Clinical Research Center for Child Health, Hangzhou, Zhejiang 310052, China; 2Department of Pediatrics, Wenling Maternal and Child Health Care Hospital, Wenling, Zhejiang 317500, China; 3Developmental and Behavioral Department, Children’s Hospital, Zhejiang University School of Medicine, National Clinical Research Center for Child Health, Hangzhou, Zhejiang 310052, China; 4Collaborative Innovation Center for Diagnosis and Treatment of Infectious Disease, First Affiliated Hospital, Zhejiang University, Hangzhou, Zhejiang 310013, China; 5Department of Toxicology, Hangzhou Normal University School of Public Health, Hangzhou, Zhejiang 310016, China
*These authors contributed equally to this work
Correspondence: Zhimin Chen
Department of Pulmonology, Children’s Hospital, Zhejiang University School of Medicine, National Clinical Research Center for Child Health, 3333 Binsheng Road, Hangzhou, Zhejiang 310052, China
Tel +86 571 8887 3731
Fax +86 571 8703 3296
Email [email protected]
Jun Yang
Department of Toxicology, Hangzhou Normal University, Hangzhou, Zhejiang 310016, China
Tel/Fax + 86 571 8820 8141
Email [email protected]
Background: Despite considerable efforts, the pathogenic mechanisms of asthma are still incompletely understood, due to its heterogeneous nature. However, metabolomics can offer a global view of a biological system, making it a valuable tool for further elucidation of mechanisms and biomarker discovery in asthma.
Methods: GC-MS–based metabolomic analysis was conducted for comparison of urine metabolic profiles between asthmatic children (n=30) and healthy controls (n=30).
Results: An orthogonal projections to latent structures discriminant–analysis model revealed a clear separation of the asthma and control groups (R2x=0.137, R2y=0.947, Q2=0.82). A total of 20 differential metabolites were identified as discriminant factors, of which eleven were significantly increased and nine decreased in the asthma group compared to the control group. Pathway-enrichment analysis based on these differential metabolites indicated that sphingolipid metabolism, protein biosynthesis, and citric acid cycle were strongly associated with asthma. Among the identified metabolites, 2-hydroxybutanoic acid showed excellent discriminatory performance for distinguishing asthma from healthy controls, with an AUC of 0.969.
Conclusion: Our study revealed significant changes in the urine metabolome of asthma patients. Several perturbed pathways (eg, sphingolipid metabolism and citric acid cycle) may be related to asthma pathogenesis, and 2-hydroxybutanoic acid could serve as a potential biomarker for asthma diagnosis.
Keywords: asthma, metabolomics, sphingolipid metabolism, citric acid cycle, biomarker
Introduction
Asthma is the most common chronic inflammatory airway disease in childhood, and is characterized by airway hyperresponsiveness coupled with reversible airway obstruction.1 High prevalence of asthma in children is found in both high-income countries and low- and middle-income countries.1 For instance, asthma affects approximately 6 million children in the US.2 As one of the most asthma-afflicted countries, China has nearly 30 million asthmatics, 10 million of which are children.3 Also, the Chinese National Cooperative Group on Childhood Asthma reported the prevalence of asthma in children aged 0–14 years in China was 0.09%–2.60% in 1990, 0.52%–3.34% in 2000, and 0.42%–5.73% in 2010, with the national average being 0.91%, 1.54%, and 2.32%, respectively, indicating the increasing number of pediatric asthma patients over the last few decades.4 As a result, childhood asthma imposes a heavy burden on both society and individual families, due to increased hospital visits, health-care costs, and parental absence from work, compared to asthma in adults.1,5,6 Despite considerable advances in diagnosis and long-term management, asthma still accounts for 0–0.7 per 100,000 deaths in children globally and remains a serious public health concern.1
Currently, inhaled and oral corticosteroids, inhaled short-acting and long-acting β2 agonists, and leukotriene-receptor antagonists are commonly used as therapeutic drugs for asthma;7 however, some patients show completely refractory responses to these treatments.8,9 Even worse, side effects, including osteoporosis, immunosuppression, mood changes, and hypothalamic–pituitary–adrenal axis suppression, have been found to be associated with corticosteroid intake at high doses or prolonged use of inhaled corticosteroids.10 As a multifaceted disease, asthma is influenced by interactions among multiple genetic, epigenetic, and environmental factors.11 Although a number of genetic determinants have been identified, incomplete understanding of molecular determinants as mediators of asthma pathogenesis are major impediments to asthma prevention and treatment.12,13 Given the heterogeneity of underlying pathogenesis, early diagnosis and management of asthma are considerably more difficult in asthmatic children, as they undergo rapid biological, developmental, and psychosocial changes in a relatively short period. As such, these issues underscore the crucial need to better understand childhood asthma by identifying potential diagnostic biomarkers/therapeutic targets and illustrating pathophysiological mechanisms.
In recent years, metabolomics, which systematically analyzes the global collection of endogenous small-molecule metabolites (eg, amino acids, lipids, carbohydrates, nucleotides, and organic acids) in biological specimens (eg, biofluid, cells, and tissue), provides a comprehensive assessment of biological processes (eg, redox balance, oxidative stress, signaling transduction, apoptosis, and inflammation).14 For instance, a high-resolution metabolomic study conducted by Khan et al showed that L-homocysteine sulfinic acid and cysteic acid along with carnitine could serve as promising noninvasive biomarkers for early acute myocardial infarction detection.15 Global metabolomic analysis showed nitrogen metabolism and its components (glycine, taurine, and phenylalanine) was a potential effector of the earliest stages of type 2 diabetes pathophysiology,16 indicating metabolomics can be employed in biological studies or biomarker-screening studies. Similarly, several studies have been performed for asthma to identify novel biomarkers and altered pathways and have contributed to better understanding of asthma pathogenesis.17–25 As a result, a variety of metabolic pathways (including glycine, serine, and threonine metabolism, N-acylethanolamine and N-acyltransferase pathways, and glycerophospholipid, retinol,and sphingolipid metabolism) and biological molecules (such as methionine, glutamine, and acetate) have been found to be involved in the progression of asthma.11,17–25 However, most of these studies were conducted in animal models or adult patients. Furthermore, samples used were usually sera or bronchoalveolar lavage fluid. On the other hand, urine-based biomarkers are especially appealing in children,23–25 as urine collection is noninvasive, easily accessible, abundant, stable, and comprehensive in metabolite composition.
Taking into consideration these issues, we aimed to further systematically study metabolic perturbance in asthmatic children by applying GC-MS–based metabolomic analysis to urine samples in the current study. More specifically, our findings not only identify potential biomarkers of interest and provide pathway and mechanistic information but also provide important data complementing previous studies.
Methods
Study Population
Thirty children with asthma and 30 age- and sex-matched healthy controls were recruited from Children’s Hospital, Zhejiang University School of Medicine between March 2015 and August 2015. Asthma diagnosis was confirmed by pediatric respiratory physicians based on clinical history, eg, recurrent cough, recurrent wheeze, shortness of breath, chest tightness, and evidence of reversible airway obstruction of ≥12% increase of forced expiratory volume in 1 second (FEV1) after bronchodilator inhalation, according to Global Initiative for Asthma guidelines.26 Asthmatic subjects with normal lung function free from asthma exacerbations for at least 3 months were considered stable asthmatic patients. Normal lung function was indicated by FEV1, forced vital capacity (FVC), peak expiratory flow ≥80% predicted, and bronchial obstruction FEV1/FVC <90%.26 All asthmatic subjects had used inhaled corticosteroids as a maintenance medication, and all were in stable condition. All asthmatic medications were stopped for at least 3 days before sampling to minimize possible drug effects on urine-metabolite levels. Healthy controls had no history of chronic respiratory condition, allergic diseases, or any other diseases that might influence the results. None of the participants had had acute airway infection in 6 weeks, or were prescribed a particular diet or food deprivation before sampling. At recruitment, children underwent routine blood tests, lung-function assessment and total IgE determination. Meanwhile,demographic and atopic-index data were collected. The Ethics Committee of the Children’s Hospital, Zhejiang University School of Medicine approved the study, and all parents provided written informed consent prior to sample and data collection. All methods were conducted in accordance with the principles of the Declaration of Helsinki.
Urine-Sample Collection and Preparation
Early-morning midstream-urine specimens were collected following overnight fasting, centrifuged at 3,000 rpm for 10 minutes at 4°C to remove debris, and then the supernatants were kept at −80°C until analysis. After being thawed at room temperature and centrifuged at 10,000 rpm for 5 minutes, 200 μL urine samples were treated with 20 μL urease to degrade the urea at 37°C for 60 minutes. Then, 40 μL 0.1 mg/mL L-2-chlorophenylalanine (Hengbai Biotech, Shanghai, China) was added as an internal standard and vortex-mixed for 30 seconds. Subsequently, 600 μL methanol was added to this solution, followed by centrifugation at 13,000 rpm for 10 minutes at 4°C to precipitate the protein. Thereafter, the supernatant was transferred to a new tube and dried under a stream of N2 gas. Before analysis, the dried metabolic extracts were dissolved in 30 μL methoxyamine solution (20 mg/mL in pyridine) at 37°C for 90 minutes. Later, 30 μL methyl-N-trimethylsilyltrifluoroacetamide with 1% chlorotrimethylsilane was added for trimethylsilylation for 60 minutes at 65°C. After derivatization, the supernatant was subjected to GC-MS analysis. Meanwhile, quality control (QC) samples, used for monitoring the repeatability, stability, and reliability of the analytical method, were prepared by mixing equal volumes (10 μL) of urine samples from all subjects before sample processing. The pooled QC sample was pretreated as aforementioned for experimental samples. Each QC sample was then injected every ten experimental samples throughout the whole assay.
GC-MS Analysis
A 7890 GC system (Agilent Technologies, Santa Clara, CA, USA) coupled with a Pegasus HT time-of-flight mass spectrometer (Leco, St Joseph, MI, USA) was used to analyze the derivative samples. Samples (1 µL) were injected in splitless mode with helium as the carrier gas at a constant flow rate of 1 mL/min, and then separated with an HP5 MS fused-silica capillary column (30 m × 0.25 mm × 0.25 μm; Agilent). The initial column temperature was set at 50°C for 1 minute, raised to 330°C at a rate of 10°C/minute, and then held at 330°C for 5 minutes. Temperatures for the inlet, transfer line, and ion source were 280°C, 280°C, and 250°C, respectively. Ionization was achieved in electron-impact mode at 70 eV. MS data were obtained in full-scan mode across a mass:charge ratio of 30–600 at a rate of 20 spectra per second after a solvent delay of 366 seconds.
Data Processing
Chroma TOF4.3X (Leco) and the Leco-Fiehn Rtx5 database were employed for preprocessing the raw data obtained from GC-MS, including raw peak extraction, data baseline filtering and calibration, peak alignment, deconvolution analysis, peak identification, and integration of the peak area.27 The retention index was used to identify the peak, and index tolerance was 5,000. Metabolites were identified by referring their mass spectra and retention indices of peaks to to the Leco-Fiehn Metabolomics Library. If the similarity value generated from the library were >700, it indicated the metabolite identification was reliable.27 The metabolic features detected in less than half the QC samples were removed. Additionally, missing values of raw data were filled by half the minimum value. The metabolites were left using interquartile-range denoising, and data analysis was accomplished using internal-standard normalization.28 Then, the resultant data of peak numbers, sample names, and normalized peak areas were imported to Simca version 14.0 (Umetrics, Umea, Sweden) for principal-component analysis (PCA) and orthogonal projections to latent structure–discriminant analysis (OPLS-DA) to observe metabolic variations between samples. In detail, PCA was used to display the overall difference, while OPLS-DA was used to verify the model and visualize discrimination between groups.29 Significantly different metabolites were screened by variable importance for projection (VIP) values >1 and p<0.05.29 For detecting the diagnostic capacity of the identified panel, receiver-operating characteristic (ROC) curves and area under the ROC curve (AUC) were computed by R package version 3.1.0.30
Pathway analysis and functional enrichment analysis of metabolites was done with MetaboAnalyst 3.0, which is online software with predictive ability mapped to the Kyoto Encyclopedia of Genes and Genomes metabolic pathway database.31 All identified pathways were shown according to p-values from pathway-enrichment analysis and pathway-impact values from pathway-topology analysis.31 The criteria applied to select significantly altered metabolic pathways were p<0.05 and impact >0.
Statistical Analysis
SPSS version 23.0 was used for statistical analysis of the baseline characteristics of the study subjects. Categorical variables are represented as numbers (percentages) and were analyzed with χ2 tests. Continuous normal–distribution variables are expressed as means ± SD and were analyzed with Student’s t-test, while continuous abnormal-distribution variables are expressed as median (25th–75th percentile) and analyzed with Mann–Whitney U test. Results were considered statistically significant at p<0.05.
Results
Population Characteristics
A total of 60 children were enrolled in this study: 30 asthmatics and 30 healthy controls. Comparison of baseline characteristics of children with asthma and healthy controls is presented in Table 1. There were significant differences in eosinophil percentage, eosinophil count, FVC (% predicted), FEV1 (% predicted), peak expiratory flow (% predicted), total IgE levels, and atopic indices (including pollen, cold air, and mite sensitization) between children with asthma and healthy controls. There were no differences in age, sex, height, weight, BMI, white blood–cell counts, food sensitization, or FEV1/FVC between the groups.
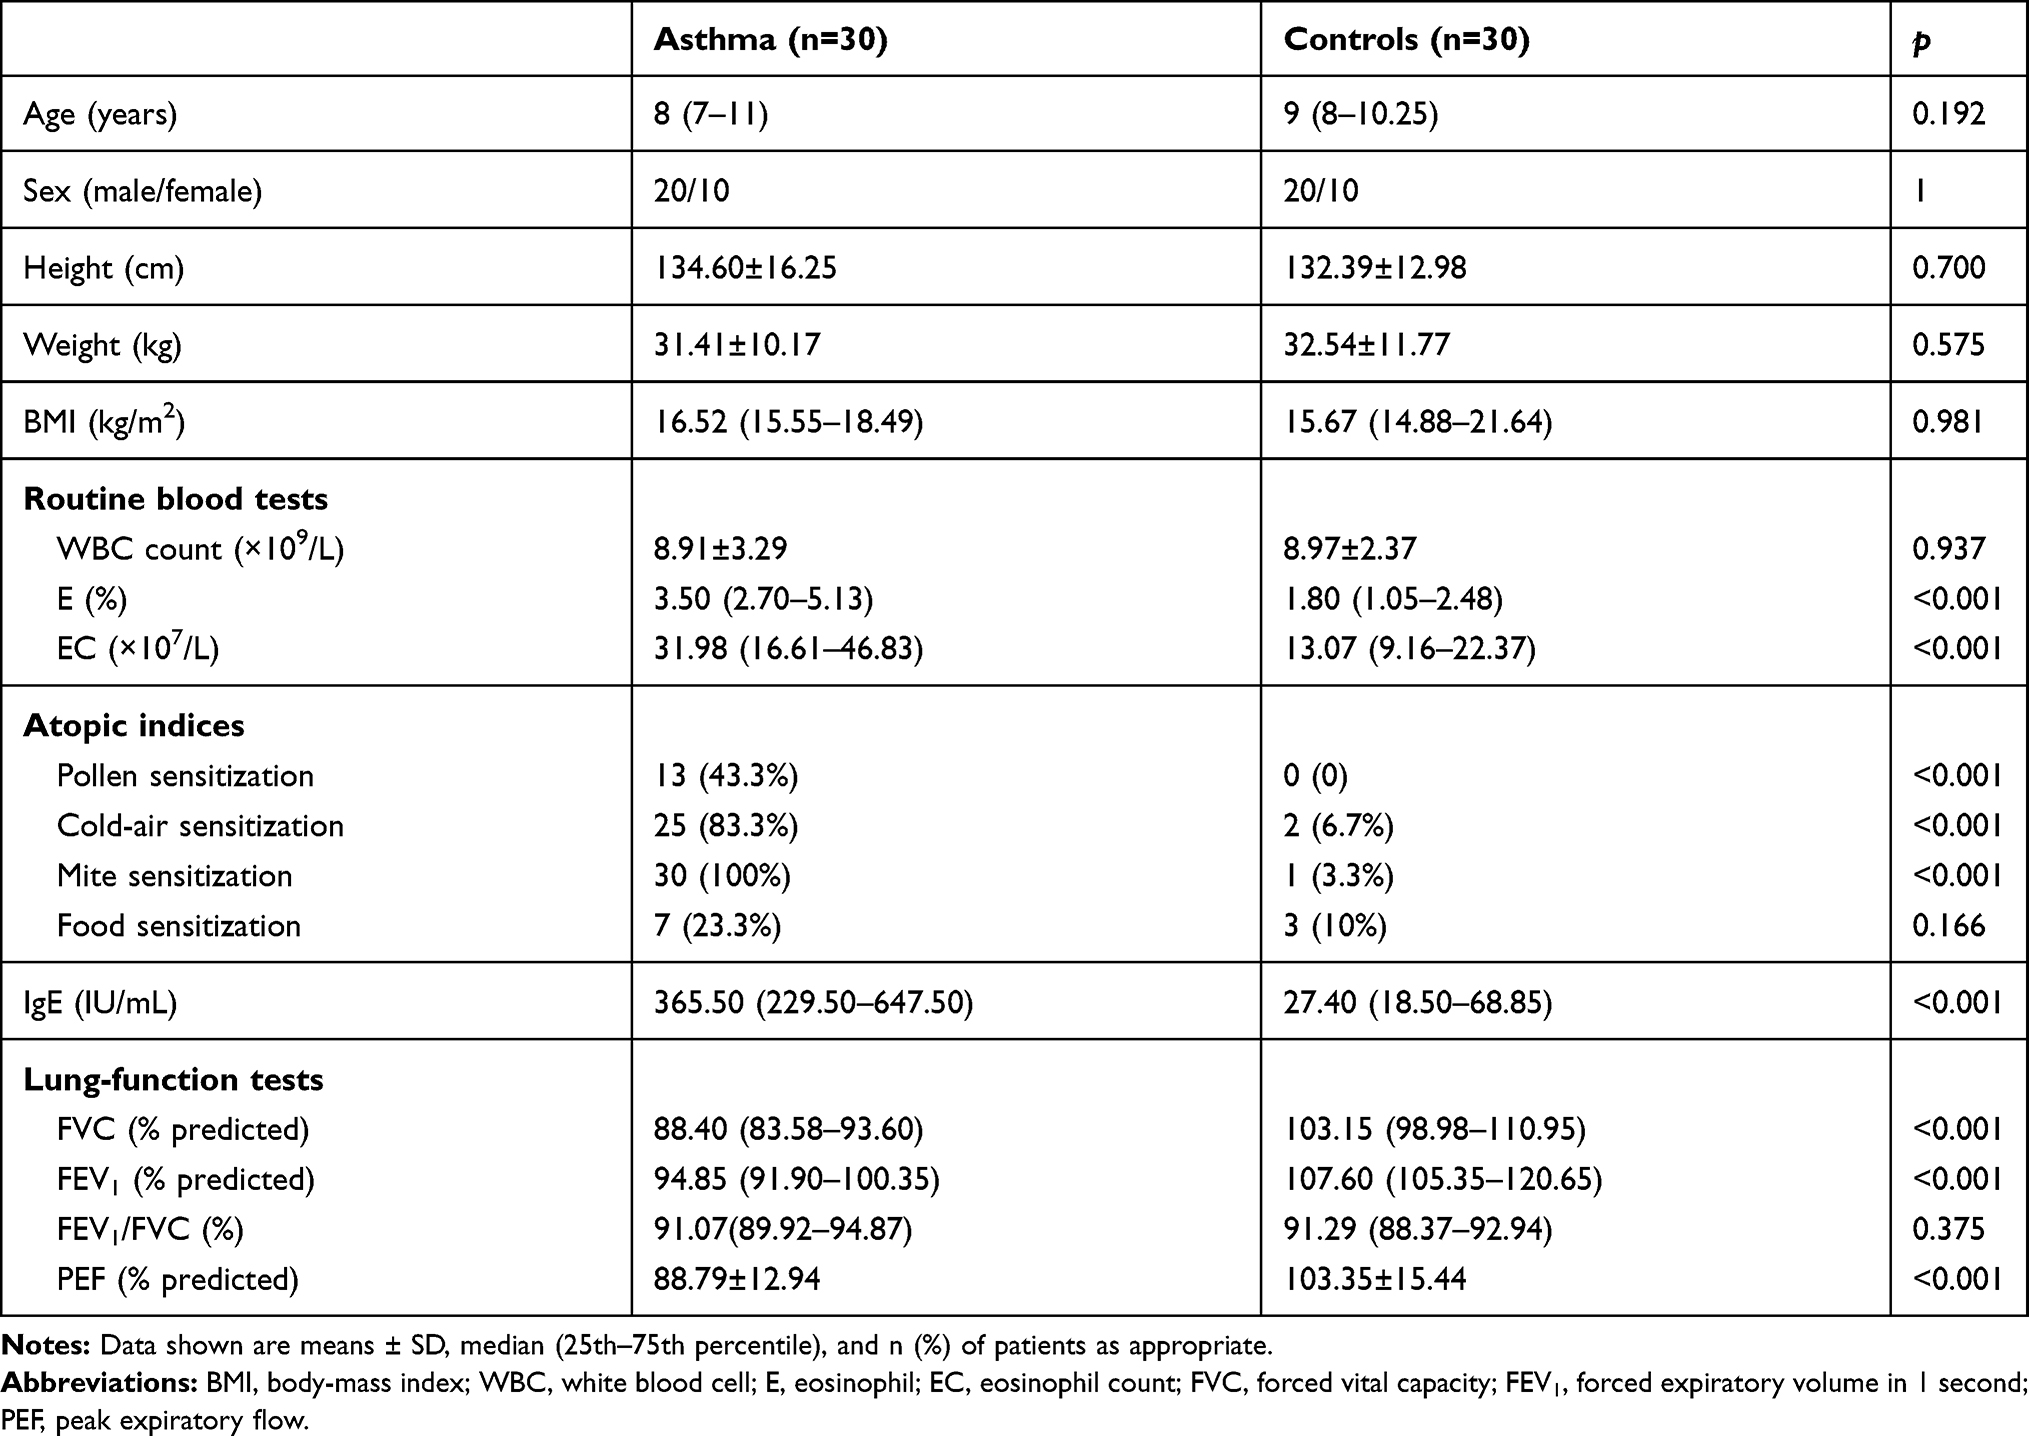 |
Table 1 Baseline Characteristics of the 60 Children Investigated in this Study |
Metabolic Profiling
After GC-MS data processing, 333 peaks were detected (Supplementary Dataset 1). After the missing raw data had been filled by half the minimum value, 232 metabolites (Supplementary Dataset 2) were finally selected through interquartile-range denoising and internal standard normalization.27,28
Initially, PCA was performed to show the distribution of the original data. As shown in the score plots of PCA (Figure 1 and Supplementary Figure 1), although the R2 and Q2 values generated from the PCA model appeared to be low (R2x=0.152, Q2=0.0396), a separation trend of samples between the two groups was observed. Subsequently, OPLS-DA was applied to further improve group separation and get a better understanding of variables responsible for the classification. The score plot of the OPLS-DA model demonstrated that the asthma and control groups were fully separated (R2x=0.137, R2y=0.947, Q2=0.82; Figure 2A), implying robust metabolic differences between the asthma and control groups. Through a permutation test repeated 200 times, Q2 and R2 values were found to be higher than their original values (Figure 2B), suggesting goodness of fit and better predictive capability for the OPLS-DA models.
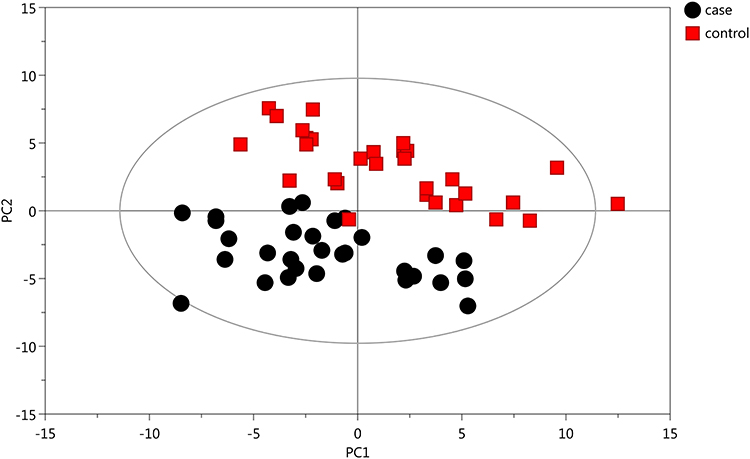 |
Figure 1 PCA model generated based on GC-MS analysis of urine samples from asthmatic and healthy subjects. The X- (PC1) and y-axes (PC2) indicate the first and second principal components, respectively. |
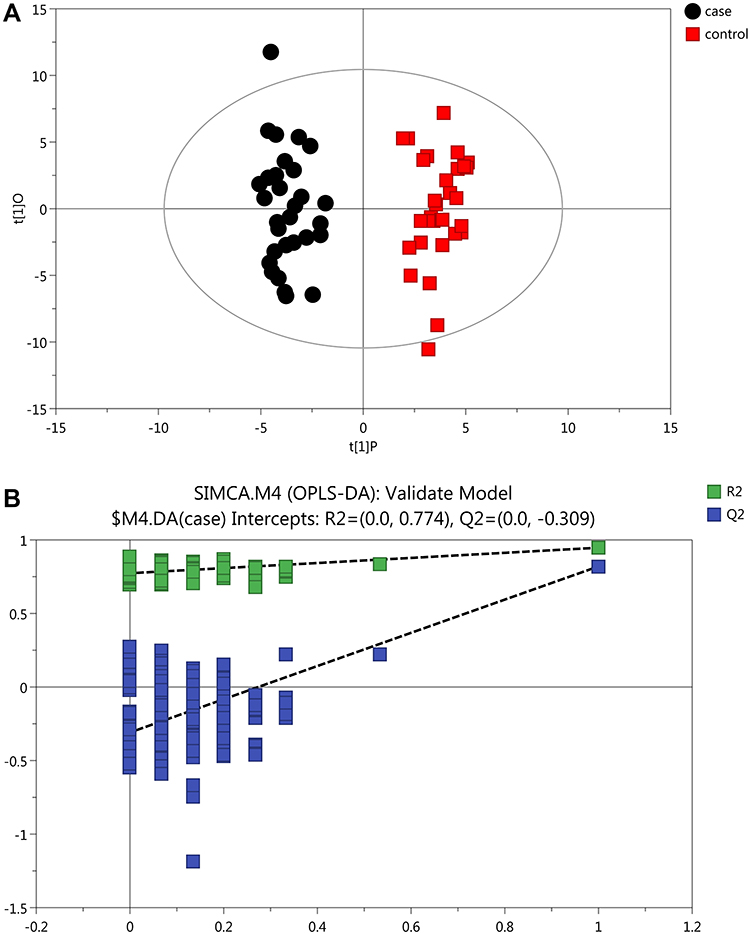 |
Figure 2 OPLS-DA plots with corresponding permutation-test plot obtained from GC-MS metabolite profiles of asthmatic and healthy subjects. (A) Score plot of OPLS-DA model showing clear separation of asthma patients from healthy subjects. The x- (t[1]P) and y- (t[1]O) axes indicate predictive and orthogonal directions, respectively. (B) Permutation test (200×)of the OPLD-DA model showing corresponding permuted values (bottom left) as significantly lower than original R2 and Q2 values (top right), demonstrating the robustness of the OPLS-DA model. R2 and Q2 indicate interpretability and predictability, respectively. |
Potential Metabolite-Biomarker Identification
According to the ranking of VIPs from the OPLS-DA models, 20 metabolites were considered associated with asthma (with VIP >1 and p<0.05): five amino acids, three fatty acids, four organic acids, four sugars, and four aromatic compounds (Table 2). Levels of eleven metabolites — L-allothreonine 1, stearic acid, succinic acid, 2-hydroxybutanoic acid, azelaic acid, gentiobiose 2, tyramine, leucine, D-altrose 1, D-erythrosphingosine 1, and citraconic acid 4 — were significantly higher in urine samples from asthmatic patients than healthy controls. In contrast, levels of nine metabolites — valine, uric acid, methionine 1, 3,4-dihydroxycinnamic acid, purine riboside, malonic acid 1, cysteine, erythrose 1, and lactamide 1 — were significantly lower in the urine of asthmatic patients than control subjects.
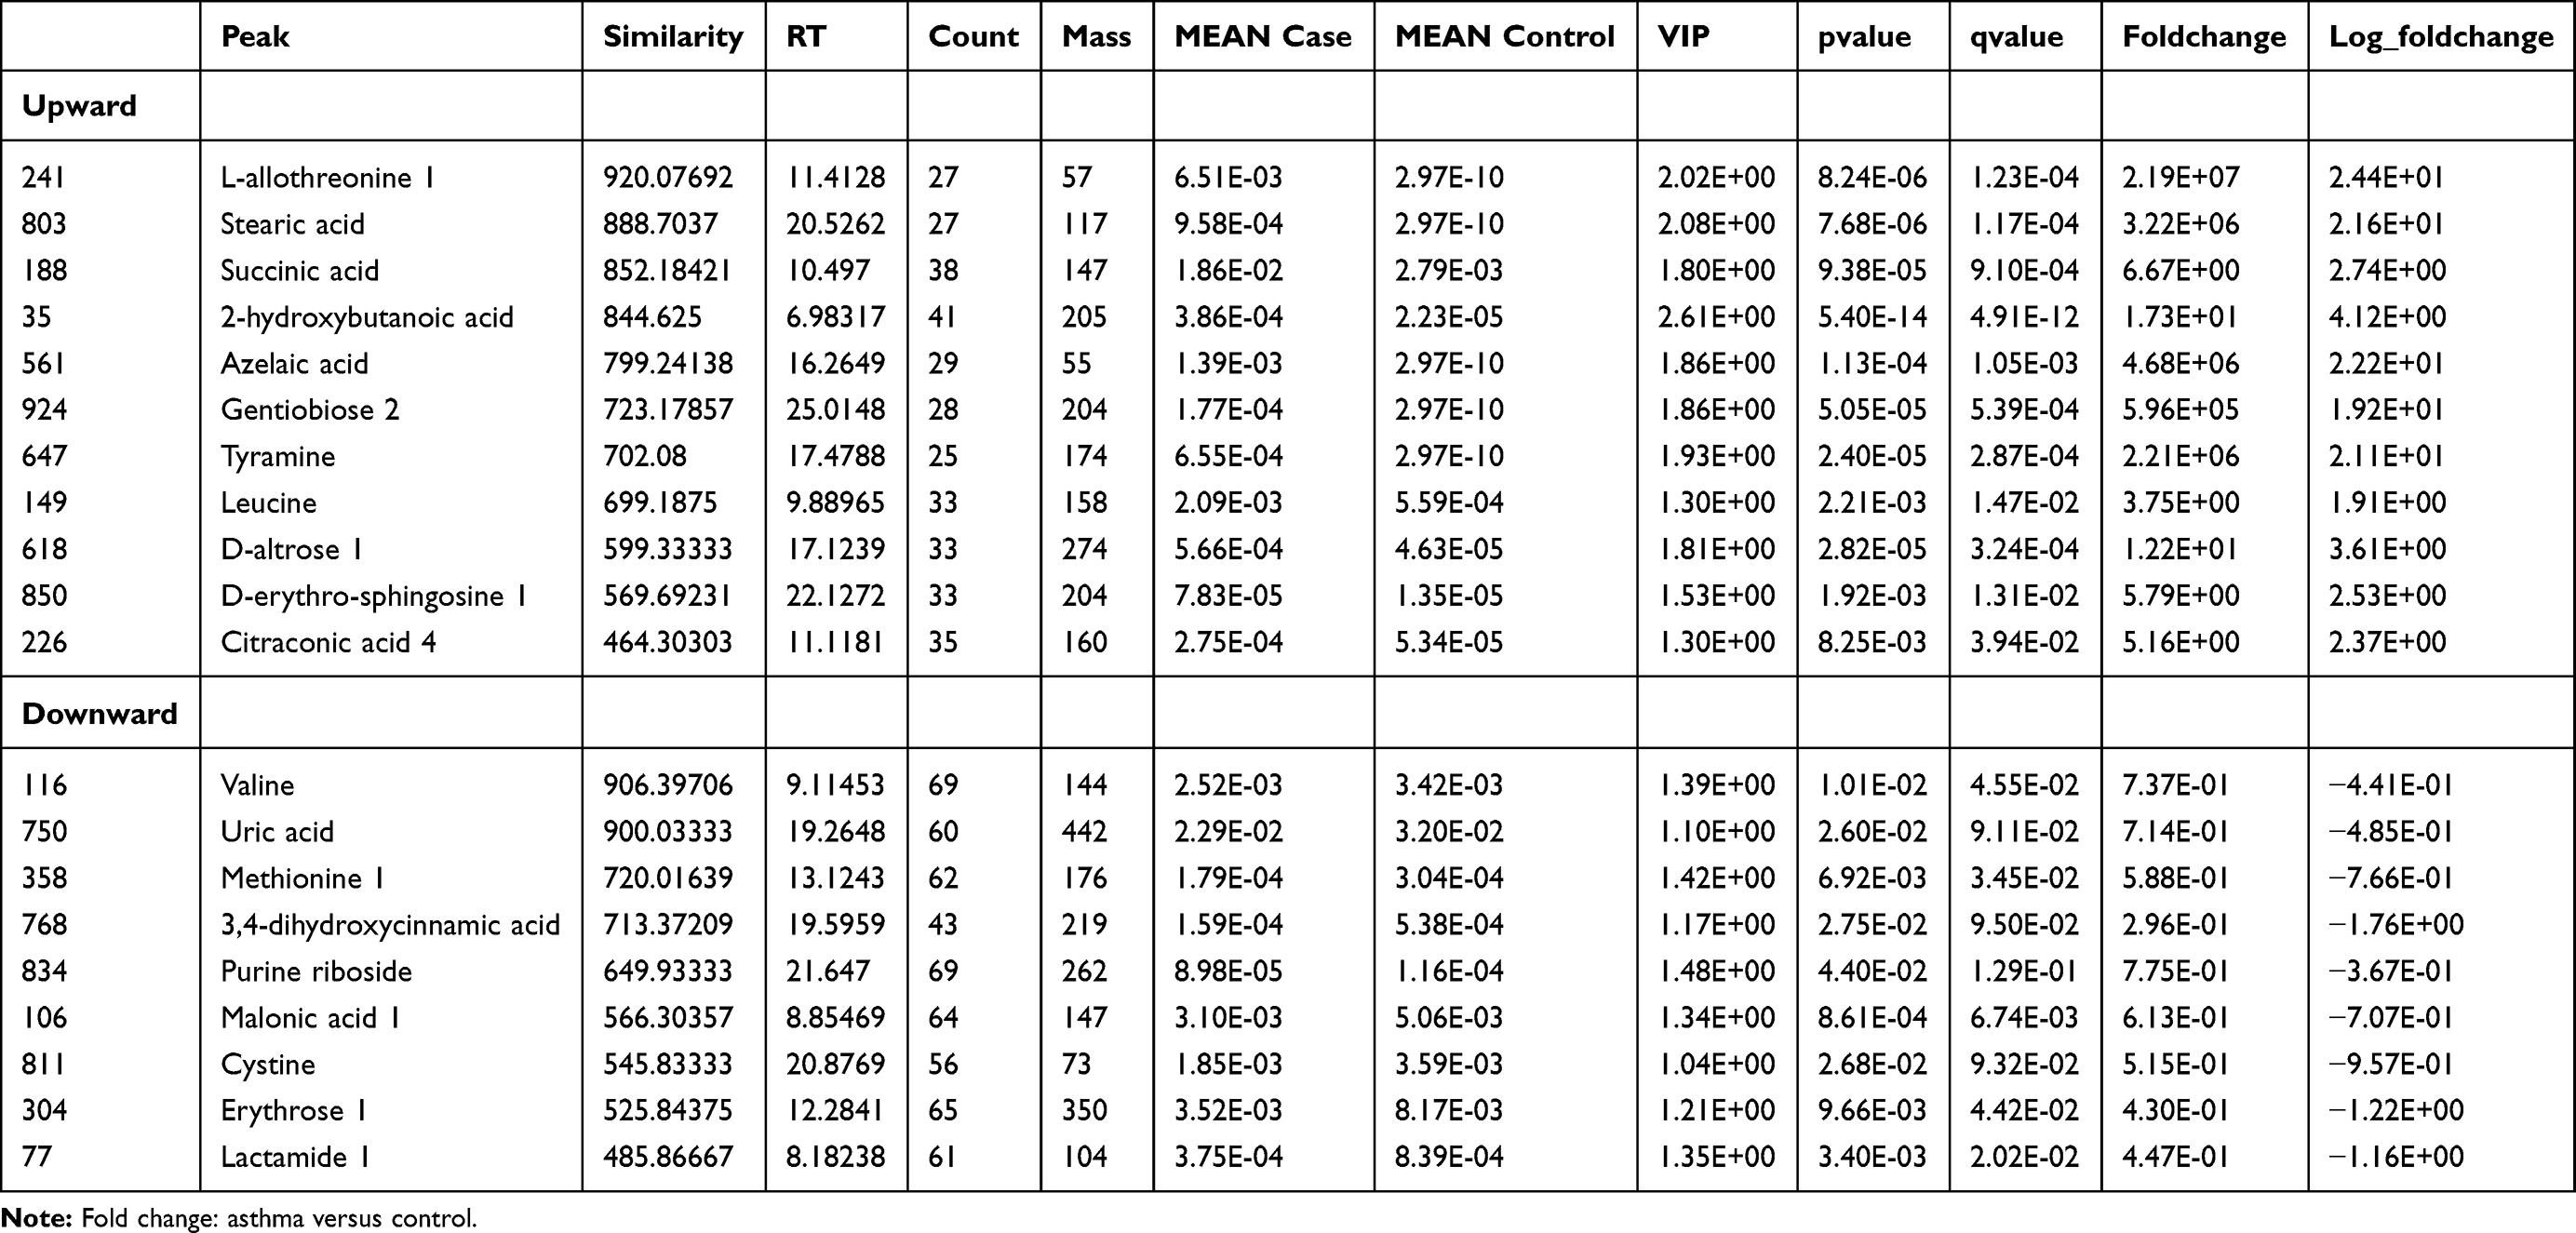 |
Table 2 Identification of Differentially Abundant Metabolites in Urine between Asthmatic and Healthy Subjects |
To further evaluate the diagnostic efficacy of the aforementioned metabolites, ROC curves were constructed and AUCs calculated. As shown in Supplementary Table 1, only 2-hydroxybutanoic acid showed excellent accuracy with AUC of 0.969, sensitivity 96.2%, and specificity of 100% (Figure 3), while ten metabolites showed moderate accuracy (AUC 0.7–0.8) and the remaining nine metabolites showed poor accuracy (AUC <0.7).
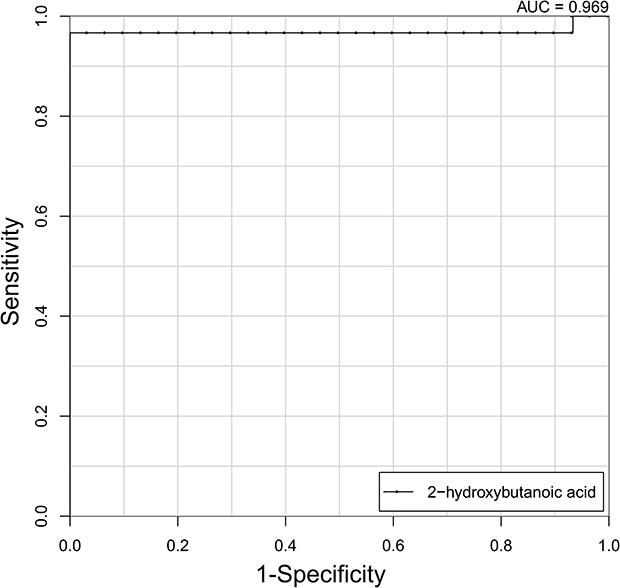 |
Figure 3 ROC analysis of 2-hydroxybutanoic acid for distinguishing asthma patients from healthy controls (AUC=0.969). |
Construction of Metabolic Pathways Based on Differential Metabolites
To further illustrate the underlying meaning of the altered metabolic products, the 20 differential metabolites were imported into MetaboAnalyst 3.0 to conduct pathway and functional enrichment analysis. As shown in Figure 4A and Supplementary Table 2, 32 perturbed metabolic pathways were identified, among which ten were significantly perturbed in asthma patients compared with healthy controls (p<0.05, impact >0). Within these pathways, sphingolipid metabolism (p=0.0003, impact 0.103), citrate cycle (TCA cycle) (p=0.002, impact 0.075), and valine, leucine, and isoleucine biosynthesis (p=0.005, impact 0.034) pathways were highlighted as targets for investigating pathological mechanisms underlying childhood asthma. Functional enrichment analysis revealed that the top-three pathways associated with asthma were sphingolipid metabolism, protein biosynthesis, and citric acid cycle (Figure 4B, Supplementary Table 3).
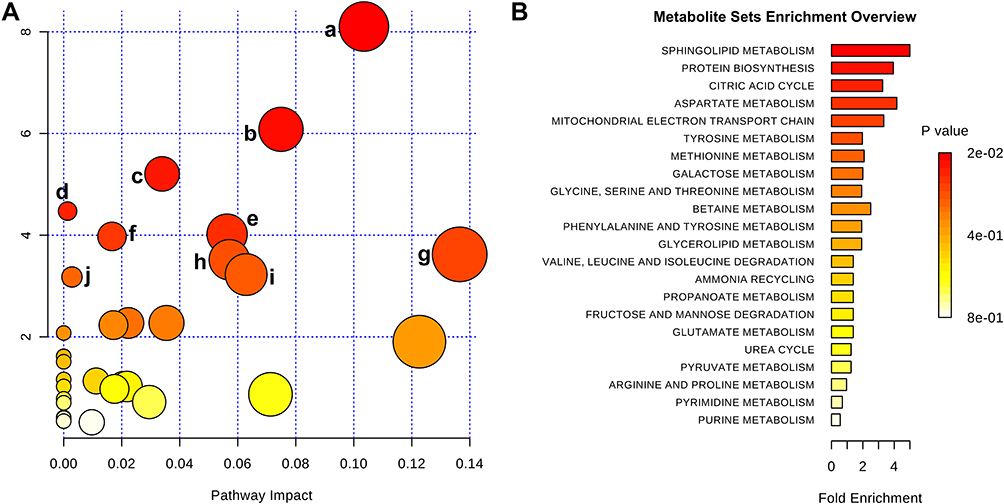 |
Figure 4 Metabolic pathway analysis of differential metabolites identified from asthma patients compared with healthy controls. (A) Significantly changed pathways based on enrichment and topology analyses: sphingolipid metabolism (a), citrate cycle (b), valine, leucine, and isoleucine biosynthesis (c), propanoate metabolism (d), aminoacyl–tRNA biosynthesis (e), tyrosine metabolism (f), glycine, serine, and threonine metabolism (g), glyoxylate and dicarboxylate metabolism (h), cysteine and methionine metabolism (i), and alanine, aspartate, and glutamate metabolism (j). (B) Functional enrichment analysis of pathways. Color depth and column length indicate degree of disturbance. |
Discussion
Despite the clinical and public health concern of asthma, the molecular determinants involved in the pathophysiological processes of asthma are still not fully understood.32 Particularly, the pathogenesis of childhood asthma is different from adult asthma.5 Asthma onset starts early in life and can carry into adulthood.5 As terminal products downstream from genes and proteins, metabolites are inherently sensitive to subtle alteration in biological pathways. Therefore, metabolomic studies have been applied to discover biomarkers/therapeutic targets and reveal underlying mechanisms of various diseases.33 Similarly, in the current study we provided an overview of metabolic changes in asthma during childhood based on a GC-MS metabolomic approach, which broadens our knowledge of pathobiological pathways involved in childhood asthma and sheds light on the prevention, diagnosis, and treatment of asthma at an early age. Moreover, asthma diagnosis relies on clinical manifestations and confirmed expiratory-airflow limitation, but symptoms and pulmonary function measurements may not always reflect the underlying airway inflammation and are insensitive to small variations in inflammatory status.5,32 Indeed, asthmatic children enrolled in the present study were stable and had normal lung function. In other words, the 20 identified metabolites imply an inflammatory condition, which is a characteristic of asthma pathophysiology. Altogether, the major novel finding emerging from our study is the discovery of new molecules, which may pave the way for the development of effective asthma management and the study of metabolic pathways involved in childhood-asthma pathogenesis.
Several studies have also examined metabolic profiles for asthma by applying metabolomic approaches using different biofluids from either experimental asthma models or clinical samples, and some distinct metabolites were identified.18–20 For instance, four eicosanoid-related metabolites identified from portable exhaled breath–condensate metabolomics were found to be related to asthmatic conditions.19 Pang et al reported 18 metabolites in the sera of asthma patients.18 Distinctive compartmental metabolic signatures have also been observed in bronchoalveolar lavage fluid, sera, and lung tissue in a murine model of house dust mite–induced asthma.20 Although the identified metabolites vary from study to study, different study populations, experimental designs, biological samples, disease states, and metabolomic techniques used in these studies might all contribute to these differences. Still, these studies, including ours, could complement each other for in-depth illustration of the pathogenesis of asthma.
Although significant differences exist, common features can also be found among studies. For example, McGeachie et al showed that altered sphingolipid metabolism represented an underlying feature of both asthma control and cellular response to albuterol by integrating metabolomic, genomic, and methylation data.21 In addition, when we analyzed the metabolomic results from Comhair et al,22 sphingolipid metabolism was ranked second in pathway-enrichment analysis (Supplementary Figure 2). Furthermore, previous integrated omics analysis discovered that impaired lung function was associated with dysregulated sphingolipid metabolism in asthma.34 Likewise, enrichment of sphingolipid metabolites is positively correlated with disease severity among infants with bronchiolitis, which is one of the risk factors for asthma development.35,36 Taken together, these observations suggest a key role of dysregulated sphingolipid metabolism in the development of childhood asthma, which might serve as a novel therapeutic target for asthma. Indeed, in asthma mouse models inhibition of sphingosine kinase–attenuated airway inflammation has been demonstrated,37,38 emphasizing the therapeutic potential of this pathway.
As one of the altered sphingolipids identified in our study, D-erythrosphingosine 1 is known to inhibit arachidonic acid release and prostaglandin F2α formation in cells.39 On the other hand, some lipid mediators (eg, cysteinyl leukotrienes) in asthma are produced from arachidonic acid.40 Inflammatory factors produced during the development of asthma may simulate the requirement of energy.41 Interestingly, a prominent change in energy metabolism, eg, the TCA cycle, where most of the body’s energy is generated,42 has been observed in asthma patients (Figure 4). Notably, succinic acid (an intermediate compound in the TCA cycle) is the third–most enriched metabolite in asthma samples (Table 2). This is consistent with previous studies in which higher abundance of succinic acid in the urine or serum of asthmatic patients was reported.11,43,44 Additionally, branched-chain amino acids, including valine, leucine, and isoleucine, showed changes in asthma patients. Of note, valine and leucine affect the TCA cycle through succinyl-CoA formation and acetyl-CoA formation, respectively. It was noted that methionine, a glucogenic amino acid and potential energy source, was decreased in the urine of asthma patients in our study. Collectively, our results provide evidence that asthma is tightly associated with abnormalities in energy metabolism, especially the TCA cycle.
We also report for the first time that levels of 2-hydroxybutanoic acid were significantly higher in the asthma group than healthy subjects (Table 2). The underlying biochemical mechanism may involve increased lipid oxidation and oxidative stress in asthma pathogenesis, because 2-hydroxybutanoic acid is produced from threonine and methionine catabolism, as well as glutathione metabolism.45 It might also be related to the altered energy metabolism, as it has been reported that 2-hydroxybutanoic acid can alter the intracellular balance of acetyl-CoA, succinyl-CoA, and NAD, which are all important molecules in the TCA cycle.46 We found that 2-hydroxybutanoic acid possessed the highest AUC (0.969) and was able to distinguish asthma from healthy controls (Figure 3) in the present study. This suggested 2-hydroxybutanoic acid might be of great importance as a biomarker in diagnosing asthma or monitoring asthma progression. Interestingly, 2-hydroxybutanoic acid has been shown to be a reliable marker for early-stage type 2 diabetes.47 On the other hand, studies have shown that exogenous 2-hydroxybutanoic acid has therapeutic benefits against stress conditions, such as kidney injury,48 depression,49 Alzheimer’s disease, and atherosclerosis.50 Further studies are warranted to discover the precise function of 2-hydroxybutanoic acid in asthma.
There are several limitations to our study. Firstly, this was a single-center study with a relatively small sample. Our results cannot be fully extrapolated to all asthmatic patients, as we recruited only pediatric patients with stable asthma. These results should be validated in a multicenter prospective and larger-scale study to evaluate our findings to discriminate asthma from healthy controls. Secondly, the biomarkers identified in the present study may not be specific for asthma. A new study comparing differential metabolites for asthma and other lung diseases (eg, cystic fibrosis and idiopathic pulmonary fibrosis) will help identify specific biomarkers for asthma. Thirdly, the mechanisms behind the relationship between asthma and differential metabolites remain to be elucidated. Further studies involving molecular/cellular biology and animal models are required to reveal potential pathological mechanisms of asthma comprehensively. Fourthly, we could not determine whether the metabolic changes in urine were the cause or consequence of asthma. Finally, given the pilot nature of this study, other possible confounding factors, such as ethnicity, passive smoking, lifestyle, and diet, were not taken into consideration. Altogether, it is still a great challenge to obtain systematic metabolome changes, because of complexity and individual factors. Further investigations are still necessary to translate metabolomics into clinical practice.
In summary, we observed metabolic dysregulation in urine samples of asthma patients. Sphingolipid metabolism and energy metabolism (TCA cycle) were the top-two altered pathways, and might be involved in the pathogenesis of asthma. Moreover, 2-hydroxybutanoic acid displayed good diagnostic performance in distinguishing asthma patients from healthy individuals.
Abbreviations
ROC, receiver-operating characteristic; GC-MS, gas chromatography-mass spectrometry; AUC, area under the ROC curve; PCA, principal-component analysis; OPLS-DA, orthogonal projections to latent structure–discriminant analysis; VIP, variable importance for projection.
Acknowledgments
We thank all the children enrolled in this study and their guardians for the support. Also, we thank all the doctors and nurses who helped with this study.
Author Contributions
All authors contributed to data analysis, drafting or revising the article, have agreed on the journal to which the article will be submitted, gave final approval to the version to be published, and agree to be accountable for all aspects of the work.
Funding
The work was supported by grants from the National Natural Science Foundation of China (31971138), Education Department Project of Zhejiang Province (Y201534178), and Zhejiang Provincial Natural Science Foundation (LQ20H190006).
Disclosure
The authors declare that they have no conflict of interests.
References
1. Asher I, Pearce N. Global burden of asthma among children. Int J Tuberc Lung Dis. 2014;18(11):1269–1278. doi:10.5588/ijtld.14.0170
2. Bruzzese JM, Kattan M. School-based interventions: where do we go from here? J Allergy Clin Immunol. 2019;143(2):550–551. doi:10.1016/j.jaci.2018.10.031
3. Chen ZH, Wang PL, Shen HH. Asthma research in China: a five-year review. Respirology. 2013;18(Suppl 3):10–19. doi:10.1111/resp.12196
4. Zhang J, Dai J, Yan L, et al. Air pollutants, climate, and the prevalence of pediatric asthma in urban areas of China. Biomed Res Int. 2016;2016:2935163. doi:10.1155/2016/2935163
5. Lee-Sarwar KA, Bacharier LB, Litonjua AA. Strategies to alter the natural history of childhood asthma. Curr Opin Allergy Clin Immunol. 2017;17(2):139–145. doi:10.1097/ACI.0000000000000340
6. Gong T, Lundholm C, Rejno G, Mood C, Langstrom N, Almqvist C. Parental socioeconomic status, childhood asthma and medication use–a population-based study. PLoS One. 2014;9(9):e106579. doi:10.1371/journal.pone.0106579
7. Gibeon D, Menzies-Gow A. Recent changes in the drug treatment of allergic asthma. Clin Med. 2013;13(5):477–481. doi:10.7861/clinmedicine.13-5-477
8. Tan HT, Sugita K, Akdis CA. Novel biologicals for the treatment of allergic diseases and asthma. Curr Allergy Asthma Rep. 2016;16(10):70. doi:10.1007/s11882-016-0650-5
9. Uwaezuoke SN, Ayuk AC, Eze JN. Severe bronchial asthma in children: a review of novel biomarkers used as predictors of the disease. J Asthma Allergy. 2018;11:11–18. doi:10.2147/JAA.S149577
10. Manson SC, Brown RE, Cerulli A, Vidaurre CF. The cumulative burden of oral corticosteroid side effects and the economic implications of steroid use. Respir Med. 2009;103(7):975–994. doi:10.1016/j.rmed.2009.01.003
11. Jung J, Kim SH, Lee HS, et al. Serum metabolomics reveals pathways and biomarkers associated with asthma pathogenesis. Clin Exp Allergy. 2013;43(4):425–433. doi:10.1111/cea.12089
12. Ober C, Yao TC. The genetics of asthma and allergic disease: a 21st century perspective. Immunol Rev. 2011;242(1):10–30. doi:10.1111/j.1600-065X.2011.01029.x
13. Moffatt MF, Gut IG, Demenais F, et al. A large-scale, consortium-based genomewide association study of asthma. N Engl J Med. 2010;363(13):1211–1221. doi:10.1056/NEJMoa0906312
14. Wishart DS. Metabolomics for investigating physiological and pathophysiological processes. Physiol Rev. 2019;99(4):1819–1875. doi:10.1152/physrev.00035.2018
15. Khan A, Choi Y, Back JH, Lee S, Jee SH, Park YH. High-resolution metabolomics study revealing l-homocysteine sulfinic acid, cysteic acid, and carnitine as novel biomarkers for high acute myocardial infarction risk. Metabolism. 2019;104:154051. doi:10.1016/j.metabol.2019.154051
16. Merino J, Leong A, Liu CT, et al. Metabolomics insights into early type 2 diabetes pathogenesis and detection in individuals with normal fasting glucose. Diabetologia. 2018;61(6):1315–1324. doi:10.1007/s00125-018-4599-x
17. Fitzpatrick AM, Park Y, Brown LA, Jones DP. Children with severe asthma have unique oxidative stress-associated metabolomic profiles. J Allergy Clin Immunol. 2014;133(1):
18. Pang Z, Wang G, Wang C, Zhang W, Liu J, Wang F. Serum metabolomics analysis of asthma in different inflammatory phenotypes: a cross-sectional study in northeast China. Biomed Res Int. 2018;2018:2860521. doi:10.1155/2018/2860521
19. Schmidt AJ, Borras E, Nguyen AP, Yeap D, Kenyon NJ, Davis CE. Portable exhaled breath condensate metabolomics for daily monitoring of adolescent asthma. J Breath Res. 2020;14(2):026001. doi:10.1088/1752-7163/ab35b5
20. Ho WE, Xu YJ, Cheng C, et al. Metabolomics reveals inflammatory-linked pulmonary metabolic alterations in a murine model of house dust mite-induced allergic asthma. J Proteome Res. 2014;13(8):3771–3782. doi:10.1021/pr5003615
21. McGeachie MJ, Dahlin A, Qiu W, et al. The metabolomics of asthma control: a promising link between genetics and disease. Immun Inflamm Dis. 2015;3(3):224–238. doi:10.1002/iid3.61
22. Comhair SA, McDunn J, Bennett C, Fettig J, Erzurum SC, Kalhan SC. Metabolomic endotype of asthma. J Immunol. 2015;195(2):643–650. doi:10.4049/jimmunol.1500736
23. Tao JL, Chen YZ, Dai QG, et al. Urine metabolic profiles in paediatric asthma. Respirology. 2019;24(6):572–581. doi:10.1111/resp.13479
24. Chawes BL, Giordano G, Pirillo P, et al. Neonatal urine metabolic profiling and development of childhood asthma. Metabolites. 2019;9(9):185. doi:10.3390/metabo9090185
25. Carraro S, Bozzetto S, Giordano G, et al. Wheezing preschool children with early-onset asthma reveal a specific metabolomic profile. Pediatr Allergy Immunol. 2018;29(4):375–382. doi:10.1111/pai.12879
26. Boulet LP, Reddel HK, Bateman E, Pedersen S, FitzGerald JM, O’Byrne PM. The global initiative for asthma (GINA): 25 years later. Eur Respir J. 2019;54(2):1900598. doi:10.1183/13993003.00598-2019
27. Kind T, Wohlgemuth G, Lee DY, et al. FiehnLib: mass spectral and retention index libraries for metabolomics based on quadrupole and time-of-flight gas chromatography/mass spectrometry. Anal Chem. 2009;81(24):10038–10048. doi:10.1021/ac9019522
28. Dunn WB, Broadhurst D, Begley P, et al. Procedures for large-scale metabolic profiling of serum and plasma using gas chromatography and liquid chromatography coupled to mass spectrometry. Nat Protoc. 2011;6(7):1060–1083. doi:10.1038/nprot.2011.335
29. Mahadevan S, Shah SL, Marrie TJ, Slupsky CM. Analysis of metabolomic data using support vector machines. Anal Chem. 2008;80(19):7562–7570. doi:10.1021/ac800954c
30. Robin X, Turck N, Hainard A, et al. pROC: an open-source package for R and S+ to analyze and compare ROC curves. BMC Bioinform. 2011;12:77. doi:10.1186/1471-2105-12-77
31. Xia J, Sinelnikov IV, Han B, Wishart DS. MetaboAnalyst 3.0–making metabolomics more meaningful. Nucleic Acids Res. 2015;43(W1):W251–7. doi:10.1093/nar/gkv380
32. Collaborators GBDCRD. Global, regional, and national deaths, prevalence, disability-adjusted life years, and years lived with disability for chronic obstructive pulmonary disease and asthma, 1990–2015: a systematic analysis for the global burden of disease study 2015. Lancet Respir Med. 2017;5(9):691–706. doi:10.1016/S2213-2600(17)30293-X.
33. Mordaunt D, Cox D, Fuller M. Metabolomics to improve the diagnostic efficiency of inborn errors of metabolism. Int J Mol Sci. 2020;21(4):1195. doi:10.3390/ijms21041195
34. Kelly RS, Chawes BL, Blighe K, et al. An integrative transcriptomic and metabolomic study of lung function in children with asthma. Chest. 2018;154(2):335–348. doi:10.1016/j.chest.2018.05.038
35. Stewart CJ, Mansbach JM, Wong MC, et al. Associations of nasopharyngeal metabolome and microbiome with severity among infants with bronchiolitis. a multiomic analysis. Am J Respir Crit Care Med. 2017;196(7):882–891. doi:10.1164/rccm.201701-0071OC
36. Stewart CJ, Mansbach JM, Ajami NJ, et al. Serum metabolome is associated with the nasopharyngeal microbiota and disease severity among infants with bronchiolitis. J Infect Dis. 2019;219(12):2005–2014. doi:10.1093/infdis/jiz021
37. Nishiuma T, Nishimura Y, Okada T, et al. Inhalation of sphingosine kinase inhibitor attenuates airway inflammation in asthmatic mouse model. Am J Physiol Lung Cell Mol Physiol. 2008;294(6):L1085–93. doi:10.1152/ajplung.00445.2007
38. Price MM, Oskeritzian CA, Falanga YT, et al. A specific sphingosine kinase 1 inhibitor attenuates airway hyperresponsiveness and inflammation in a mast cell-dependent murine model of allergic asthma. J Allergy Clin Immunol. 2013;131(2):501–11e1. doi:10.1016/j.jaci.2012.07.014
39. Nakamura H, Hirabayashi T, Someya A, Shimizu M, Murayama T. Inhibition of arachidonic acid release and cytosolic phospholipase A2 alpha activity by D-erythro-sphingosine. Eur J Pharmacol. 2004;484(1):9–17. doi:10.1016/j.ejphar.2003.10.053
40. Miyata J, Fukunaga K, Kawashima Y, Ohara O, Arita M. Cysteinyl leukotriene metabolism of human eosinophils in allergic disease. Allergol Int. 2020;69(1):28–34. doi:10.1016/j.alit.2019.06.002
41. Ran S, Sun F, Song Y, Wang X, Hong Y, Han Y. The study of dried ginger and linggan wuwei jiangxin decoction treatment of cold asthma rats using gc-ms based metabolomics. Front Pharmacol. 2019;10:284. doi:10.3389/fphar.2019.00284
42. Schranner D, Kastenmuller G, Schonfelder M, Romisch-Margl W, Wackerhage H. Metabolite concentration changes in humans after a bout of exercise: a systematic review of exercise metabolomics studies. Sports Med Open. 2020;6(1):11. doi:10.1186/s40798-020-0238-4
43. Chang C, Guo ZG, He B, Yao WZ. Metabolic alterations in the sera of Chinese patients with mild persistent asthma: a GC-MS-based metabolomics analysis. Acta Pharmacol Sin. 2015;36(11):1356–1366. doi:10.1038/aps.2015.102
44. Saude EJ, Skappak CD, Regush S, et al. Metabolomic profiling of asthma: diagnostic utility of urine nuclear magnetic resonance spectroscopy. J Allergy Clin Immunol. 2011;127(3):
45. Gall WE, Beebe K, Lawton KA, et al. alpha-hydroxybutyrate is an early biomarker of insulin resistance and glucose intolerance in a nondiabetic population. PLoS One. 2010;5(5):e10883. doi:10.1371/journal.pone.0010883
46. Newman JC, Verdin E. beta-hydroxybutyrate: much more than a metabolite. Diabetes Res Clin Pract. 2014;106(2):173–181. doi:10.1016/j.diabres.2014.08.009
47. Li X, Xu Z, Lu X, et al. Comprehensive two-dimensional gas chromatography/time-of-flight mass spectrometry for metabonomics: biomarker discovery for diabetes mellitus. Anal Chim Acta. 2009;633(2):257–262. doi:10.1016/j.aca.2008.11.058
48. Wei T, Tian W, Liu F, Xie G. Protective effects of exogenous beta-hydroxybutyrate on paraquat toxicity in rat kidney. Biochem Biophys Res Commun. 2014;447(4):666–671. doi:10.1016/j.bbrc.2014.04.074
49. Kajitani N, Iwata M, Miura A, et al. Prefrontal cortex infusion of beta-hydroxybutyrate, an endogenous NLRP3 inflammasome inhibitor, produces antidepressant-like effects in a rodent model of depression. Neuropsychopharmacol Rep. 2020;40:157–165. doi:10.1002/npr2.12099
50. Krishnan M, Hwang JS, Kim M, et al. beta-hydroxybutyrate impedes the progression of alzheimer’s disease and atherosclerosis in apoe-deficient mice. Nutrients. 2020;12(2):471. doi:10.3390/nu12020471
 © 2020 The Author(s). This work is published and licensed by Dove Medical Press Limited. The full terms of this license are available at https://www.dovepress.com/terms.php and incorporate the Creative Commons Attribution - Non Commercial (unported, v3.0) License.
By accessing the work you hereby accept the Terms. Non-commercial uses of the work are permitted without any further permission from Dove Medical Press Limited, provided the work is properly attributed. For permission for commercial use of this work, please see paragraphs 4.2 and 5 of our Terms.
© 2020 The Author(s). This work is published and licensed by Dove Medical Press Limited. The full terms of this license are available at https://www.dovepress.com/terms.php and incorporate the Creative Commons Attribution - Non Commercial (unported, v3.0) License.
By accessing the work you hereby accept the Terms. Non-commercial uses of the work are permitted without any further permission from Dove Medical Press Limited, provided the work is properly attributed. For permission for commercial use of this work, please see paragraphs 4.2 and 5 of our Terms.