")
Back to Journals » International Journal of General Medicine » Volume 14
Upregulation of THBS1 is Related to Immunity and Chemotherapy Resistance in Gastric Cancer
Authors Zhang X, Huang T, Li Y, Qiu H
Received 13 July 2021
Accepted for publication 17 August 2021
Published 27 August 2021 Volume 2021:14 Pages 4945—4957
DOI https://doi.org/10.2147/IJGM.S329208
Checked for plagiarism Yes
Review by Single anonymous peer review
Peer reviewer comments 2
Editor who approved publication: Dr Scott Fraser
Xiuyuan Zhang, Tingting Huang, Yiming Li, Hong Qiu
Department of Oncology, Tongji Hospital, Tongji Medical College, Huazhong University of Science and Technology, Wuhan, 430030, Hubei, People’s Republic of China
Correspondence: Hong Qiu
Department of Oncology, Tongji Hospital, Tongji Medical College, Huazhong University of Science and Technology, No. 1095 Jiefang Avenue, Wuhan, 430030, Hubei, People’s Republic of China
Email [email protected]
Purpose: Thrombospondin 1 (THBS1) is an endogenous inhibitor of angiogenesis, but it also promotes tumor invasion, metastasis, and immune response in the tumor environment. Previous research has found that THBS1 is highly expressed in many tumors and has a negative correlation with tumor prognosis. However, research on the relationship between THBS1 and immune infiltration in GC is less well documented, and the objective of our study was to investigate the role of THBS1 expression in GC.
Patients and Methods: The expression of THBS1 in GC was analyzed by Oncomine, TIMER, TGCA, GEO and IHC staining. Analysis of the signaling pathways associated with THBS1 expression in GC uses GSEA. The relationship between THBS1 expression and immune infiltration was analyzed by the ESTIMATE algorithm, single-cell transcriptome analysis, TIMER2 database and CIBERSORT algorithm. Finally, the relationship between THBS1 expression and drug sensitivity was analyzed by the CellMiner database.
Results: THBS1 was overexpressed in GC and was associated with poor prognosis, and high THBS1 expression was an independent risk factor. GSEA results showed that high THBS1 expression in GC was associated with tumorigenesis, adhesion, and significant immune enrichment. THBS1 expression was most strongly correlated with tumor-associated macrophages (TAMs), M2 macrophages and cancer-associated fibroblast (CAFs) in GC. THBS1 expression positively correlates with most immune checkpoint members, suggesting that THBS1 may play an important role in the tumor microenvironment. THBS1 overexpression was negatively correlated with some drug sensitivities, such as Oxaliplatin.
Conclusion: Upregulation of THBS1 was positively correlated with poor prognosis and immunosuppression in GC and negatively correlated with anticancer drug sensitivity, suggesting that THBS1 may serve as a potential target for the treatment of GC.
Keywords: THBS1, gastric cancer, drug sensitivity, prognosis, tumor microenvironment
Introduction
Gastric cancer (GC) is the fifth leading tumor and the fourth leading cause of cancer-related deaths worldwide, with more than 1 million new cases and more than 700,000 new deaths each year. The highest prevalence rate is found in East Asia.1 Present therapeutic approaches for GC include surgery, chemotherapy, radiotherapy, targeted therapy and immunotherapy. Although they have alleviated some of the symptoms of patients, the prognosis for advanced patients remains poor, The 5-year survival rate for GC is 30.4%2 and less than 5% for advanced GC.3 GC is characterized by potential biological and genetic heterogeneity.4 Exploring new diagnostic and therapeutic targets is of great importance.
Thrombospondin (THBS) is a multifunctional family of extracellular matrix proteins involved in tissue remodeling and with implications for tumor formation, wound healing, and embryonic development.5 THBS1 was the first member identified and is thought to be an endogenous angiogenesis inhibitor. THBS1 exerts different effects by binding to different cellular receptors.6 Previous studies have shown that THBS1 is highly expressed in lymphoma,7 breast cancer,8 melanoma9 and oral squamous carcinoma,10 promoting tumor cell adhesion, proliferation, apoptosis, invasion and metastasis. THBS1 has been reported to correlate with immune cell infiltration in melanoma.11 The above implies a potential function of THBS1 in tumorigenesis. However, the role of THBS1 expression in GC has been less studied.
In this study, we investigated the prognosis of THBS1 in GC and its correlation with immune infiltration and anticancer drug sensitivity. The expression of THBS1 in GC was analyzed by genomic techniques and the correlation of THBS1 expression with the prognosis of GC. Enrichment analysis of THBS1 was performed by GSEA. The correlation between THBS1 and tumor infiltrating immune cells (TIICs) was analyzed by CIBERSORT. Finally, the correlation between THBS1 and drug sensitivity was analyzed by CellMiner. Our work elucidated the role of THBS1 expression in GC and the mechanism of interaction with tumor immunity, suggesting that THBS1 may be a therapeutic target for GC.
Materials and Methods
THBS1 Gene Expression and Prognosis Analysis
The analysis was performed by Online Cancer Microarray Database(Oncomine) (https://www.oncomine.org/resource/main.html),12 UCSC Xena (https://xenabrowser.net/)13 and Tumor Immune Estimation Resource (TIMER) (https://cistrome.shinyapps.io/timer/).14 Differential expression of THBS1 was performed by TIMER, TCGA and two Gene Expression Omnibus (GEO) databases (GSE66229 and GSE118916). The correlation between THBS1 and pathological stages of GC was analyzed analyzed using the “ggboxplot” package in the R. The prognosis of THBS1 was analyzed according to the TCGA and GSE62254 databases,15 and statistical analysis was performed using the “survival” and “survminer” packages of the R (version 4.0.4).
Gene Set Enrichment Analysis (GSEA)
We analyzed the changes in THBS1 mRNA levels in the genomic profile of the KEGG pathway using the GSEA tool (version 4.1.0).16 In the TCGA-STAD cohort, the median expression of THBS1 was used as a cut-off point to divide into a low and a high expression group. To determine the potential function of THBS1, GSEA examined the top ranked gene enriched pathways in both groups. GSEA was performed via the “clusterProfiler” package of the R.
Correlation Analysis of THBS1 Expression with the Tumor Microenvironment (TME)
The TCGA-STAD cohort was subjected to ESTIMATE analysis. The ESTIMATE algorithm using the “estimate” package of R was used to estimate the ratio of THBS1 high and low expression groups in the immune and stromal component of TME. The “survival” and “survminer” packages in R were also used for survival analysis. The TISCH database (http://tisch.comp-genomics.org/)17 was used to perform scRNA-seq dataset analysis.
Immune Infiltration Analysis
The TIMER was used to analyze immune cells infiltrating by tumors. The correlation of THBS1 expression with the markers of M1 and M2 macrophages and tumor-associated macrophages (TAMs) in GC was also analyzed. The TCGA-STAD cohort was subjected to CIBERSORT analysis to investigate the effect of THBS1 expression on 22 types of immune cells. 22 immune cells expression profiles were derived from CIBERSORT (an online database for estimating cell proportions and inferring cell type-specific gene expression profiles),18 and then the R was used for “ vioplot”, “ggpubr” and “ggExtra” packages in R were then used for the analysis of variance and correlation analysis. P<0.05 was considered statistically significant by the Pearson coefficient test and Wilcoxon rank sum test.
Correlation of THBS1 expression with tumor immunosuppressive genes was analyzed by the TISIDB database (http://cis.Hku.hk/TISIDB/).19
Correlation Analysis of THBS1 Expression and Drug Sensitivity
The CellMiner database (http://discover.nci.nih.gov/cellminer/)20,21 was used to perform correlation analysis of THBS1 expression with drug sensitivity. Data processing and graphing were performed via the “impute”, “limma” and “ggpubr” packages in R.
Tissue Samples and Immunohistochemistry Staining (IHC)
This study was approved by the Institutional Research Ethics Committee of Tongji Hospital, Tongji Medical College, Huazhong University of Science and Technology in accordance with the Declaration of Helsinki. Forty-seven primary GC samples and matched adjacent normal human tissues from January 2014 to August 2014 were included in the study.
All paraffin tissue sections were dried, dewaxed, hydrated, inactivated with endogenous enzymes and antigen repair, closed with 5% BSA at room temperature for 30 min, and incubated overnight at 4°C with primary antibody (THBS1, TA325040, 1:100; Origene, Rockville, MD, USA). After washing 3 times with TBS, the reaction was performed by polymerizing the conjugated secondary antibody and DAB with peroxidase, followed by counterstaining with hematoxylin. Five randomly selected sections were observed by optical microscope. Staining results were scored according to the intensity of staining (negative: 0, weak: 1, moderate: 2, strong: 3) and the fraction of positive cells (0=0–9%; 1= 10–30%; 2=31–50%; 3=51–100%). If IHC score ≥4, it was considered high expression. IHC score <0.4 was considered low expression. The IHC staining results were assessed and scored by two senior pathologists.
Results
Expression Analysis of THBS1 in GC
The expression of THBS1 in each tumor was analyzed by Oncomine and TIMER database, and the results showed that THBS1 expression changed depending on the cancer type. Figure 1 shows that THBS1 expression was significantly higher in GC tissues than in adjuvant tissues, and 8 datasets showed high expression of THBS1 in GC. By analyzing TCGA and 2 GEO databases, the results support that THBS1 is highly expressed in GC tissues.
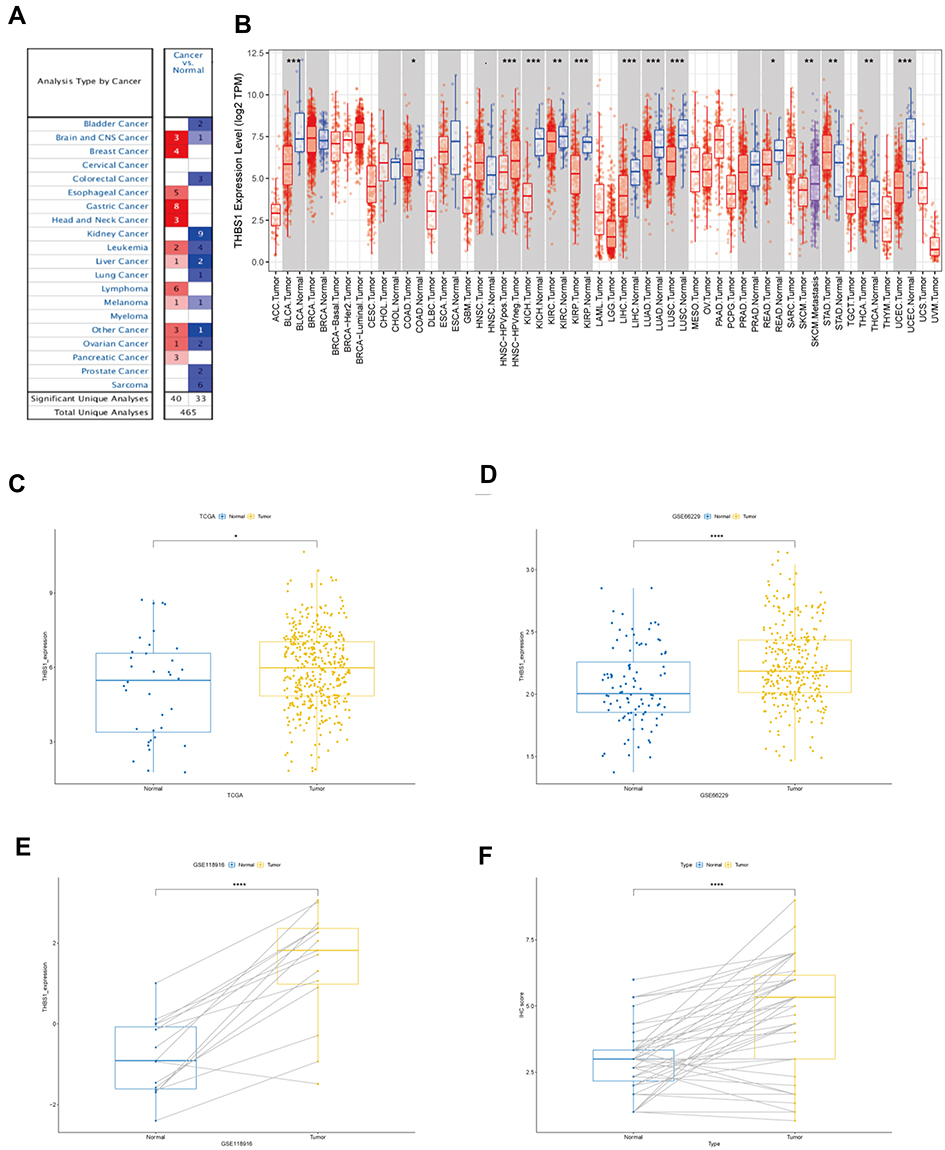 |
Figure 1 The expression of THBS1 in gastric cancer. (A) THBS1 in different cancers increased or decreased compared with normal tissues in the Oncomine database. (B) The expression of THBS1 in different tumor types by TIMER database. (C) The expression of THBS1 in GC tissues compared with normal tissues in TCGA. (D–E) The expression of THBS1 in GC tissues compared with normal tissues in GSE66229 and GSE118916. (F)The protein expression of THBS1 in GC tissues compared with adjacent normal tissues. * P<0.05, **P<0.01, ***P<0.001, ****P<0.0001. |
We then analyzed the protein expression level of THBS1 in GC by IHC staining, and as shown in Figure 1F, the protein level of THBS1 in GC tissues was significantly higher than that in adjacent normal tissues. The results of IHC staining are shown in Figure 2. It is suggested that THBS1 plays a role in GC development.
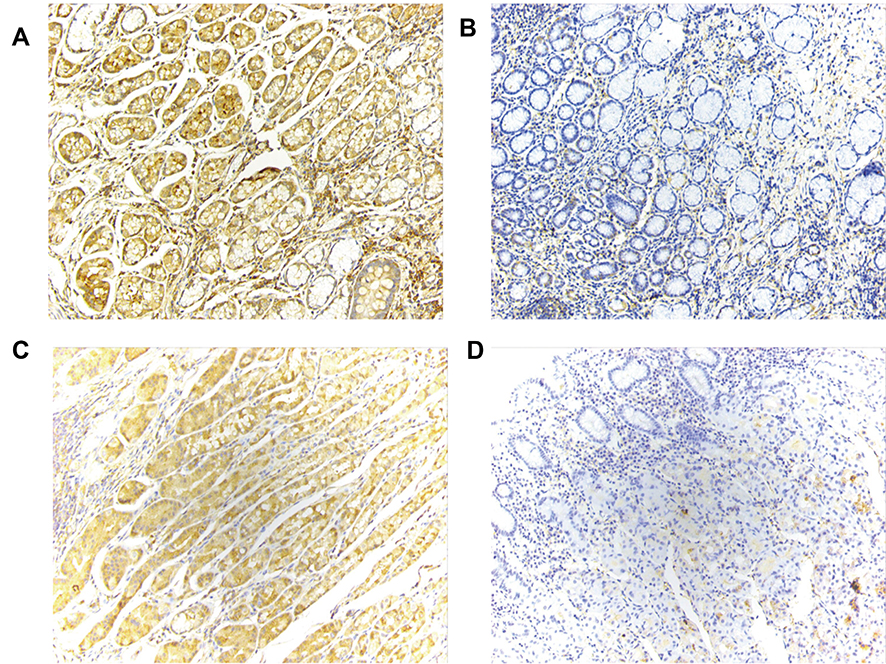 |
Figure 2 IHC staining of THBS1 (magnification, x200). (A) High expression of THBS1 in GC tissues. (B) Low expression of THBS1 in GC tissues. (C) High expression of THBS1 in adjacent normal tissues. (D) Low expression of THBS1 in adjacent normal tissues. |
Correlation Between THBS1 Expression and Clinical Outcomes of GC Patients
Clinical information on TCGA-STAD cohort was downloaded through the UCSC Xena database, and 325 patients were included in the analysis, and THBS1 expression was divided by median into high and low expression groups. The effect of THBS1 expression on GC prognosis was analyzed by TCGA and GEO databases, and it was shown by Figure 3 that high THBS1 expression in TCGA was significantly correlated with shorter OS in GC, and high THBS1 expression in GSE62254 was significantly correlated with shorter OS and DFS in GC. Moreover, univariate and multifactorial Cox regression analyses of THBS1 expression showed that high THBS1 expression was an independent risk factor for poor prognosis in GC patients (Table 1).
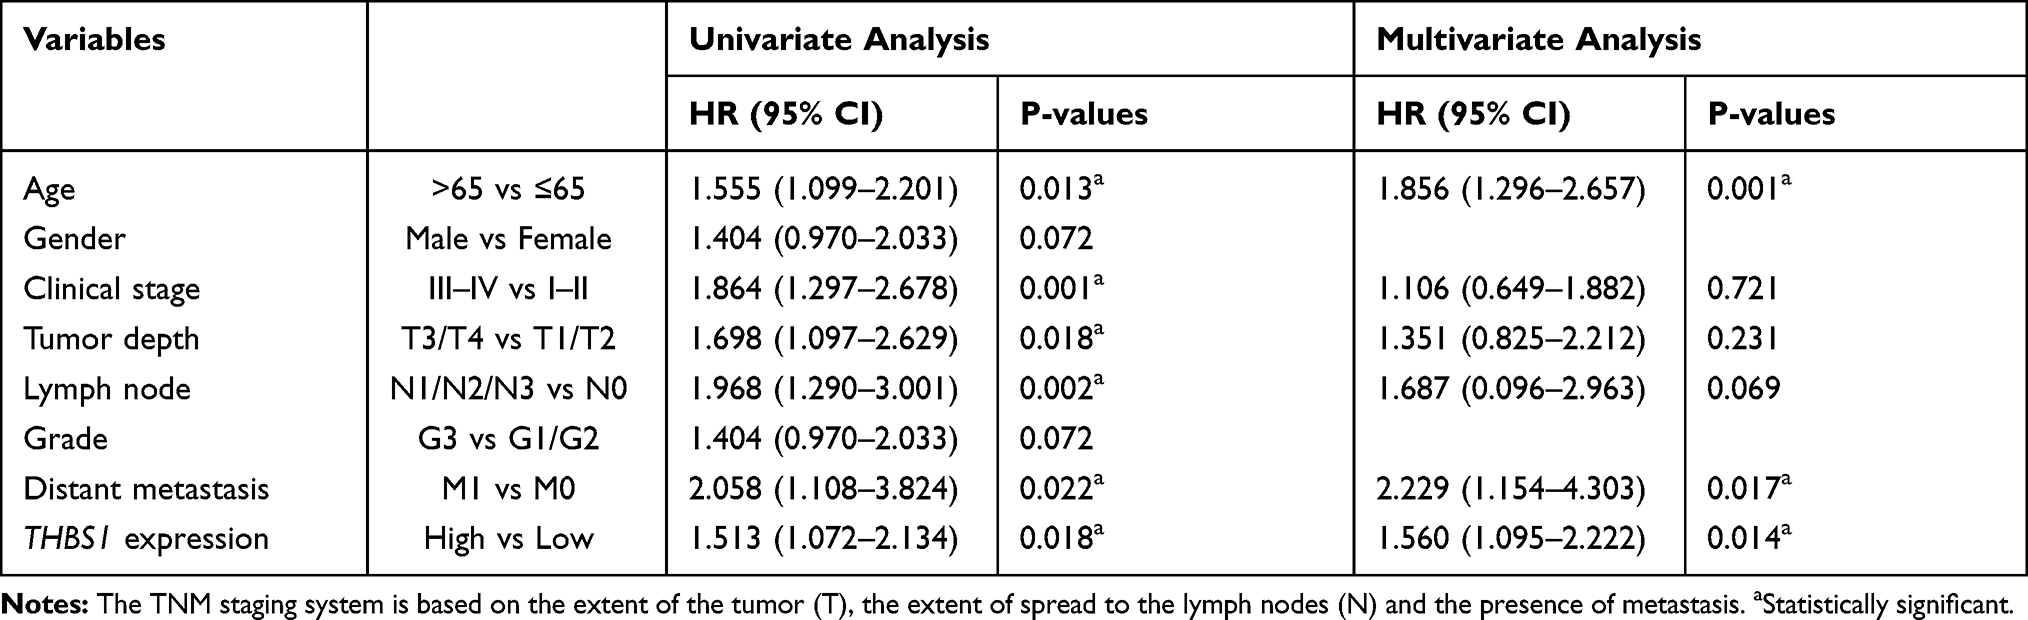 |
Table 1 Univariate and Multivariate Cox Regression Analysis of OS in Gastric Cancer Patients (n=325) |
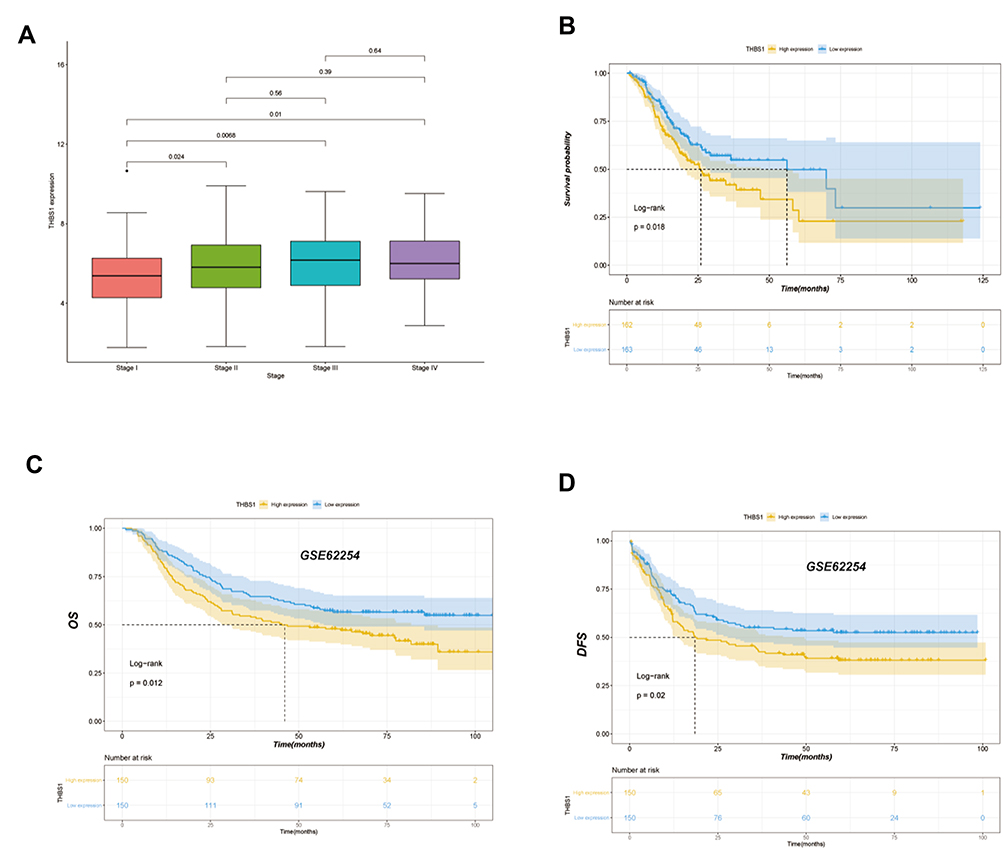 |
Figure 3 Correlation analysis between THBS1 expression and prognostic survival in STAD patients. (A) Differential expression of THBS1 in different pathological stage. (B) Kaplan-Meier OS curves of survival differences among TCGA-STAD cohort. (C) Kaplan-Meier OS curves of survival differences among GSE62254 dataset. (D) Kaplan-Meier DFS curves of survival differences among GSE62254 dataset. |
GSEA Identifies THBS1-Related Signaling Pathways in GC
To investigate the function of THBS1, we performed a GSEA analysis (Figure 4). The results suggest that the immune-related ones were TGF-beta signaling pathway, chemokine signaling pathway and viral protein interaction with cytokine and cytokine receptor. The cell adhesion and tumorigenesis related ones are PI3K−Akt signaling pathway, focal adhesion and cell adhesion molecules. GSEA results showed that high THBS1 expression in GC was associated with tumorigenesis, adhesion, and immune significant enrichment.
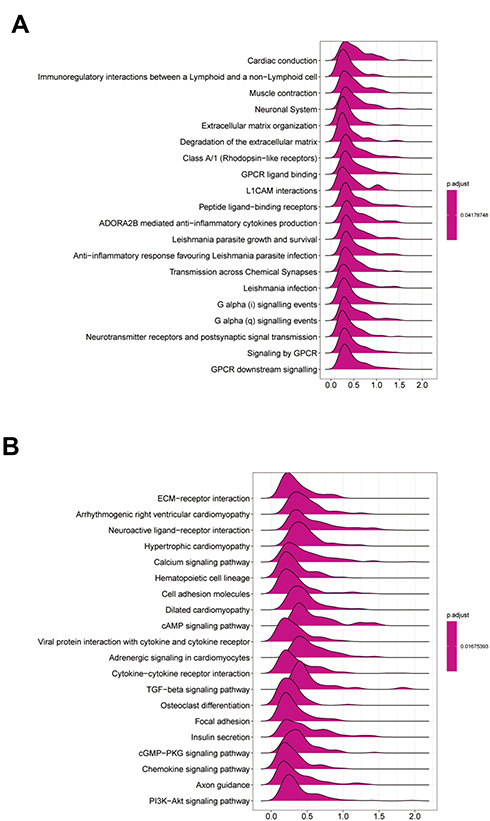 |
Figure 4 GSEA analysis of THBS1 expression in GC. The top 20 GSEA results of Reactome pathways (A) and KEGG pathways (B). |
Correlation Between THBS1 Expression and TME in GC
The TCGA-STAD cohort was analyzed by ESTIMATE algorithm, Figure 5 shows that stromal and immune scores were positively correlated with THBS1 expression, and prognostic analysis combining both stromal and immune scores showed that patients with lower scores had significantly higher survival rates than those with higher scores. In addition, we used by scRNA-seq dataset (STAD_GSE134520) for exploring the relationship of THBS1 expression in cells associated with TME of gastric cancer. As shown in Figure 6, THBS1 was differentially expressed in immune cells, stromal cells and malignant cells. THBS1 expression was highest in myofibroblasts, followed by dendritic cells, fibroblasts and malignant cells, which was consistent with the results of the ESTIMATE algorithm.
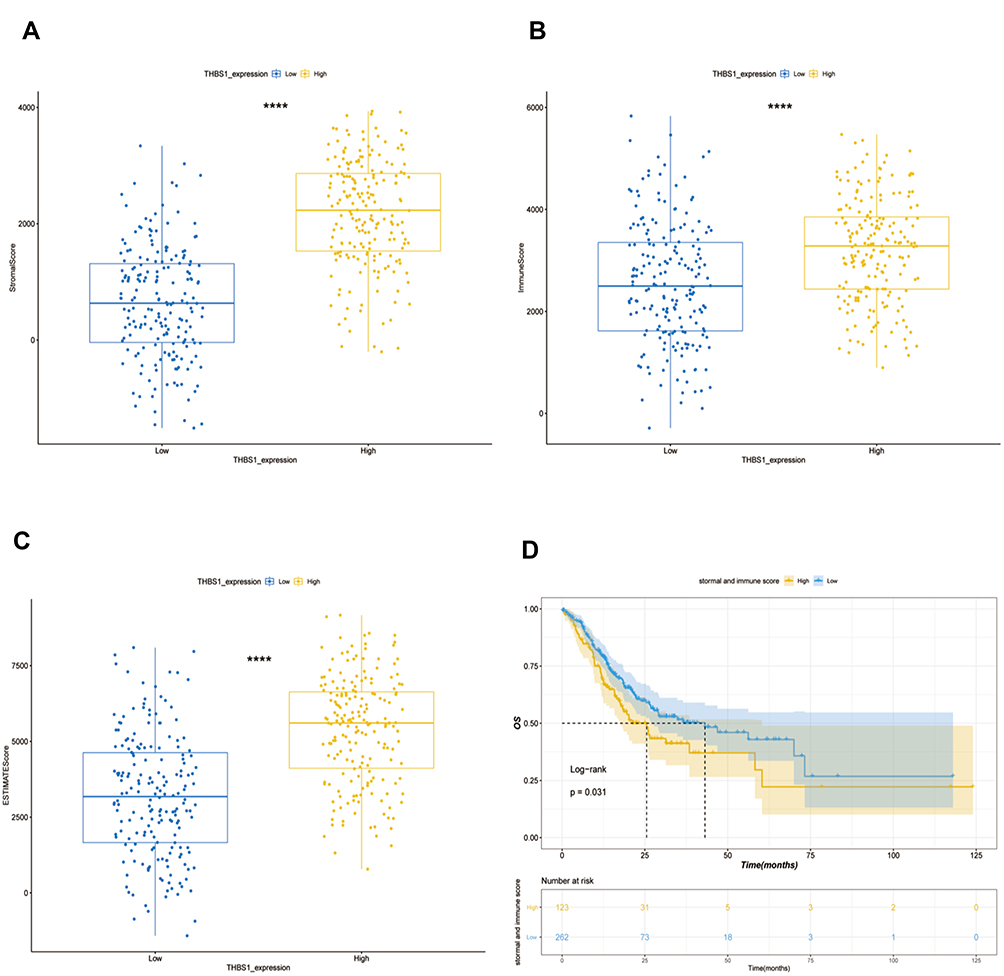 |
Figure 5 Relationship between THBS1 and immune and stromal scores in GC. (A) High THBS1 expression was associated with high stromal score in GC. (B) High THBS1 expression was associated with high immune score in GC. (C) High THBS1 expression was associated with high immune and stromal scores in GC. (D) High immune score and stromal score are negatively associated with prognosis of GC. ****P<0.0001. |
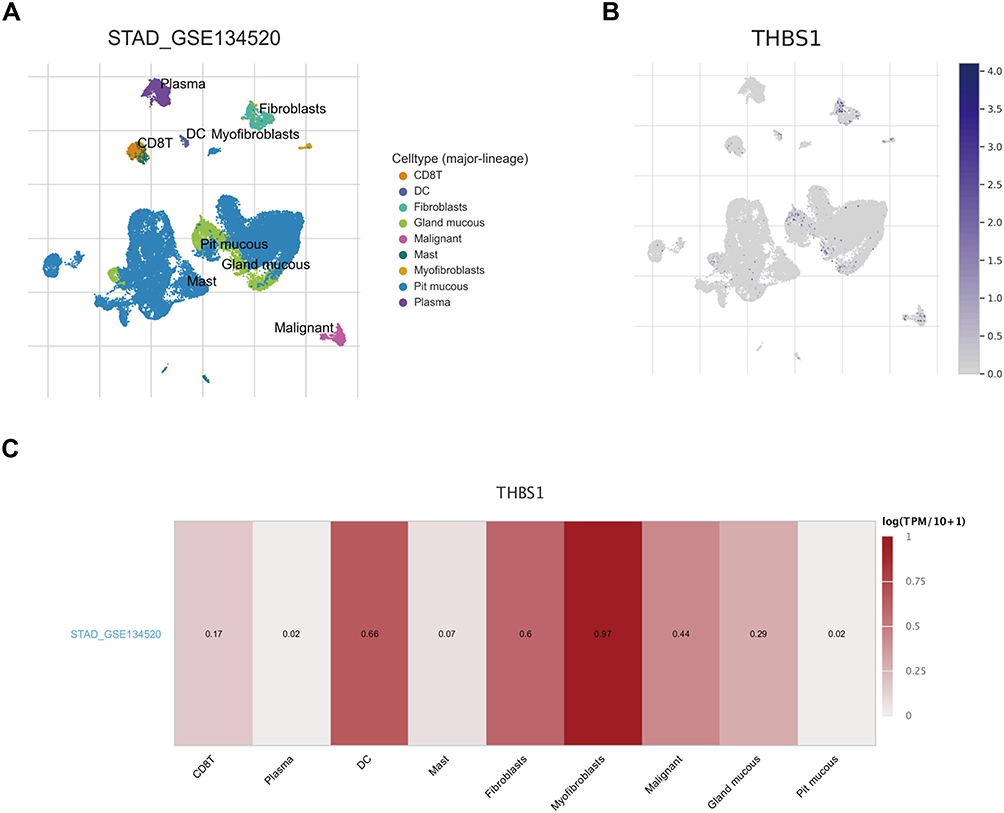 |
Figure 6 Correlation of THBS1 with TME in GC. (A) Cell types and distribution of STAD_GSE134520. (B) Expression and distribution of THBS1 in each cell. (C) Correlation of THBS1 expression with TME. |
Correlation Between THBS1 Expression and the Level of Immune Infiltration in GC
To investigate the relationship between THBS1 expression and immune infiltration in GC, THBS1 expression was most strongly correlated with macrophage (COR=0.682, P=3.35e-53) by TIMER2 database analysis (Figure 7A). The proportion of 22 TIICs in GC was also analyzed by CIBERSORT and a correlation analysis was performed (Figure S1). Correlation of THBS1 expression with the proportion of immune cells of 22 subtypes was quantified with dividing THBS1 into high and low expression groups. Figure 7B shows that M2 macrophages, Monocytes and CD4 T cells memory resting were positively correlated with THBS1, while T cells follicular helper, Tregs, M1 macrophages and CD8 T cells were negatively correlated with THBS1.
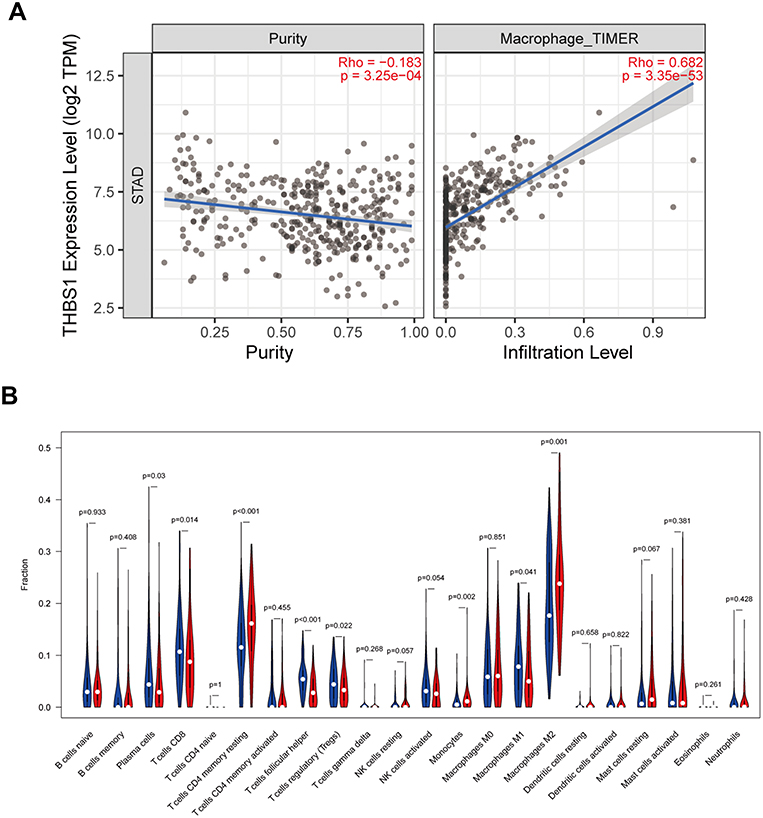 |
Figure 7 Relationship between THBS1 and immune infiltration. (A) THBS1 expression relates to immune cell infiltration levels in STAD. (B) Relationship between high and low expression of THBS1 in 22 types of tumor-infiltrating immune cells, the blue violin diagram presented low THBS1 expression group, and the red violin diagram presented high THBS1 expression group. |
We further investigated the correlation between THBS1 and the markers of M1 and M2 macrophage, as well as TAMs. THBS1 expression was weakly related to markers of M1 macrophages but moderately related to markers of M2 macrophages and TAMs. (Figure S2), and THBS1 may promote polarization of TMAs to M2 type, associated with M2-like TAMs.
We have already found relatively high expression of THBS1 in fibroblasts in our study. Cancer associated fibroblast (CAFs) can secrete TGFB1 to promote tumor progression,22 and THBS1 is considered to be an activator of TGFB1,23 so we analyzed the correlation between THBS1 and infiltration level by TIMER2 database, and as shown in the Figure 8 THBS1 expression was positively correlated with CAFs in GC.
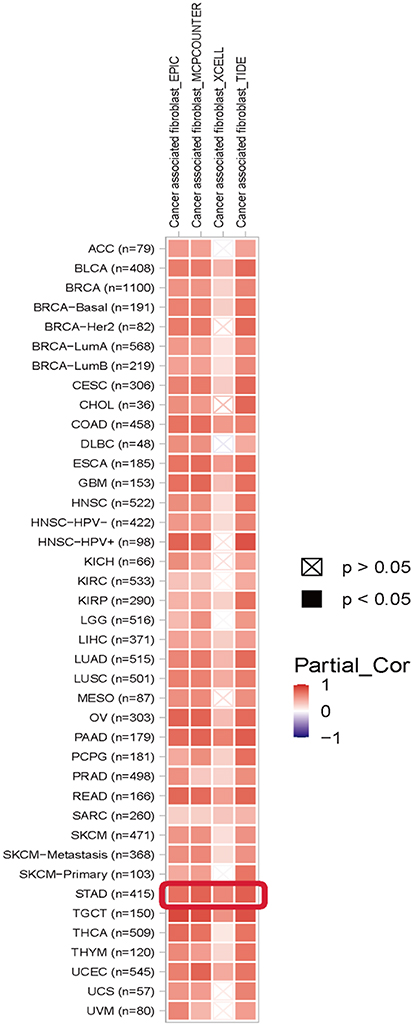 |
Figure 8 Correlation of THBS1 expression with CAFs. Red represents positive correlation and blue represents negative correlation. THBS1 expression is significantly positively correlated with CAFs in pan-cancer. |
Correlation of THBS1 with Immune Checkpoint Members
To further investigate the impact of THBS1 expression in the microenvironment of GC, we investigated the correlation between THBS1 and immunoinhibitors in pan-cancer through the TISIDB database (Figure 9A). In addition, we found a significant correlation between THBS1 and immune checkpoint members (including PDL1, PDL2, TIM-3, CTLA4, PD1) in TCGA-STAD cohort (Figure 9B).
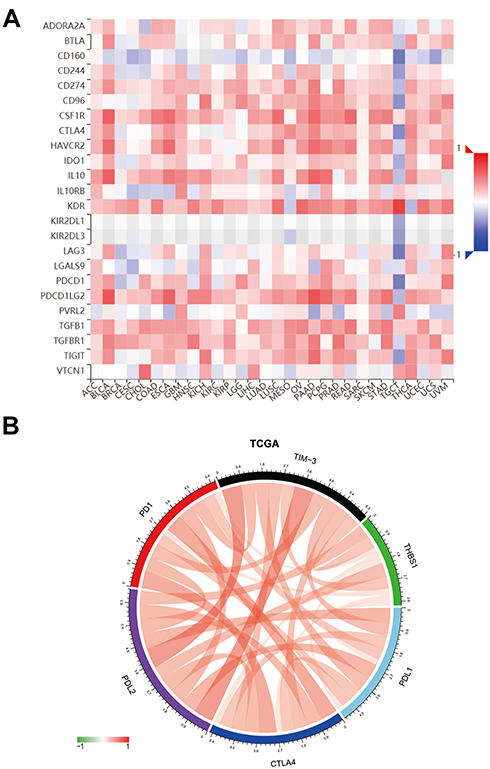 |
Figure 9 Correlation of THBS1 with immune checkpoint members. (A) THBS1 expression is correlated with immunoinhibitors in pan-cancer, red represents positive correlation, blue represents negative correlation, the deeper the color, the stronger the correlation. (B) THBS1 expression is correlated with immune checkpoint members in TCGA-STAD, red represents positive correlation, green represents negative correlation. |
Correlation Between THBS1 and Drug Sensitivity
The correlation between THBS1 and antitumor drug sensitivity was explored through the CellMiner database,61 anticancer drugs that showed significant correlation with THBS1 expression were screened. Among them, 47 drug sensitivities were significantly and negatively correlated with THBS1 expression. Figure 10 shows the top 9 results, we found that THBS1 expression was significantly negatively correlated with the sensitivity of Oxaliplatin, Tamoxifen, By-Product of CUDC-305, Everolimus, Ixabepilone, Crizotinib, PX-316 and Nilotinib and positively correlated with the sensitivity of Staurosporine and Everolimus. Detailed results are shown in Table S1.
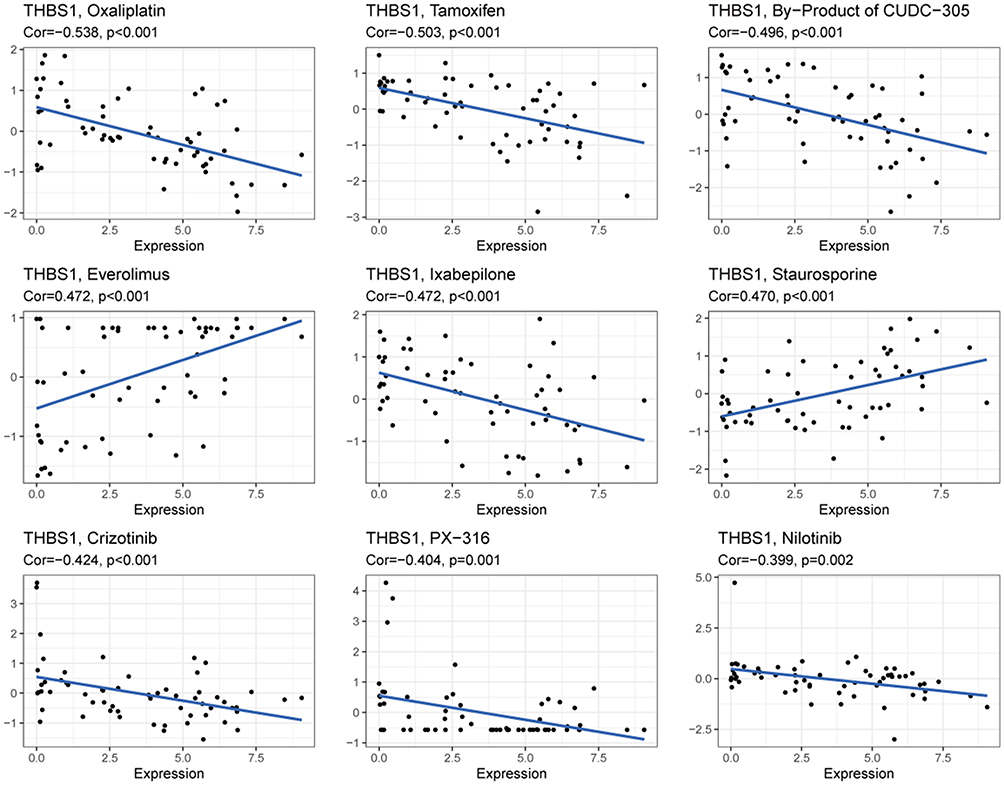 |
Figure 10 Correlation of THBS1 expression with the sensitivity of anticancer drugs. |
Discussion
THBS1 is an extracellular matrix protein that has been reported to promote tumor adhesion, invasion and metastasis in many tumors.24 However, studies on the prognostic value and the potential molecular mechanisms of THBS1 in the pathogenesis of GC are less available. This study is the first to comprehensively explore the role of THBS1 expression in GC and the mechanism of immune interaction with tumors.
In our study, we found that THBS1 was significantly highly expressed in GC. In addition, survival analysis showed that high THBS1 expression was significantly associated with shorter OS and DFS in GC. The results are consistent with previous studies that THBS1 promotes liver metastasis in colorectal cancer by promoting epithelial-mesenchymal transition,25 and high expression in cutaneous T-cell lymphoma promotes tumor invasion and metastasis, leading to poor prognosis.7 The above suggests that THBS1 is associated with poor prognosis in GC.
To investigate the role of THBS1 in GC, we performed GSEA analysis of THBS1, the enriched pathways in the THBS1 high expression group that were analyzed by GSEA and related to immunity were TGF-beta signaling pathway and chemokine signaling pathway. Previous studies have shown that high THBS1 expression in melanoma increases macrophages recruitment11 and that the effect of THBS1 on early natural killer cell proliferation is associated with TGF-beta activation.26 Related to cell adhesion are focal adhesion and cell adhesion molecules. It has been shown that THBS1 can promote cell adhesion to the stroma of osteosarcoma cells through α4β1 integrins.27 The above indicates that THBS1 is associated with tumor adhesion and immune infiltration.
The tumor microenvironment (TME) is a complex network of tumor cells, fibroblasts, endothelial cells, immune cells and extracellular matrix.28 In the present study, the role of THBS1 expression in TME of GC was investigated. THBS1 expression was compared with immune/stromal scores, and high THBS1 expression was found to correlate with high immune/stromal scores, suggesting a correlation between high THBS1 expression and the level of immune cell infiltration. One study indicated that high immune/stromal scores were significantly associated with poorer GC prognosis, which is in accordance with the findings of the previous study.29 THBS1 was significantly correlated with multiple TIICs by TIMER database analysis, with the strongest correlation with Macrophage. Further analysis of the proportion of TIICs in GC by CIBERSORT revealed that THBS1 was positively correlated with M2 macrophages, Monocytes and Mast cells resting, and with Tregs, CD8 T cells and NK cells activated negatively. The above results suggest that THBS1 expression correlates with immune infiltration of GC.
Macrophages can be bipolarly differentiated into M1 (classical) activation and M2 (alternate) activation. M1 macrophages are mainly associated with pro-inflammatory, bactericidal and anti-tumor effects, whereas M2 macrophages are mainly associated with tumor progression and immunosuppression.30 TAMs are a group of TIICs that usually exhibit an M2-like immunosuppressive phenotype in most tumors and tend to promote angiogenesis, promote extravascular invasion and immune escape, ultimately leading to tumor progression and metastasis.28 The results of CIBERSORT showed that among 22 TIICs, high THBS1 expression was positively correlated with the proportion of M2 macrophages and negatively correlated with the proportion of M1 macrophages. In addition, the correlation between THBS1 expression and markers of macrophages was also investigated, and THBS1 expression was found to be moderately correlated with markers of M2 macrophages and TAMs, and weakly correlated with markers of M1 macrophages. It is suggested that THBS1 may be involved in the mechanism of M2 macrophage-mediated tumorigenesis and thus differentiation into TAMs. THBS1 binding to CD36 and CD47 receptors can play different roles in TME, and THBS1 interacts with CD47 on immune cells, thus inactivating anti-tumor immune surveillance, which may attenuate the anti-tumor effect of M1 polarized macrophages in GC31 and CD36 could promote the activation of M2 macrophages and also promote the migration and recruitment of TAMs in tumor tissues, thus promoting the progression of tumor.32 Therefore, we speculate that THBS1 may be involved in the mechanism of M2 macrophages and TAMs-mediated tumorigenesis through binding to CD36, to be proven by subsequent studies. Since TAMs have immunosuppressive effects in TME,33 we explored the relationship between THBS1 expression and tumor immunosuppression and observed that THBS1 expression was positively correlated with immune checkpoint members in GC, suggesting that upregulation of THBS1 was strongly correlated with immunosuppressive status.
Clinically recommended chemotherapy regimens for gastric cancer include FLOT and FOLFOX regimens, which can effectively prolong the overall survival of advanced GC.34 Our results from CellMiner database analysis found that THBS1 was negatively correlated with the sensitivity of most anticancer drugs, including oxaliplatin (COR=−0.54) and fluorouracil (COR=−0.28). It can be seen that upregulation of THBS1 may affect the effect of chemotherapy in GC.
In summary, upregulation of THBS1 expression was positively correlated with immunosuppression in GC and negatively correlated with anticancer drug sensitivity, suggesting that THBS1 may serve as a potential target for the treatment of GC.
Conclusion
THBS1 was upregulated in GC and was related to an unfavorable prognosis. The overexpression of THBS1 was significantly associated with M2-like TAMs and CAFs in GC and positively correlated with immunosuppressive genes. In addition, THBS1 was negatively correlated with the sensitivity of many anticancer drugs, suggesting that THBS1 is associated with chemoresistance. Our study suggests that THBS1 may function as a promising target for treating GC.
Acknowledgments
This study was supported by the National Natural Science Foundation of China (81372644).
Author Contributions
All authors contributed to data analysis, drafting or revising the article, have agreed on the journal to which the article will be submitted, gave final approval of the version to be published, and agree to be accountable for all aspects of the work.
Disclosure
The authors report no conflicts of interest in this work.
References
1. Sung H, Ferlay J, Siegel RL, et al. Global cancer statistics 2020: GLOBOCAN estimates of incidence and mortality worldwide for 36 cancers in 185 countries. CA Cancer J Clin. 2021;71:209–249. doi:10.3322/caac.21660
2. Stumpf PK, Amini A, Jones BL, et al. Adjuvant radiotherapy improves overall survival in patients with resected gastric adenocarcinoma: a national cancer data base analysis: RT for gastric cancer. Cancer. 2017;123(17):3402–3409. doi:10.1002/cncr.30748
3. Thrumurthy SG, Chaudry MA, Chau I, Allum W. Does surgery have a role in managing incurable gastric cancer? Clin Oncol. 2015;12(11):676–682. doi:10.1038/nrclinonc.2015.132
4. Tan P, Yeoh K-G. Genetics and molecular pathogenesis of gastric adenocarcinoma. Gastroenterology. 2015;149(5):1153–1162.e3. doi:10.1053/j.gastro.2015.05.059
5. Huang T, Sun L, Yuan X, Qiu H. Thrombospondin-1 is a multifaceted player in tumor progression. Oncotarget. 2017;8(48):84546–84558. doi:10.18632/oncotarget.19165
6. Jeanne A, Schneider C, Martiny L, Dedieu S. Original insights on thrombospondin-1-related antireceptor strategies in cancer. Front Pharmacol. 2015;6:252. doi:10.3389/fphar.2015.00252
7. Kamijo H, Miyagaki T, Takahashi-Shishido N, et al. Thrombospondin-1 promotes tumor progression in cutaneous T-cell lymphoma via CD47. Leukemia. 2020;34(3):845–856. doi:10.1038/s41375-019-0622-6
8. Horiguchi H, Yamagata S, Qian ZR, Kagawa S, Sakashita N. Thrombospondin-1 is highly expressed in desmoplastic components of invasive ductal carcinoma of the breast and associated with lymph node metastasis. J Med Invest. 2013;60:6.
9. Jayachandran A, Anaka M, Prithviraj P, et al. Thrombospondin 1 promotes an aggressive phenotype through epithelial-to-mesenchymal transition in human melanoma. Oncotarget. 2014;5(14):5782–5797. doi:10.18632/oncotarget.2164
10. Pal SK, Nguyen CTK, Morita K, et al. THBS1 is induced by TGFB1 in the cancer stroma and promotes invasion of oral squamous cell carcinoma. J Oral Pathol Med. 2016;45(10):730–739. doi:10.1111/jop.12430
11. Martin-Manso G, Galli S, Ridnour LA, Tsokos M, Wink DA, Roberts DD. Thrombospondin 1 promotes tumor macrophage recruitment and enhances tumor cell cytotoxicity of differentiated U937 cells. Cancer Res. 2008;68(17):7090–7099. doi:10.1158/0008-5472.CAN-08-0643
12. Rhodes DR, Kalyana-Sundaram S, Mahavisno V, et al. Oncomine 3.0: genes, pathways, and networks in a collection of 18,000 cancer gene expression profiles. Neoplasia. 2007;9(2):15.
13. Cline MS, Craft B, Swatloski T, et al. Exploring TCGA pan-cancer data at the UCSC cancer genomics browser. Sci Rep. 2013;3(1):2652. doi:10.1038/srep02652
14. Li T, Fan J, Wang B, et al. TIMER: a web server for comprehensive analysis of tumor-infiltrating immune cells. Cancer Res. 2017;77(21):e108–e110. doi:10.1158/0008-5472.CAN-17-0307
15. Cristescu R, Lee J, Nebozhyn M, et al. Molecular analysis of gastric cancer identifies subtypes associated with distinct clinical outcomes. Nat Med. 2015;21(5):449–456. doi:10.1038/nm.3850
16. Subramanian A, Tamayo P, Mootha VK, et al. Gene set enrichment analysis: a knowledge-based approach for interpreting genome-wide expression profiles. Proc Natl Acad Sci. 2005;102(43):15545–15550. doi:10.1073/pnas.0506580102
17. Sun D, Wang J, Han Y, et al. TISCH: a comprehensive web resource enabling interactive single-cell transcriptome visualization of tumor microenvironment. Nucleic Acids Res. 2021;49(D1):D1420–D1430. doi:10.1093/nar/gkaa1020
18. Newman AM, Liu CL, Green MR, et al. Robust enumeration of cell subsets from tissue expression profiles. Nat Methods. 2015;12(5):453–457. doi:10.1038/nmeth.3337
19. Ru B, Wong CN, Tong Y, et al. TISIDB: an integrated repository portal for tumor–immune system interactions. Bioinformatics. 2019;35(20):4200–4202. doi:10.1093/bioinformatics/btz210
20. Shankavaram UT, Varma S, Kane D, et al. CellMiner: a relational database and query tool for the NCI-60 cancer cell lines. BMC Genomics. 2009;10(1):277. doi:10.1186/1471-2164-10-277
21. Reinhold WC, Sunshine M, Liu H, et al. CellMiner: a web-based suite of genomic and pharmacologic tools to explore transcript and drug patterns in the NCI-60 cell line set. Cancer Res. 2012;72(14):3499–3511. doi:10.1158/0008-5472.CAN-12-1370
22. Binnewies M, Roberts EW, Kersten K, et al. Understanding the tumor immune microenvironment (TIME) for effective therapy. Nat Med. 2018;24(5):541–550. doi:10.1038/s41591-018-0014-x
23. Gutierrez LS, Gutierrez J. Thrombospondin 1 in metabolic diseases. Front Endocrinol. 2021;12:638536. doi:10.3389/fendo.2021.638536
24. Kazerounian S, Yee KO, Lawler J. Thrombospondins in cancer. Cell Mol Life Sci. 2008;65(5):700–712. doi:10.1007/s00018-007-7486-z
25. Liu X, Xu D, Liu Z, et al. THBS1 facilitates colorectal liver metastasis through enhancing epithelial–mesenchymal transition. Clin Transl Oncol. 2020;22(10):1730–1740. doi:10.1007/s12094-020-02308-8
26. Pierson B, Gupta K, Hu W, Miller J. Human natural killer cell expansion is regulated by thrombospondin- mediated activation of transforming growth factor-beta 1 and independent accessory cell-derived contact and soluble factors. Blood. 1996;87(1):180–189. doi:10.1182/blood.V87.1.180.180
27. Decker S, van Valen F, Vischer P. Adhesion of osteosarcoma cells to the 70-kDa core region of thrombospondin-1 is mediated by the a4b1 integrin. Biochem Biophys Res Commun. 2002;293(1):86–92.
28. Luo Z-W, Liu -P-P, Wang Z-X, Chen C-Y, Xie H. Macrophages in osteosarcoma immune microenvironment: implications for immunotherapy. Front Oncol. 2020;10:586580. doi:10.3389/fonc.2020.586580
29. Wang H, Wu X, Chen Y. Stromal-immune score-based gene signature: a prognosis stratification tool in gastric cancer. Front Oncol. 2019;9:1212. doi:10.3389/fonc.2019.01212
30. Jayasingam SD, Citartan M, Thang TH, Mat Zin AA, Ang KC, Ch’ng ES. Evaluating the polarization of tumor-associated macrophages into M1 and M2 phenotypes in human cancer tissue: technicalities and challenges in routine clinical practice. Front Oncol. 2020;9:1512. doi:10.3389/fonc.2019.01512
31. Shi M, Gu Y, Jin K, et al. CD47 expression in gastric cancer clinical correlates and association with macrophage infiltration. Cancer Immunol Immunother. 2021;70(7):1831–1840. doi:10.1007/s00262-020-02806-2
32. Wang J, Li Y. CD36 tango in cancer: signaling pathways and functions. Theranostics. 2019;9(17):4893–4908. doi:10.7150/thno.36037
33. Chen X, Gao A, Zhang F, et al. ILT4 inhibition prevents TAM- and dysfunctional T cell-mediated immunosuppression and enhances the efficacy of anti-PD-L1 therapy in NSCLC with EGFR activation. Theranostics. 2021;11(7):3392–3416. doi:10.7150/thno.52435
34. Pelcovits A, Almhanna K. Locoregional gastric cancer: a narrative review of multidisciplinary management. Ann Transl Med. 2020;8(17):1108. doi:10.21037/atm-20-3509
 © 2021 The Author(s). This work is published and licensed by Dove Medical Press Limited. The full terms of this license are available at https://www.dovepress.com/terms.php and incorporate the Creative Commons Attribution - Non Commercial (unported, v3.0) License.
By accessing the work you hereby accept the Terms. Non-commercial uses of the work are permitted without any further permission from Dove Medical Press Limited, provided the work is properly attributed. For permission for commercial use of this work, please see paragraphs 4.2 and 5 of our Terms.
© 2021 The Author(s). This work is published and licensed by Dove Medical Press Limited. The full terms of this license are available at https://www.dovepress.com/terms.php and incorporate the Creative Commons Attribution - Non Commercial (unported, v3.0) License.
By accessing the work you hereby accept the Terms. Non-commercial uses of the work are permitted without any further permission from Dove Medical Press Limited, provided the work is properly attributed. For permission for commercial use of this work, please see paragraphs 4.2 and 5 of our Terms.