")
Back to Journals » OncoTargets and Therapy » Volume 12
Upregulation Of miR-149-3p Suppresses Spinal Chordoma Malignancy By Targeting Smad3
Received 8 July 2019
Accepted for publication 18 October 2019
Published 19 November 2019 Volume 2019:12 Pages 9987—9997
DOI https://doi.org/10.2147/OTT.S222380
Checked for plagiarism Yes
Review by Single anonymous peer review
Peer reviewer comments 3
Editor who approved publication: Dr Arseniy Yuzhalin
Jie Yao,1 Xuejian Wu2
1Department of Spine, The Orthopedic Hospital of Zhengzhou, Zhengzhou, Henan 450099, People’s Republic of China; 2Department of Orthopaedics, First Affiliated Hospital of Zhengzhou University, Zhengzhou, Henan 450052, People’s Republic of China
Correspondence: Xuejian Wu
Department of Orthopaedics, First Affiliated Hospital of Zhengzhou University, No.1 Jianshe East Road, Zhengzhou, Henan 450052, People’s Republic of China
Tel +86-13603711617
Email [email protected]
Purpose: Dysregulation of miRNAs plays an important role in the malignancy of different tumors including chordoma. Expression of miR-149-3p was earlier reported to be downregulated in chordoma tissue. However, its biological role remains to be unrevealed in chordoma, especially in spinal chordoma.
Methods: Expression of miR-149-3p and Smad3 was detected by RT-qPCR and Western blot. Chordoma malignancy was evaluated by cell proliferation, migration, invasion, and apoptosis using MTT assay, transwell assay, flow cytometry analyzing apoptosis rate, and Western blot-determined expression of Bcl-2, Bax, and cleaved caspase 3, respectively. The target binding between miR-149-3p and Smad3 was predicted by TargetScan Human website and confirmed by luciferase reporter assay and RNA immunoprecipitation. Xenograft tumors were generated, and expression of miR-149-3p and Smad3 was investigated in vivo.
Results: miR-149-3p was downregulated in spinal chordoma tissues and cells, and its overexpression promoted chordoma cell apoptosis and inhibited proliferation, migration, and invasion in U-CH1 and MUG-Chor1 cells. Unexpectedly, Smad3 was a downstream target of miR-149-3p and negatively correlated with miR-149-3p expression in chordoma tissues. Besides, Smad3 was upregulated in chordoma tissues and its silencing had a similar effect as miR-149-3p overexpression in U-CH1 and MUG-Chor1 cells. Moreover, Smad3 upregulation could partially reverse the tumor-suppressive effect of miR-149-3p in chordoma cells. In vivo, the tumorigenesis of U-CH1 and MUG-Chor1 cells was impaired by upregulated miR-149-3p through decreasing Smad3 expression.
Conclusion: miR-149-3p could serve as a tumor suppressor in spinal chordoma through targeting and downregulating Smad3.
Keywords: miR-149-3p, Smad3, spinal chordoma, malignancy
Introduction
Chordoma is a mesenchymal tissue tumor and accounts for 1–4% of all bone tumors.1 Arising from embryonic remnants of notochord, chordoma is characterized with high metastasis to bone, lung, and liver, and high recurrence in spite of its slow growth and low incidence.2 Usually, this tumor predominantly attacks older male adults in clivus and sacrum.3 Clinically, surgical resection is the first choice for the effective treatment of chordoma, followed by high-dose radiotherapy.4,5 However, patients are still vulnerable to relapse after surgery. Therefore, it is urgently needed to explore the molecular pathogenesis underlying chordoma, and thus providing novel promising therapeutic targets.
Recent studies indicated that the growth of chordoma was possibly relying on multiple mechanisms, including genetic and epigenetic modifications.6–8 The major epigenetic changes include DNA methylation, histone modification, and post-transcriptional regulation controlled by noncoding RNAs including microRNAs (miRNAs). miRNAs are a class of highly conserved small noncoding RNAs with approximately 22 nucleotides. Mechanically, the complementary binding of miRNAs to target messenger RNAs (mRNAs) results in the degradation of mRNA or translation inhibition.9 Dysregulation of miRNAs plays important roles in tumor initiation and progression,10 and miRNAs take an indispensable part in different tumors including chordoma.11 Recently, differentially expressed miRNA patterns have been screened in chordoma tissues and cells.12,13 Moreover, several miRNAs such as miRNA-140-3p,14 miRNA-1237-3p,15 and miRNA-15516 are identified to be markers correlated with prognosis in chordoma. Besides, altered miRNA profile is also discovered in chordoma cancer stem-like cells (CSCs) which are related to tumorigenesis, recurrence, and resistance in cancers.17 It is well documented that dysregulation of miRNAs affects cancer initiation and progression through altering mRNA expression. For example, miRNA-31, miRNA-148a, and miRNA-222-3p modulate the cell viability, cell cycle, apoptosis, and differentiation by targeting and downregulating RDX and MET, DNMT1 and DNMT3B, and TRPS1, BIRC5, and KIT.11
Integrated miRNA-mRNA profile analysis reveals that miRNA-149-3p (miR-149-3p), together with miRNA-663a, miRNA-1908, miRNA-2861, and miRNA-3185, is complicated with MAPK pathways which are consistently enriched in the chordoma tissues.18 Previous studies have suggested that miR-149-3p is a novel cancer-related miRNA and participates in various cancers, including bladder cancer,19 pancreatic cancer,20 and gastric cancer.21 The cell proliferation, migration, and invasion tend to be suppressed by miR-149-3p. Furthermore, miR-149-3p serves as a biomarker for diagnosis22 and prognosis23 of cancers. However, the biological functions of miR-149-3p in chordoma have not been illuminated yet, especially in spinal chordoma.
miR-149-3p has been reported to target several genes such as S100A4,19 forkhead box protein M1 (FOXM1),24 Akt1,20 and Wnt-1.21 Therefore, in the present study, we detected the expression of miR-149-3p in spinal chordoma tissues. The effects of miR-149-3p on chordoma cell proliferation, apoptosis, migration, and invasion were investigated, as well as its downstream target gene.
Materials And Reagents
Chordoma Tissue Samples
This study was performed according to the recommendations of the Declaration of Helsinki. In total, 20 primary spinal chordoma patients and 12 patients with disc herniation were recruited in this study with approval of Research Ethics Committee First Affiliated Hospital of Zhengzhou University. The spinal chordoma patients (10 males and 10 females, aged 30–68 years) were diagnosed with histopathologically and clinically confirmed spinal chordoma of conventional subtype according to the World Health Organization classification. None of the enrolled spinal chordoma patients had received any chemotherapy or radiotherapy before surgical excision of the tumor lesion. The nucleus pulposus tissues were collected from 12 patients with disc herniation (6 males and 6 females, aged 28–71 years) as control. All the tissue samples were obtained when undergoing surgical resection at the First Affiliated Hospital of Zhengzhou University and were immediately frozen in liquid nitrogen and then stored at −80°C until use. Tissue samples were obtained following the written informed consent from all patients.
Human Nucleus Pulposus Cell Isolation and Cell Culture
Nucleus pulposus cells were isolated from healthy nucleus pulposus tissues of patients with disc herniation, described above. The tissues were sequentially digested at 37°C by 0.25% trypsin solution for 30 mins and then 0.2% type II collagenase for 4 hrs. After removing tissue debris, the digest cells were cultured in DMEM (HyClone, Logan, UT, USA) containing 20% FBS (HyClone).
The human chordoma cell lines U-CH1 (CRL-3217) and MUG-Chor1 (CRL-3219) were obtained from American Type Culture Collection (ATCC; Manassas, VA, USA) and were cultured in Iscove’s Modified Dulbecco’s Medium (IMDM) and RPMI-1640 (HyClone) at a ratio of 4:1 supplemented with 10% FBS (HyClone), 1% penicillin–streptomycin (HyClone), and 1% L-glutamine (HyClone). All cells were incubated in a humidified incubator with a 5% CO2–95% air atmosphere at 37°C.
Cell Transfection
Plasmid pcDNA 3.1-Smad3, oligonucleotides including siRNA against Smad3 (siSmad3), miR-149-3p mimic, anti-miR-149-3p, and their negative controls were acquired from GenePharma (Shanghai, China). Usually, 50 nM of oligonucleotides and 2 μg of plasmid were solely transfected into U-CH1 and MUG-Chor1 cells. In rescue experiments, 30 nM of miR-149-3p and 1 μg of plasmid were uniformly mixed and co-transfected in U-CH1 and MUG-Chor1 cells. All transfection procedures were carried out using Lipofectamine™ 2000 (Invitrogen, Carlsbad, CA, USA). Transfected cells were incubated for 36 hrs for further study.
RNA Isolation And Real-Time Quantitative PCR (RT-qPCR)
Expression of miR-149-3p and Smad3 mRNA in tissues and cells was determined by RT-qPCR. Total RNAs were extracted with TRIzol reagent (Invitrogen) and the first-strand cDNA was synthesized using a high capacity RNA-to-cDNA kit (Takara, Dalian, China). The quantitative PCR was performed with SYBR Prime-Script RT-PCR kit (Takara) on ABI 7500 real-time PCR system (Applied Biosystems, Foster City, CA, USA). GAPDH mRNA and U6 snRNA (U6) were used to normalize the relative abundance of Smad3 and miR-149-3p, respectively. Primers involved are as follows: Smad3: 5ʹ-CATTCCATTCCCGAGAACAC-3ʹ forward and 5ʹ-ATGCTGTGGTTCATCTGGTG-3ʹ reversed; GAPDH: 5ʹ-ACCCACTCCTCCACCTTTGA-3ʹ forward and 5ʹ-CTGTTGCTGTAGCCAAATTCGT-3ʹ reversed. Detection of mature miRNAs was performed using the miRNA Primer (RiboBio, Guangzhou, China), according to the manufacturer’s instructions. The reactions were performed in quadruplicate for each sample at least three independent runs. The relative gene expression was calculated using the 2−ΔΔCt method.
Protein Extraction And Western Blot
Expression of Smad3 protein in U-CH1 and MUG-Chor1 cells was determined by Western blot assay. Total protein was isolated in 1x Cell Lysis Buffer (Cell Signaling Technology, Danvers, MA, USA) and the protein concentrations were determined by Bradford protein assay reagent (Bio-Rad, Hercules, CA, USA). Equal amounts of protein (20 μg) from each sample were loaded for the standard procedures of Western blot assay. GAPDH on the same membrane was an internal standard to normalize protein levels. The primary antibodies were purchased from Cell Signaling Technology and as follows: Smad3 (#9513, 1:1000) and GAPDH (#97166, 1:1000). Every sample suffered from Western blot procedures three times.
MTT Assay
U-CH1 and MUG-Chor1 cells (3000 cells) transfected or not were seeded into 96-well plate (Corning) for 0, 24, 48, and 72 hrs. The cell viability was determined by 3-(4, 5-dimethylthiazol-2-yl)-2, 5 diphenyltetrazolium bromide (MTT; Sigma, Louis, MO, USA) staining. MTT (20 μL, 5 mg/mL) was added to each well for another 4 hrs at 37°C; after that, the medium was discarded and 150 μL dimethyl sulfoxide (DMSO; Sigma) was added into each well. The absorbance at 450 nm was measured with Bio-Rad 680 microplate reader (Bio-Rad). The samples were in quintuplicate and all experiments were performed for 3 times.
Transwell Migration And Invasion Assay
For determination of the ability of migration and invasion, U-CH1 and MUG-Chor1 cells transfected or not were exposed with transwell assay. The transwell assays were performed in 24-well transwell chamber (8 μm pores; Corning, NY, USA) with matrigel-free (for migration) or matrigel-coated (for invasion) (BD Biosciences). U-CH1 and MUG-Chor1 (2 × 10⁴ cells/mL) were resuspended into 200 μL of serum-free medium and plated in the upper chamber, and the lower chamber was filled with 500 µL complete medium containing 10% FBS. After the transwell system were stayed in 37°C for 24 hrs, the cells on the lower surface were stained with 0.1% crystal violet for 15 mins at room temperature, followed by being photographed and counted under a light microscope. Each transwell assay was repeated three times.
Flow Cytometry
The apoptosis rate of U-CH1 and MUG-Chor1 cells transfected or not was analyzed by Annexin V-FITC/PI kit (Beyotime, Shanghai, China) on flow cytometry. After transfection for 48 hrs, apoptotic cells were collected and washed with phosphate-buffered saline (PBS). Cell suspension of 106 cells were prepared and labeled with FITC-Annexin V and propidium Iodide (PI) for 30 mins in the dark. The fluorescence was analyzed on Influx Flow Cytometer & Cell Sorter System (BD, Franklin Lakes, NJ, USA). Quadrants were positioned on Annexin V/PI plots to distinguish apoptotic cells (Annexin V+/PI-, Annexin V+/PI+). Apoptosis rate= apoptotic cells/total cells × 100%. Each cell sample for flow cytometry was collected from three independent experiments.
Luciferase Reporter Assay And RNA Immunoprecipitation (RIP)
Human Smad3 3ʹ UTR fragment wild type (Smad3-wt) containing the potential binding sites of hsa-miR-149-3p and its corresponding mutant (Smad3-mut) were cloned by PCR methods into pmirGLO vector (Invitrogen). The Smad3-wt was replaced the CCCUCCC with GGGAGGG as the Smad3-mut. U-CH1 and MUG-Chor1 cells were co-transfected according to the following groups: Smad3-wt+miR-NC mimic (NC), Smad3-wt+miR-149-3p, Smad3-mut+NC, Smad3-mut+miR-149-3p. The pmirGLO vector itself provided a strong renilla luciferase signal acting as a control reporter for normalization. After 48 hr incubation, cells were collected to measure firefly and renilla luciferase activity using the dual-luciferase reporter assay system (Promega, Madison, WI, USA). The relative luciferase activity was the average of at least three independent transfections and was the ratio of firefly to renilla. All the transfection groups were performed in triplicate.
RIP was performed with extracts from U-CH1 and MUG-Chor1 cells after transfection with miR-149-3p/NC. All the transfection groups were performed in triplicate. Magna RIPTM RNA-binding protein immunoprecipitation kit (Millipore, Bradford, MA, USA) was chosen to detect the expression of Smad3 from the samples bound to the Ago2 or IgG antibody. After washing, total RNAs were isolated with TRIzol and subjected to RT-qPCR assay. All operations obeyed the standard instructions.
Tumor Xenografts
Four-week-old athymic BALB/c mice were obtained from the Model Animal Research Center of Nanjing University. The animal experiments were approved by the Institutional Review Board of First Affiliated Hospital of Zhengzhou University and were untaken in accordance with National Institutions of Health Guide for Care and Use of Laboratory Animals. Equal numbers (106 cells in 0.2 mL of PBS) of U-CH1 and MUG-Chor1 cells stably transfected miR-149-3p or NC were subcutaneously injected in the left forelimb (4 mice per group) for 5 weeks. The tumor volume was measured with a caliper per week and calculated using the formula: V (mm3) = 1/2 ab2 (a is the longest tumor axis and b is the shortest tumor axis); the mice were practiced with euthanasia on week 5 and the weight of tumors was evaluated with an electronic balance. Immediately, the xenograft tumors were flash-frozen in lipid nitrogen and stored in −80°C for further isolation of total RNA and protein.
Statistical Analyses
All data were shown as mean ± standard deviation. All statistical analyses were performed using SPSS software 21.0 (IBM, Armonk, NY, USA). Student’s t test was used to determine the statistical significance between two groups in vitro and in vivo experiments. A two-tailed value of P<0.05 was considered statistically significant. The statistical association between expressions of miR-149-3p and Smad3 mRNA was evaluated with regression correlation analyses.
Results
miR-149-3p Was Downregulated In Spinal Chordoma Tissues And Its Overexpression Inhibited Chordoma Malignancy In Vitro
To assess the role of miR-149-3p in chordoma, we measured its expression in spinal chordoma tissues. As shown in Figure 1A, the expression level of miR-149-3p in spinal chordoma tissues was abundantly lower than nucleus pulposus tissues according to RT-qPCR results (2−ΔΔCt values). The human chordoma cell lines U-CH1 and MUG-Chor1 were utilized to investigated biological functions of miR-149-3p dysregulation in chordoma. First, U-CH1 and MUG-Chor1 cells expressed lower basal level of miR-149-3p compared to human nucleus pulposus cells (Figure 1B) and were forced highly expressed miR-149-3p by transient transfection of miR-149-3p mimic (miR-149-3p), and miR-NC mimic (NC) transfection was the negative control group. The high transfection efficiency (more than 3.5-fold) was determined by analyzing miR-149-3p levels (Figure 1C). After transfection for 36 hrs, a series of functional experiments were carried out. Cell viability of U-CH1 and MUG-Chor1 cells was evaluated by MTT assay, and OD450 values were significantly decreased in the miR-149-3p group on 72 h (Figure 1D). Transwell assays were used to measure the ability of U-CH1 and MUG-Chor1 cell migration and invasion. As a result, numbers of migratory cells and invasive cells were descended when miR-149-3p overexpressed (Figure 1E and F). Cell apoptosis was identified with flow cytometry and Western blot. As presented in Figure 1G, the apoptosis rate of U-CH1 and MUG-Chor1 cells after miR-149-3p transfection was distinctively elevated than the NC group. Meanwhile, the expression of apoptosis-related gene Bax and cleaved caspase 3 was promoted by ectopic expression of miR-149-3p, accompanied by inhibited Bcl-2 level (Figure 1H). These results demonstrated that miR-149-3p was downregulated in spinal chordoma tissues, and its overexpression could inhibit chordoma cell proliferation, migration, and invasion and promoted apoptosis in vitro, suggesting a suppressive role of miR-149-3p in spinal chordoma malignancy.
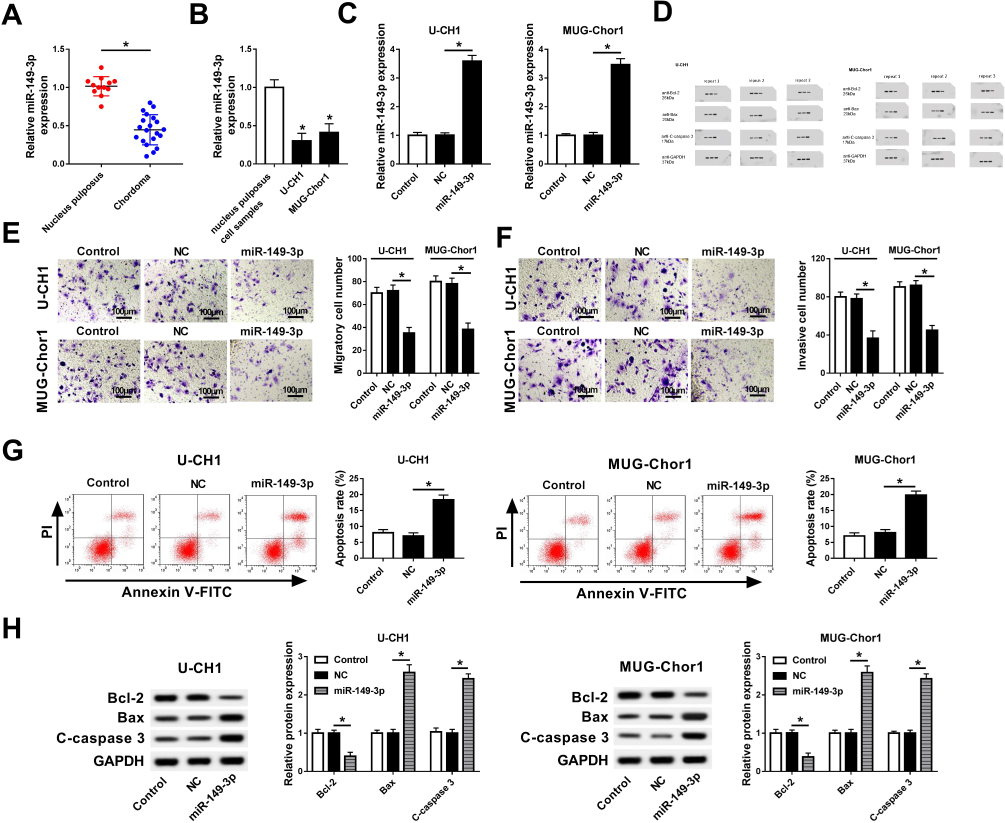 |
Figure 1 Role of miR-149-3p in spinal chordoma malignancy. (A) Expression of miR-149-3p in tissues of spinal chordoma and nucleus pulposus was examined by RT-qPCR. *P< 0.05 compared to the nucleus pulposus group. (B) RT-qPCR detected miR-149-3p level in human nucleus pulposus cell samples and chordoma cell lines U-CH1 and MUG-Chor1. (C-G) The U-CH1 and MUG-Chor1 cells were transfected with miR-149-3p/NC mimic (miR-149-3p/NC), and cells without transfection were the control group. (C) Expression levels of miR-149-3p were detected after transfection for 36 hrs. (D) Cell viability was evaluated by MTT assay after transfection for 0, 24, 48, and 72 hrs. (E, F) Transwell assays were used to determine the ability of migration and invasion. (G) Flow cytometry was employed to measure the apoptosis rate after transfection. (H) Expression of apoptosis-related genes Bcl-2, Bax, and cleaved caspase 3 (C-caspase 3) was detected by Western blot. The quantification of Western blot was performed on Image J software. NC group versus control group or miR-149-3p group. *P< 0.05. All data were mean ± standard deviation (SD). |
miR-149-3p Targeted And Downregulated Smad3 In Chordoma Cells
In this study, the regulatory relationship between miR-149-3p and Smad3 was investigated. According to the in silicon data on TargetScan Human, there was one putative miR-149-3p target site in 3ʹ UTR of Smad3 wild type (Smad3-wt) as represented in Figure 2A. Figure 2A, as well as the corresponding mutant (Smad3-mut). The sequences containing Smad3-wt and Smad3-mut were cloned into luciferase reporter plasmid pmirGLO, and relative luciferase activity of both was examined. U-CH1 and MUG-Chor1 cells were co-transfected with Smad3-wt/mut and miR-149-3p mimic or miR-NC mimic. As depicted in Figure 2B, relative luciferase activity of Smad3-wt was remarkably reduced in the presence of miR-149-3p mimic versus miR-NC mimic; however, there was no difference in Smad3-mut group. Moreover, RIP was launched to further confirm the target binding between miR-149-3p and Smad3, and expression of Smad3 in RIP-Ago2 in U-CH1 and MUG-Chor1 cells was extremely enriched when overexpressed miR-149-3p (Figure 2C). Subsequently, the regulatory effect of miR-149-3p on Smad3 expression was detected. Protein expression level of Smad3 in U-CH1 and MUG-Chor1 cells was reduced when transfected with miR-149-3p mimic and increased when transfected with anti-miR-149-3p (Figure 2D). Besides, there existed an extremely significant (R2=0.739, P<o.oo1) negative correlation between expression levels of miR-149-3p and Smad3 mRNA in chordoma tissues (Figure 2E). These data illustrated that Smad3 served as a target gene for miR-149-3p and was negatively regulated by miR-149-3p.
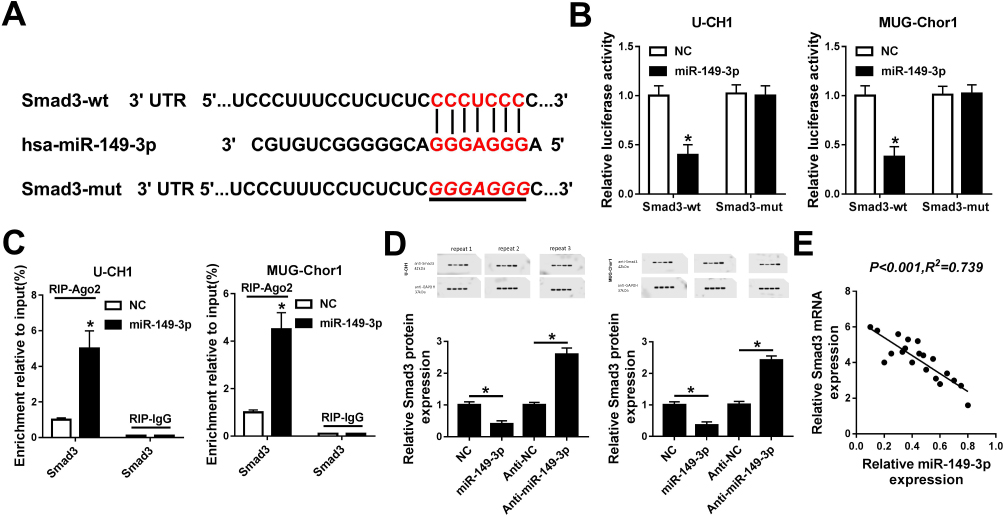 |
Figure 2 The regulatory relationship between miR-149-3p and Smad3. (A) The predicted miR-149-3p-binding sites in human Smad3 gene wild type (Smad3-wt) according to TargetScan Humam software. The corresponding sequence in the mutated version (Smad3-mut) was shown as well. (B) Relative luciferase activity of Smad3-wt and Smad3-mut in U-CH1 and MUG-Chor1 cells when transfected with miR-149-3p/NC. (C) Expression of Smad3 in RNA immunoprecipitation (RIP)-Ago2 and RIP-IgG from U-CH1 and MUG-Chor1 cells when transfected with miR-149-3p/NC. (D) Expression levels of Smad3 were confirmed by Western blot in U-CH1 and MUG-Chor1 cells when transfected with miR-149-3p, anti-miR-149-3p or its corresponding controls. The quantification of Western blot was performed on Image J software. (E) The correlation between expressions of miR-149-3p and Smad3 mRNA was confirmed by regression correlation analyses. *P< 0.05 comparing to NC group or anti-NC group. All data were mean ± SD. |
Smad3 Was Upregulated In Spinal Chordoma Tissues And Its Silencing Suppressed Chordoma Malignancy In Vitro
To explore the expression of Smad3 in chordoma, tissues of spinal chordoma and nucleus pulposus were isolated. RT-qPCR results (2−ΔΔCt values) showed the upregulation of Smad3 in spinal chordoma (Figure 3A). The functional roles of Smad3 dysregulation were determined in chordoma cells in vitro. U-CH1 and MUG-Chor1 cells were forced lowly expressed Smad3 by transient transfection of siSmad3, and transfection of scrambled siRNA (Scramble) was the negative control group. The high transfection efficiency (about 0.3-fold) was determined by analyzing Smad3 mRNA levels (Figure 3B). After transfection for 36 hrs in U-CH1 and MUG-Chor1 cells, cell proliferation was attenuated by siSmad3, as evidenced by MTT assay analyzing OD450 values for 72 hrs (Figure 3C); the ability of cell motility was also decreased when transfected with siSmad3 as described by transwell migration and invasion assays (Figure 3D and E); on the contrary, cell apoptosis was identified to be facilitated as demonstrated by higher apoptosis rate (Figure 3F), elevated levels of Bax and cleaved caspase 3, and lower Bcl-2 level (Figure 3G). These results indicated that Smad3 was upregulated in spinal chordoma tissues, and its silencing could suppress chordoma cell proliferation, migration, and invasion and promoted apoptosis in vitro, suggesting a suppressive role of Smad3 downregulation in spinal chordoma malignancy.
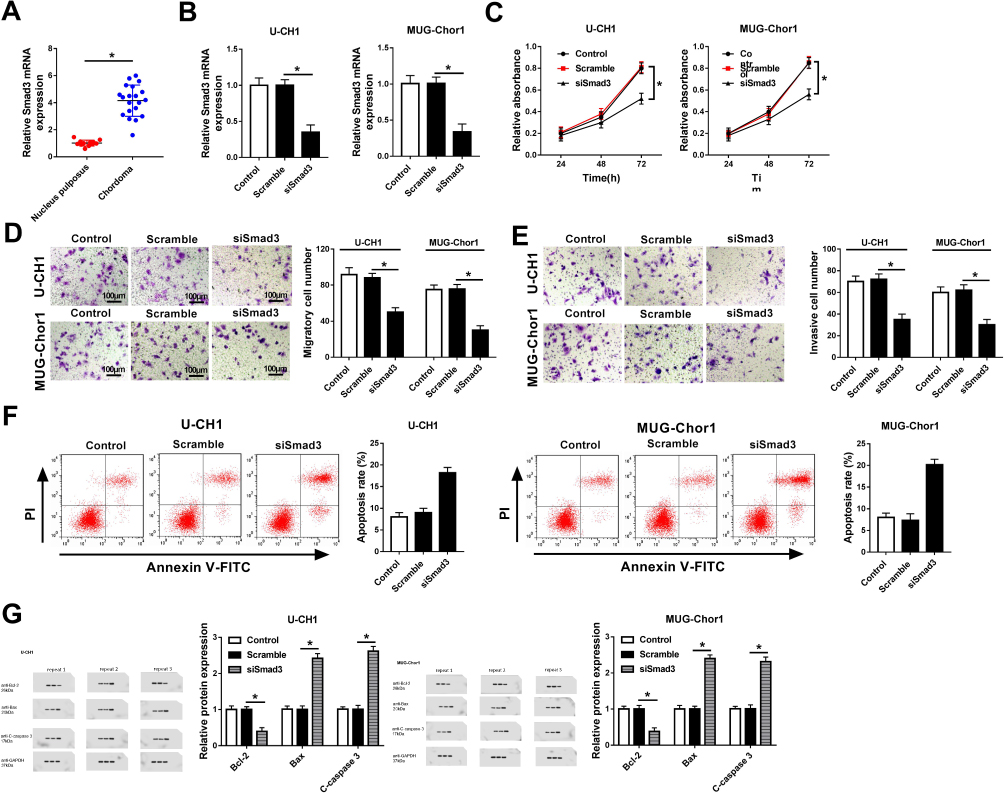 |
Figure 3 Role of Smad3 in spinal chordoma malignancy. (A) Expression of Smad3 in tissues of chordoma and nucleus pulposus was examined by RT-qPCR. *P< 0.05 comparing to the nucleus pulposus group. (B-G) U-CH1 and MUG-Chor1 cells were transfected with siRNA against Smad3 (si-Smad3) or scrambled siRNA (Scramble), and cells without transfection were the control group. (B) Expression levels of Smad3 were detected by RT-qPCR after transfection for 36 hrs. (C) Cell proliferation was evaluated by MTT assay after transfection for 0, 24, 48, and 72 hrs. (D, E) Transwell assays were used to determine the ability of migration and invasion. (F) Flow cytometry was employed to measure the apoptosis rate after transfection. (G) Expression of Bcl-2, Bax, and C-caspase 3 was detected by Western blot. The quantification of Western blot was performed on Image J software. NC group versus control group or siSmad3 group and *P< 0.05. All data were mean ± SD. |
Smad3 Upregulation Partially Reversed The Tumor-Suppressive Effect Of miR-149-3p In Chordoma Cells In Vitro
Next, we wondered whether miR-149-3p suppressed spinal chordoma malignancy through downregulating its target gene Smad3. To further figure it out, rescue experiments were performed. U-CH1 and MUG-Chor1 cells were co-transfected with miR-149-3p mimic and pcDNA-Smad3/vector. As Figure 4A presented, Smad3 protein expression was strongly inhibited by miR-149-3p and then rescued by ectopic expression of Smad3. Subsequently, the influence of ectopic Smad3 on the effect of miR-149-3p on chordoma malignancy was measured in vitro. The attenuated OD450 values for 72 hrs (Figure 4B) and numbers of migratory cells and invasive cells (Figure 4C and D) induced by miR-149-3p mimic were significantly improved in the presence of pcDNA-Smad3. Inversely, miR-149-3p overexpression-mediated upregulation of apoptosis rate (Figure 4E), and the expression of Bax and cleaved caspase 3 (Figure 4F) was abolished by ectopic Smad3; Bcl-2 expression was lower when miR-149-3p sole transfection, which was reversed when simultaneous transfection of miR-149-3p mimic and pcDNA-Smad3 (Figure 4F). These data illuminated that Smad3 upregulation partially reversed the suppressive effect of miR-149-3p in spinal chordoma malignancy, implying miR-149-3p/Smad3 axis might underlie one of the pathogenesis of chordoma.
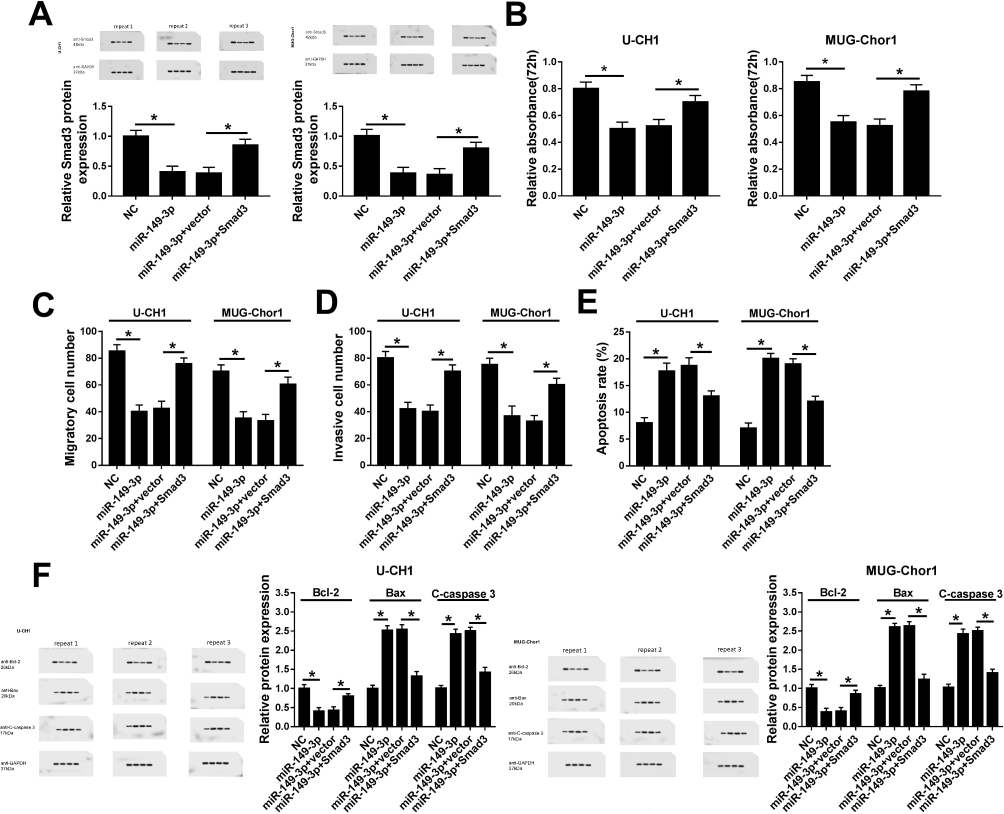 |
Figure 4 Influence of Smad3 upregulation on the tumor-suppressive role of miR-149-3p in spinal chordoma in vitro. U-CH1 and MUG-Chor1 cells were transfected with miR-149-3p/NC, or co-transfected with miR-149-3p and pcDNA-Smad3/vector (Smad3/vector) for 36 hrs. (A) Levels of Smad3 were evaluated by Western blot after transfection. (B) Cell proliferation was evaluated by MTT assay after transfection for 72 hrs. (C, D) Transwell assays were used to determine the ability of migration and invasion. (E) Flow cytometry was employed to measure the apoptosis rate after transfection. (F) Expression of Bcl-2, Bax, and C-caspase 3 was detected by Western blot. The quantification of Western blot was performed on Image J software. miR-149-3p group versus NC group and miR-149-3p+vector group versus miR-149-3p group or miR-149-3p+Smad3. *P< 0.05. All data were mean ± SD. |
Overexpression Of miR-149-3p Inhibited Tumorigenesis Of Chordoma Cells In Vivo
In order to verify the role of miR-149-3p on tumorigenesis, U-CH1 and MUG-Chor1 cells were stably expressed by miR-149-3p/NC mimic and then were injected into mice. As shown in Figure 5A, the tumors formed in both groups and the tumors in the miR-149-3p group were dramatically smaller and lighter than the NC group after inoculation for 4–5 weeks. Moreover, the expression of miR-149-3p was higher and Smad3 was lower in xenograft tumors induced by U-CH1 and MUG-Chor1 cells (Figure 5B and C). These outcomes showed miR-149-3p overexpression inhibited the xenograft tumor growth, suggesting an association between miR-149-3p expression and in vivo proliferation capacity of chordoma cells.
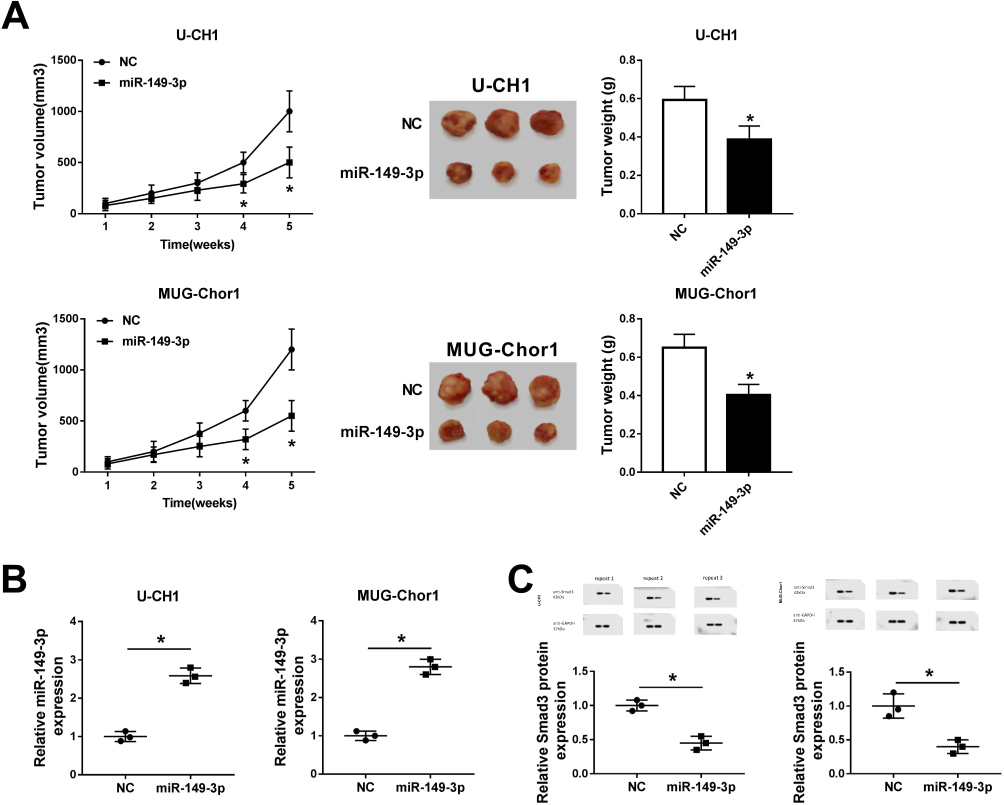 |
Figure 5 Overexpression of miR-149-3p inhibited tumor growth in xenograft mouse model. U-CH1 and MUG-Chor1 cells were stably expressed miR-149-3p/NC prior to injection into mice. (A) The volumes were calculated every week after inoculation and the growth curve was drawn. Tumor weight was recorded as well. (B, C) Expression of miR-149-3p and Smad3 was confirmed in the xenograft tumors. *P< 0.05 comparing to the NC group. All data were mean ± SD. |
Discussion
Dysregulated expression of miRNAs is frequently observed in chordoma compared to different types of control tissues: muscle, embryonic notochord, and nucleus pulposus.11 Acting as tumor suppressors or oncogenes, these miRNAs affect the initiation, development, and prognosis of chordoma. For example, miR-125 and miR-3126 were consistently downregulated in chordoma, and restoration of them inhibited chordoma cell proliferation, migration, and invasion by targeting Slug and EZH2 in U-CH1 and JHC7 cells. miR-15516 and miR-140-3p14 expression in chordoma tissues was significantly elevated, and this expression correlated significantly with disease stage, metastasis, and poor outcomes; inhibition of miR-155 suppressed chordoma proliferation and the migratory and invasive activities in U-CH1 cells.16 However, there is still very limited information about miRNAs in chordoma. In the present study, we confirmed whether expression of miR-149-3p was downregulated in chordoma and further investigated the role of miR-149-3p in regulating spinal chordoma malignancy, as well as confirming miR-149-3p/Smad3 axis in the pathogenesis of spinal chordoma.
To our best knowledge, this is the first to demonstrate the role of miR-149-3p in chordoma cells, even though its downregulation was early announced by Long et al.18 We performed RT-qPCR assay to examine the altered expression level of miR-149 in spinal chordoma tissues and noticed that miR-149-3p was dramatically lower in spinal chordoma tissues versus nucleus pulposus tissues. Results from miRNA array assay analyzing and RT-qPCR validation showed that miR-149-3p, miR-663a, miR-1908, miR-2861, and miR-3185 were downregulated in chordoma tissue compared to notochord tissue and targeted to MAPK pathway-related mRNAs.18 These data suggest that miR-149-3p may act as a tumor suppressor in chordoma. To further research the special biological functions of miR-149-3p in chordoma, we forced highly expressed miR-149-3p in human chordoma cell lines U-CH1 and MUG-Chor1 by transfection. Subsequently, a series of functional experiments were carried out and miR-149-3p overexpression suppressed chordoma cell proliferation, migration, and invasion and promoted apoptosis in vitro. Moreover, U-CH1 and MUG-Chor1 cells overexpressed miR-149-3p and were used to establish xenograft model of human chordoma in nude mice and found that the tumorigenesis of U-CH1 and MUG-Chor1 cells was impaired when miR-149-3p upregulated. Herein, we concluded the antitumor role of miR-149-3p in spinal chordoma. Besides, mountains of evidence support an important suppressive role of this miRNA in various diseases. For example, Zhao et al27 declared that miR-149-3p inhibition contributed to IL-1β-evoked matrix aberrant catabolism and inflammation in osteoarthritic chondrocytes during its sponge PVT1 cessation. In cancers, increased expression of miR-149-3p significantly suppressed cell proliferation and enhanced cell aggressiveness through targeting S100A4 in bladder cancer19 and directly regulating FOXM1 in renal cell carcinoma24 miR-149-3p upregulation distinctly induced apoptosis via inhibiting Wnt-121 in gastric cancer and decreasing Akt1 in pancreatic cancer.20 Apoptosis rate and levels of Bax, Apaf-1, cleaved caspase-3/9, cleaved PARP, and cytochrome c release could be increased by miR-149-3p. Taken together, miR-149-3p could function as a widespread tumor suppressor in regulating cell proliferation, apoptosis, migration, invasion, and inflammation in different tumors.
Next, we explored the mechanism of miR-149-3p in chordoma cells, and Smad3 was suggested to be a downstream target of miR-149-3p as confirmed by luciferase reporter assay and RIP. Smad3, a major transcription factor in transforming growth factor‐β (TGF‐β) signaling, plays critical roles in both tumor‐suppressive and pro‐oncogenic functions. A wide variety of biological processes such as cell cycle progression28 and fibrosis,29 as well as apoptosis, migration, and invasion12,30 have been declared to be altered by Smad3 expression. It also sheds light on the target association between Smad3 and miRNAs in tumors including miRNA-5195-3p28 miRNA-145,31 and miRNA-505-3p32 In chordoma, miRNA-16-5p targeting Smad3 was declared to participate in cell proliferation, invasion, and metastasis in U-CH1 and U-CH2 cells.12 However, there is no evidence to clarify the relationship between miR-149-3p and Smad3. In addition, the role of Smad3 in chordoma has not been well illustrated. Here, we demonstrated a novel miR-149-3p/Smad3 axis in regulating chordoma cell development. In brief, both of the studies observed a higher expression of Smad3 in chordoma tissues and cell lines, and a suppressive effect of Smad3 knockdown on proliferation, migration, and invasion in vitro through acting as a downstream target gene for miRNA. Whereas, they declared the biological role of Smad3 in U-CH1 and U-CH2 cells, and an inhibition of Smad3 knockdown on epithelial–mesenchymal transition (EMT); instead, we showed the effects of Smad3 in U-CH1 and MUG-Chor1 cells and a promotion of Smad3 knockdown on apoptosis. Besides acting as target gene for miRNA, Smad3 mRNA expression was demonstrated to be corrected with miR-16-5p12 and miR-149-3p expression in chordoma tissues. Furthermore, we also discovered that silencing of Smad3 promoted apoptosis rate and expression of Bax and cleaved caspase3, accompanied by decreased Bcl-2 level. However, the contribution of Smad3 on EMT was left to be uncovered in this study, as well as the correlation between Smad3 expression and biological characteristics of chordoma. Additionally, whether Smad3 signaling pathways participated in spinal chordoma malignancy, especially in miR-149-3p role in spinal chordoma has been sealed still.
To summarize, we showed miR-149-3p was downregulated in spinal chordoma tissue, and its overexpression enhanced chordoma cell apoptosis and inhibited cell viability, migration, and invasion in vitro through directly downregulating Smad3. Besides, knockdown of Smad3 had a similar effect as overexpression of miR-149-3p in spinal chordoma malignancy. In vivo, the tumor growth of chordoma was impaired by upregulated miR-149-3p accompanied by low Smad3 expression level. Our research demonstrates a precise biological role of miR-149-3p, as well as the Smad3 in spinal chordoma. We also provide a novel target relationship between miR-149-3p and Smad3.
Conclusion
In summary, miR-149-3p could serve as a tumor suppressor in spinal chordoma through targeting and downregulating Smad3.
Abbreviations
miRNAs, microRNAs; mRNAs, messenger RNAs; CSCs, cancer stem-like cells; FOXM1, forkhead box protein M1; IMDM, Iscove’s Modified Dulbecco’s Medium; FBS, fetal bovine serum; siSmad3, siRNA against Smad3; SD, standard deviation; TGF‐β, transforming growth factor‐β.
Disclosure
The authors report no conflicts of interest in this work.
References
1. Almefty K, Pravdenkova S, Colli BO, et al. Chordoma and chondrosarcoma: similar, but quite different, skull base tumors. Cancer. 2007;110(11):2457–2467. doi:10.1002/(ISSN)1097-0142
2. Casali PG, Stacchiotti S, Sangalli C, et al. Chordoma. Curr Opin Oncol. 2007;19(4):367–370. doi:10.1097/CCO.0b013e3281214448
3. Wang L, Zehir A, Nafa K, et al. Genomic aberrations frequently alter chromatin regulatory genes in chordoma. Genes Chromosomes Cancer. 2016;55(7):591–600. doi:10.1002/gcc.22362
4. Gagliardi F, Boari N, Riva P, et al. Current therapeutic options and novel molecular markers in skull base chordomas. Neurosurg Rev. 2012;35(1):
5. Kayani B, Hanna SA, Sewell MD, et al. A review of the surgical management of sacral chordoma. Eur J Surg Oncol. 2014;40(11):1412–1420. doi:10.1016/j.ejso.2014.04.008
6. Walcott BP, Nahed BV, Mohyeldin A, et al. Chordoma: current concepts, management, and future directions. Lancet Oncol. 2012;13(2):e69–e76. doi:10.1016/S1470-2045(11)70337-0
7. Yu X, Li Z. Epigenetic deregulations in chordoma. Cell Prolif. 2015;48(5):497–502. doi:10.1111/cpr.12204
8. Chen H, Zhang K, Lu J, et al. Comprehensive analysis of mRNA-lncRNA co-expression profile revealing crucial role of imprinted gene cluster DLK1-MEG3 in chordoma. Oncotarget. 2017;8(68):112623–112635. doi:10.18632/oncotarget.22616
9. Tutar L, Tutar E, Tutar Y. MicroRNAs and cancer; an overview. Curr Pharm Biotechnol. 2014;15(5):430–437. doi:10.2174/1389201015666140519095304
10. Duan Z, Choy E, Nielsen GP, et al. Differential expression of microRNA (miRNA) in chordoma reveals a role for miRNA-1 in Met expression. J Orthop Res. 2010;28(6):746–752. doi:10.1002/jor.21055
11. Gulluoglu S, Tuysuz EC, Kuskucu A, et al. The potential function of microRNA in chordomas. Gene. 2016;585(1):76–83. doi:10.1016/j.gene.2016.03.032
12. Zhang H, Yang K, Ren T, et al. miR-16-5p inhibits chordoma cell proliferation, invasion and metastasis by targeting Smad3. Cell Death Dis. 2018;9(6):680. doi:10.1038/s41419-018-0738-z
13. Zhang Y, Schiff D, Park D, et al. MicroRNA-608 and microRNA-34a regulate chordoma malignancy by targeting EGFR, Bcl-xL and MET. PLoS One. 2014;9(3):e91546. doi:10.1371/journal.pone.0091546
14. Zou MX, Huang W, Wang XB, et al. Identification of miR-140-3p as a marker associated with poor prognosis in spinal chordoma. Int J Clin Exp Pathol. 2014;7(8):4877–4885.
15. Zou MX, Huang W, Wang XB, et al. Reduced expression of miRNA-1237-3p associated with poor survival of spinal chordoma patients. Eur Spine J. 2015;24(8):1738–1746. doi:10.1007/s00586-015-3927-9
16. Osaka E, Kelly AD, Spentzos D, et al. MicroRNA-155 expression is independently predictive of outcome in chordoma. Oncotarget. 2015;6(11):9125–9139. doi:10.18632/oncotarget.v6i11
17. Tuysuz EC, Gulluoglu S, Yaltirik CK, et al. Distinctive role of dysregulated miRNAs in chordoma cancer stem-like cell maintenance. Exp Cell Res. 2019;380(1):9–19. doi:10.1016/j.yexcr.2019.03.039
18. Long C, Jiang L, Wei F, et al. Integrated miRNA-mRNA analysis revealing the potential roles of miRNAs in chordomas. PLoS One. 2013;8(6):e66676. doi:10.1371/journal.pone.0066676
19. Yang D, Du G, Xu A, et al. Expression of miR-149-3p inhibits proliferation, migration, and invasion of bladder cancer by targeting S100A4. Am J Cancer Res. 2017;7(11):2209–2219.
20. Si L, Xu L, Yin L, et al. Potent effects of dioscin against pancreatic cancer via miR-149-3P-mediated inhibition of the Akt1 signalling pathway. Br J Pharmacol. 2017;174(7):553–568. doi:10.1111/bph.13718
21. Cao D, Jia Z, You L, et al. 18β-glycyrrhetinic acid suppresses gastric cancer by activation of miR-149-3p-Wnt-1 signaling. Oncotarget. 2016;7(44):71960–71973. doi:10.18632/oncotarget.12443
22. Fogli S, Polini B, Carpi S, et al. Identification of plasma microRNAs as new potential biomarkers with high diagnostic power in human cutaneous melanoma. Tumour Biol. 2017;39(5):1010428317701646. doi:10.1177/1010428317701646
23. Li Y, Liu C, Liao Y, et al. Characterizing the landscape of peritoneal exosomal microRNAs in patients with ovarian cancer by high-throughput sequencing. Oncol Lett. 2019;17(1):539–547. doi:10.3892/ol.2018.9558
24. Okato A, Arai T, Yamada Y, et al. Dual strands of Pre-miR-149 inhibit cancer cell migration and invasion through targeting FOXM1 in renal cell carcinoma. Int J Mol Sci. 2017;18(9). doi:10.3390/ijms18091969
25. Osaka E, Yang X, Shen JK, et al. MicroRNA-1 (miR-1) inhibits chordoma cell migration and invasion by targeting slug. J Orthop Res. 2014;32(8):1075–1082. doi:10.1002/jor.22632
26. Bayrak OF, Gulluoglu S, Aydemir E, et al. MicroRNA expression profiling reveals the potential function of microRNA-31 in chordomas. J Neurooncol. 2013;115(2):143–151. doi:10.1007/s11060-013-1211-6
27. Zhao Y, Zhao J, Guo X, et al. Long non-coding RNA PVT1, a molecular sponge for miR-149, contributes aberrant metabolic dysfunction and inflammation in IL-1β-simulated osteoarthritic chondrocytes. Biosci Rep. 2018;38(5). doi:10.1042/BSR20180576
28. Jahangiri Moez M, Bjeije H, Soltani BM. Hsa-miR-5195-3P induces downregulation of TGFβR1, TGFβR2, SMAD3 and SMAD4 supporting its tumor suppressive activity in HCT116 cells. Int J Biochem Cell Biol. 2019;109:1–7. doi:10.1016/j.biocel.2019.01.001
29. Loboda A, Sobczak M, Jozkowicz A, et al. TGF-β1/Smads and miR-21 in Renal Fibrosis and Inflammation. Mediators Inflamm. 2016;2016:8319283. doi:10.1155/2016/8319283
30. Jin W, Chen F, Wang K, et al. miR-15a/miR-16 cluster inhibits invasion of prostate cancer cells by suppressing TGF-β signaling pathway. Biomed Pharmacother. 2018;104:637–644. doi:10.1016/j.biopha.2018.05.041
31. Zeinali T, Mansoori B, Mohammadi A, et al. Regulatory mechanisms of miR-145 expression and the importance of its function in cancer metastasis. Biomed Pharmacother. 2019;109:195–207. doi:10.1016/j.biopha.2018.10.037
32. Tang Y, Wu B, Huang S, et al. Downregulation of miR‑505‑3p predicts poor bone metastasis‑free survival in prostate cancer. Oncol Rep. 2019;41(1):57–66. doi:10.3892/or.2018.6826
 © 2019 The Author(s). This work is published and licensed by Dove Medical Press Limited. The full terms of this license are available at https://www.dovepress.com/terms.php and incorporate the Creative Commons Attribution - Non Commercial (unported, v3.0) License.
By accessing the work you hereby accept the Terms. Non-commercial uses of the work are permitted without any further permission from Dove Medical Press Limited, provided the work is properly attributed. For permission for commercial use of this work, please see paragraphs 4.2 and 5 of our Terms.
© 2019 The Author(s). This work is published and licensed by Dove Medical Press Limited. The full terms of this license are available at https://www.dovepress.com/terms.php and incorporate the Creative Commons Attribution - Non Commercial (unported, v3.0) License.
By accessing the work you hereby accept the Terms. Non-commercial uses of the work are permitted without any further permission from Dove Medical Press Limited, provided the work is properly attributed. For permission for commercial use of this work, please see paragraphs 4.2 and 5 of our Terms.