")
Back to Journals » Cancer Management and Research » Volume 11
Upregulation of LSD1 promotes migration and invasion in gastric cancer through facilitating EMT
Authors Zhang J, Zhao D, Li Q, Du X, Liu Y, Dai X, Hong L
Received 6 September 2018
Accepted for publication 10 December 2018
Published 15 May 2019 Volume 2019:11 Pages 4481—4491
DOI https://doi.org/10.2147/CMAR.S186649
Checked for plagiarism Yes
Review by Single anonymous peer review
Peer reviewer comments 3
Editor who approved publication: Dr Xueqiong Zhu
Jin Zhang,1,* Donghui Zhao,1,* Qingjun Li,2 Xiuluan Du,1 Yanxiang Liu,1 Xin Dai,1 Lianqing Hong3
1Department of Pathology, The Affiliated Suzhou Hospital of Nanjing Medical University, Suzhou, P.R. China; 2Department of Neurology, The Affiliated Suzhou Hospital of Nanjing Medical University, Suzhou, P.R. China; 3Department of Pathology, Nanjing Integrated Traditional Chinese and Western Medicine Hospital Affiliated with Nanjing University of Chinese Medicine, Nanjing, P.R. China
*These authors contributed equally to this work
Background: Gastric cancer (GC) is a common malignant tumor of the digestive system. In addition, GC metastasis is an extremely complicated process. A previous study has found that lysine-specific demethylase 1 (LSD1) is abnormal expression in a variety of cancers and its overexpression correlates with aggressive disease and poor outcome.
Methods: qRT-PCR and Western blot assays were used to assess the expression of LSD1 in GC tissue samples and cell lines. Colony formation assay, CCK-8 assay, scratch-wound assay and transwell invasion, were performed to determine the effect of LSD1 on cell proliferation and migration as well as invasion in GC.
Results: Our results show that LSD1 was up-regulated in GC tumor tissues and cell lines, and high expression level of LSD1 was found to be positively correlated with tumor size, lymph node metastasis and pathological grade. Moreover, LSD1 promoted cell proliferation, migration and invasion of GC. In addition, LSD1 regulated E-cadherin expression through demethylating H3K4me2, thereby promoting EMT in GC.
Conclusion: Our work indicated that LSD1 may be used as a potential target of gastric cancer.
Keywords: LSD1, EMT, E-cadherin, H3K4me2, gastric cancer
Introduction
Gastric cancer (GC) has been become the most common gastrointestinal cancer in the world.1,2 Although the surgical techniques and chemotherapy have been improved, the 5-year overall survival rate for patients with GC is still unsatisfactory.3,4 Like other cancers, GC tumorigenesis is a multistep process involving gene expression, epigenetic alterations as well as environmental factors.5 However, the molecular mechanisms of GC carcinogenesis needs to be investigated further.
Previous work has proven that lysine-specific demethylase 1 (LSD1) can remove mono- and dimethyl groups from histone 3 lysine 4 (H3K4) and histone 3 lysine 9 (H3K9), moreover, it can also target nonhistone proteins, such as DNMT1, E2F1 and p53.6–8 Although LSD1 has been reported to function as a corepressor of transcription factors, such as REST, it also has been reported to function as a coactivator of specific transcription factors by removing H3K9 methylation, indicating that its substrate specificity defines its biological outcome.9–11 LSD1 has been found an abnormal expression in a variety of cancers and its overexpression correlates with aggressive disease and poor outcome.12,13
Epithelial-mesenchymal transition (EMT) is a fundamental process involving embryonic development, scratch-wound healing and fibrotic disease,14,15 but multiple evidence has proven that EMT also plays a crucial role in the genesis, invasion and metastasis of various tumors,16,17 facilitating dissemination, therapeutic resistance, and relapse.18 EMT results in loss of cell–cell adhesion, cytoskeletal restructuring and abnormal apical basal polarity, thereby improving motility and invasion of the cancer cells.15,19 Moreover, EMT also enhances resistance to ionizing radiation, chemotherapy and hormone therapies.20
Previous work has indicated that LSD1 mediates global EMT-related epigenetic reprogramming in mouse hepatocytes21 and promotes the EMT, proliferation and migration in hepatocellular carcinoma and non-small cell lung cancer.22,23 Several EMT-inducing transcription factors (EMT-TFs), including slug, snail and zinc finger E-box-binding homeobox 1 (ZEB1) mediated EMT through regulation of E-cadherin (encoded by CDH1).24–26 In breast cancer, LSD1 interacts with snail and bind to epithelial gene promoters, such as CDH1, and LSD1 transcriptional silences CDH1 through mediating H3K4me2 demethylation.27 Moreover, LSD1 also interacts with slug to facilitate migration and invasion of breast cancer cell lines.28,29 However, the detailed effects of LSD1 in GC cells are unknown.
Here, functional analysis was conducted to demonstrate the biological effects of LSD1 on GC. We observed that wound closure of pcDNA3.1-LSD1- or LSD1 small interfering RNA (siRNA)-treated MKN45 and HGC-27 cells was obviously affected. Besides, the transwell invasion assay demonstrated that the LSD1 indeed participated in invasion process of GC cells. These results suggest that LSD1 is involved in GC cell proliferation, migration and invasion.
Materials and methods
Tumor specimens and cell culture
GC tissue specimens were collected from 64 patients (age, 34–62 years; 28 female, 36 male) at the The Affiliated Suzhou Hospital of Nanjing Medical University (Suzhou, P.R. China) from May 2012 to November 2015. Matched adjacent nontumor tissue was obtained from a segment of the resected specimens that was the farthest from the tumor (>5 cm). The study has been approved by the Medical Ethics Committees of the The Affiliated Suzhou Hospital of Nanjing Medical University. All patients have given written informed consent before surgery. The GC cell lines (MKN45 and HGC-27) were provided by the Cell Bank of the Shanghai Institute of Cell Biology (Chinese Academy of Sciences, Shanghai, P.R. China) and cultured in DMEM (Thermo Fisher Scientific, Waltham, MA, USA) containing 10% FBS (PAA Laboratories, Pasching, Austria), 1% penicillin and streptomycin and conventionally cultured in an incubator at 37°C, 5% CO2.
Western blotting analysis
Protein extracts from the tissue specimens and cells were prepared by radioimmunoprecipitation assay buffer (Beyotime Institute of Biotechnology, Jiangsu, People’s Republic of P.R. China). Protein concentration was measured using a BCA protein assay kit (Pierce, Waltham, MA, USA). 40 µg cell lysates were separated by 12% SDS-PAGE and transferred onto polyvinylidene fluoride membranes (PVDF, GE Healthcare UK Ltd, Little Chalfont, UK). After blocking with 5% skim milk in TBST, the membranes were then incubated with the following primary antibodies overnight at 4°C: anti-LSD1 (cat. no. ab17721), anti-H3K4me2 (cat. no. ab7766), anti-E-cadherin (cat. no. ab15148), anti-N-cadherin (cat. no. ab76057) and anti-β-actin (cat. no. ab8226) (all purchased from Abcam, Cambridge, MA, USA and used at a 1:300 dilution). After washing with TBST three times, membranes were incubated with horseradish peroxidase-conjugated anti-rabbit (cat. no. sc-2385) or anti-mouse (cat. no. sc-2375) secondary antibodies (Santa Cruz Biotechnology Inc., Dallas, TX, USA) at room temperature for 1 hour. Finally, the blots were visualized using an enhanced chemiluminescence kit (EMD Millipore, Billerica, MA, USA).
Reverse transcription-quantitative PCR (RT-qPCR) analysis
Total RNA was extracted from tissue specimens and cells using TRIzol reagent (Thermo Fisher Scientific) according to the manufacturer’s instructions. Following isolation, 2 µg RNA was used to synthesize single-stranded complementary DNA (cDNA) using EasyScript First-Strand cDNA Synthesis SuperMix kit (Transgen Biotech, Beijing, P.R. China) following the manufacturer’s protocol. Subsequently, RT-qPCR was carried out using a SYBR Green PCR kit (Thermo Fisher Scientific). The qPCR was performed using the following parameters: 95°C, 10 minutes; 35 cycles, 95°C, 10 seconds; 58°C, 20 seconds; 72°C, 30 seconds; and 72°C, 5 minutes. GAPDH was used as internal control. Three independent experiments were performed in duplicate.
Colony formation assay
For the colony formation assay, ~5×10³ transfected MKN45 or HGC-27 cells were seeded into 6-well plates with serum-free DMEM. Culture medium was replaced every 3 days. After 14 days, cells were washed with PBS three times at room temperature and fixed with 4% paraformaldehyde at room temperature for 15 minutes and stained with 0.1% crystal violet at room temperature for 15 minutes. The number of colonies was counted under a light microscope. Three independent experiments were performed in duplicate.
Cell-counting kit (CCK-8) assay
The cell proliferation reagent CCK-8 (Beyotime Institute of Biotechnology, Jiangsu, P.R. China) was used to determine the effect of LSD1 on cell growth. 2×10³ transfected MKN45 or HGC-27 cells were seeded into 96-well microtiter plates (Corning Inc., Corning, NY, USA) with 200 µL DMEM, 20 µL CCK-8 was added to each well according to the manufacturer’s instructions. Following incubation at 37°C with 5% CO2 for 1 hour, the absorbance of each well at 450 nm was measured. Three independent experiments were performed in duplicate.
Scratch-wound assay
For the scratch-wound assay, ~5×10⁵ transfected MKN45 or HGC-27 cells were placed into 24-well plates and cultured with until confluent. The cell monolayers were scratched by a 200 µL pipette tip. The cells were then washed with PBS three times to remove cell debris and cultured with serum-free DMEM. After 0 hour and 48 hours incubation at 37°C, the migration distance of the cells was observed under a light microscope (magnification: ×20; Olympus Corporation, Tokyo, Japan). Three independent experiments were performed in duplicate.
Transwell invasion assay
A total of 3×10⁴ transfected MKN45 or HGC-27 cells were suspended in 500 µL serum-free medium and placed in the top chambers. 500 µL DMEM medium containing 10% FBS was added into the bottom chambers. Cells were incubated for 24 hours at 37°C with 5% CO2. The cells on the surface of chambers were removed using a cotton swab and the invaded cells were stained with 0.1% crystal violet at room temperature for 20 minutes, and observed using a light microscope (magnification: ×20; Olympus Corporation, Tokyo, Japan). The numbers of invaded cells were calculated from six randomly selected fields. Three independent experiments were performed in duplicate.
Dual-luciferase reporter assay
The promoter region of CDH1 were synthesized and inserted downstream of the luciferase gene in the pGL3-control (Promega Corporation, Fitchburg, WI, USA) vector. Prior to transfection, 2×10⁵ cells were seeded in 24-well plates. Then, 200 ng of pGL3-CHD1 and 50 ng of Renilla (Promega Corporation) were cotransfected with 2 µg pcDNA3.1-LSD1 plasmid or 40 nM LSD1 siRNA using Lipofectamine® 2000 (Invitrogen; Thermo Fisher Scientific) following the manufacturer’s instructions. After transfection for 24 hours, the dual-luciferase assay system (Promega Corporation) was used to determine luciferase activity. The firefly luciferase activity in each well was normalized to that of the Renilla luciferase. Three independent experiments were performed in duplicate.
Chromatin immunoprecipitation (ChIP) and quantitative chromatin immunoprecipitation (qChIP) assays
ChIP and qChIP assays were performed using an EZ-ChIP kit (EMD Millipore) following the manufacturer’s instructions. In brief, 4×10⁷ MKN45 cells were collected and fixed with 1% formaldehyde (Beyotime Institute of Biotechnology) at 37°C for 30 minutes. Following lysate with lysis buffer contained with RNase A (EMD Millipore) at 4°C for 30 minutes, lysis was sonicated (20 kHz; amplitude, 40%; 30 cycles, 1 second on and 1 second off; 4°C) to break cross-linked chromatin into 200-bp–1,000-bp fragments. Subsequently, 2 µg anti-H3K4me2 antibody and 2 µg anti-IgG antibody were added into lysis, respectively. After incubation at 4°C overnight, antibody-bind DNA fragment was purified using 50 µL protein G agarose beads at 4°C for 1 hour. The beads were then washed with 1 mL low salt immune complex wash buffer, high salt immune complex wash buffer, LiCl immune complex wash buffer, and TE buffer (EMD Millipore) at 4°C. DNA was isolated from the immunoprecipitates using a DNA kit (Tiangen Biotech Co. Ltd, Beijing, P.R. China) and quantified using RT-qPCR analysis with the CDH1 primer pairs: forward 5’-AGGAGGCTGATAGAGGAGAA-3’ and reverse 5’-AGGTGCTGGACATTGAAGAT-3’.
Statistical analyses
Data are presented as the means ± SD. All analyses were performed using SPSS v. 18.0 (SPSS Inc., Chicago, IL, USA). For comparisons of two groups, a Student’s t-test was used. For comparisons of multiple groups, one-way ANOVA followed by Tukey’s test was used. The relationships between LSD1 expression and clinicopathological characteristics were assessed using chi-squared test. P<0.05 was considered a statistically significant difference.
Ethics approval and consent to participate
The Affiliated Suzhou Hospital of Nanjing Medical University approved the present study. All patients provided written informed consent.
Results
LSD1 is high expression in GC tissues and cell lines
To investigate whether LSD1 plays roles in GC, we first performed qRT-PCR and Western blotting analyses to determine the expression of LSD1 in GC tissues and adjacent normal tissues. To our surprise, the result indicated that the expression of LSD1 was elevated in GC tissues compared with that of the adjacent normal tissues (Figure 1A). Subsequently, we analyzed the relationship of LSD1 expression and pathological characteristics of GC. As shown in Table 1, high expression of LSD1 was positively associated with high-grade GC, tumor size and lymphatic invasion (Table 1, P<0.05). However, there was no statistical difference in terms of intestinal and diffuse types according to the Lauren classification (Table 1, P=0.397). Our findings suggested that LSD1 played an important role in tumor growth and metastasis in GC. Subsequently, we determined the expression of LSD1 in two GC cell lines (MKN-45 and HGC-27), and normal gastric cell line (GES-1) as control. As shown in Figure 1B, both mRNA and protein levels of LSD1 were high expression in GC cell lines, MKN-45 and HGC-27, compared with that in GES-1. Furthermore, we also found that high expression of LSD1 predicted a poor prognosis of GC (Figure 1C, P<0.05). Together, our works showed that the LSD1 was upregulated in GC and positively associated with the tumor aggressiveness.
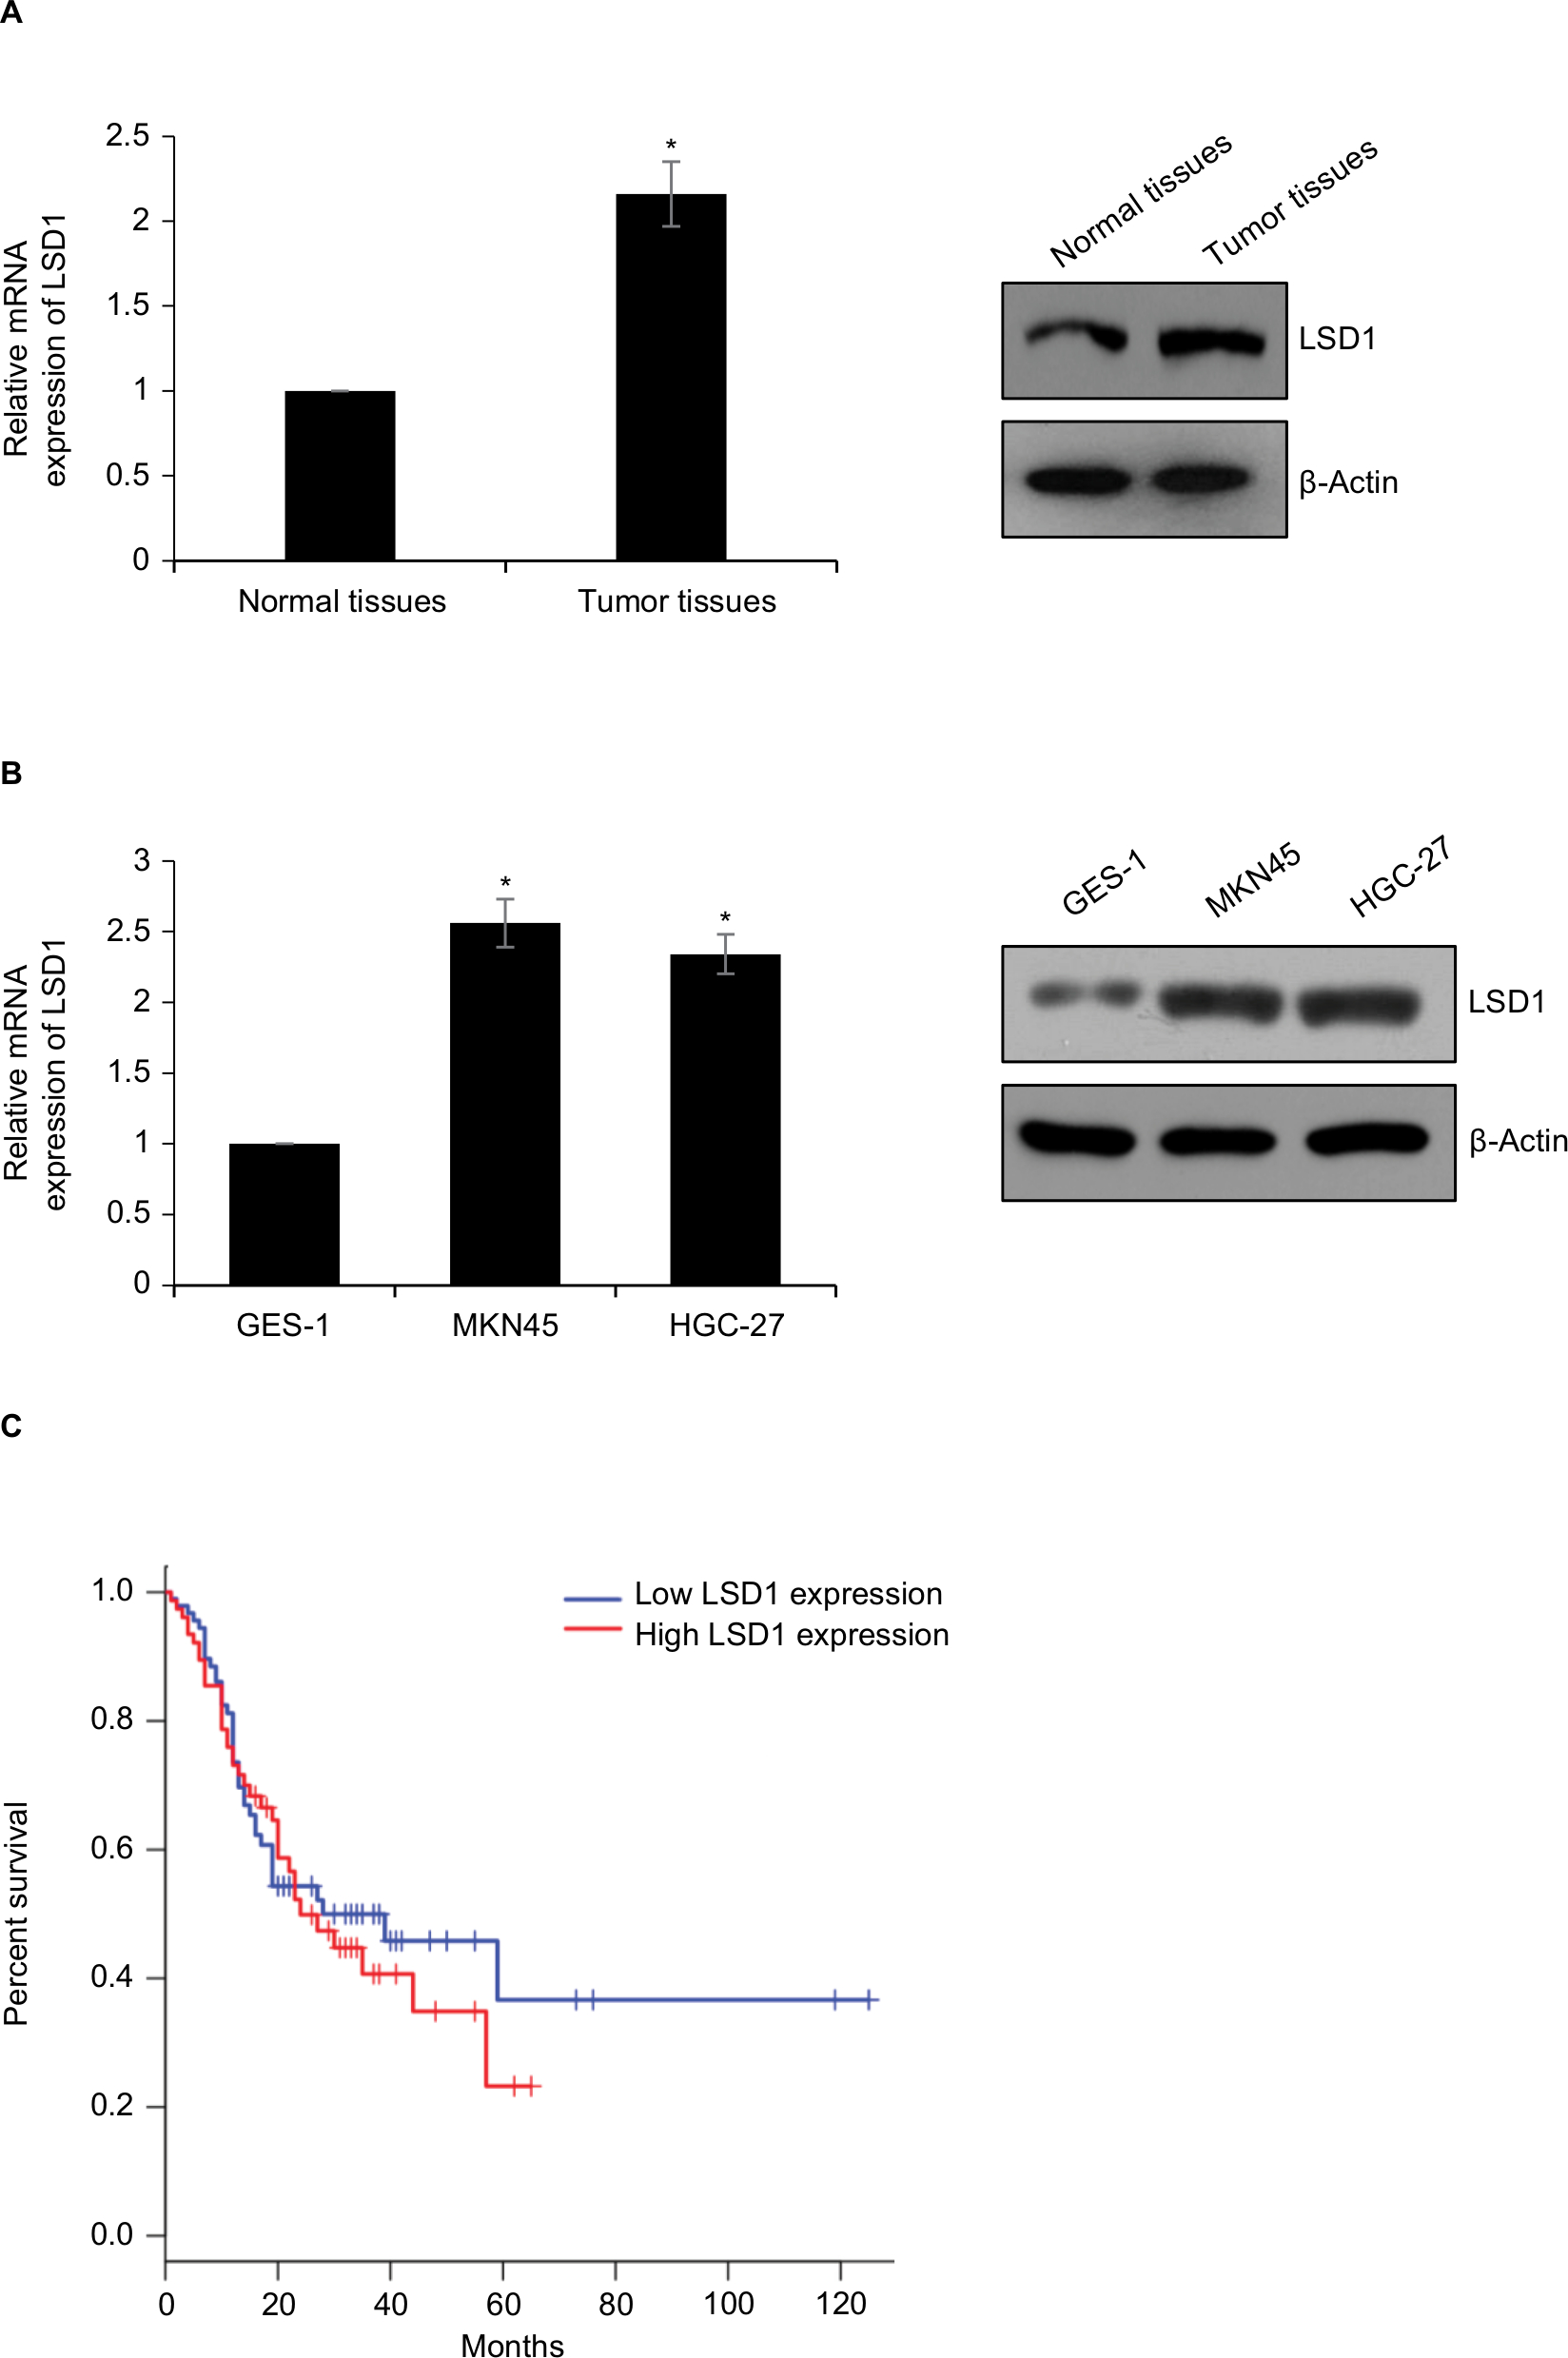 | Figure 1 LSD1 is high expression in GC tissues and cell lines Notes: (A) Expression of LSD1 in GC and adjacent normal tissues by RT-qPCR and Western blotting analyses, *P<0.05, vs normal tissues. (B) Expression of LSD1 in GC cell lines MKN-45 and HGC-27 as well as normal gastric cell line GES-1 by RT-qPCR and Western blotting analyses, *P<0.05, vs GES-1. (C) Kaplan–Meier followed by log-rank analysis was used to analyze the correlation of LSD1 expression and survival rate of GC patients, *P<0.05. Abbreviations: LSD1, lysine-specific demethylase 1; GC, gastric cancer; RT-qPCR, reverse transcription-quantitative PCR. |
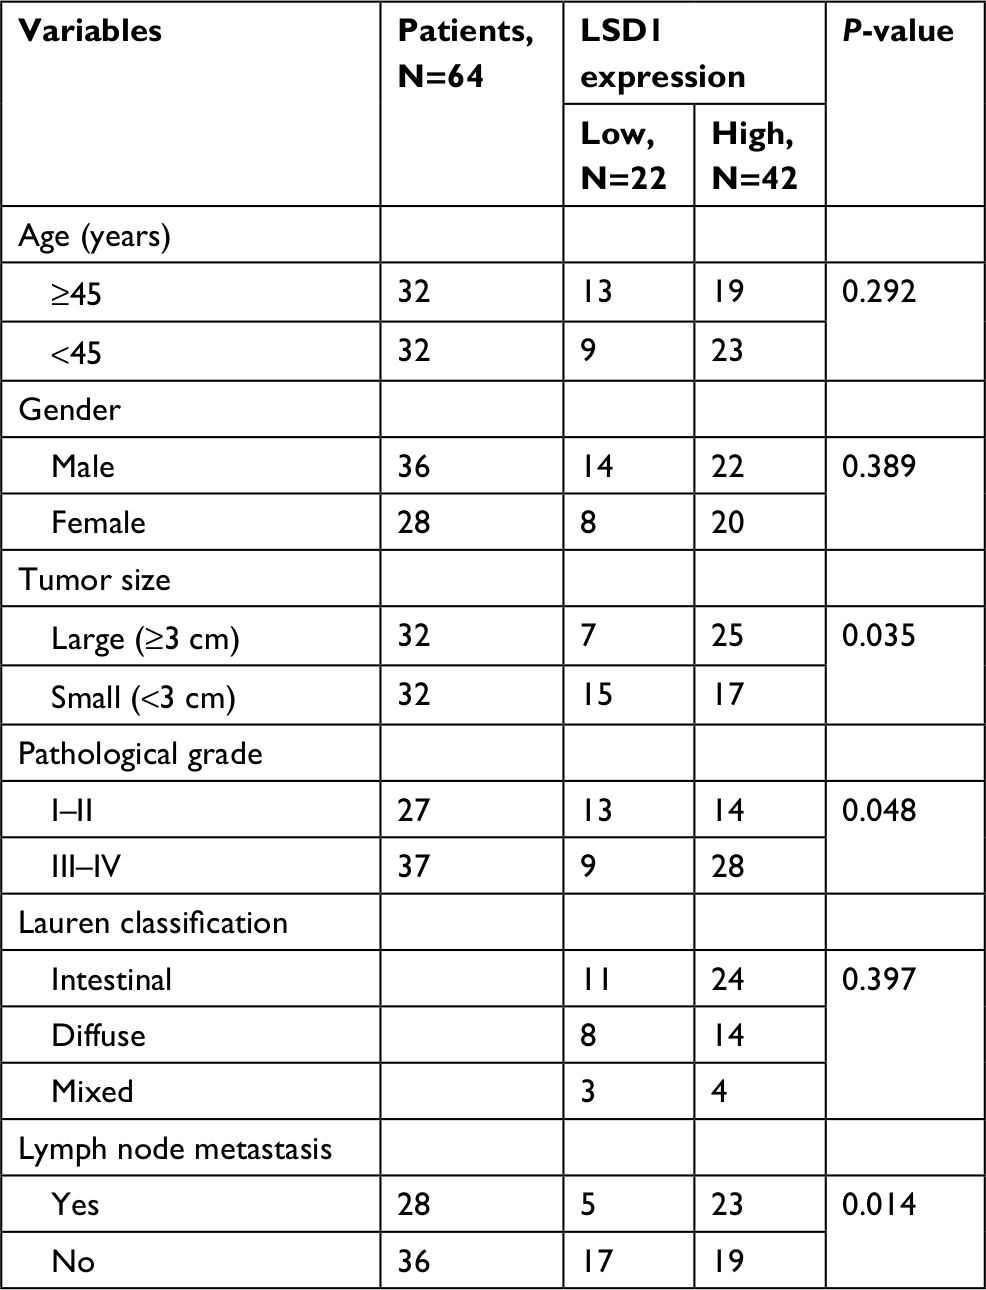 | Table 1 Clinic pathologic variables in 64 GC patients Abbreviations: GC, gastric cancer; LSD1, lysine-specific demethylase 1. |
Upregulation of LSD1 promotes GC cell proliferation in vitro
We overexpressed or knocked down LSD1 using pcDNA3.1-LSD1 plasmid or LSD1 siRNAs in MKN-45 and HGC-27 cells, respectively. RT-qPCR and Western blot analyses were performed to confirm the transfection efficiency. As shown in Figure 2A, B, following transfection, LSD1 levels were significantly increased or reduced in the pcDNA3.1-LSD1 plasmid or LSD1 siRNAs group compared with indicated control groups (Figure 2A, B). Subsequently, we performed colony formation assay and CCK-8 assay to examine the effect of LSD1 on cell proliferation. The result of colony formation assay indicated that upregulation of LSD1 resulted in an elevated number of colonies, whereas LSD1 inhibition led to a reduction of the colonies (Figure 2C). Moreover, CCK-8 assay indicated that ectopic expression of LSD1 improved the proliferation rate of the MKN-45 and HGC-27cells; however, inhibition of LSD1 decreased the proliferation rate of the MKN-45 and HGC-27cells, compared to the control group (Figure 2D). According to this data, it is indicated that LSD1 served as a tumor activator and facilitated GC cell proliferation.
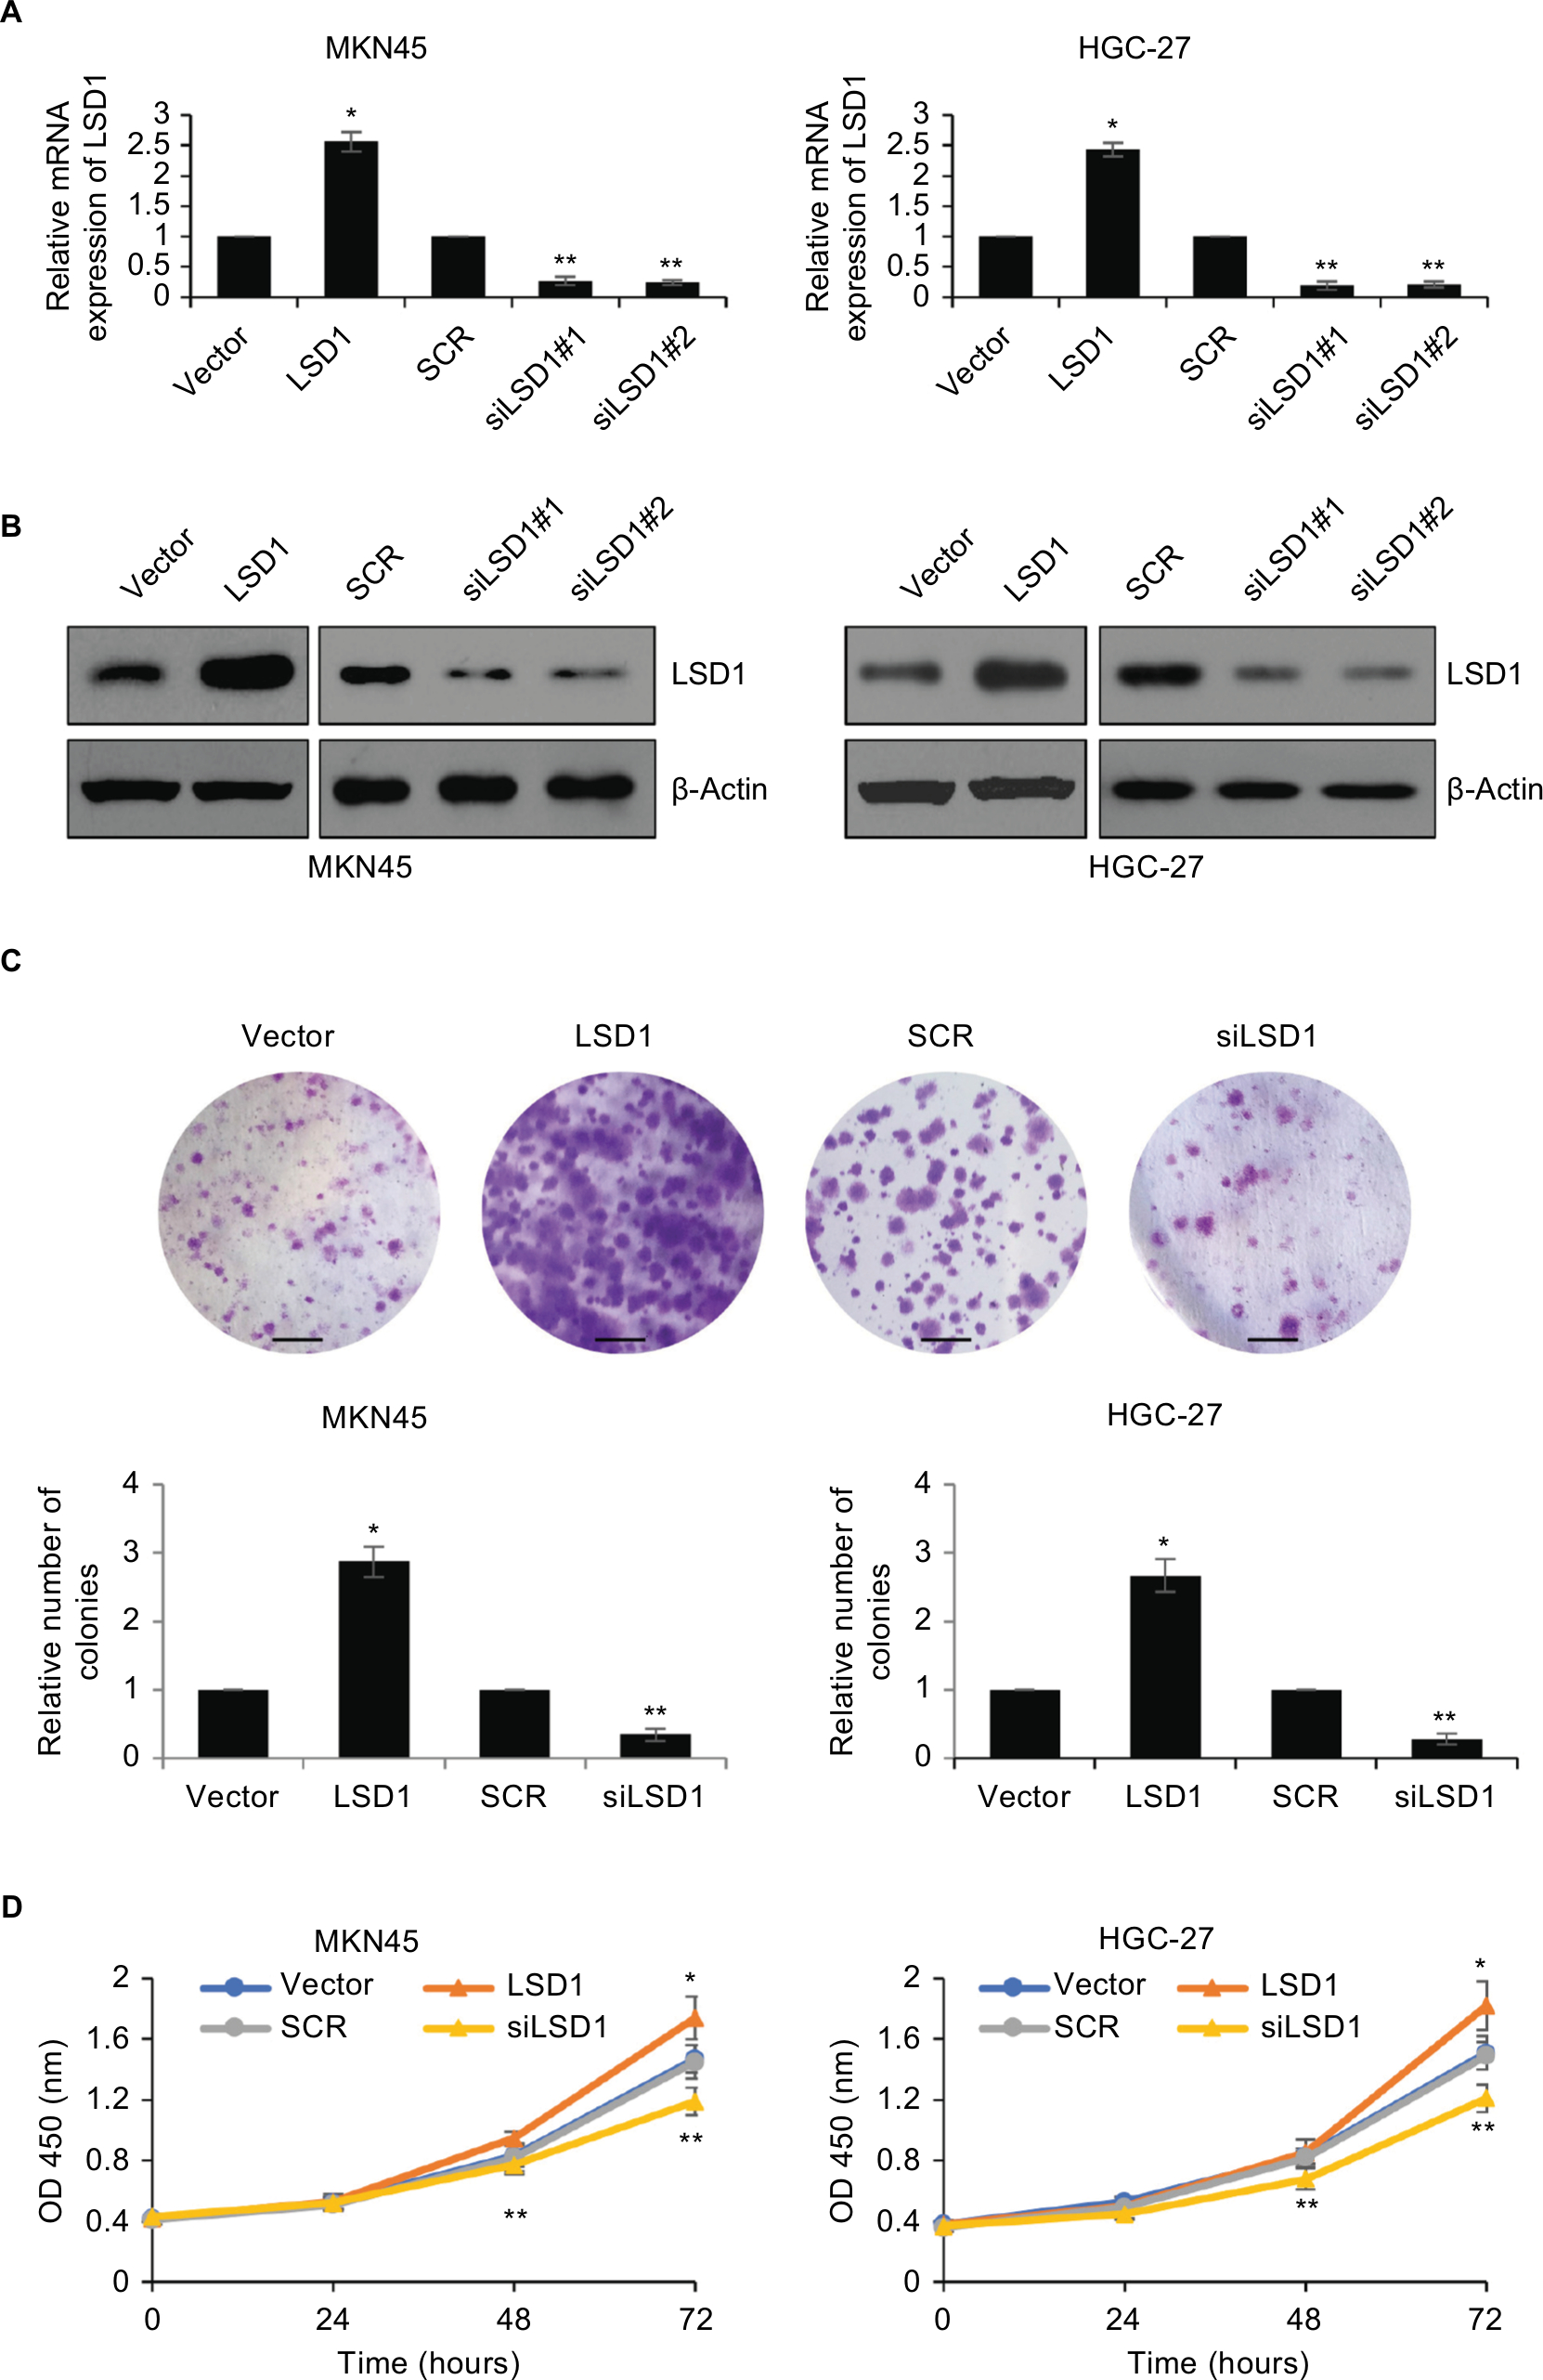 | Figure 2 Upregulation of LSD1 promotes GC cell proliferation in vitro. Notes: (A) and (B) LSD1 was overexpressed or knocked down in MKN-45 or HGC-27 cells. After transfection for 48 hours, the expression of LSD1 was determined using RT-qPCR or western blotting analyses. *P<0.05, vs vector, **P<0.05, vs SCR. (C) Colony formation assay was performed to determine the effects of LSD1 on cell proliferation. *P<0.05, vs vector, **P<0.05, vs SCR. Scar bar =250 μm. (D) CCK-8 assay was performed to determine the effects of LSD1 on cell proliferation. *P<0.05, vs vector, **P<0.05, vs SCR. Abbreviations: CCK-8, cell-counting kit-8; GC, gastric cancer; LSD1, lysine-specific demethylase 1. |
Upregulation of LSD1 promotes GC cell migration and invasion in vitro
Because high expression of LSD1 was positively associated with lymphatic invasion, we next performed scratch-wound and transwell invasion assay to determine the roles of LSD1 in cell migration and invasion. The results of scratch-wound assay suggested that LSD1-expressing MKN45 cells migrated to 95.1%±4.1% of the wounded area, while the vector control groups migrated to 63.5%±2.3% of the area. However, LSD1-depletion MKN45 cells migrated to 23.4%±3.1% of the wounded area, whereas the SCR control groups migrated to 67.3%±3.6% of the area (Figure 3A). The similar result was observed in HGC-27 cells (Figure 3A). Furthermore, the transwell invasion assay revealed that the number of invaded cells was significantly increased in the LSD1-expressing MKN45 and HGC-27 cells compared with the vector control group. Whereas the number of invaded cells was significantly decreased in the LSD1-depletion group, compared with the SCR control group (Figure 3B). Our present findings illustrated that LSD1 facilitated cell migration and invasion in GC.
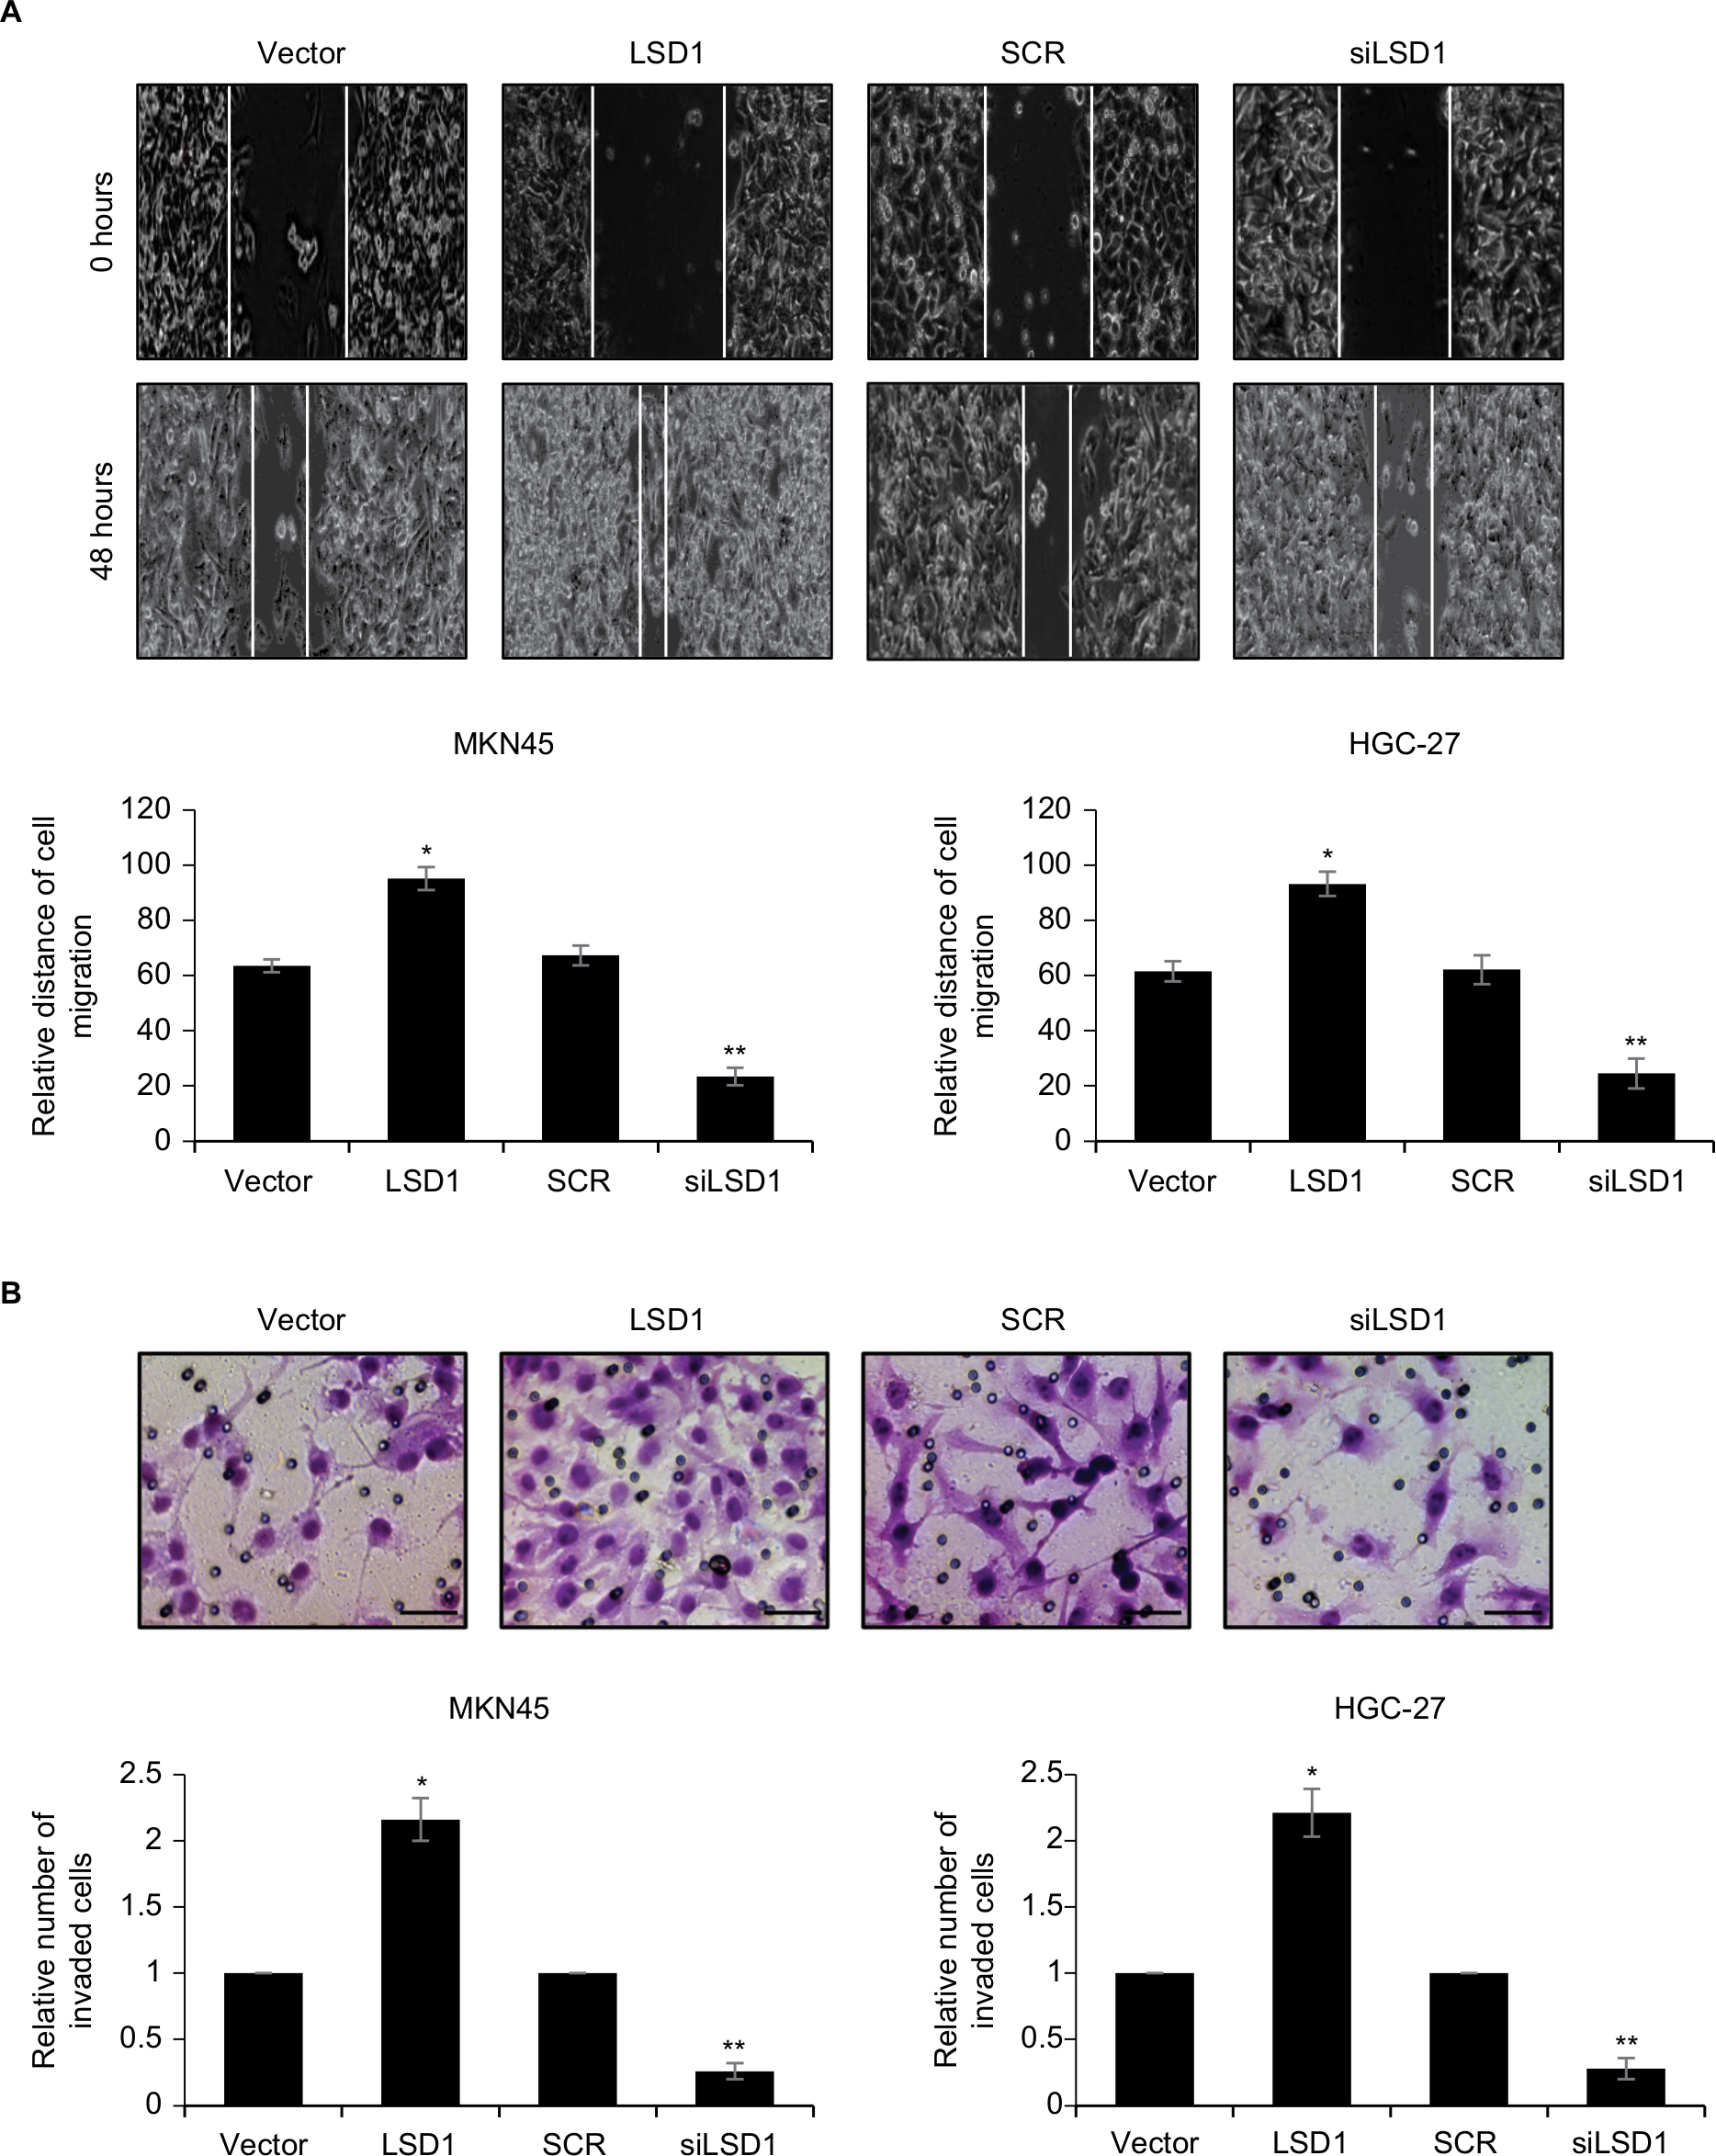 | Figure 3 Upregulation of LSD1 promotes GC cell migration and invasion in vitro. Notes: (A) LSD1 was overexpressed or knocked down in MKN-45 and HGC-27 cells. Representative images were captured at 0 and 24 hours to assess the cell migration into the wound space (magnification ×20). *P<0.05, vs vector, **P<0.05, vs SCR. (B) MKN-45 and HGC-27 cells were transfected with pcDNA3.1-LSD1 plasmid or LSD1 siRNA, respectively. After transfection for 48 hours, Transwell invasion assay was performed. Representative images of the Transwell invasion assay following incubation for 24 hours (magnification ×20). Scar bar =250 μm. *P<0.05, vs vector, **P<0.05, vs SCR. Abbreviations: GC, gastric cancer; LSD1, lysine-specific demethylase 1. |
LSD1 induces EMT of GC cell lines
EMT has been found to play critical roles in cancer metastasis.19,24,30 Loss of E-cadherin and gain of N-cadherin are a well-known hallmark of EMT. To investigate what role, if any, LSD1 might play in the EMT, the epithelial or mesenchymal marker changes in LSD1-expressing or depletion MKN-45 cells were assessed by means of RT-qPCR and Western blotting, respectively. As shown in Figure 4A, overexpression of LSD1 increased the expression of N-cadherin and decreased the expression of E-cadherin in mRNA and protein level (Figure 4A, B). However, inhibition of LSD1 decreased the expression of N-cadherin and increased the expression of E-cadherin in mRNA and protein level (Figure 4A, B). Taken together, these results reveal that LSD1 play an important role in the EMT program.
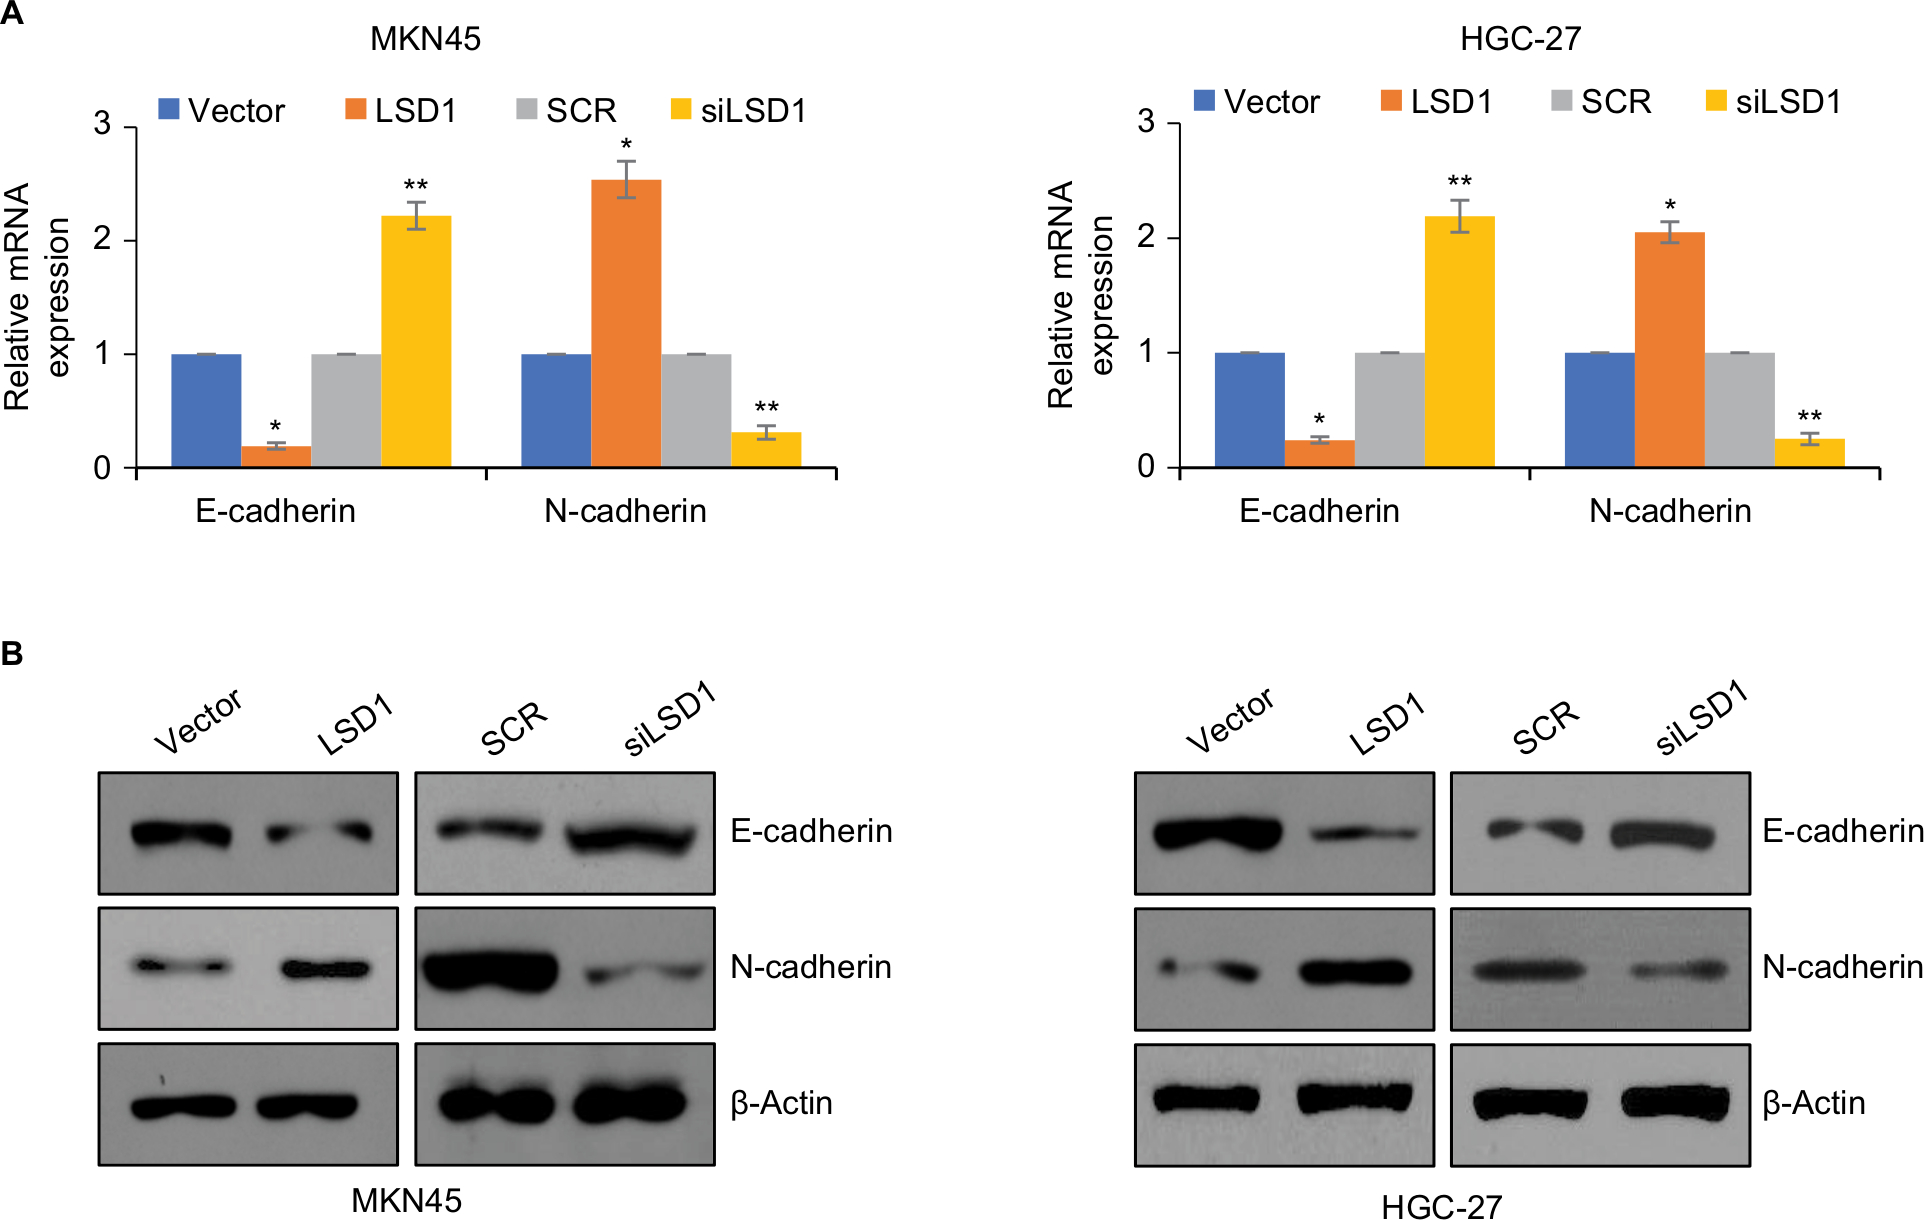 | Figure 4 LSD1 induces EMT of GC cell lines. Notes: (A) and (B) LSD1 was overexpressed or knocked down in MKN-45 or HGC-27 cells, the expression of E-cadherin was detected using RT-qPCR and western blotting assay. *P<0.05, vs vector, **P<0.05, vs SCR. Abbreviations: EMT, epithelial-mesenchymal transition; GC, gastric cancer; LSD1, lysine-specific demethylase 1. |
LSD1 transcriptionally regulates E-cadherin through demethylation of H3K4me2 in GC cells
Previous work has suggested that LSD1 interacts with snail and binds to epithelial gene promoters, such as CDH1, and LSD1 transcriptional silences CDH1 through mediating H3K4me2 demethylation.27 In order to decipher whether LSD1 promoted EMT in GC through regulation of E-cadherin expression, we performed ChIP and qChIP assays as well as dual luciferase reporter assays. As shown in Figure 5A, the fold of enrichment of H3K4me2 on CDH1 was significantly decreased in LSD1-expressing MKN45 cells; however, the fold of enrichment of H3K4me2 on CDH1 was significantly increased in LSD1-depletion MKN-45 cells, compared with indicated control groups (Figure 5A). A similar result was observed in HGC-27 cells (Figure 5A). The result of dual luciferase reporter assays showed that ectopic expression of LSD1 resulted in a reduced luciferase activity, whereas inhibition of LSD1 led to an elevated luciferase activity in MKN45 and HGC-27 cells (Figure 5B). To verify further whether LSD1 regulated E-cadherin expression, we used GSK-LSD1 2HCl, an LSD1 specific inhibitor, to treatment GC cells and detected the expression of E-cadherin. As shown in Figure 5C, D, the expression of E-cadherin was increased while cells treated with GSK-LSD1 2HCl, indicating that the expression of E-cadherin in GC was specifically regulated by LSD1 (Figure 5C, D). Taken together, these results reveal that LSD1 transcriptionally regulates E-cadherin through demethylation of H3K4me2 in GC cells.
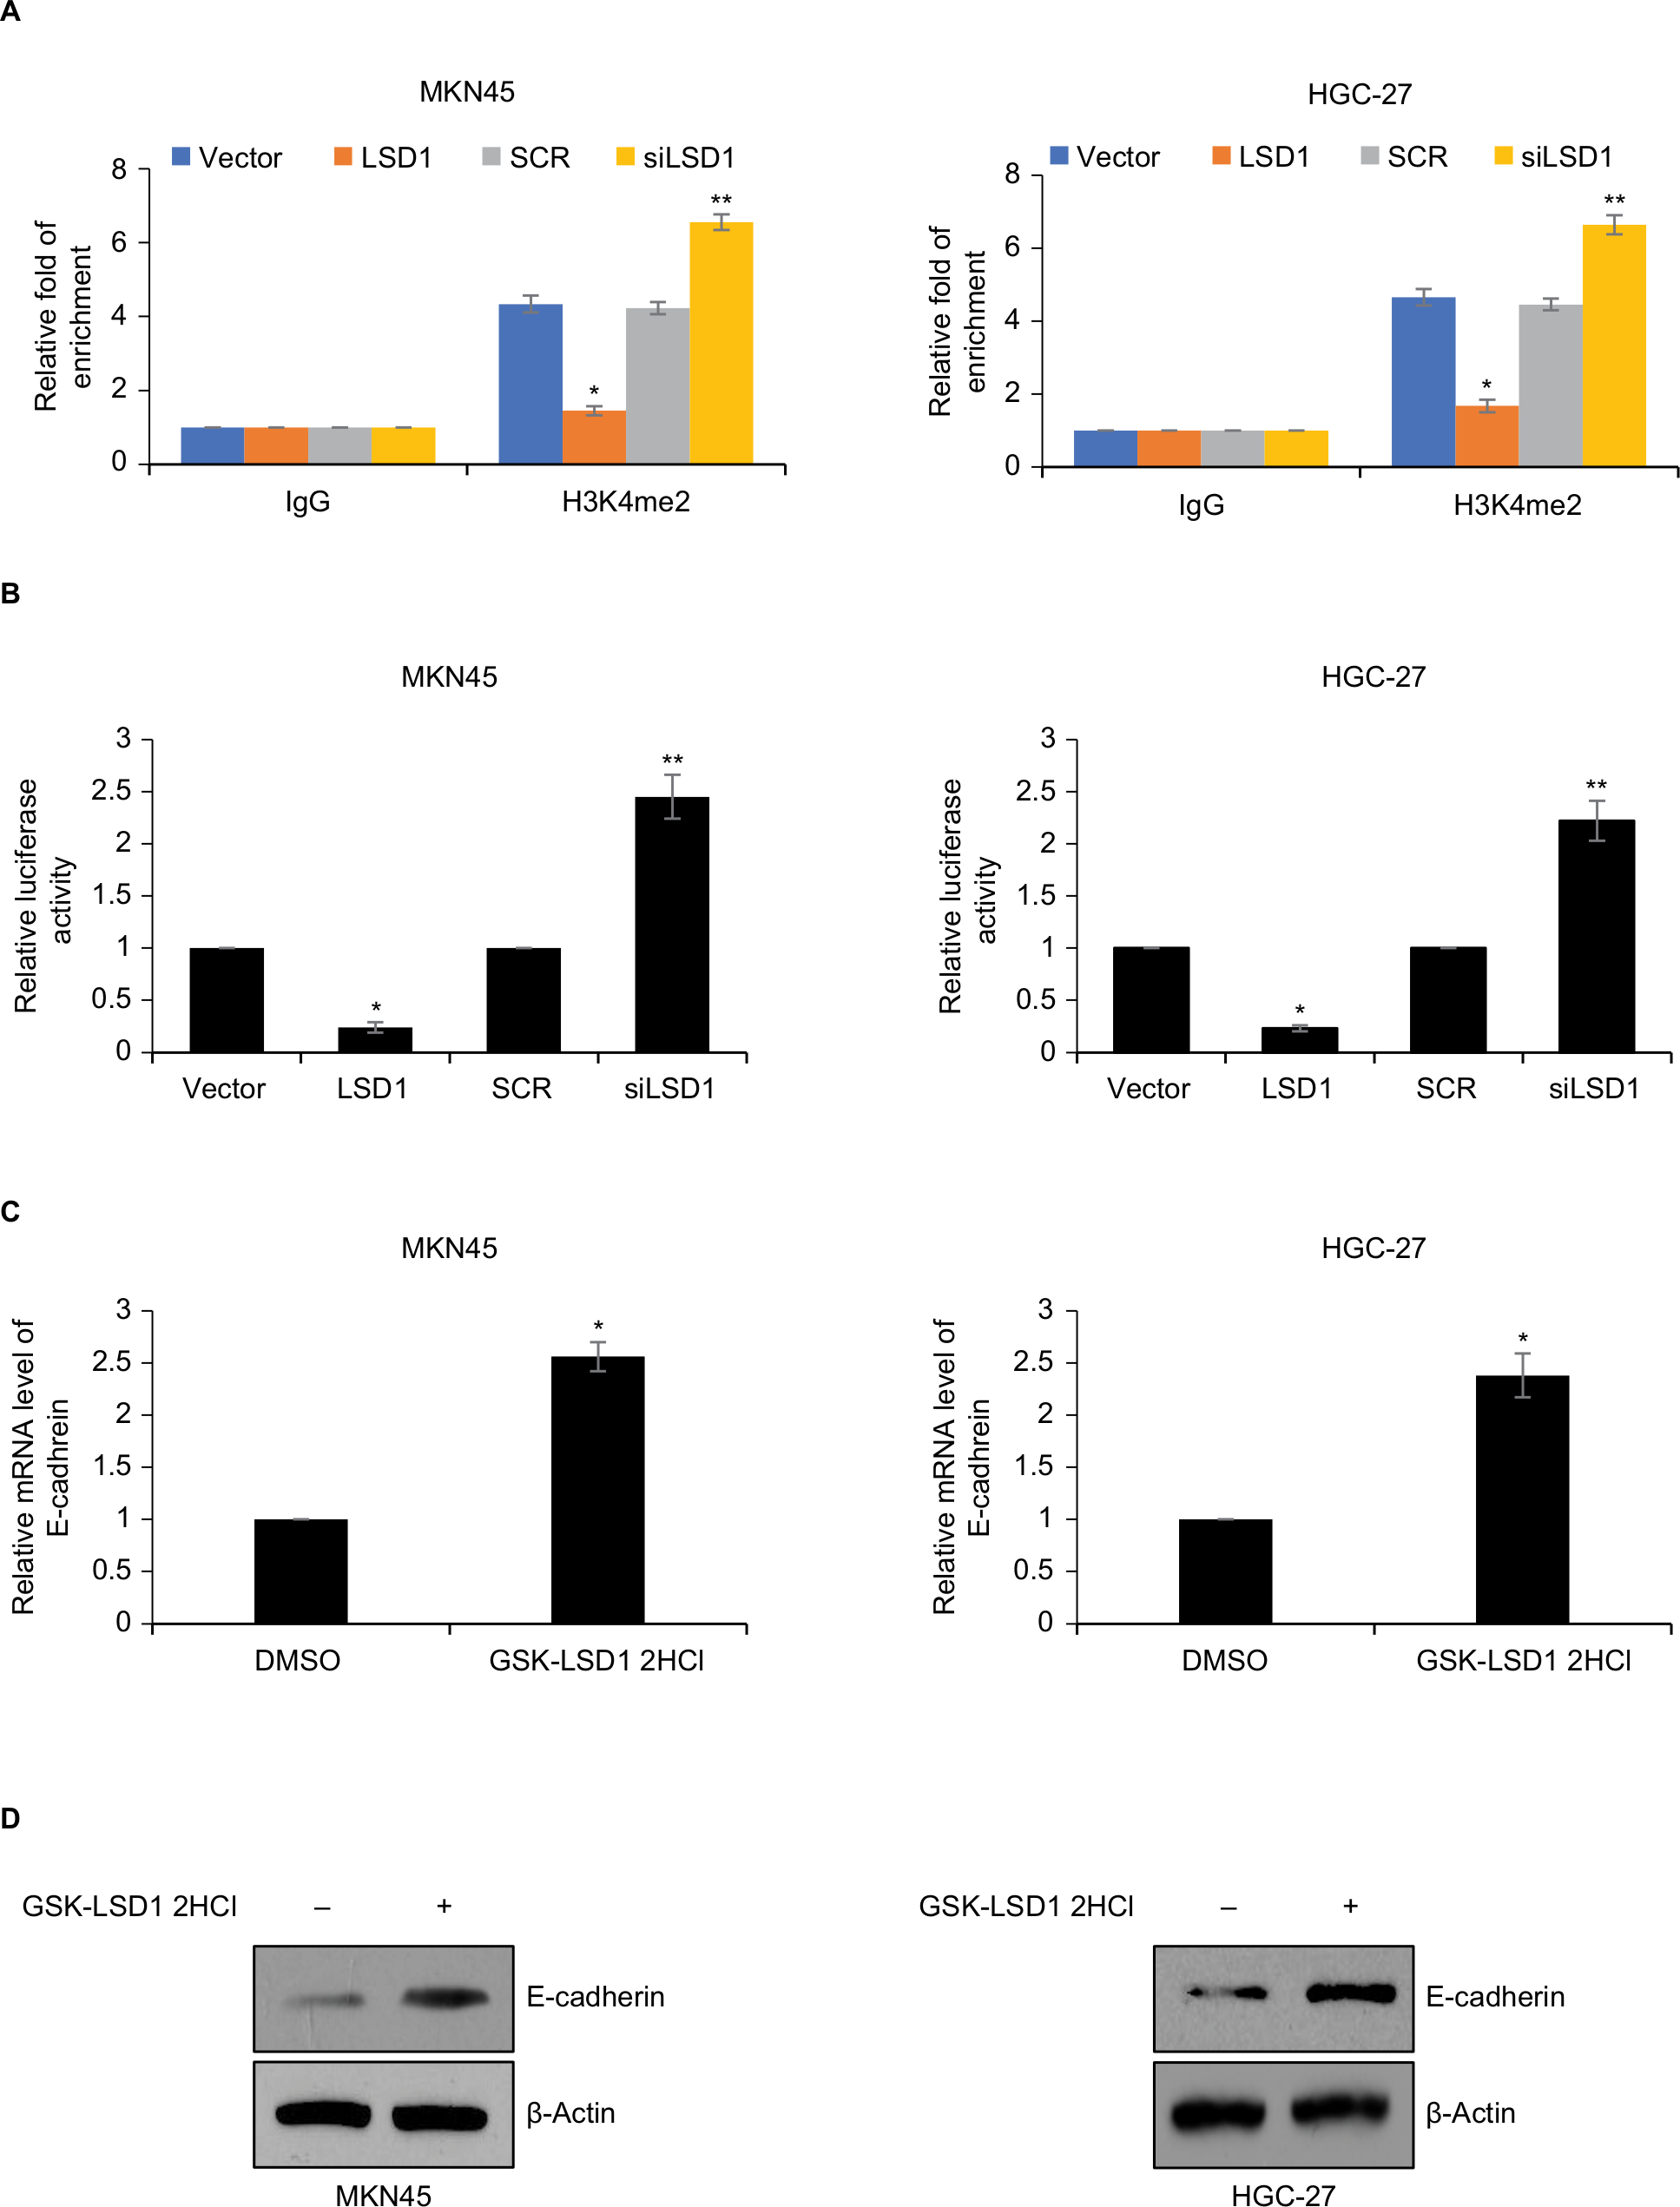 | Figure 5 LSD1 transcriptionally regulates E-cadherin through demethylation of H3K4me2 in GC cells. Notes: (A) LSD1 was overexpressed or knocked down in MKN-45 or HGC-27 cells, ChIP and qChIP assays were performed using anti-H3K4me2 or anti-IgG antibodies. *P<0.05, vs vector, **P<0.05, vs SCR. (B) LSD1 was overexpressed or knocked down in MKN-45 or HGC-27 cells, dual luciferase reporter assays were performed. *P<0.05, vs vector, **P<0.05, vs SCR. (C) and (D) MKN-45 or HGC-27 cells were treated with DMSO or 5 nM GSK-LSD1 2HCl. After incubation for 48 hours, the expression of E-cadherin was detected using RT-qPCR and Western blotting analyses. *P<0.05, vs vector, **P<0.05, vs SCR. Abbreviations: ChIP, chromatin immunoprecipitation; GC, gastric cancer; LSD1, lysine-specific demethylase 1; qChIP, quantitative chromatin immunoprecipitation. |
Discussion
Previous studies have found that LSD1 expression levels can act as biomarkers for the identification of patients with more aggressive neuroblastoma, lung cancers and prostate cancer, as well as lung cancers.13,22,31 Moreover, LSD1 inhibition with siRNAs led to the suppression of proliferation of various lung and bladder cancer cell lines32 indicating the LSD1 inhibition is a unique approach to the generation of a potent antitumor therapy. However, the detailed mechanism of LSD1 in GC remains unclear.
In this study, we found that LSD1 was upregulated in GC tumor tissues and cell lines, moreover, LSD1 expression level was positively associated with tumor size, lymph node metastasis and pathological grade. Previous report has found that LSD1 is upregulated in MKN-28 cells, and regulated GC proliferation and apoptosis through regulation of the expression of TGFb1, VEGF, Bcl-2, b-catenin, p-ERK and p-Smad 2/3.33 Consistent with this work, our findings demonstrated that LSD1 promoted cell proliferation, migration and invasion in MKN-45 and HGC-27 cells.
The EMT has been reported to play a crucial role in gastric tumorigenesis, detaching abnormally proliferating cells from the original epithelial tissues.34,35 However, the specific molecular mechanisms of EMT have not been absolutely elucidated. So, we further detailed the effects of LSD1 on EMT of GC. We found that ectopic expression of LSD1 significantly increased N-cadherin expression and decreased E-cadherin expression; however, LSD1 inhibition led to a converse result, suggesting that LSD1 promoted EMT in GC. Moreover, previous study has found that LSD1 interacts with snail and bind to epithelial gene promoters, such as CDH1, and LSD1 transcriptional silences CDH1 through mediating H3K4me2 demethylation in breast cancer.27,36 We further verified whether LSD1 regulated E-cadherin expression through demethylation of H3K4me2. The result of ChIP and qChIP assays as well as dual luciferase reporter assays illustrated that LSD1 also regulated E-cadherin expression through demethylation of H3K4me2.
However, there are still some limitations. GC is a heterogeneous disease in terms of genetic and epigenetic alterations. Therefore, intratumoral difference of messenger RNA expression may be found within the same tumor. Moreover, it is better to perform in vivo experiments to validate the effects of pharmacological LSD1 inhibition in the mice bearing GCs.
In summary, our results suggest LSD1 regulates cell proliferation, migration and invasion of GC cells. Moreover, LSD1 mediates EMT in GC via demethylation of H3K4me2. Our study suggests that LSD1 may serve as a potential target of GC.
Availability of data and materials
The data sets used during the present study are available from the corresponding author upon reasonable request.
Acknowledgments
Jiangsu Youth Natural Science Fund Project (BK20170385); Suzhou Citizen Life Science and Technology Plan Project (SYS201784); Suzhou High-tech Zone Medical and Health Science and Technology Plan Project (2016Q012); China Postdoctoral Science Special Foundation (2012T50895); and China Postdoctoral Science Foundation (201150M1575).
Disclosure
The authors report no conflicts of interest in this work.
References
Jemal A, Bray F, Center MM, Ferlay J, Ward E, Forman D. Global cancer statistics. CA Cancer J Clin. 2011;61(2):69–90. | ||
Siegel R, Ma J, Zou Z, Jemal A. Cancer statistics, 2014. CA Cancer J Clin. 2014;64(1):9–29. | ||
Siegel R, Naishadham D, Jemal A. Cancer statistics, 2013. CA Cancer J Clin. 2013;63(1):11–30. | ||
Chen W, Zheng R, Baade PD, et al. Cancer statistics in China, 2015. CA Cancer J Clin. 2016;66(2):115–132. | ||
Jang BG, Kim WH. Molecular pathology of gastric carcinoma. Pathobiology. 2011;78(6):302–310. | ||
Shi Y, Lan F, Matson C, et al. Histone demethylation mediated by the nuclear amine oxidase homolog LSD1. Cell. 2004;119(7):941–953. | ||
Lan F, Nottke AC, Shi Y. Mechanisms involved in the regulation of histone lysine demethylases. Curr Opin Cell Biol. 2008;20(3):316–325. | ||
Nicholson TB, Chen T. LSD1 demethylates histone and non-histone proteins. Epigenetics. 2009;4(3):129–132. | ||
Kahl P, Gullotti L, Heukamp LC, et al. Androgen receptor coactivators lysine-specific histone demethylase 1 and four and a half LIM domain protein 2 predict risk of prostate cancer recurrence. Cancer Res. 2006;66(23):11341–11347. | ||
Metzger E, Wissmann M, Yin N, et al. LSD1 demethylates repressive histone marks to promote androgen-receptor-dependent transcription. Nature. 2005;437(7057):436–439. | ||
Wang J, Scully K, Zhu X, et al. Opposing LSD1 complexes function in developmental gene activation and repression programmes. Nature. 2007;446(7138):882–887. | ||
Amente S, Lania L, Majello B. The histone LSD1 demethylase in stemness and cancer transcription programs. Biochim Biophys Acta. 2013;1829(10):981–986. | ||
Schulte JH, Lim S, Schramm A, et al. Lysine-specific demethylase 1 is strongly expressed in poorly differentiated neuroblastoma: implications for therapy. Cancer Res. 2009;69(5):2065–2071. | ||
Lee JM, Dedhar S, Kalluri R, Thompson EW. The epithelial-mesenchymal transition: new insights in signaling, development, and disease. J Cell Biol. 2006;172(7):973–981. | ||
Lamouille S, Xu J, Derynck R. Molecular mechanisms of epithelial-mesenchymal transition. Nat Rev Mol Cell Biol. 2014;15(3):178–196. | ||
Montemayor-Garcia C, Hardin H, Guo Z, et al. The role of epithelial mesenchymal transition markers in thyroid carcinoma progression. Endocr Pathol. 2013;24(4):206–212. | ||
Liang Q, Li L, Zhang J, et al. CDK5 is essential for TGF-β1-induced epithelial-mesenchymal transition and breast cancer progression. Sci Rep. 2013;3(1):2932. | ||
De Craene B, Berx G. Regulatory networks defining EMT during cancer initiation and progression. Nat Rev Cancer. 2013;13(2):97–110. | ||
Thiery JP, Acloque H, Huang RY, Nieto MA. Epithelial-mesenchymal transitions in development and disease. Cell. 2009;139(5):871–890. | ||
O’Brien CS, Farnie G, Howell SJ, Clarke RB. Breast cancer stem cells and their role in resistance to endocrine therapy. Horm Canc. 2011;2(2):91–103. | ||
McDonald OG, Wu H, Timp W, Doi A, Feinberg AP. Genome-scale epigenetic reprogramming during epithelial-to-mesenchymal transition. Nat Struct Mol Biol. 2011;18(8):867–874. | ||
Lv T, Yuan D, Miao X, et al. Over-expression of LSD1 promotes proliferation, migration and invasion in non-small cell lung cancer. PLoS One. 2012;7(4):e35065. | ||
Zhao ZK, Dong P, Gu J, et al. Overexpression of LSD1 in hepatocellular carcinoma: a latent target for the diagnosis and therapy of hepatoma. Tumour Biol. 2013;34(1):173–180. | ||
Kalluri R, Weinberg RA. The basics of epithelial-mesenchymal transition. J Clin Invest. 2009;119(6):1420–1428. | ||
Cano A, Pérez-Moreno MA, Rodrigo I, et al. The transcription factor Snail controls epithelial-mesenchymal transitions by repressing E-cadherin expression. Nat Cell Biol. 2000;2(2):76–83. | ||
Bolós V, Peinado H, Pérez-Moreno MA, Fraga MF, Esteller M, Cano A. The transcription factor slug represses E-cadherin expression and induces epithelial to mesenchymal transitions: a comparison with snail and E47 repressors. J Cell Sci. 2003;116(Pt 3):499–511. | ||
Lin T, Ponn A, Hu X, Law BK, Lu J. Requirement of the histone demethylase LSD1 in Snai1-mediated transcriptional repression during epithelial-mesenchymal transition. Oncogene. 2010;29(35):4896–4904. | ||
Ferrari-Amorotti G, Chiodoni C, Shen F, et al. Suppression of invasion and metastasis of triple-negative breast cancer lines by pharmacological or genetic inhibition of slug activity. Neoplasia. 2014;16(12):1047–1058. | ||
Ferrari-Amorotti G, Fragliasso V, Esteki R, et al. Inhibiting interactions of lysine demethylase LSD1 with snail/slug blocks cancer cell invasion. Cancer Res. 2013;73(1):235–245. | ||
Pantel K, Brakenhoff RH. Dissecting the metastatic cascade. Nat Rev Cancer. 2004;4(6):448–456. | ||
Suikki HE, Kujala PM, Tammela TL, van Weerden WM, Vessella RL, Visakorpi T. Genetic alterations and changes in expression of histone demethylases in prostate cancer. Prostate. 2010;70(8):889–898. | ||
Hayami S, Kelly JD, Cho HS, et al. Overexpression of LSD1 contributes to human carcinogenesis through chromatin regulation in various cancers. Int J Cancer. 2011;128(3):574–586. | ||
Li Y, Tian X, Sui CG, Jiang YH, Liu YP, Meng FD. Interference of lysine-specific demethylase 1 inhibits cellular invasion and proliferation in vivo in gastric cancer MKN-28 cells. Biomed Pharmacother. 2016;82:498–508. | ||
Shi Y, Wu H, Zhang M, Ding L, Meng F, Fan X. Expression of the epithelial-mesenchymal transition-related proteins and their clinical significance in lung adenocarcinoma. Diagn Pathol. 2013;8(1):89. | ||
Shih JY, Yang PC. The EMT regulator slug and lung carcinogenesis. Carcinogenesis. 2011;32(9):1299–1304. | ||
Lin Y, Wu Y, Li J, et al. The SNAG domain of Snail1 functions as a molecular hook for recruiting lysine-specific demethylase 1. EMBO J. 2010;29(11):1803–1816. |
 © 2019 The Author(s). This work is published and licensed by Dove Medical Press Limited. The full terms of this license are available at https://www.dovepress.com/terms.php and incorporate the Creative Commons Attribution - Non Commercial (unported, v3.0) License.
By accessing the work you hereby accept the Terms. Non-commercial uses of the work are permitted without any further permission from Dove Medical Press Limited, provided the work is properly attributed. For permission for commercial use of this work, please see paragraphs 4.2 and 5 of our Terms.
© 2019 The Author(s). This work is published and licensed by Dove Medical Press Limited. The full terms of this license are available at https://www.dovepress.com/terms.php and incorporate the Creative Commons Attribution - Non Commercial (unported, v3.0) License.
By accessing the work you hereby accept the Terms. Non-commercial uses of the work are permitted without any further permission from Dove Medical Press Limited, provided the work is properly attributed. For permission for commercial use of this work, please see paragraphs 4.2 and 5 of our Terms.