")
Back to Journals » OncoTargets and Therapy » Volume 11
Upregulated VEGFA and DLL4 act as potential prognostic genes for clear cell renal cell carcinoma
Authors Wang X, Zhang J, Wang Y, Tu M, Wang Y, Shi G
Received 1 September 2017
Accepted for publication 8 December 2017
Published 26 March 2018 Volume 2018:11 Pages 1697—1706
DOI https://doi.org/10.2147/OTT.S150565
Checked for plagiarism Yes
Review by Single anonymous peer review
Peer reviewer comments 2
Editor who approved publication: Dr Jianmin Xu
Xilong Wang, Jun Zhang, Yangyun Wang, Minqi Tu, Ying Wang, Guowei Shi
Department of Urology, The Fifth People’s Hospital of Shanghai, Fudan University, Shanghai, China
Purpose: As a typical hypervascular tumor, clear cell renal cell carcinoma (ccRCC) is the most common type of RCC. This study was aimed to explore the prognostic genes for ccRCC, focusing on the roles of vascular endothelial growth factor A (VEGFA) and Delta-like ligand 4 (DLL4) in the disease.
Materials and methods: The mRNA-sequencing data of kidney renal clear cell carcinoma (KIRC) were obtained from The Cancer Genome Atlas (TCGA) database, including 469 tumor samples and 68 adjacent normal samples. Using limma package, differentially expressed genes (DEGs) were analyzed by differential expression and subgroup analyses and confirmed using validation dataset GSE53757. Followed by enrichment analysis, protein–protein interaction (PPI) network analysis and protein subcellular localization were performed using multifaceted analysis tool for human transcriptome tool, and Cytoscape software and InnateDB database, respectively. Moreover, survival analysis was conducted to identify key prognosis-associated genes. In addition, VEGFA and DLL4 levels were detected using real-time quantitative PCR (qRT-PCR).
Results: A total of 1,984 DEGs were screened in the KIRC tumor samples. VEGFA was located in extracellular space and could interact with placental growth factor (PGF) and angiopoietin 2 (ANGPT2) in the PPI network. Subgroup analysis suggested that VEGFA was significantly upregulated in stages I, II, and III ccRCC tumor samples. Survival analysis showed that TIMP1 was among the top four prognosis-associated genes. qRT-PCR analysis confirmed that the expression levels of DLL4 and VEGFA were significantly upregulated in tumor samples.
Conclusion: VEGFA and DLL4 might be prognostic genes for ccRCC. Besides, PGF, ANGPT2, and TIMP1 might also be related to the prognosis of ccRCC patients.
Keywords: clear cell renal cell carcinoma, differentially expressed genes, protein–protein interaction network, subgroup analysis, survival analysis
Introduction
Renal cell carcinoma (RCC) is the most common type of kidney cancer and accounts for about 90%–95% of kidney cancer cases.1 It usually starts with weight loss, flank pain, blood in the urine, high blood pressure, fever, feeling unwell, and night sweats.2 RCC is responsible for 2%–3% of all malignancies in adult, ranking 7th and 9th in common cancer cases among men and women, respectively.3 Globally, RCC induces ~2,09,000 new cases and results in 1,02,000 deaths per year.4 When RCC is diagnosed, in ~30% of cases, the cells spread into the ipsilateral renal vein, and in 5%–10% of cases, it spreads to the inferior vena cava.5 RCC commonly metastasizes to the adrenal glands, lymph nodes, liver, lungs, brain, or bones, and targeted therapy can be used to improve the outcome of metastatic RCC.6 Clear cell renal cell carcinoma (ccRCC) is the most common type of RCC, which is responsible for 75% of the cases.7 Therefore, investigating the mechanisms of ccRCC is important for improving therapies.
In patients with low-risk ccRCC, the expression of BRCA1-associated protein-1 (BAP1) can serve as a prognostic marker independently.8,9 Galectin-1 (GAL1) regulates migration and invasion of ccRCC via the hypoxia-inducible factor-1α (HIF-1α)-mammalian target of rapamycin (mTOR) signaling axis; thus, GAL1 is a promising prognostic indicator and therapeutic target for the disease.10 Previous studies report that both the mRNA and protein levels of AT-rich interactive domain 1A (ARID1A) have statistical significance in predicting the prognosis of ccRCC.11,12 Vascular endothelial growth factor A (VEGFA), which is a critical angiogenic cytokine, plays an important role in tumor angiogenesis and may be a key target for cancer therapy.13 As an endothelial Notch ligand, delta-like ligand 4 (DLL4) plays a critical role in regulating tumor angiogenesis and thus is a potential anti-angiogenesis target in clinical applications.14 RCC is a typical hypervascular tumor, and its tumor cells can promote tumor growth and progression through producing pro-angiogenesis factors.15 However, the prognostic genes involved in ccRCC have not been fully reported. Thus, this study was designed to investigate the genes associated with the prognosis of ccRCC, focusing on the roles of VEGFA and DLL4 in ccRCC.
In this study, the mRNA-sequencing (mRNA-seq) data of kidney renal clear cell carcinoma (KIRC) were obtained from The Cancer Genome Atlas (TCGA) database. Differentially expressed genes (DEGs) between tumor samples and adjacent normal samples were identified, and then enrichment analysis was performed. Followed by protein–protein interaction (PPI) network analysis, protein subcellular localization, subgroup analysis, and survival analysis were successively performed to explore the key genes involved in the prognosis of ccRCC. Finally, VEGFA and DLL4 expression levels were detected by real-time quantitative PCR (qRT-PCR).
Materials and methods
Date source
The level 3 mRNA-seq data (downloaded in November 2016) of KIRC were downloaded from TCGA (https://cancergenome.nih.gov/) database, including 469 tumor samples and 68 adjacent normal samples. Meanwhile, clinical information including age, gender, race, tumor stage, survival time, and outcome were also obtained.
Data preprocessing and DEGs screening
Using the edgeR package (version 3.4, http://www.bioconductor.org/packages/release/bioc/html/edgeR.html)16,17 in R, the raw data were successively normalized into log continuous phase modulation (CPM) values, performed with linear modeling, and the relationship between average variances were mediated. Based on the empirical Bayes method in limma package18 (version 3.10.3, http://www.bioconductor.org/packages/2.9/bioc/html/limma.html), differential expression analysis was performed for the tumor samples and adjacent normal samples. The p-values obtained from t-test was adjusted into false discovery rates (FDRs; that were adjusted p-values) using Benjamini–Hochberg method.19 The genes with FDR <0.05 and |log2fold change (FC)| >2 were identified as DEGs.
Functional and pathway enrichment analysis
Gene Ontology (GO, http://www.geneontology.org) database can be applied for performing functional enrichment for genes and gene products.20 The Kyoto Encyclopedia of Genes and Genomes (KEGG, http://www.genome.jp/kegg/) database, which includes known genes and corresponding biochemical functionalities, can be used for pathway enrichment analysis.21 BioCloud is an online platform (http://www.biocloudservice.com) that was developed for computing high-throughput data. Using the multifaceted analysis tool for human transcriptome tool in the BioCloud platform, the DEGs were performed with functional and pathway enrichment analyses. The p-value <0.01 was set as the cutoff criterion.
PPI network analysis and protein subcellular localization
The intersection of the PPI pairs included in Mentha (http://mentha.uniroma2.it/about.php),22 BioGRID (https://wiki.thebiogrid.org/),23 and HPRD (http://www.hprd.org/)24 databases was taken as background, and then the DEGs were mapped into the background to obtain their PPI pairs. Subsequently, the PPI network for the DEGs was visualized by Cytoscape software (http://www.cytoscape.org).25 Using the CytoNCA plugin (version 2.1.6, http://apps.cytoscape.org/apps/cytonca)26 in Cytoscape software, betweenness centrality (BC), degree centrality (DC), and closeness centrality (CC) of the nodes in PPI network were analyzed to further identify hub nodes.27 In addition, the information of human protein subcellular localization were obtained from InnateDB database (http://www.innatedb.com/),28 including extracellular space, cell surface, cytoplasm, plasma membrane, and nucleus. Afterward, protein subcellular localizations of the nodes in the PPI network were identified.
Subgroup analysis based on tumor stage
To further explore DEGs, KIRC tumor samples were divided into four groups (stages I, II, III, and IV) based on their tumor stage. Then differential expression analysis between the tumor samples in each group and the adjacent normal samples was conducted by limma package,18 with FDR <0.05 and |log2FC| >2 as the thresholds.
Differential expression analysis and subgroup analysis of validation dataset
The raw CEL files and annotation files under GSE53757, which were sequenced on the platform of GPL570 [HG-U133_Plus_2] Affymetrix Human Genome U133 Plus 2.0 Array, were obtained from Gene Expression Omnibus (GEO, http://www.ncbi.nlm.nih.gov/geo/) database (downloaded in November 2016). GSE53757 included 72 ccRCC tumor samples and 72 adjacent normal samples. After the raw data of GSE53757 were read by the affy package (version 1.50.0, http://www.bioconductor.org/packages/release/bioc/html/affy.html)29 in R, they were performed with background correction, normalization, and expression calculation using robust multi-array average (RMA) method.30 Based on the annotation files, the probes having no matched gene symbol were eliminated. For probes having the same gene symbol, their average value was taken as the final expression value of the gene. Finally, differential expression analysis and subgroup analysis were performed separately for the ccRCC tumor samples and adjacent normal samples using limma package18 with FDR <0.05 and |log2FC| >2 as the thresholds.
Survival analysis
To obtain prognosis-associated genes, the intersection DEGs between TCGA dataset and GSE53757 were identified. Then the intersection DEGs were divided into groups with high expression and low expression based on their medians. Using Cox model,31 variables such as age, gender, and tumor stage were adjusted. The genes with p-value <0.05 were taken as prognosis-associated genes. The hazard ratios (HRs) for survival were predicted for the prognosis-associated genes. In addition, high-expressed genes with HR >1 and low-expressed genes with HR <1 were identified, and then Kaplan–Meier (KM) survival curve were drawn.
qRT-PCR analysis
A total of 11 pairs of ccRCC tumor samples and adjacent normal samples were obtained from our hospital. This study was approved by the ethic committee of The Fifth People’s Hospital of Shanghai, Fudan University, and written informed consent was obtained from relevant patients. Total RNA was isolated from the samples with RNAiso Plus (TaKaRa, Tokyo, Japan) following the manufacturer’s manual. Followed by the concentration and quality of total RNA were detected using microplate reader (Tecan, Mannedorf, Switzerland). Subsequently, first-strand cDNA was synthesized using a reverse transcription kit (TaKaRa) and then stored at −20°C.
For qRT-PCR experiments, primers were designed and synthesized separately by Primer Premier 6.0 software (Premier Software Inc., Cherry Hill, NJ, USA) and Sangon Biotech Co., Ltd (Shanghai, China) (Table 1), respectively. The expression levels of VEGFA and DLL4 in ccRCC tumor samples and adjacent normal samples were measured using SYBR green kit (Thermo Fisher Scientific, Waltham, MA, USA). The 10 μL amplification system included 5 μL SYBR Premix EX Taq (2x), 3.4 μL cDNA template (100 ng/μL), 0.3 μL forward primer (10 μM), 0.3 μL reverse primer (10 μM), and 1 μL ddH2O. The reaction program was as follows: 50°C for 3 min, 95°C for 3 min, and 95°C for 10 s, and 60°C for 30 s for 40 cycles. In addition, a melting curve was created in the end. Glyceraldehyde-3-phosphate dehydrogenase (GAPDH) was taken as the reference gene, and all samples had three repeats.
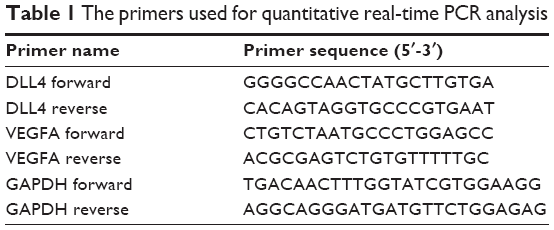 | Table 1 The primers used for quantitative real-time PCR analysis |
Statistical analysis
Based on the 2-ΔΔCt method,32 the expression levels of VEGFA and DLL4 were analyzed. All results were shown as mean ± standard error of mean (SEM). GraphPad Prism (GraphPad Software, Inc., La Jolla, CA, USA) was used for statistical analysis and drawing pictures. The p<0.05 was taken as the threshold for significant difference.
Results
DEG screening
A total of 1,984 DEGs were identified in the KIRC tumor samples in relative to adjacent normal samples, including 806 upregulated genes (including VEGFA and DLL4) and 1,178 downregulated genes. There were more downregulated genes than upregulated genes.
Functional and pathway enrichment analysis
Both the upregulated genes and downregulated genes were performed with enrichment analysis. The top 10 GO terms and pathways are shown in Figure 1A and B, respectively. For the upregulated genes, the enriched GO terms mainly included immune response, regulation of immune response, and inflammatory response. Meanwhile, the pathways enriched for the upregulated genes mainly included Staphylococcus aureus infection, natural killer cell-mediated cytotoxicity, and cytokine–cytokine receptor interaction. Besides, the GO terms enriched for the downregulated genes mainly included excretion, ion transmembrane transport, and chloride transmembrane transport. Moreover, the downregulated genes were enriched in pathways such as neuroactive ligand–receptor interaction, protein digestion and absorption, and tyrosine metabolism.
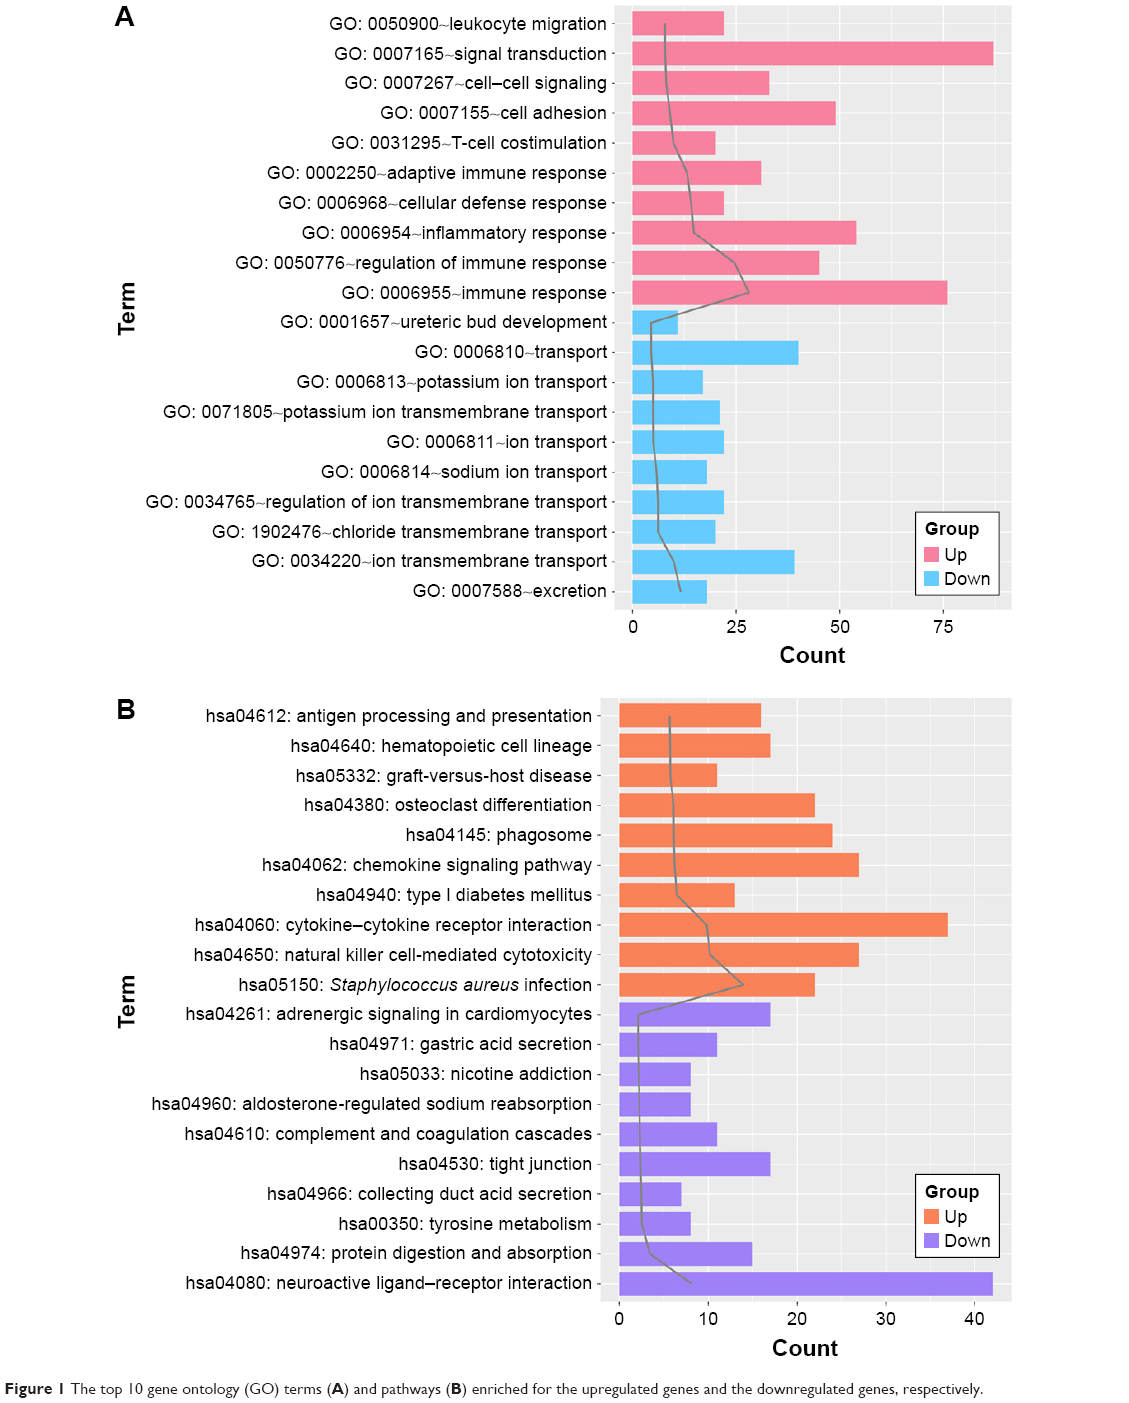 | Figure 1 The top 10 gene ontology (GO) terms (A) and pathways (B) enriched for the upregulated genes and the downregulated genes, respectively. |
PPI network analysis and protein subcellular localization
A total of 729 nodes and 1,105 interactions were obtained from the intersection of the PPI pairs included in Mentha, BioGRID, and HPRD databases. Then the PPI network involving 337 upregulated genes and 392 downregulated genes was constructed (Figure 2). Combined with BC, CC, and DC scores, the top 10 nodes are listed in Table 2. According to the results of protein subcellular localization, 72, 33, 28, 68, and 91 nodes in the PPI network were located in extracellular space, cell surface, cytoplasm, plasma membrane, and nucleus, respectively. In particular, VEGFA could interact with placental growth factor (PGF) and angiopoietin 2 (ANGPT2) and was located in extracellular space.
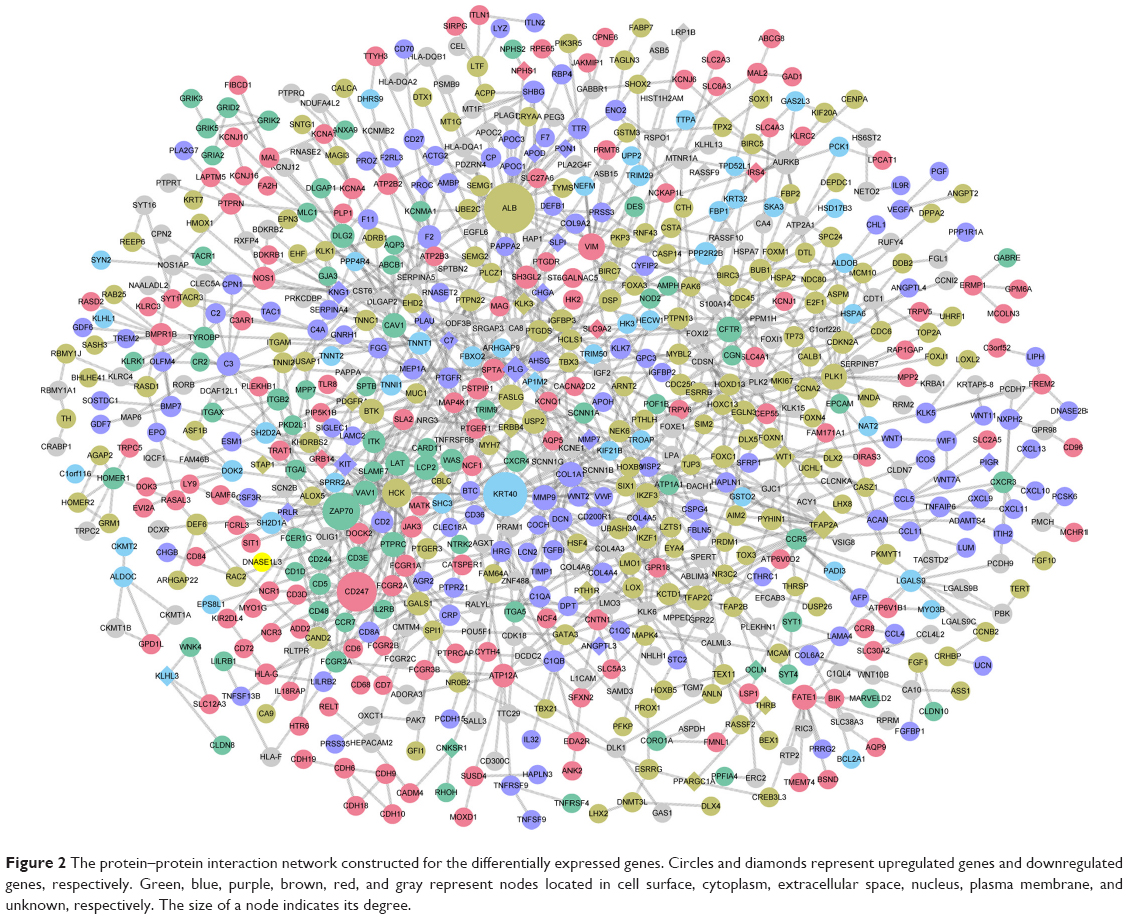 | Figure 2 The protein–protein interaction network constructed for the differentially expressed genes. Circles and diamonds represent upregulated genes and downregulated genes, respectively. Green, blue, purple, brown, red, and gray represent nodes located in cell surface, cytoplasm, extracellular space, nucleus, plasma membrane, and unknown, respectively. The size of a node indicates its degree. |
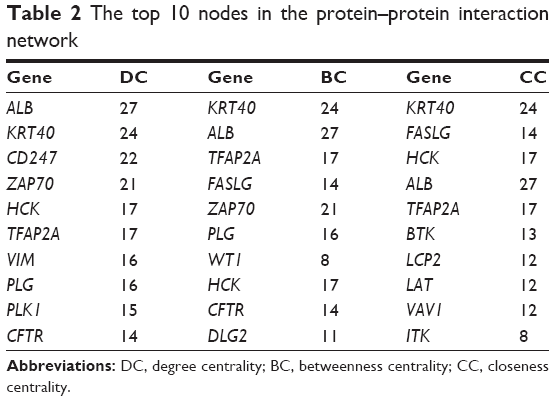 | Table 2 The top 10 nodes in the protein–protein interaction network |
Subgroup analysis based on the tumor stage
Differential expression analysis were performed for stage I versus normal, stage II versus normal, stage III versus normal, and stage IV versus normal comparison groups. There were 1,849 (700 upregulated genes and 1,149 downregulated genes), 2,006 (717 upregulated genes and 1,289 downregulated genes), 2,174 (974 upregulated genes and 1,227 downregulated genes), and 2,288 (1,007 upregulated genes and 1281 downregulated genes) DEGs in stage I versus normal, stage II versus normal, stage III versus normal, and stage IV versus normal comparison groups, respectively. The Venn diagram of subgroup analysis (Figure 3) showed that the common DEGs among the four comparison groups were in majority. Importantly, VEGFA were differentially expressed in all the four comparison groups, and DLL4 had significantly differential expression in stage I versus normal, stage II versus normal, and stage III versus normal comparison groups (Figure 4).
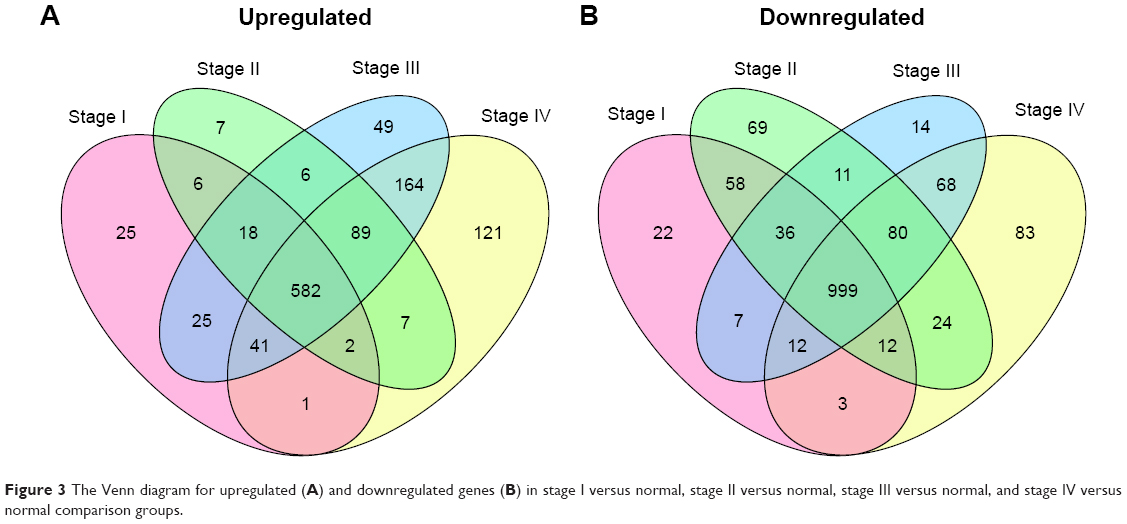 | Figure 3 The Venn diagram for upregulated (A) and downregulated genes (B) in stage I versus normal, stage II versus normal, stage III versus normal, and stage IV versus normal comparison groups. |
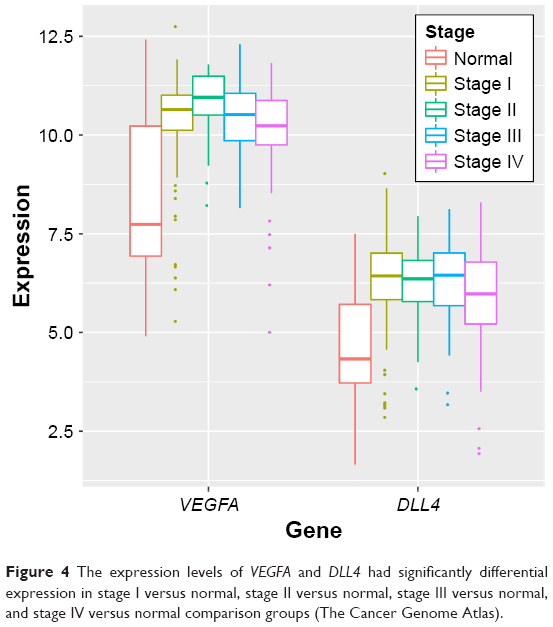 | Figure 4 The expression levels of VEGFA and DLL4 had significantly differential expression in stage I versus normal, stage II versus normal, stage III versus normal, and stage IV versus normal comparison groups (The Cancer Genome Atlas). |
Differential expression analysis and subgroup analysis of validation dataset
After the raw data of GSE53757 were preprocessed, a total of 398 DEGs were identified in ccRCC tumor samples compared with adjacent normal samples, including 147 upregulated genes (such as VEGFA) and 251 downregulated genes. Based on the tumor stage, ccRCC tumor samples were also divided into four groups (stages I, II, III, and IV). Then subgroup analysis was performed for the ccRCC tumor samples and adjacent normal samples, finding that VEGFA was significantly upregulated in stages I, II, and III ccRCC tumor samples (Figure 5).
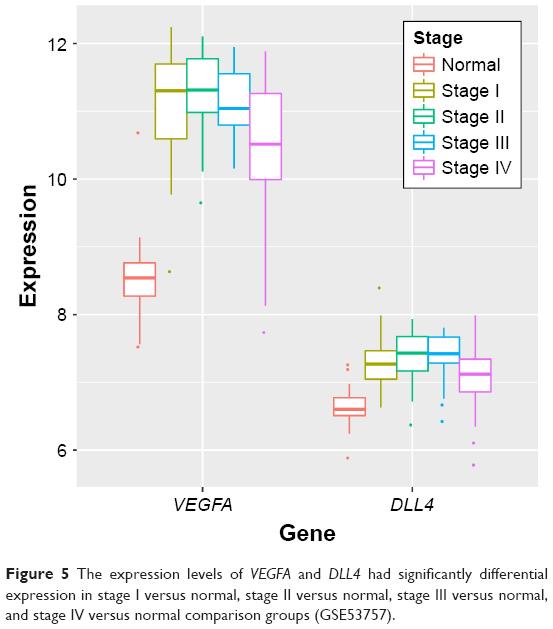 | Figure 5 The expression levels of VEGFA and DLL4 had significantly differential expression in stage I versus normal, stage II versus normal, stage III versus normal, and stage IV versus normal comparison groups (GSE53757). |
Survival analysis
There were 270 intersection DEGs between TCGA dataset and GSE53757, including 103 upregulated genes and 167 downregulated genes. Then a total of 40 prognosis-associated genes were identified from the intersection DEGs. The KM survival curves for the top four prognosis-associated genes (according to p-values) (including aldehyde dehydrogenase 6 family, member A1, ALDH6A1; WD repeat domain 72, WDR72; phospholipase C-like 1, PLCL1; and TIMP metallopeptidase inhibitor 1, TIMP1) are shown in Figure 6.
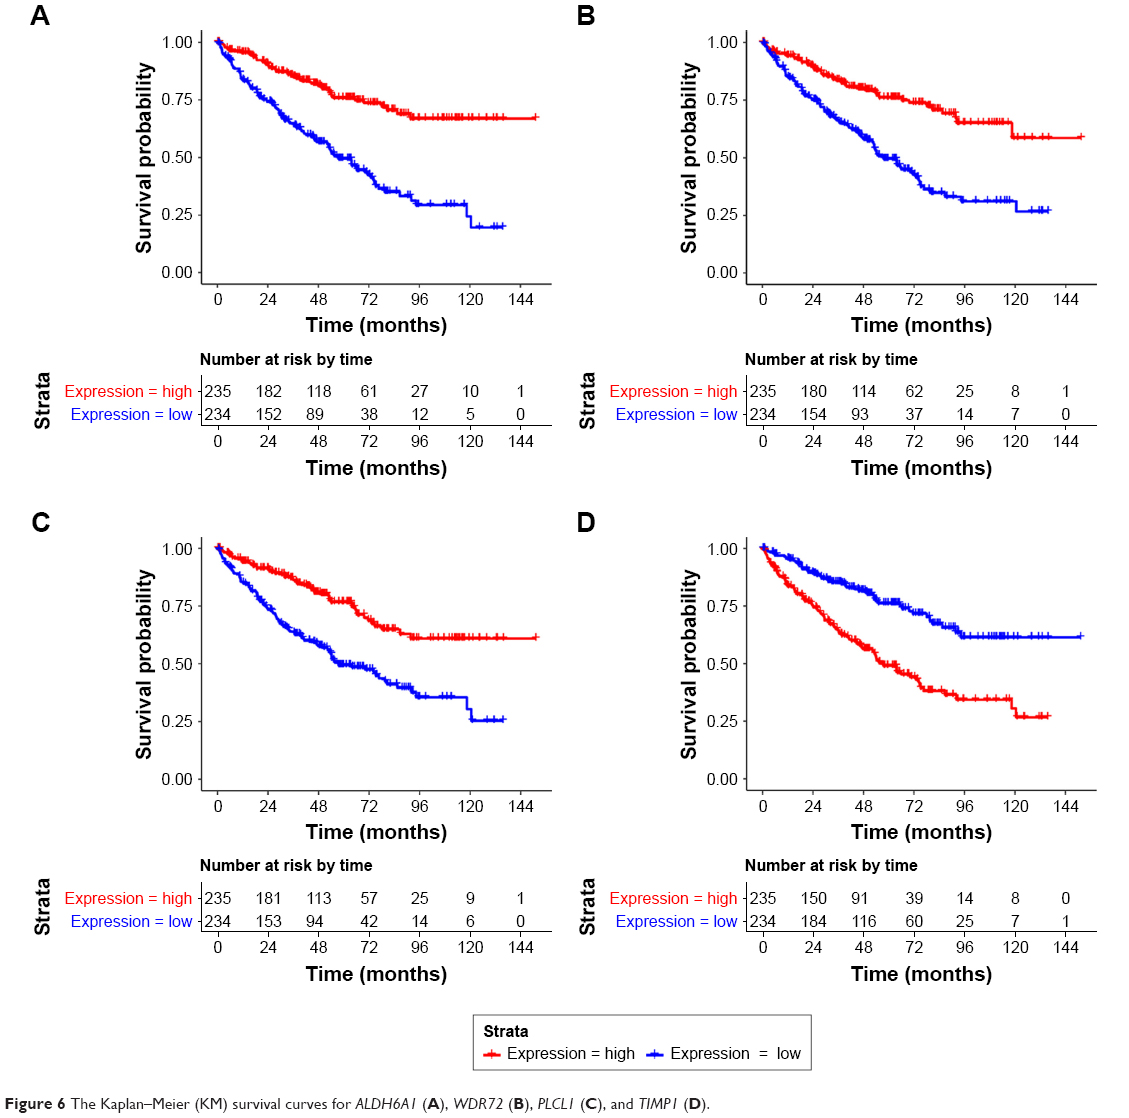 | Figure 6 The Kaplan–Meier (KM) survival curves for ALDH6A1 (A), WDR72 (B), PLCL1 (C), and TIMP1 (D). |
qRT-PCR analysis
Furthermore, the expression levels of DLL4 and VEGFA in ccRCC tumor samples and adjacent normal samples were detected by using qRT-PCR. In tumor samples, the expression levels of DLL4 (p<0.001, Figure 7A) and VEGFA (p<0.01, Figure 7B) were significantly upregulated in relative to adjacent normal samples.
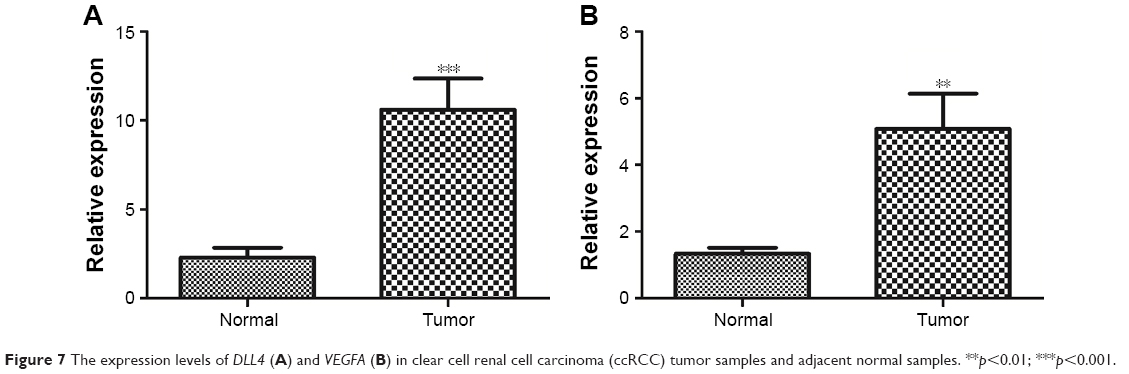 | Figure 7 The expression levels of DLL4 (A) and VEGFA (B) in clear cell renal cell carcinoma (ccRCC) tumor samples and adjacent normal samples. **p<0.01; ***p<0.001. |
Discussion
In this study, a total of 1,984 DEGs (including upregulated VEGFA and DLL4) were identified in the KIRC tumor samples in relative to adjacent normal samples. Subgroup analysis for the KIRC tumor samples showed that VEGFA were differentially expressed in all the four comparison groups, and DLL4 had significantly differential expression in stage I versus normal, stage II versus normal, and stage III versus normal comparison groups. Meanwhile, subgroup analysis for the validation dataset showed that VEGFA was significantly upregulated in stages I, II, and III ccRCC tumor samples. In addition, qRT-PCR analysis confirmed that the expression levels of DLL4 and VEGFA were significantly upregulated in tumor samples.
In RCC, increased serum level of VEGF is correlated with adverse survival and can serve as a prognostic factor.33 VEGF expression is associated with tumor stage and prognosis, suggesting that VEGF functions in the growth and progression of RCC.34,35 Huang et al reported that the activation of DLL4/Notch signaling and the interaction of endothelium and cells contribute to the progression of RCC.36 DLL4 blockade has a promising antitumor activity in RCC patient-derived tumors, and the simultaneous targeting of the VEGF and DLL4 signaling pathways has a combination benefit.37 Therefore, VEGFA and DLL4 might be prognostic genes for ccRCC.
Besides, VEGFA was located in extracellular space and had interactions with PGF and ANGPT2 in the PPI network. Angiogenic protein PGF belongs to the VEGF family, and anti-PGF antibody may be used as antiangiogenic agent that is minor toxicity when combined with anti-VEGF strategies.38 Plasma levels of PGF have significant correlation with the clinical features and VEGF levels and thus can be used as an independent prognostic factor for RCC.39 Plasma ANGPT2 concentration is increased in RCC patients, and ANGPT2 can serve as a promising target for the treatment of tyrosine kinase-resistant RCC.40 Through targeting oncogenes ANGPT2 and neural precursor cell expressed, developmentally downregulated 9 (NEDD9), miR-145 acts as tumor suppressor and therapeutic target in patients with RCC.41 By activating Tie2 receptor tyrosine kinase, ANGPT2 protects tumor endothelial cells and suppresses the antivascular effects of VEGF inhibition.42 This indicates that PGF and ANGPT2 might be involved in the prognosis of ccRCC through interacting with VEGFA.
Moreover, 40 prognosis-associated genes were identified from the intersection DEGs between TCGA dataset and GSE5375, and TIMP1 was among the top four prognosis-associated genes. Through upregulating matrix metalloproteinase-2 (MMP-2) and MMP-9 and downregulating TIMP1, S-phase kinase-associated protein-2 (SKP2) signaling pathway contributes to the invasion and metastasis of RCC cells.43,44 Elevated protein levels of MMP2, MMP9, TIMP1, and TIMP2 are related to shortened patient survival and thus predict poor prognosis in RCC.45 MMPs and TIMPs function in maintaining extracellular matrix homeostasis, and TIMP1 and TIMP2 levels are relevant in RCC.46 By upregulating TIMP1 and TIMP2, Rac signaling inhibits the invasion of epithelial tumor cells in RCC patients.47 Thus, TIMP1 might also be associated with the prognosis of ccRCC.
Conclusion
A series of bioinformatics analyses were carried out, finding a total of 1,984 DEGs in the KIRC tumor samples. Besides, VEGFA and DLL4 might be prognostic genes for ccRCC. Furthermore, PGF, ANGPT2, and TIMP1 might also be related to the prognosis of ccRCC patients. However, in-depth experimental research studies should be performed to confirm our findings.
Acknowledgments
This work was supported by Minhang District natural science research project (project number: 2014MHZ007) and the Shanghai Key Medical Specialty Program (project number: ZK2015B04).
Disclosure
The authors report no conflicts of interest in this work.
References
Ljungberg B, Campbell SC, Choi HY, et al. The epidemiology of renal cell carcinoma. Eur Urol. 2011;60(4):615. | ||
Jonasch E, Gao J, Rathmell WK. Renal cell carcinoma. BMJ. 2014;349(349):g4797. | ||
Campbell SC, Rini BI. Renal cell carcinoma. Curr Opin Oncol. 2009;373(9669):1119. | ||
Escudier B, Porta C, Schmidinger M, et al. Renal cell carcinoma: ESMO Clinical Practice Guidelines for diagnosis, treatment and follow-up. Ann Oncol. 2016;21(Suppl 5):v137–v139. | ||
Oto A, Herts BR, Remer EM, Novick AC. Inferior vena cava tumor thrombus in renal cell carcinoma: staging by MR imaging and impact on surgical treatment. AJR Am J Roentgenol. 1998;171(6):1619. | ||
Singer EA, Gupta GN, Marchalik D, Srinivasan R. Evolving therapeutic targets in renal cell carcinoma. Curr Opin Oncol. 2013;25(3):273. | ||
Grignon DJ, Che M. Clear cell renal cell carcinoma. Clin Lab Med. 2005;25(2):305–316. | ||
Joseph RW, Kapur P, Serie DJ, et al. Loss of BAP1 protein expression is an independent marker of poor prognosis in patients with low-risk clear cell renal cell carcinoma. Cancer. 2014;120(7):1059–1067. | ||
Farley MN, Schmidt LS, Mester JL, et al. A novel germline mutation in BAP1 predisposes to familial clear-cell renal cell carcinoma. Mol Cancer Res. 2013;11(9):1061–1071. | ||
White NMA, Masui O, Newsted D, et al. Galectin-1 has potential prognostic significance and is implicated in clear cell renal cell carcinoma progression through the HIF/mTOR signaling axis. Br J Cancer. 2014;110(5):1250–1259. | ||
Lichner Z, Scorilas A, White NMA, et al. The chromatin remodeling gene ARID1A is a new prognostic marker in clear cell renal cell carcinoma. Am J Pathol. 2013;182(4):1163. | ||
Park JH, Lee C, Suh JH, Chae JY, Kim HW, Moon KC. Decreased ARID1A expression correlates with poor prognosis of clear cell renal cell carcinoma. Hum Pathol. 2015;46(3):454–460. | ||
Dvorak HF. Vascular permeability factor/vascular endothelial growth factor: a critical cytokine in tumor angiogenesis and a potential target for diagnosis and therapy. J Clin Oncol. 2002;20(21):4368. | ||
Kuhnert F, Kirshner JR, Thurston G. Dll4-Notch signaling as a therapeutic target in tumor angiogenesis. Vasc Cell. 2011;3(1):20. | ||
Wang JH, Min PQ, Wang PJ, et al. Dynamic CT evaluation of tumor vascularity in renal cell carcinoma. AJR Am J Roentgenol. 2006;186(5):1423–1430. | ||
Robinson MD, McCarthy DJ, Smyth GK. edgeR: a bioconductor package for differential expression analysis of digital gene expression data. Bioinformatics. 2010;26(1):139–140. | ||
McCarthy DJ, Chen Y, Smyth GK. Differential expression analysis of multifactor RNA-Seq experiments with respect to biological variation. Nucleic Acids Res. 2012;40(10):4288–4297. | ||
Smyth GK. Limma: linear models for microarray data. In: Bioinformatics and Computational Biology Solutions Using R and Bioconductor. Edited by Gentleman R, Carey V, Dudoit S, R Irizarry WH. New York: Springer; 2005:397–420. | ||
Benjamini Y, Hochberg Y. Controlling the false discovery rate: a practical and powerful approach to multiple testing. J Roy Statist Soc Ser B. 1995;57(1):289–300. | ||
Harris MA, Clark J, Ireland A, et al. Gene Ontology Consortium. The Gene Ontology (GO) database and informatics resource. Nucl Acids Res. 2004;32(Database issue):258–261. | ||
Altermann E, Klaenhammer TR. PathwayVoyager: pathway mapping using the Kyoto Encyclopedia of Genes and Genomes (KEGG) database. BMC Genomics. 2005;6(1):60. | ||
Calderone A, Castagnoli L, Cesareni G. Mentha: a resource for browsing integrated protein-interaction networks. Nat Methods. 2013;10(8):690–691. | ||
Chatr-Aryamontri A, Breitkreutz BJ, Oughtred R, et al. The BioGRID interaction database: 2015 update. Nucl Acids Res. 2015;43(Database issue):D470–D478. | ||
Keshava Prasad TS, Goel R, Kandasamy K, et al. Human Protein Reference Database – 2009 update. Nucl Acids Res. 2009;37(Database issue):D767–D772. | ||
Shannon P, Markiel A, Ozier O, et al. Cytoscape: a software environment for integrated models of biomolecular interaction networks. Genome Res. 2003;13(11):2498–2504. | ||
Tang Y, Li M, Wang J, Pan Y, Wu FX. CytoNCA: a cytoscape plugin for centrality analysis and evaluation of protein interaction networks. Bio Systems. 2015;127:67–72. | ||
He X, Zhang J. Why do hubs tend to be essential in protein networks? PLoS Genet. 2006;2(6):826–834. | ||
Breuer K, Foroushani AK, Laird MR, et al. InnateDB: systems biology of innate immunity and beyond – recent updates and continuing curation. Nucl Acids Res. 2013;41(Database issue):D1228–D1233. | ||
Gautier L, Cope L, Bolstad BM, Irizarry RA. Affy – analysis of Affymetrix GeneChip data at the probe level. Bioinformatics. 2004;20(20):307–315. | ||
Irizarry RA, Hobbs B, Collin F, et al. Exploration, normalization, and summaries of high density oligonucleotide array probe level data. Biostatisics. 2003;4:249–264. | ||
Perperoglou A. Cox models with dynamic ridge penalties on time-varying effects of the covariates. Stat Med. 2014;33(1):170. | ||
Arocho A, Chen B, Ladanyi M, Pan Q. Validation of the 2-ΔΔCt calculation as an alternate method of data analysis for quantitative PCR of BCR-ABL P210 transcripts. Diagn Mol Pathol. 2006;15(1):56–61. | ||
Jacobsen J, Rasmuson T, Grankvist K, Ljungberg B. Vascular endothelial growth factor as prognostic factor in renal cell carcinoma. J Urol. 2000;163(1):343. | ||
Jacobsen J, Grankvist K, Rasmuson T, Bergh A, Landberg G, Ljungberg B. Expression of vascular endothelial growth factor protein in human renal cell carcinoma. BJU Int. 2007;93(3):297. | ||
Choueiri TK, Xie W, Kollmannsberger C, et al. The impact of cytoreductive nephrectomy on survival of patients with metastatic renal cell carcinoma receiving vascular endothelial growth factor targeted therapy. J Urol. 2011;185(185):60–66. | ||
Huang QB, Ma X, Li HZ, et al. Endothelial Delta-like 4 (DLL4) promotes renal cell carcinoma hematogenous metastasis. Oncotarget. 2014;5(10):3066. | ||
Miles KM, Seshadri M, Ciamporcero E, et al. Dll4 blockade potentiates the anti-tumor effects of VEGF inhibition in renal cell carcinoma patient-derived xenografts. PLoS One. 2014;9(11):e112371. | ||
Ribatti D. The discovery of the placental growth factor and its role in angiogenesis: a historical review. Angiogenesis. 2008;11(3):215–221. | ||
Matsumoto K, Suzuki K, Koike H, et al. Prognostic significance of plasma placental growth factor levels in renal cell cancer: an association with clinical characteristics and vascular endothelial growth factor levels. Anticancer Res. 2003;23(6D):4953–4958. | ||
Bullock AJ, Zhang L, O’Neill AM, et al. Plasma angiopoietin-2 (ANG2) as an angiogenic biomarker in renal cell carcinoma (RCC). J Clin Oncol. 2010;28(15):1676–1680. | ||
Lu R, Ji Z, Li X, et al. miR-145 functions as tumor suppressor and targets two oncogenes, ANGPT2 and NEDD9, in renal cell carcinoma. J Cancer Res Clin Oncol. 2014;140(3):387–397. | ||
Daly C, Eichten A, Castanaro C, et al. Angiopoietin-2 functions as a Tie2 agonist in tumor models, where it limits the effects of VEGF inhibition. Cancer Res. 2013;73(1):108. | ||
Lu H, Cao X, Zhang H, et al. Imbalance between MMP-2, 9 and TIMP-1 promote the invasion and metastasis of renal cell carcinoma via SKP2 signaling pathways. Tumor Biol. 2014;35(10):9807. | ||
Mccabe AJ, Wallace JM, Gilmore WS, Mcglynn H, Strain SJ. Docosahexaenoic acid reduces in vitro invasion of renal cell carcinoma by elevated levels of tissue inhibitor of metalloproteinase-1. J Nutr Biochem. 2005;16(1):17–22. | ||
Kallakury BV, Karikehalli S, Haholu A, Sheehan CE, Azumi N, Ross JS. Increased expression of matrix metalloproteinases 2 and 9 and tissue inhibitors of metalloproteinases 1 and 2 correlate with poor prognostic variables in renal cell carcinoma. Clin Cancer Res. 2001;7(10):3113–3119. | ||
Bhuvarahamurthy V, Kristiansen GO, Johannsen M, et al. In situ gene expression and localization of metalloproteinases MMP1, MMP2, MMP3, MMP9, and their inhibitors TIMP1 and TIMP2 in human renal cell carcinoma. Oncol Rep. 2006;15(5):1379. | ||
Engers R, Springer E, Michiels F, Collard JG, Gabbert HE. Rac affects invasion of human renal cell carcinomas by up-regulating tissue inhibitor of metalloproteinases (TIMP)-1 and TIMP-2 expression. J Biol Chem. 2001;276(45):41889–41897. |
 © 2018 The Author(s). This work is published and licensed by Dove Medical Press Limited. The full terms of this license are available at https://www.dovepress.com/terms.php and incorporate the Creative Commons Attribution - Non Commercial (unported, v3.0) License.
By accessing the work you hereby accept the Terms. Non-commercial uses of the work are permitted without any further permission from Dove Medical Press Limited, provided the work is properly attributed. For permission for commercial use of this work, please see paragraphs 4.2 and 5 of our Terms.
© 2018 The Author(s). This work is published and licensed by Dove Medical Press Limited. The full terms of this license are available at https://www.dovepress.com/terms.php and incorporate the Creative Commons Attribution - Non Commercial (unported, v3.0) License.
By accessing the work you hereby accept the Terms. Non-commercial uses of the work are permitted without any further permission from Dove Medical Press Limited, provided the work is properly attributed. For permission for commercial use of this work, please see paragraphs 4.2 and 5 of our Terms.