")
Back to Journals » Patient Preference and Adherence » Volume 8
Understanding of pictograms from the United States Pharmacopeia Dispensing Information (USP-DI) among elderly Brazilians
Authors Barros IM, Alcântara T, Mesquita AR, Lima Bispo ML, Rocha CE, Moreira VP, Lyra Junior DP
Received 1 April 2014
Accepted for publication 18 June 2014
Published 29 October 2014 Volume 2014:8 Pages 1493—1501
DOI https://doi.org/10.2147/PPA.S65301
Checked for plagiarism Yes
Review by Single anonymous peer review
Peer reviewer comments 3
Izadora MC Barros, Thaciana S Alcântara, Alessandra R Mesquita, Monica L Bispo, Chiara E Rocha, Vagner Porto Moreira, Divaldo P Lyra Junior
Laboratory of Teaching and Research in Social Pharmacy (LEPFS), Department of Pharmacy, Federal University of Sergipe, São Cristóvão, Brazil
Objective: To assess the understanding and cultural acceptability of the United States Pharmacopeia Dispensing Information (USP-DI) in a group of elderly Brazilians.
Methods: The study participants were individuals between 60 and 90 years old, of both sexes, with different levels of education and income. Fifteen of 81 pictograms from the USP-DI were presented to the elderly subjects, individually, without subtitles and in random order, so that the participants’ understanding of the pictograms could be evaluated.
Results: The study included 116 participants. Only one of the selected pictograms reached the comprehension criterion established by the International Organization for Standardization 3864. With regard to the relationship between understanding and sociodemographic characteristics, age, wage income, and level of education were all found to be significantly associated with participants’ understanding of some of the pictograms.
Conclusion: Most of the USP-DI pictograms evaluated were not well understood by the elderly Brazilians. This finding indicates that such pictograms need to be culturally adapted for the Brazilian context if they are to serve their purpose effectively in this country.
Keywords: pictograms, understanding, elderly, Brazil
Introduction
Patient compliance with prescribed medication therapies is an issue of growing concern among health care professionals, especially with regard to elderly patients. This is because a decline in cognitive abilities and memory can occur with age, and it can hamper comprehension of basic health-related information, increasing the risk of nonadherence and treatment failure.1,2 Davis et al3 stated that patients’ understanding of the medicines prescribed to them, and of labels and patient information leaflets, is relevant to patient treatment adherence and to the elimination or reduction of associated risks.
Given these facts, communication tools such as pictograms may play an important role in increasing patients’ understanding of prescription drug information.4 According to Sorfleet et al5 pictograms can help to increase patients’ understanding of and adherence to prescribed medication therapies, especially among patients with limited understanding. Dowse and Ehlers6 reported that the inability to read and comprehend written instructions about medications can be an important factor in nonadherence, particularly in countries with high rates of illiteracy.
According to the Brazilian Institute of Geography and Statistics,7 in 2009, functionally illiterate people (ie, people whose literacy rates are insufficient for performing basic functions and facilitating their personal and professional development) made up approximately 20.3% of the Brazilian population. To ensure the safety of these patients, the National Health System8 has developed communication strategies to help increase the circulation of information and to help to find practical solutions to health problems. Among the various strategies used, the interpersonal communication among health care workers and health care professionals is highlighted, with the aim of improving relationships among health professionals, as well as between health professionals and end users.8
In 1997, the World Health Organization published a document entitled, The role of the pharmacist in the health care system, preparing the future pharmacist: curricular development.,9 noting that the training of pharmacists should equip them with seven essential competencies and skills, including those of “a communicator”. More recently, the International Pharmaceutical Federation has developed strategies to optimize communication between pharmacists and their patients, focusing on the use of pictograms.10 Pictograms can be vital communication tools for reinforcing the oral and written information about medications that is given to patients along with their medications, especially when these patients have difficulties understanding the information, as can be the case with children, the elderly, and patients with low literacy levels.10–12 Therefore, the aim of this study was to assess the understanding and cultural acceptability of the United States Pharmacopeia Dispensing Information (USP-DI) in a group of elderly Brazilians.
Materials and methods
Type of study and composition of the sample
A cross-sectional observational and interview study was conducted on a convenience sample of elderly individuals who were 60–90 years old. The sample included members of both sexes, and individuals with varying levels of education and income. Individuals under 60 years old and those having health problems that prevented them from being able to evaluate the images were excluded from the study.
Period and place of study
This study was conducted between May 2012 and October 2012. Participants were selected by convenience sampling from four institutions for the elderly, where elderly people participate in educational and recreational activities, in the municipality of Aracaju in northeastern Brazil.
Research material
The participants were shown 15 of the 81 pictograms from the USP-DI. These pictograms had been selected based on their expected relevance to the participants, and their expected usefulness in participants’ everyday lives. The pictograms of the USP-DI were chosen because they have the largest international significance, being most commonly found in the literature and having been validated in English-speaking populations.4,6,11
The pictograms were printed in black and white, each with a size of 28 mm (±5%) ×28 mm (±5%) (as recommended by the International Organization for Standardization [ISO] 9186). They were presented without subtitles and in random order. The ISO specifies methods for testing the comprehensibility of graphical symbols, including methods to be used in testing the extent to which a variant of a graphical symbol communicates its intended message, and the methods to be used in testing which variant of a graphical symbol is the most comprehensible.13
Two researchers – one undergraduate research student and one master’s student in pharmacy – presented the pictograms to the participants individually. Both followed the same protocol for showing the images, and this protocol was standardized across the sample. Before administering the pictograms, the researchers came to a consensus about what kinds of responses would be regarded as correct or incorrect.
Responses were considered “correct” when they matched the specific subtitles given for each pictogram by the USP-DI, as shown in Table 1. Responses that did not match these legends were considered “incorrect”. In addition, participants who said they did not understand the images and gave no meaning for them were classified as “do not know”.
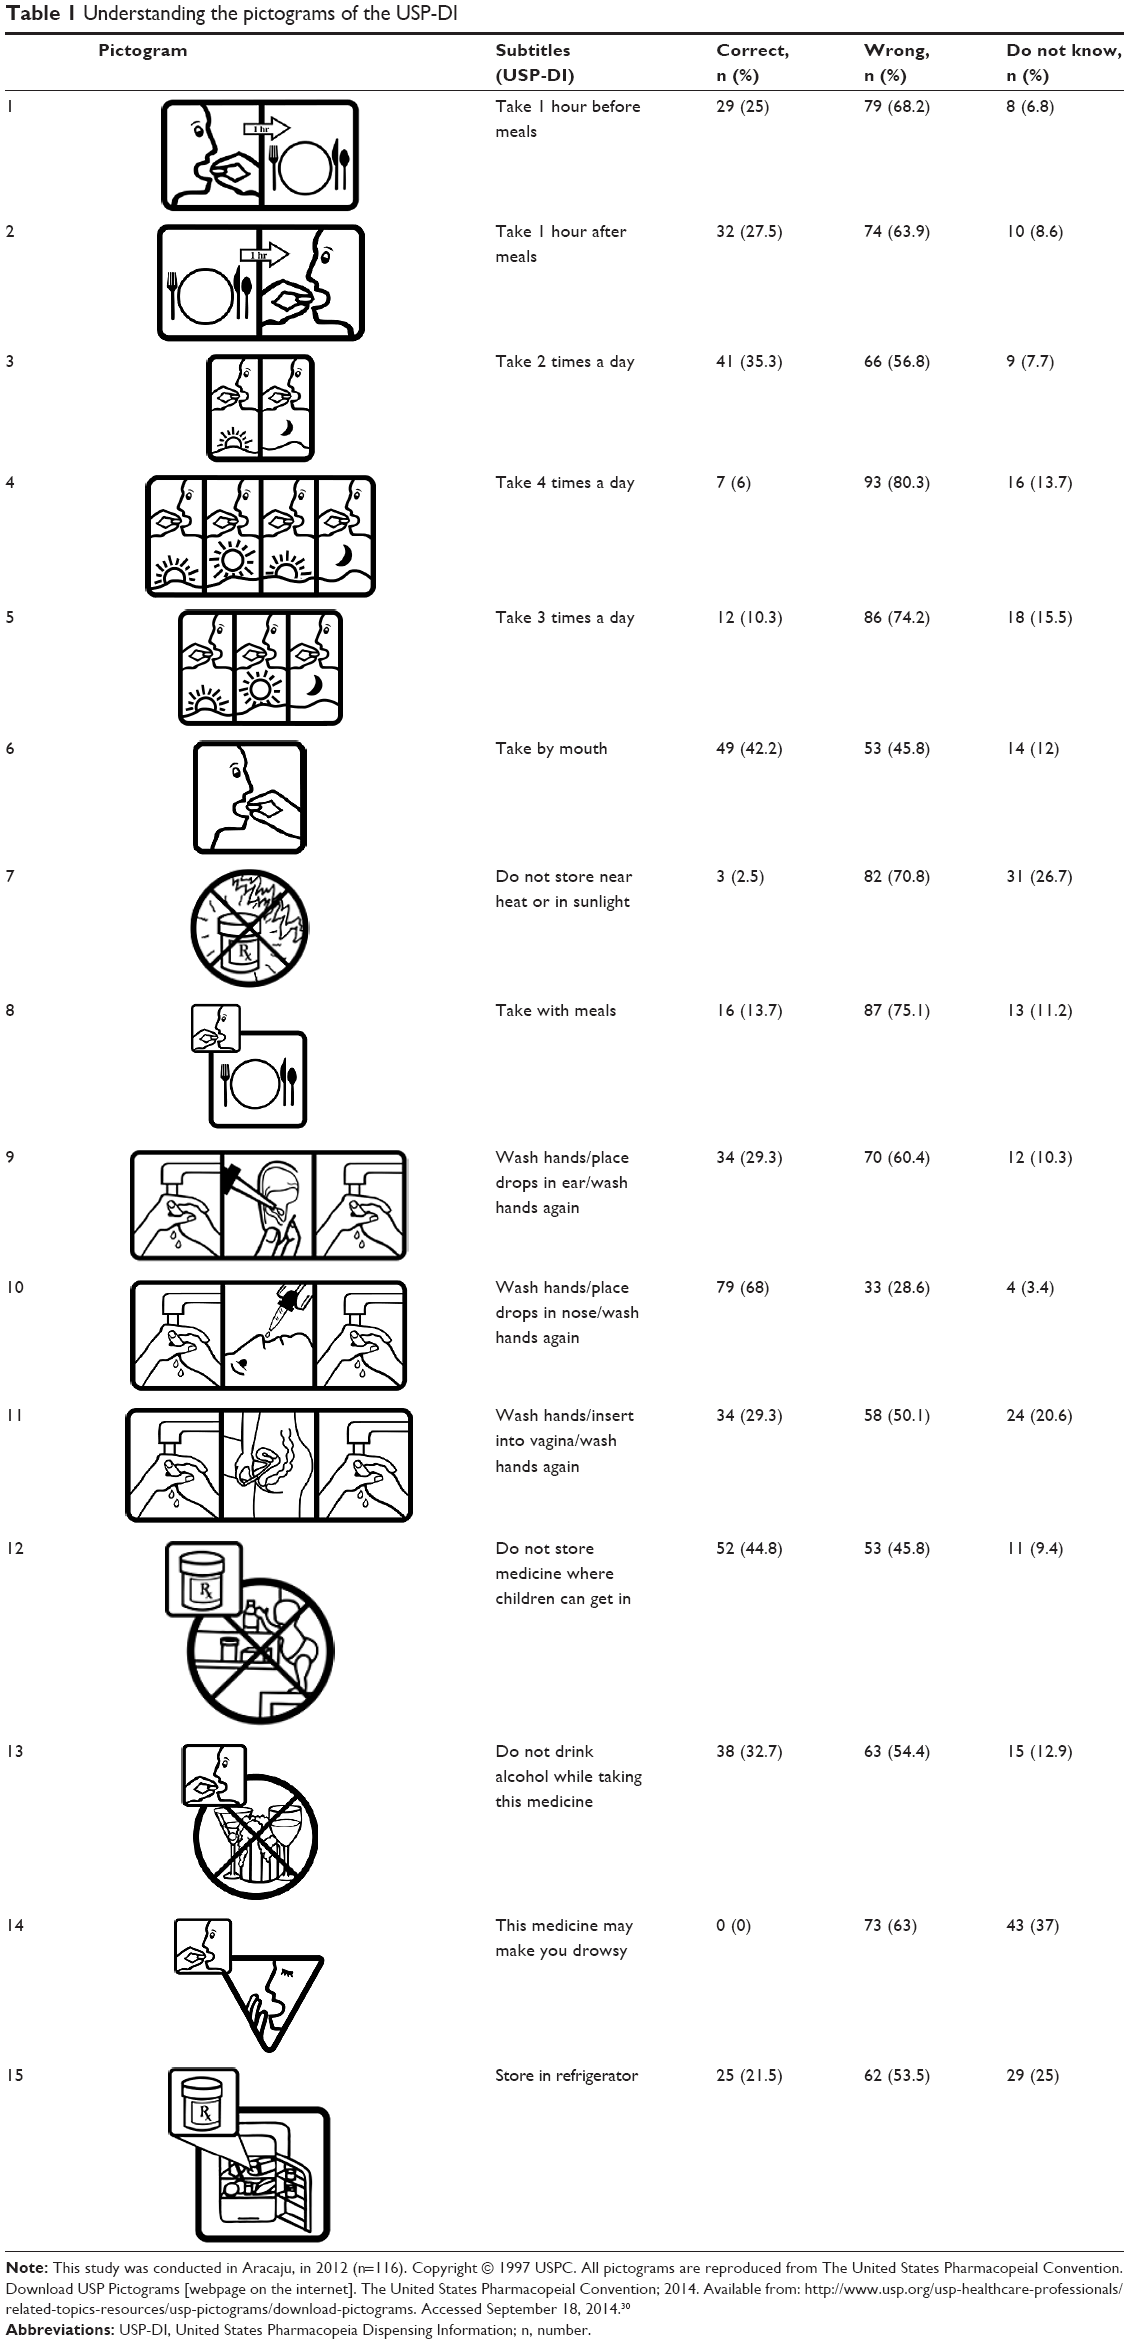 | Table 1 Understanding the pictograms of the USP-DI |
The participants were informed that the pictograms had something to do with the use of prescription drugs, but they did not receive prior explanations about the significance of each one. Furthermore, the pictograms were presented without their accompanying subtitles. The respondents were asked to report how they interpreted each image by answering the question, “If you had to take a prescription drug and the usage information was represented by this figure, what would you understand?” The interviews were transcribed for further evaluation.
After this process, the two researchers independently assessed the participants’ interpretations as either correct or incorrect. Discrepancies in coding were resolved by consensus after discussion. The ISO 3864 (1984) provides guidelines regarding the rate of understanding to use as the criterion for assessing the quality of a pictogram.14 According to the guidelines of the ISO 3864, pictograms are considered understandable when at least 67% of the sample’s answers concerning these images are correct.
Statistical analysis
The data were analyzed using the programs BioEstat 5.0 and Epi Info for Windows version 3.3. Correct interpretations of pictograms were examined in relation to participant educational level, age, and income. To evaluate the statistical significance of the associations between these variables and pictogram understanding, either the Mantel–Haenszel chi-square test or Fisher’s exact test was used. For all statistical tests, 95% confidence intervals were calculated and P<0.05 was used as the threshold for statistical significance.
Ethical considerations
This study was approved by the Ethics Committee in Research of the University Hospital of the Federal University of Sergipe. All participants were informed of the goals and nature of the research and signed a Free and Informed Consent form prior to participation, in accordance with the National Ethics Committee Resolution number 196/96.
Results
Pictogram understanding
A total of 125 individuals were interviewed regarding their understanding of the pictograms. Of these, nine were excluded: six whose health problems did not allow them to fully participate; and three who were not within the predetermined age range. Thus, the final sample comprised 116 participants. Pictograms were presented in locations previously chosen by the researchers to allow access to groups of the elderly with the degree of heterogeneity desired for the study.
Regarding sex, 88.7% of the participants were female. Their ages ranged from 60–90 years, with 68% of the respondents being between 60 years and 75 years old. Relating to education, 24% had completed secondary education (ie, they had up to 12 years of education), 3.4% had not completed high school, 12% had completed higher education, 12.9% had completed primary education, 21.5% had not completed primary education, 7.7% had only early childhood education, and 13.7% had not had any schooling. Regarding income, 60.3% of participants reported earning between zero and three times the minimum wage.
Most of the participants did not understand most of the USP-DI pictograms selected for this study. The proportion of correct responses ranged from 0%–68%, and the proportion of wrong answers ranged from 28.6%–80.3% (Table 1). Only for pictogram 10 was the comprehension level >67% (68% understanding), indicating that that pictogram is comprehensible for the target population of the municipality, according to the ISO 3864 standard.
Relationship between sociodemographic characteristics and understanding of the pictograms
Statistical analyses showed the following statistically significant associations: age group was associated with understanding for pictograms 3, 11, 12, and 13 (Table 2); income was associated with understanding for pictograms 10, 12, 13, and 15 (Table 3); and educational level was associated with understanding for pictogram 12 (Table 4).
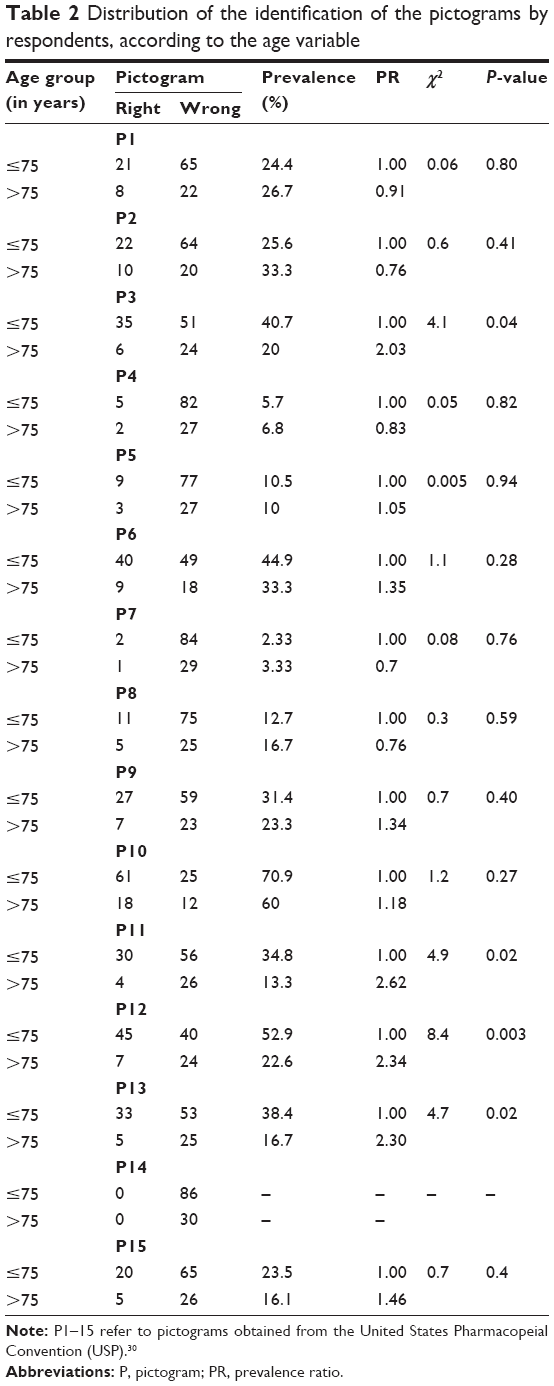 | Table 2 Distribution of the identification of the pictograms by respondents, according to the age variable |
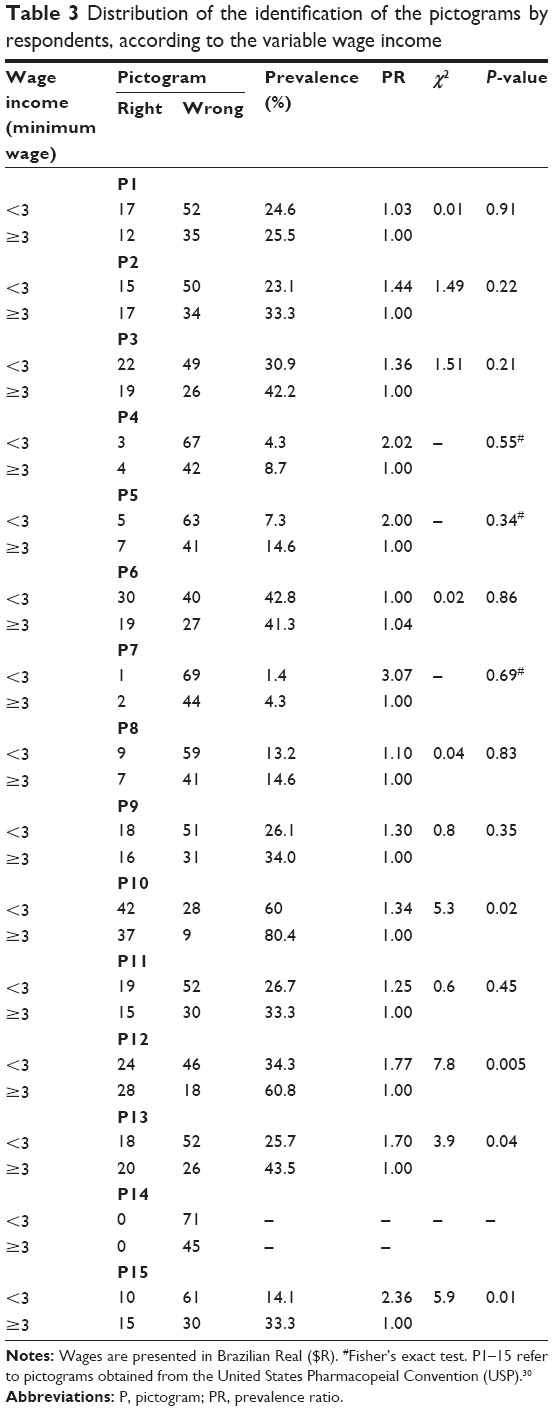 | Table 3 Distribution of the identification of the pictograms by respondents, according to the variable wage income |
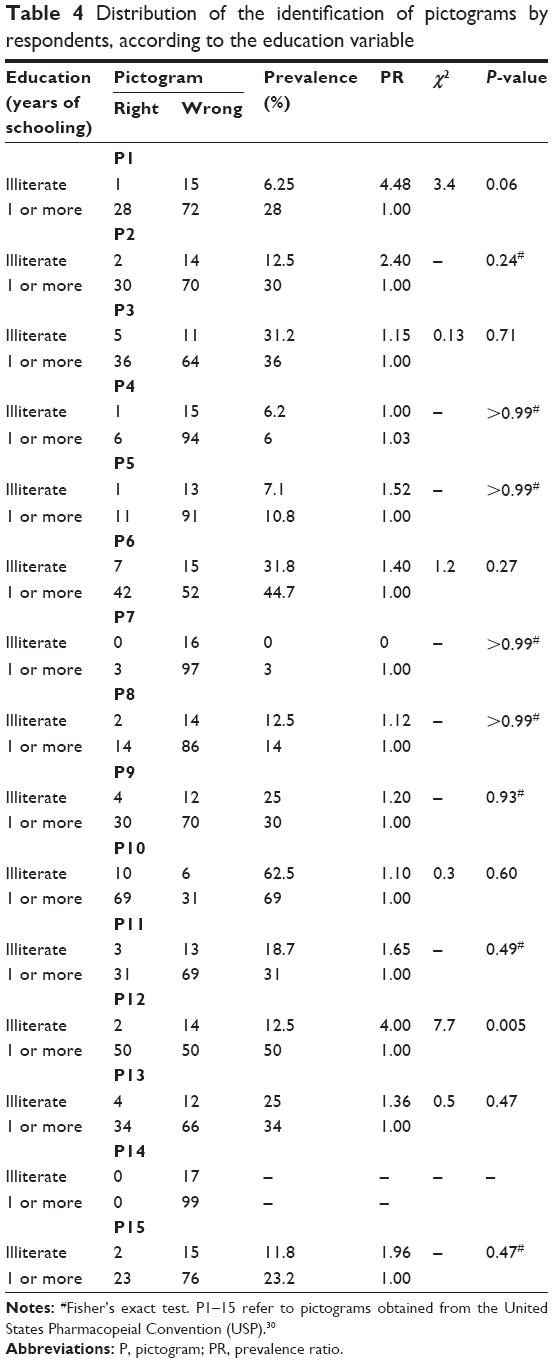 | Table 4 Distribution of the identification of pictograms by respondents, according to the education variable |
Table 2 shows that the probability of a correct answer for pictogram 3 was 2.03 times higher among the younger participants than among those over 75 years old (χ2=4.9; P<0.05). With regard to pictogram 11, according to Fisher’s exact test (P<0.05), individuals who were 75 years old or younger were 2.62 times more likely to interpret it correctly. Individuals 75 years old or younger were 2.34 times more likely to interpret pictogram 12 correctly (χ2=13.26; P<0.05). Regarding pictogram 13, individuals 75 years old or younger were 2.3 times more likely to interpret it correctly than those older than 75 years (χ2=3.95; P<0.05). Thus, according to the results presented in this table, elderly adults aged 75 years or younger are more likely to correctly interpret the pictograms, possibly because they have smaller declines in cognitive abilities and memory, compared to those over 75 years old.
Table 3 shows that individuals with incomes equal to or more than three times the minimum wage were 1.34 times more likely to correctly interpret pictogram 10 than those with incomes less than three times the minimum wage (χ2=7.34; P<0.05). With regard to pictogram 12, individuals with incomes greater than or equal to three times the minimum wage were 1.77 times more likely to interpret it correctly (c2=7.8; P<0.05). With regard to pictogram 13, individuals with incomes greater than or equal to three times the minimum wages were 1.70 times more likely to interpret it correctly. Regarding pictogram 15, individuals with wage incomes greater than or equal to three times the minimum wage were 2.36 times more likely to correctly interpret this pictogram (c2=5.9; P≤0.05). A statistically significant association was found between income and the correct interpretation of these pictograms, probably because those with higher incomes tended to have more education.
The analysis showed a statistically significant association between education and identification in pictogram 12 (Table 4). Therefore, individuals with 1 or more years of study were four times more likely to correctly interpret this pictogram than those who were illiterate. Thus, it appears that people who are illiterate are generally more likely to have difficulties with the types of materials used in health care services, including materials provided in written form, such as prescriptions, leaflets, and other educational materials, as well as materials that use images, when compared to people with at least 1 year of schooling. Thus, low literacy seems to be a significant barrier to the comprehension of information regarding medicines, and also to the achievement of positive health outcomes.
Qualitative analysis of the understanding of the USP-DI pictograms
According to the criteria of understanding adopted in this study, only pictogram 10, whose message is “Wash hands/place drops in nose/wash hands again”, is adequate for fulfilling its purpose. However, in some cases, the failures of specific pictograms to meet the adequacy criteria were a result of cultural factors. One example is pictogram 13, which indicates, “Do not drink alcohol while taking this medicine”, a message that only 32.7% of the sample understood. In the comprehension test, many of the respondents said that the pictogram indicated “Do not take the medicine with water” because of the presence of a cup, which was meant to refer to wine and champagne. However, if this pictogram were designed featuring a bottle of beer to refer to the alcoholic drink, it would have been better understood by the participants, as it would reflect the national culture.
Pictogram 14, whose message is, “This medicine may make you drowsy”, produced the lowest level of understanding (0%). According to the criteria of ISO 3864, this percentage indicates that the pictogram is totally unreadable. Only 6% of the responses to pictogram 4 were considered correct. Many of the participants (24.1%) responded that the message would be, “Take the medication in the morning, noon, afternoon, and evening”. The pictogram shows the sunrise (morning), noontime sun, the sunset (afternoon), and the moon (night). However, we chose not to consider this as the correct interpretation because the schedules the respondents had in mind may not have conformed to those intended by the prescriptions.
Discussion
Testing individual pictograms on the target population before they are really put to use is an essential factor for successful outcomes in programs using pictograms.15–17 These pictograms should be used cautiously, and they should be assessed before they are widely implemented to verify if they are understandable. Pictograms that do not meet the comprehension criteria or that seem ambiguous should not be used without being redrawn and retested.4,15 After their comprehensibility and effectiveness are verified, pictograms can be effectively used to reinforce previously presented information.18
Our results showed that the pictograms from the USP-DI that were selected for this study do not tend to be well understood by elderly people in Brazil, as only one pictogram reached the understanding criterion of ISO 3864.14 For elderly people, complexity in a prescription reduces their ability to correctly interpret the instructions of a pharmacotherapeutic regimen. Consequently, adherence to the treatment regimen is likely to be reduced, the disease diagnosed is likely to worsen, and the morbidity and mortality of patients is likely to increase, leading to increased rates of hospitalization and increased health care costs.18 Furthermore, when there is low literacy among the patients, declines in cognitive abilities and memory, as well as vision problems, this problem becomes even more serious because it is more difficult for the patients to understand essential information.
Our finding that the pictograms are not always well understood is consistent with those of other studies.19–22 Research has shown that pictograms should not be used as the sole source of communication, as they do not convey enough detail.6,23,24 Dowse et al demonstrated that these pictograms are effective for improving participants’ understanding and recall when combined with text and verbal instructions.11 Therefore, in clinical practice, pictograms must be accompanied by verbal and written information to avoid possible interpretation problems, which can cause medication errors.
Research suggests that pictograms are better understood when the culture of the target population is taken into account in their design. Sampaio et al25 reported that both local and cultural factors are important for the interpretation of pictograms, so much so that pictograms that have a clear meaning in one country or culture can be incomprehensible elsewhere. In short, the few studies that have compared the understanding and acceptance of locally produced pictograms with those of the USP-DI have demonstrated that patients not only prefer, but also are more likely to correctly interpret, local pictograms, as they reflect local culture aspects and beliefs.26–29 In light of this, pictograms should be adapted to local cultures, beliefs, attitudes, and expectations, and they should be carefully explained to patients to encourage the patient to actively participate in his/her treatment.
In our study, we found that the variables of age group and wage income were significantly associated with the understanding of some pictograms. Previous studies have shown that elderly patients with low literacy levels and low wage incomes are at risk of not understanding prescription information and, consequently, of not adhering to their treatment regimens.18,21 Hanson and Hartzema20 evaluated the use of pictograms in elderly patients with low literacy levels and found that these pictograms were not beneficial for the acquisition and understanding of information about the use of prescription drugs. Thus, elderly patients should be given clear guidance that is always accompanied by verbal instructions or supplementary texts.
Our results demonstrate a statistically significant association between educational level and understanding for one of the USP-DI pictograms. Several studies have reported an association between low literacy levels and problems related to prescription drug use.6,11,28,29 According to Kassam et al19 the ability to understand the information expressed in visual pictograms depends on the level of literacy. According to the authors, people with insufficient levels of education have greater difficulties in decoding visual presentations. On the other hand, people with basic educational levels are likely to use previous visual experiences in decoding graphical meanings.19 Accordingly, the International Pharmaceutical Federation has stated that it is necessary to invest in research to assess the use of pictograms in patients with low literacy levels or no schooling.10
Conclusion
Most of the USP-DI pictograms assessed in this study were not well understood by the elderly participants. Of all the pictograms selected for the comprehension test, only one satisfied the criteria established by the ISO 3864 standard. With regard to the relationship between sociodemographic characteristics and understanding, a statistically significant association was observed between the variables “age group”, “income”, and “education” and the understanding of some pictograms. The pictograms that did not reach the comprehension criteria should be redrawn for the local culture and retested. Thus, it is concluded that there is a need to design new, culturally adapted pictograms and to validate them to enable their use in a geographically large country with distinct regional characteristics, such as Brazil.
Limitations
Many of the participants in our study were not users of prescription drugs and, therefore, had no personal interest in the information presented in the pictograms. Another limitation is that the pictograms were not presented in combination with verbal information. Moreover, the sample included participants from only one state in the country and, therefore, the results cannot be generalized to other regions of Brazil.
Disclosure
The authors report no conflicts of interest in this work.
References
Kessels RP. Patients’ memory for medical information. J R Soc Med. 2003;96(5):219–222. | ||
Liu CJ, Kemper S, McDowd J. The use of illustration to improve older adults’ comprehension of health-related information: is it helpful? Patient Educ Couns. 2009;76(2):283–288. | ||
Davis TC, Federman AD, Bass PF 3rd, et al. Improving patient understanding of prescription drug label instructions. J Gen Intern Med. 2009;24(1):57–62. | ||
Galato F, Just MC, Galato D, Silva WB. Desenvolvimento e validação de pictogramas para o uso correto de medicamentos: descrição de um estudo-piloto [Development and validation of pictograms for the correct use of drugs: report of a pilot study]. Acta Farm Bom. 2006;25(1):131–138. Portuguese. | ||
Sorfleet C, Vaillancourt R, Groves S, Dawson J. Design, development and evaluation of pictographic instructions for medications used during humanitarian missions. C Pharm J (Ott). 2009;142(2):82–88. | ||
Dowse R, Ehlers MS. The evaluation of pharmaceutical pictograms in a low-literate South African population. Patient Educ Couns. 2001;45(2):87–99. | ||
IBGE [homepage on the Internet]. Synthesis of social indicators, an analysis of the conditions of life of the Brazilian population. Rio de Janeiro, Brazil. 2010. Available from: http://www.ibge.gov.br/home/estatistica/populacao/condicaodevida/indicadoresminimos/sinteseindicsociais2013/. Accessed September 30, 2014. Portuguese. | ||
Ministry of Health, National Health Council - Brasilia. Efetivando o SUS: Acesso, Qualidade e Humanização na atenção à Saúde, com Controle Social, 2000 – Relatório Final [Brazil speaking as want to be treated: effecting the NHS: access, quality and humanization in health care with social control.]. 11th National Conference on Health; December 15–19, 2000; Brazil. Ministry of Health; 2001. Portuguese. | ||
World Health Organization. Report of a third WHO consultative group on the role of the pharmacist. The role of the pharmacist in the health care system, preparing the future pharmacist: curricular development. Vancouver:World Health Organization; 1997. | ||
International Pharmaceutical Federation [webpage on the Internet]. MEPS pictogram project. [updated May 23, 2013; cited August 10, 2013]. International Pharmaceutical Federation. Available from: https://www.fip.org/pictograms. Accessed September 20, 2013. | ||
Dowse R, Ramela T, Browne SH. An illustrated leaflet containing antiretroviral information targeted for low-literate readers: development and evaluation. Patient Educ Couns. 2011;85(3):508–515. | ||
Vaillancourt R, Dawsn J, Pascuet E, Grenier S. International pictogram project for the labelling of medication. Can J Hosp Pharm. 2011;64(1):82–86. | ||
International Organization for Standardization. Graphical Symbols – Test Methods – Part 1: Methods for Testing Comprehensibility. ISO 9186-1. Geneva, Switzerland: International Organization for Standardization; 2007. | ||
International Organization for Standardization. International Standards for Safety Colours and Safety Signs. ISO 3864. Geneva, Switzerland: International Organization for Standardization; 1984. | ||
Hämeen-Anttila K, Kemppainen K, Enlund H, Bush Patricia J, Marja A. Do pictograms improve children’s understanding of medicine leaflet information? Patient Educ Couns. 2004;55(3):371–378. | ||
Kalsher MJ, Wogalter MS, Racicot BM. Pharmaceutical container labels: enhancing preference perceptions with alternative designs and pictorials. Int J Ind Ergon. 1996;18(1):83–90. | ||
Ngoh LN, Shepherd MD. Design, development, and evaluation of visual aids for communicating prescription drug instructions to nonliterate patients in rural Cameroon. Patient Educ Couns. 1997;31(3):245–261. | ||
Katz MG, Kripalani S, Weiss BD. Use of pictorial aids in medication instructions: a review of the literature. Am J Health Syst Pharm. 2006;63(23):2391–2397. | ||
Kassam R, Vaillancourt R, Collins JB. Pictographic instructions for medications: do different cultures interpret them accurately? International Journal of Pharmacy Practice. 2004;12(4):199–209. | ||
Hanson EC, Hartzema A. Evaluating pictograms as an aid for counseling elderly and low-literate patients. J Pharm Mark Manage. 1995;9(3):41–54. | ||
Dowse R, Ehlers MS. The influence of education on the interpretation of pharmaceutical pictograms for communicating medicine instructions. International Journal of Pharmacy Practice. 2003;11(1):11–18. | ||
Davies S, Haines H, Norris B, Wilson JR. Safety pictograms: are they getting the message across? Appl Ergon. 1998;29(1):15–23. | ||
Mansoor LE, Dowse R. Effect of pictograms on readability of patient information materials. Ann Pharmacother. 2003;37(7–8):1003–1009. | ||
Knapp P, Raynor DK, Jebar AH, Price SJ. Interpretation of medication pictograms by adults in the UK. Ann Pharmacother. 2005;39(7–8):1227–1233. | ||
Sampaio LF, Lima da Silva LM, Velho GCC, Martins MGG, Castilho SR, Altenburg SP. [Pictograms as a medical prescription language comprehension]. Rev Bras Farm. 2008;89(2):150–154. Portuguese. | ||
Grenier S, Vaillancourt R, Pynn D, et al. Design and development of culture-specific pictograms for the labelling of medication for first nation communities. Journal of Communications in Healthcare. 2011;4(4):238–245. | ||
Goel G. A comparative study to evaluate patients interpretation of USP and locally designed pharmaceutical pictograms. Pharma Times. 2010;42(6):16–19. | ||
Mwingira B, Dowse R. Development of written information for antiretroviral therapy: comprehension in a Tanzanian population. Pharm World Sci. 2007;29(3):173–182. | ||
Braich PS, Almeida DR, Hollands S, Coleman MT. Effects of pictograms in educating 3 distinct low-literacy populations on the use of postoperative cataract medication. Can J Ophthalmol. 2011;46(3):276–281. | ||
Download USP Pictograms [webpage on the internet]. The United States Pharmacopeial Convention; 2014. Available from: http://www.usp.org/usp-healthcare-professionals/related-topics-resources/usp-pictograms/download-pictograms. Accessed September 18, 2014. |
 © 2014 The Author(s). This work is published and licensed by Dove Medical Press Limited. The full terms of this license are available at https://www.dovepress.com/terms.php and incorporate the Creative Commons Attribution - Non Commercial (unported, v3.0) License.
By accessing the work you hereby accept the Terms. Non-commercial uses of the work are permitted without any further permission from Dove Medical Press Limited, provided the work is properly attributed. For permission for commercial use of this work, please see paragraphs 4.2 and 5 of our Terms.
© 2014 The Author(s). This work is published and licensed by Dove Medical Press Limited. The full terms of this license are available at https://www.dovepress.com/terms.php and incorporate the Creative Commons Attribution - Non Commercial (unported, v3.0) License.
By accessing the work you hereby accept the Terms. Non-commercial uses of the work are permitted without any further permission from Dove Medical Press Limited, provided the work is properly attributed. For permission for commercial use of this work, please see paragraphs 4.2 and 5 of our Terms.