")
Back to Journals » Infection and Drug Resistance » Volume 14
Undernutrition and Treatment Success in Drug-Resistant Tuberculosis in Uganda
Authors Baluku JB , Namiiro S, Nabwana M, Muttamba W , Kirenga B
Received 1 August 2021
Accepted for publication 2 September 2021
Published 9 September 2021 Volume 2021:14 Pages 3673—3681
DOI https://doi.org/10.2147/IDR.S332148
Checked for plagiarism Yes
Review by Single anonymous peer review
Peer reviewer comments 2
Editor who approved publication: Prof. Dr. Héctor Mora-Montes
Joseph Baruch Baluku,1,2 Sharon Namiiro,2 Martin Nabwana,3 Winters Muttamba,2 Bruce Kirenga2
1Division of Pulmonology, Kiruddu National Referral Hospital, Kampala, Uganda; 2Research and Innovation Department, Makerere University Lung Institute, Kampala, Uganda; 3Quality Management Division, Makerere University – Johns Hopkins University Research Collaboration, Kampala, Uganda
Correspondence: Joseph Baruch Baluku
Kiruddu National Referral Hospital, Kampala, Uganda
Tel +256706327972
Email [email protected]
Background: Undernutrition is associated with unfavourable treatment outcomes among people with drug-resistant tuberculosis (DRTB). Factors influencing the treatment outcomes among undernourished people with DRTB are not well characterised. The aim of this study was to determine factors associated with treatment success among undernourished people with DRTB in Uganda.
Methods: We analysed data from a retrospective cohort of people with DRTB from 16 treatment sites in Uganda. We included participants with a pre-treatment body mass index (BMI) of < 18.5 kilograms/meters2 (kg/m2). Participants were categorised as having mild (BMI of 18.5– 17 kg/m2), moderate (BMI of 16.9– 16.0 kg/m2) or severe (BMI of < 16.0 kg/m2) undernutrition. We performed logistic regression analysis to determine factors associated with treatment success.
Results: Among 473 people with DRTB, 276 (58.4%) were undernourished (BMI < 18.5 Kg/m2) and were included in the study. Of these, 92 (33.3%) had mild, 69 (25.0%) had moderate and 115 (41.7%) had severe undernutrition. The overall treatment success rate (TSR) for the undernourished was 71.4% (n = 197). Although the TSR was similar among participants with mild (71.7%), moderate (78.3%) and severe (67.0%) undernutrition (p = 0.258), all treatment failure cases (n =6) were among participants with severe undernutrition (p = 0.010). Cigarette smoking (odds ratio (OR) = 0.19, 95% CI 0.07– 0.47, p < 0.001), urban residence (OR = 0.31, 95% CI 0.14– 0.70, p = 0.005) and moderate (OR = 0.14, 95% CI 0.06– 0.35, p < 0.001) and severe anaemia (OR = 0.06, 95% CI 0.01– 0.29, p = 0.001) were associated with lower odds of treatment success.
Conclusion: Most undernourished people with DRTB have severe undernutrition. Smoking and anaemia are modifiable factors which upon appropriate intervention could improve treatment success. The effect of urban residence on the TSR needs to be evaluated further.
Keywords: MDR TB, undernutrition, malnutrition, drug resistant, tuberculosis, anaemia
Background
About 10 million cases of tuberculosis (TB) occurred in 2019.1 While the End TB strategy aims to reduce new TB cases by 90% and TB deaths by 95% between 2015 and 2035, most high-burdened countries are not on course to achieve these targets.2,3 Moreover, the emergence of drug-resistant tuberculosis (DRTB) is a threat to the global TB control efforts. About 19 million people are estimated to have latent multidrug-resistant tuberculosis (MDRTB) infection globally.4 In 2019, half-a-million people developed rifampicin resistant/MDR TB and the treatment success rate (TSR) was only 57% for the 2017 cohort.1 Concerted efforts are needed to reduce TB cases and deaths for us to realise the End TB strategy.
Undernutrition accounts for almost half of the TB cases attributed to the five major risk factors of TB: undernutrition, HIV infection, alcohol, smoking and diabetes.4 A body mass index (BMI) of < 18.5 kilograms/meters2 is a cheap and reproducible measure of undernutrition used among adults with TB.5–7 The relationship between TB and undernutrition is bidirectional. On the one hand, undernutrition affects innate and adaptive immune responses by impairing phagocytosis, antigen presentation and functions of the complement system.8 Consequently, undernutrition increases the risk of developing TB in individuals with and without HIV co-infection.9,10 Conversely, nutritional supplementation accelerates sputum smear and culture conversion when given alongside TB therapy.11,12 On the other hand, TB can cause undernutrition by modulating the appetite mediators; leptin and ghrelin.13 Because of this bi-directional relationship, the prevalence of undernutrition in people with TB in low-income settings is high (30–80%).7,14,15 There are growing calls to address the problem of undernutrition to reduce TB incidence at population level and to improve treatment outcomes among people with active TB.16
In DRTB, undernutrition is associated with unfavourable treatment outcomes across several cohorts in low-, middle - and high-income countries.17–27 Moreover, undernutrition is associated with TB relapse and mortality even after DRTB treatment completion.28 Unfortunately, few studies have explored factors associated with unfavourable treatment outcomes in undernourished people with DRTB, yet the prevalence of undernutrition in DRTB is high (35–65%), particularly in sub-Saharan Africa.26,29,30
The prevalence of undernutrition in DRTB in Uganda is not well documented. However, the prevalence of undernutrition in TB was estimated to be 46% at a national referral hospital in Uganda.31 The objective of this study was to determine factors associated with treatment success among undernourished people with DRTB in Uganda, a TB and TB/HIV high-burdened country.32
Methods
Study Setting and Population
We performed a secondary analysis of data from a large retrospective cohort33 of people with DRTB from 16 DRTB treatment sites in Uganda. We included people with laboratory confirmed DRTB, a treatment outcome documented between 2013 and 2019 and undernutrition defined as a pre-treatment BMI of < 18.5 kg/m2. DRTB was confirmed by either the Xpert MTB/RIF® assay and/or a culture-based phenotypic drug susceptibility test performed at the treatment sites and the National Tuberculosis Reference Laboratory, respectively. Participants in the primary study were drawn from 16 DRTB treatment sites in Uganda comprising of one national referral hospital, 11 regional referral hospitals and four district hospitals. The management of DRTB in Uganda during the period under evaluation is described elsewhere.33–35
Study Measurements
Sociodemographic and clinical data were extracted from the participants’ charts using a data abstraction form. Sociodemographic variables collected included year of enrolment in care, age, sex, employment status, level of hospital (national referral, regional referral, and district hospitals), residence (rural and urban), marital status and any history of alcohol and/or cigarette use. Clinical characteristics included the baseline weight and height, history of previous TB treatment, HIV serological status, other comorbidities (cancer, hearing impairment, heart failure, hypertension and diabetes mellitus), haemoglobin, hepatic transaminase and creatinine levels, TB resistance profiles, time from diagnosis to treatment initiation, number and type of drugs in the DRTB treatment regimen, treatment duration, time to sputum culture conversion, and treatment outcomes. Anaemia was defined as a haemoglobin level of <13.0 grams per decilitre (g/dl) for males and <12.0 g/dl for females. Anaemia was further graded as mild (11.0–12.9 g/dl for men and 11.0–11.9 g/dl for females), moderate (8.0–10.9 g/dl for both sexes) and severe (<8.0 g/dl for both sexes).36 The BMI was calculated by dividing the weight in kilograms by the square of height in metres. Participants were categorised as having mild (BMI of 18.5–17 kg/m2), moderate (BMI of 16.9–16.0 kg/m2) or severe (BMI of <16.0 kg/m2) undernutrition.37 Treatment success was the sum of TB cure and treatment completion as defined by the WHO.38 An unfavourable outcome was a composite of treatment failure, loss-to-follow-up and death. A full description of the study measurements is available from the primary study.33
Data Analysis and Sample Size Estimation
All participants in the primary study with undernutrition were included. Data were entered in EpiData 4.4.0 and analysed with STATA 16.0 (STATA, College Station, Texas, USA). Clinical and sociodemographic characteristics were compared among participants with mild, moderate and severe undernutrition using Pearson’s chi-square test or Fisher’s exact test for categorical variables and one-way analysis of variance for continuous variables. The median test was used to compare the medians across the different groups of undernutrition. We performed bivariable logistic regression analysis for factors associated with treatment success. All factors with p<0.2 were considered for the multivariable logistic regression model. We used stepwise backward regression, controlling for severity of undernutrition, to select variables for the final multivariable regression model for factors associated with treatment success. We also compared time to an unfavourable outcome between the three categories of undernutrition using Kaplan Meier survival curves.
Results
Of 1122 people with DRTB in the primary study, 473 had pre-treatment baseline BMI measurements. Of these, 276 (58.4%) were undernourished and were thus included in the study. Figure 1 shows the study flow diagram. There were no significant differences between participants with and without pre-treatment BMI measurement with regard to sex (p = 0.890), HIV co-infection (p = 0.052), grade of anaemia (p = 0.160), and smoking (p = 0.318). The two groups differed with regard to age (p = 0.003) and this was because nutritional assessment is by mid upper arm circumference and not BMI in most paediatric cases (< 15 years).
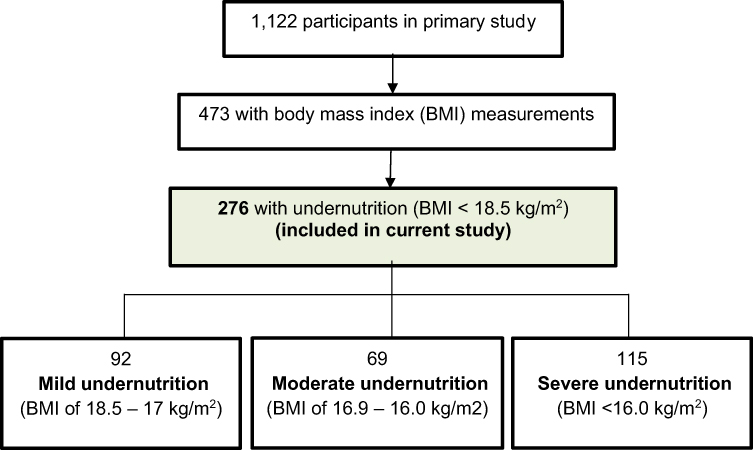 |
Figure 1 Study flow diagram. |
Characteristics of Undernourished People with DRTB in Uganda
Of 276 people with DRTB and undernutrition, 92 (33.3%) had mild, 69 (25.0%) had moderate and 115 (41.7%) had severe undernutrition. Among the participants, the mean (standard deviation (SD)) age was 39.0 (14) years, 179 (64.9%) were male, and 145 (52.5%) were co-infected with HIV.
People with severe undernutrition were more frequently managed at district hospitals (47.0%, p<0.001) and had higher frequency of baseline resistance to ethambutol (32.2%, p = 0.026) than people with moderate and mild undernutrition. People with moderate undernutrition had higher frequency of cigarette use (42.9%, p=0.005) and history of a previous TB episode (66.7%, p=0.039) than people with mild and severe undernutrition. Table 1 shows characteristics of people with DRTB with severe, moderate and mild undernutrition.
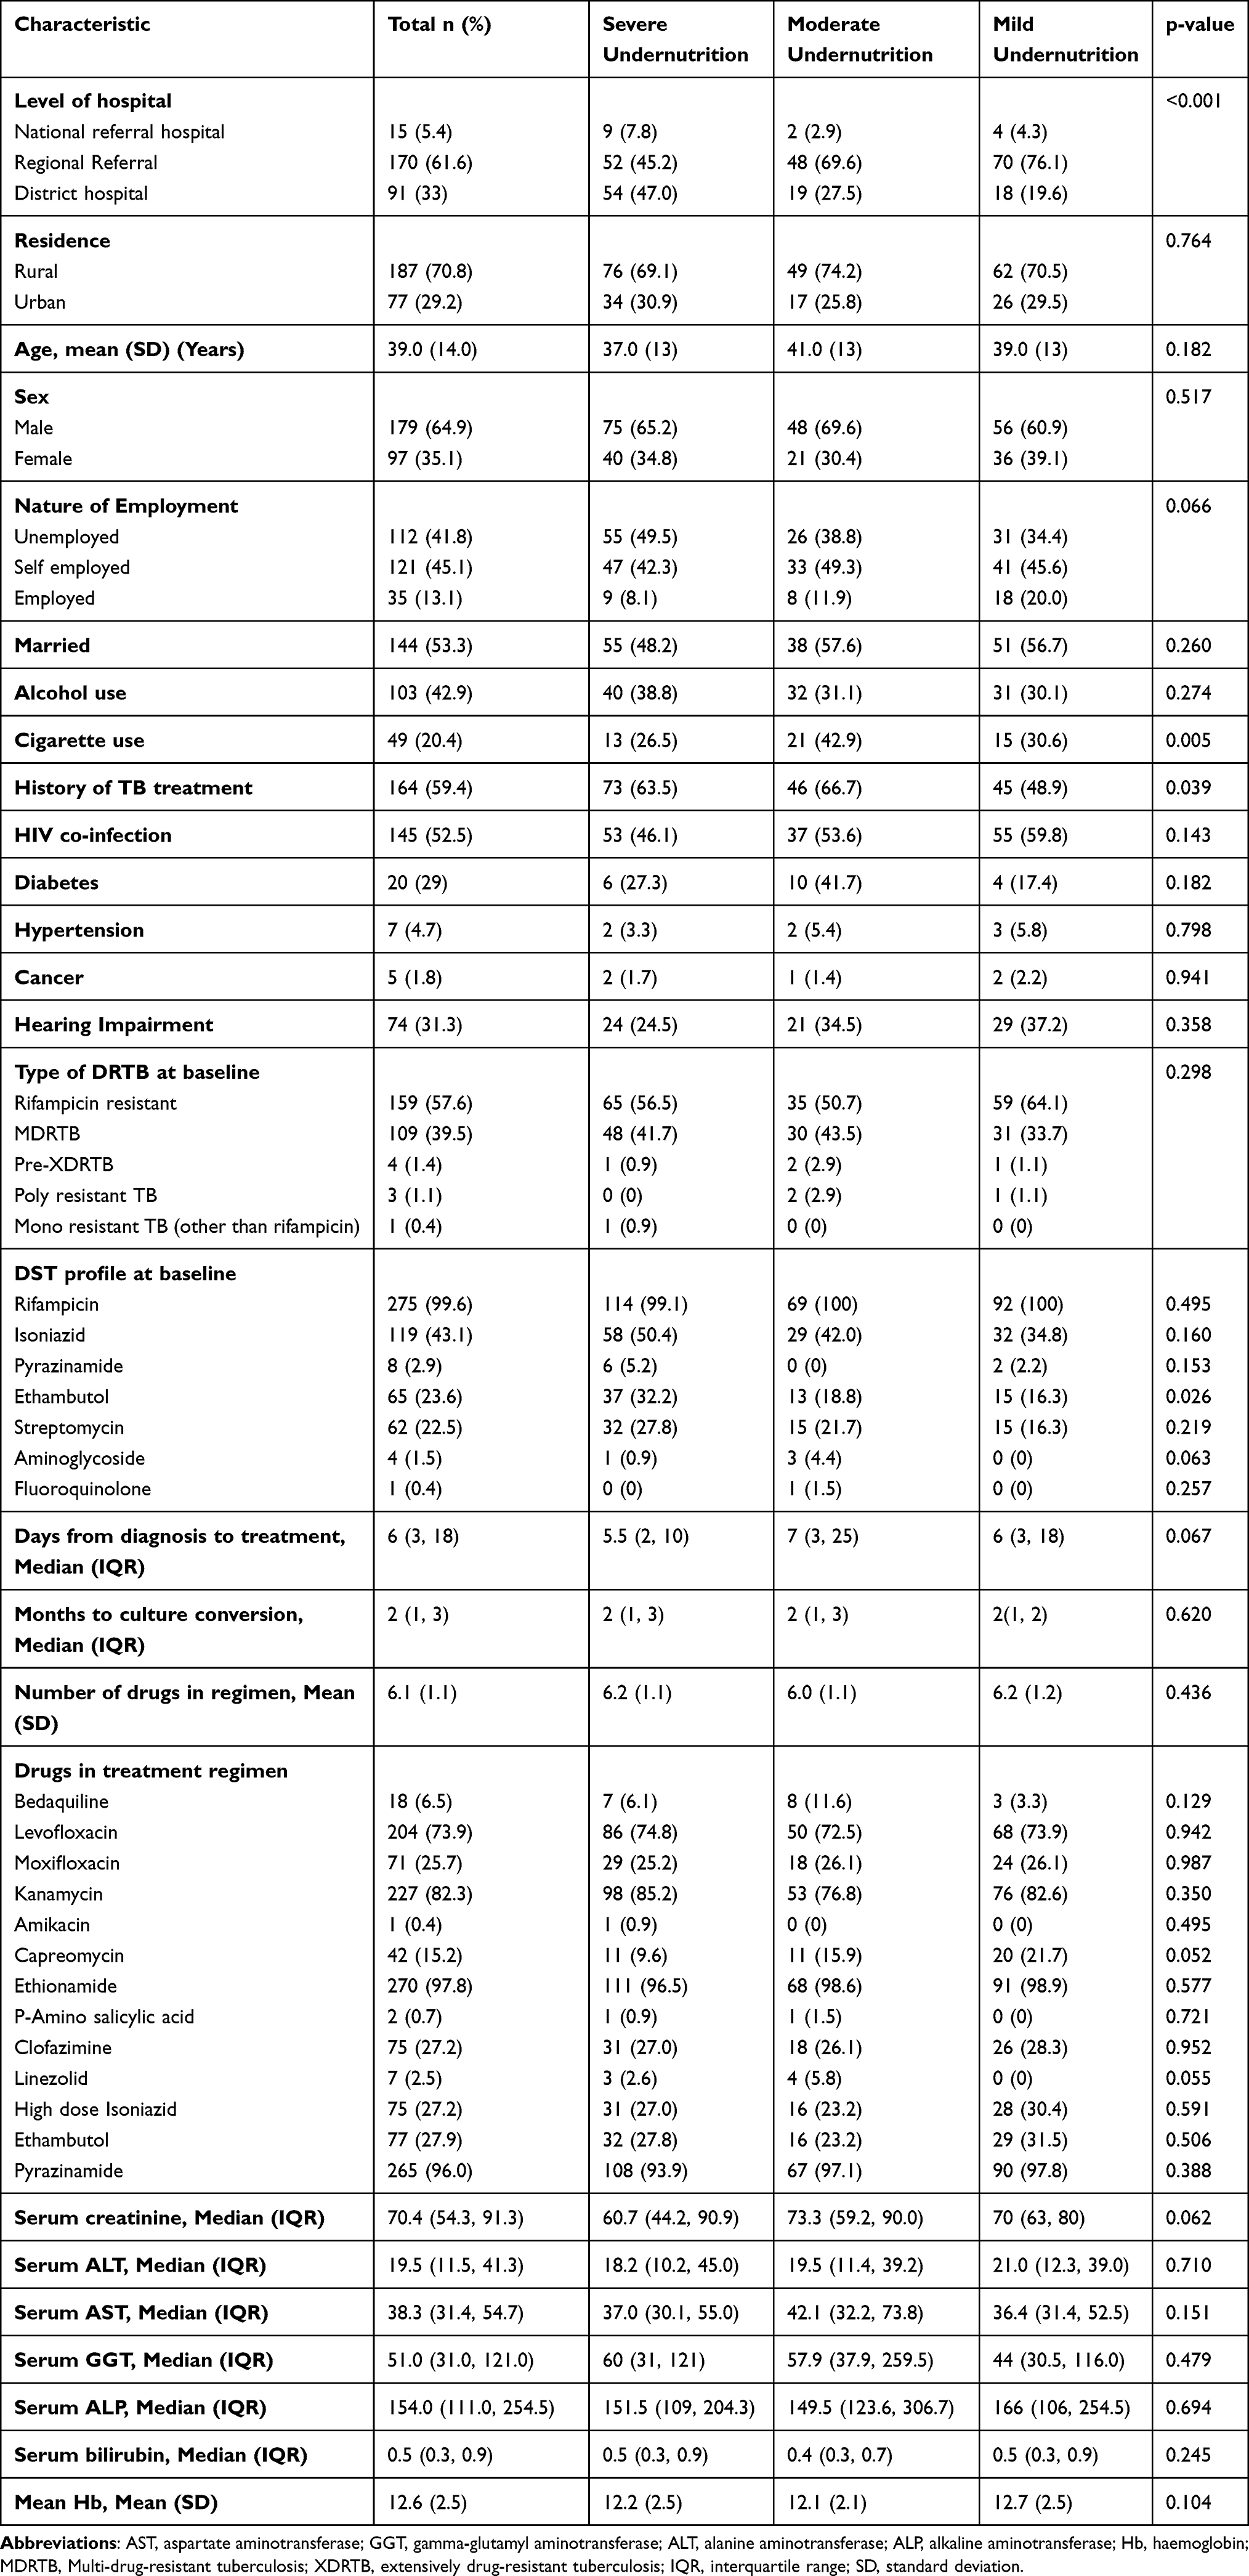 |
Table 1 Characteristics of People with DRTB with Severe, Moderate and Mild Undernutrition in Uganda |
Treatment Outcomes Among Undernourished People with DRTB in Uganda
The overall treatment success rate (TSR) was 71.4% (n = 197). Although the TSR was similar among people with DRTB and mild (71.7%), moderate (78.3%) and severe (67.0%) undernutrition (p = 0.258), all treatment failure cases (n = 6) were among people with severe undernutrition (p = 0.010). The overall (n = 79) median (95% CI) time to an unfavourable outcome (treatment failure, death and loss-to-follow-up combined) was 5 (2–7) months. There was no statistical difference in the median (95% CI) time to an unfavourable outcome in mild (2 (1.8–6) months), moderate (4 (0.6–7) months) and severe undernutrition (9 (3–11) months) (Pwilcoxon = 0.097). A Kaplan Meier survival curve is shown in Figure 2. Table 2 compares the individual treatment outcomes across mild, moderate and severe undernourished groups.
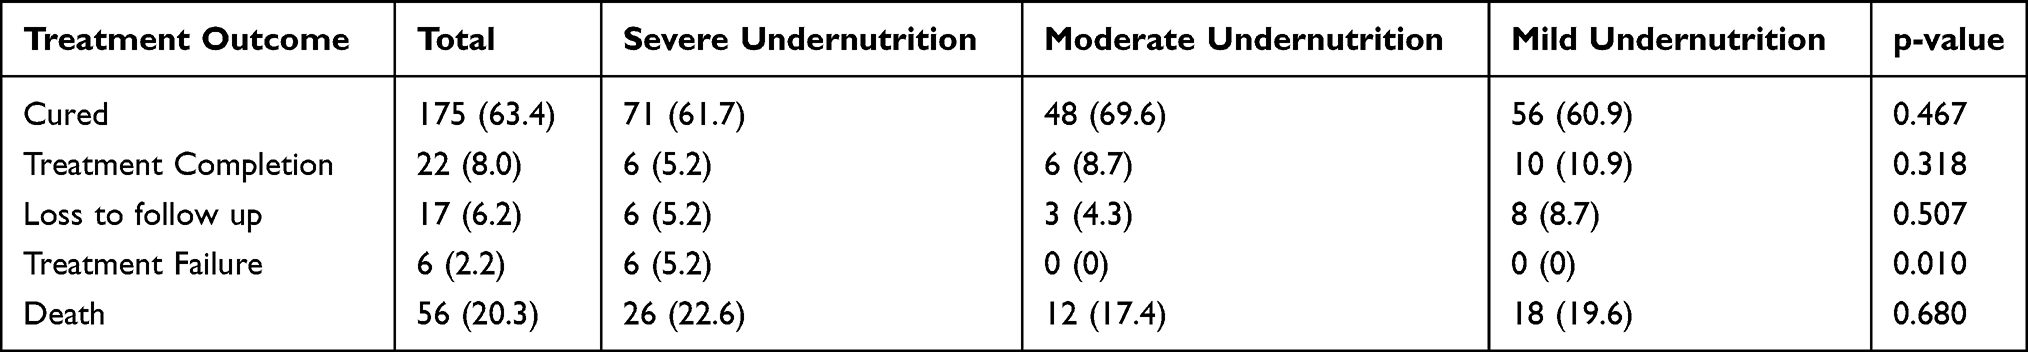 |
Table 2 A Comparison of Treatment Outcomes Among People with DRTB and Mild, Moderate and Severe Undernutrition |
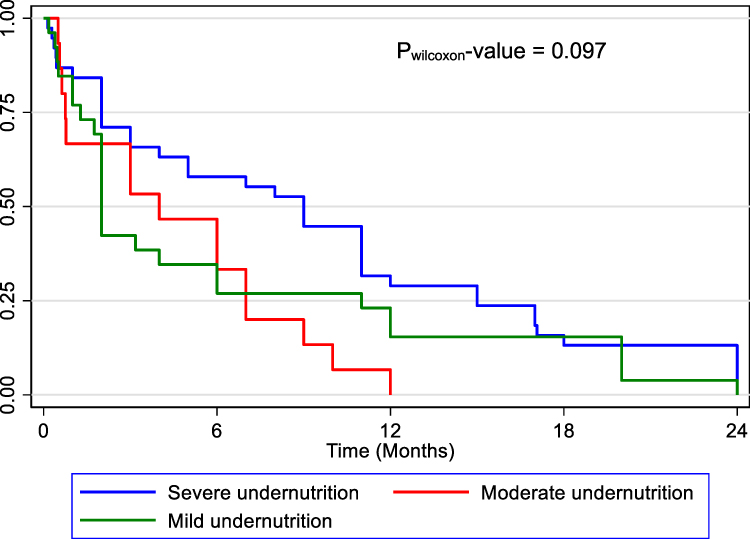 |
Figure 2 Kaplan Meier survival curve for time to unfavourable outcome among undernourished people with DRTB in Uganda. |
Factors Associated with Treatment Success Among Undernourished People with DRTB in Uganda
Cigarette smoking (odds ratio (OR) = 0.19, 95% CI 0.07–0.47, p < 0.001), urban residence (OR = 0.31, 95% CI 0.14–0.70, p = 0.005) and moderate (OR = 0.14, 95% CI 0.06–0.35, p < 0.001) and severe anaemia (OR = 0.06, 95% CI 0.01–0.29, p = 0.001) were associated with lower odds of treatment success. Table 3 shows a multivariable model for factors associated with treatment success.
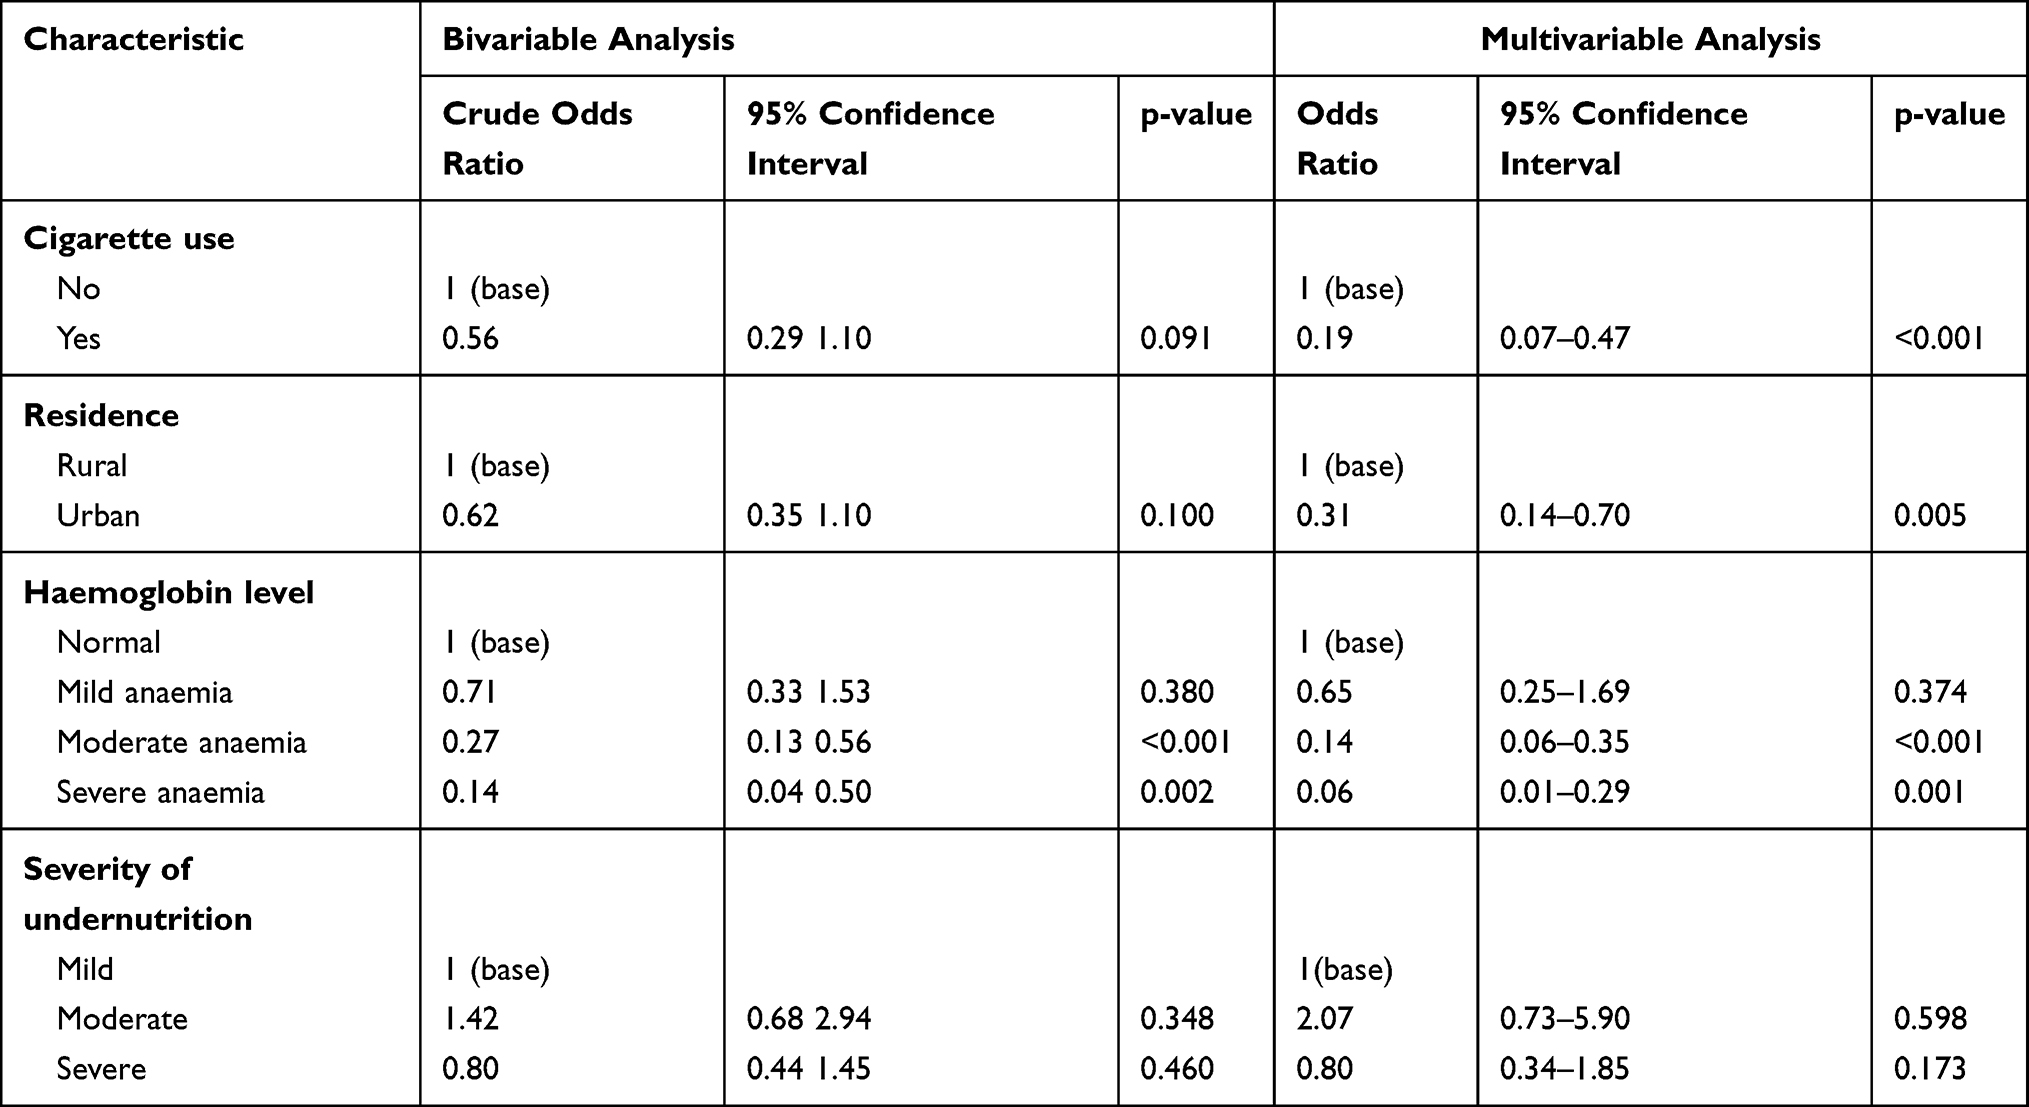 |
Table 3 Multivariable Model for Factors Associated with Treatment Success Among People with DRTB and Undernutrition in Uganda |
Discussion
People with DRTB and undernutrition consistently post unfavourable treatment outcomes. The aim of this study was to determine factors associated with treatment success among people with DRTB and undernutrition. Cigarette smoking, urban residence and moderate and severe anaemia were associated with lower odds of treatment success.
We found that 42% of undernourished people with DRTB have severe undernutrition. This is concerning considering that there are no clear management approaches for undernutrition among people with DRTB. While nutritional supplementation could improve weight gain during TB therapy and accelerate sputum conversion, there is insufficient evidence for the effect of supplementation on TB treatment outcomes.11,39 High quality randomised controlled trials are needed to determine management strategies for undernutrition in DRTB.
The overall TSR was similar across categories of undernutrition. This was supported by the time to unfavourable outcome analysis. These findings suggest that there is no clear linear relationship between the TSR and baseline BMI. Rather, the rate of change of BMI during therapy may be a better predictor of treatment success.40 However, from our study, treatment failure was observed only among participants with severe undernutrition. There are several factors that could account for this. Almost half of participants with severe undernutrition were unemployed, the highest frequency of the three groups. Further, >30% of them had TB strains that were resistant to ethambutol in addition to RR/MDR TB. Moreover, most of the participants with severe undernutrition were managed at lower-level hospitals (district hospitals) which have inadequate resources to closely monitor these individuals. These social, biological and system factors could influence outcomes among people with DRTB and severe undernutrition. It is therefore important to address socio-economic barriers, individualise treatment regimens to susceptibility profiles and closely monitor sputum cultures among people with DRTB and severe undernutrition.
From our study, there were two modifiable and one non-modifiable factors that could improve the TSR. Cigarette use and anaemia were modifiable factors associated with a reduction in the odds of treatment success. Urban residence was also associated with a 67% reduction in the odds of treatment success. Interestingly, all these are known risk factors for active tuberculosis alongside undernutrition.41,42 Nicotine in tobacco affects innate immune responses against TB by attenuating the expression of toll-like receptors and production of cytokines (IL – 6 and 8 and TNFα) and chemokines by lung epithelial cells, macrophages and type 2 pneumocytes.43,44 Anaemia is associated with low CD4+ T-lymphocyte counts, delayed sputum culture conversion, and severe forms of TB.45–47 Therefore, smoking, anaemia and undernutrition can be expected to synergistically increase the risk of unfavourable TB outcomes. While the optimal management of anaemia in DRTB is not known, barriers to integrating smoking cessation programs in DRTB care should be addressed.48 Anaemia in TB is complex and multifactorial. Although the most common cause of anaemia in TB is inflammation, anaemia does not invariably resolve on TB therapy.49,50 Obviously, nutritional causes are likely to be contributory in our study population. Therefore, moderate and severe anaemia forms of anaemia need further characterisation and appropriate treatment in addition to DRTB therapy. It is unclear why urban residence would be associated with unfavourable outcomes, although it is a known risk factor for TB. The association of urban residence and unfavourable DRTB treatment outcomes is equivocally reported in literature.51,52 It is possible that urban residents have little social support and food security, both of which can affect treatment adherence. The effect of residence status on DRTB TSR should be evaluated by a meta-analysis of existing studies. Nonetheless, DRTB programs should be tailored to address context-specific needs in rural and urban settings.
Our study has limitations. First, the small size could have affected the validity of the comparisons of the three groups. Therefore, the differences in the comparisons should be interpreted with caution. Relatedly, more than 50% of participants in the primary database did not have BMI measurements. This could cause selection bias if health workers preferentially took these measurements for relatively healthy individuals (able to stand on the weighing scale) or those whom they presumed to be very ill – to guide dosing of medications. However, we found that participants in the primary database with and without BMI measurements had several baseline characteristics that were similar. The study, nevertheless, analysed data from a representative country-wide cohort. To our knowledge, it is the first study to report factors associated with treatment success among people with DRTB and undernutrition. We therefore provide relevant baseline data to inform design and implementation of future studies.
Conclusion
A high proportion of people with DRTB and undernutrition have severe undernutrition. Moreover, severe undernutrition may be associated with treatment failure in this population. Therefore, there is an urgent need for high quality randomised controlled trials to evaluate efficacious and cost-effective management approaches for undernutrition in DRTB. Anaemia and cigarette smoking reduce the odds of treatment success. Cigarette cessation programs when integrated in DRTB care could improve DRTB treatment outcomes. Correcting moderate and severe anaemia, which may not be amenable to TB therapy only, is likely to increase treatment success among undernourished people with DRTB.
Data Sharing Statement
Datasets used in this analysis are available from the corresponding author upon reasonable request.
Ethics Approval and Informed Consent
The Mulago Hospital Research and Ethics Committee (#MHREC 1679) approved the primary study. Waiver of consent for the use of secondary data was provided by the same committee. The study was conducted in accordance with the Declaration of Helsinki.
Funding
There is no funding to report.
Disclosure
The authors declare no competing interests in this work.
References
1. World Health Organization. Global tuberculosis report 2020. In: Global Tuberculosis Report 2020. World Health Organization; 2020.
2. Uplekar M, Weil D, Lonnroth K, et al. WHO’s new end TB strategy. Lancet. 2015;385(9979):1799–1801. doi:10.1016/S0140-6736(15)60570-0
3. Cha J, Thwaites GE, Ashton PM. An evaluation of progress towards the 2035 WHO end TB targets in 40 high burden countries. medRxiv. 2020. doi:10.1101/2020.10.02.20175307
4. Knight GM, McQuaid CF, Dodd PJ, Houben RMGJ. Global burden of latent multidrug-resistant tuberculosis: trends and estimates based on mathematical modelling. Lancet Infect Dis. 2019;19(8):903–912. doi:10.1016/S1473-3099(19)30307-X
5. Feleke BE, Feleke TE, Biadglegne F. Nutritional status of tuberculosis patients, a comparative cross-sectional study. BMC Pulm Med. 2019;19(1):182. doi:10.1186/s12890-019-0953-0
6. White LV, Lee N, Marin FP, Saludar NR, Edwards T, Cox SE. Performance of alternative measures to body mass index in the assessment of moderate and severe under-nutrition among acutely unwell patients hospitalized in a TB ward in the Philippines: a cross-sectional study. PLoS One. 2019;14(5):e0215968. doi:10.1371/journal.pone.0215968
7. Musuenge BB, Poda GG, Chen P-C. Nutritional status of patients with tuberculosis and associated factors in the health centre region of Burkina Faso. Nutrients. 2020;12(9):2540. doi:10.3390/nu12092540
8. Chandrasekaran P, Saravanan N, Bethunaickan R, Tripathy S. Malnutrition: modulator of immune responses in tuberculosis. Front Immunol. 2017;8:1316. doi:10.3389/fimmu.2017.01316
9. Alebel A, Demant D, Petrucka P, Sibbritt D. Effects of undernutrition on mortality and morbidity among adults living with HIV in sub-Saharan Africa: a systematic review and meta-analysis. BMC Infect Dis. 2021;21(1):1. doi:10.1186/s12879-020-05706-z
10. Cegielski JP, Arab L, Cornoni-Huntley J. Nutritional risk factors for tuberculosis among adults in the United States, 1971–1992. Am J Epidemiol. 2012;176(5):409–422. doi:10.1093/aje/kws007
11. Si Z-L, Kang -L-L, Shen X-B, Zhou Y-Z. Adjuvant efficacy of nutrition support during pulmonary tuberculosis treating course: systematic review and meta-analysis. Chin Med J (Engl). 2015;128(23):3219–3230. doi:10.4103/0366-6999.170255
12. Cai H, Chen L, Yin C, et al. The effect of micro-nutrients on malnutrition, immunity and therapeutic effect in patients with pulmonary tuberculosis: a systematic review and meta‐analysis of randomised controlled trials. Tuberculosis. 2020;125:101994. doi:10.1016/j.tube.2020.101994
13. Zheng Y, Ma A, Wang Q, et al. Relation of leptin, ghrelin and inflammatory cytokines with body mass index in pulmonary tuberculosis patients with and without type 2 diabetes mellitus. PLoS One. 2013;8(11):e80122. doi:10.1371/journal.pone.0080122
14. Wondmieneh A, Gedefaw G, Getie A, Demis A. Prevalence of undernutrition among adult tuberculosis patients in Ethiopia: a systematic review and meta-analysis. J Clin Tuberc Other Mycobact Dis. 2020;22:100211. doi:10.1016/j.jctube.2020.100211.
15. Bhargava A, Chatterjee M, Jain Y, et al. Nutritional status of adult patients with pulmonary tuberculosis in rural central India and its association with mortality. PLoS One. 2013;8(10):e77979. doi:10.1371/journal.pone.0077979
16. Sinha P, Lönnroth K, Bhargava A, et al. Food for thought: addressing undernutrition to end tuberculosis. Lancet Infect Dis. 2021. doi:10.1016/S1473-3099(20)30792-1
17. Park H-O, Kim S-H, Moon S-H, et al. Association between body mass index and sputum culture conversion among South Korean patients with multidrug resistant tuberculosis in a tuberculosis referral hospital. Infect Chemother. 2016;48(4):317–323. doi:10.3947/ic.2016.48.4.317
18. Cegielski JP, Kurbatova E, van der Walt M, et al. Multidrug-resistant tuberculosis treatment outcomes in relation to treatment and initial versus acquired second-line drug resistance. Clin Infect Dis. 2016;62(4):418–430. doi:10.1093/cid/civ910
19. Meressa D, Hurtado RM, Andrews JR, et al. Achieving high treatment success for multidrug-resistant TB in Africa: initiation and scale-up of MDR TB care in Ethiopia–an observational cohort study. Thorax. 2015;70(12):1181–1188. doi:10.1136/thoraxjnl-2015-207374
20. Tang S, Tan S, Yao L, et al. Risk factors for poor treatment outcomes in patients with MDR-TB and XDR-TB in China: retrospective multi-center investigation. PLoS One. 2013;8(12):e82943. doi:10.1371/journal.pone.0082943
21. Kang YA, Kim SY, Jo KW, et al. Impact of diabetes on treatment outcomes and long-term survival in multidrug-resistant tuberculosis. Respiration. 2013;86(6):472–478. doi:10.1159/000348374
22. Sharma N, Khanna A, Chandra S, et al. Trends & treatment outcomes of multidrug-resistant tuberculosis in Delhi, India (2009–2014): a retrospective record-based study. Indian J Med Res. 2020;151(6):598–603. doi:10.4103/ijmr.IJMR_1048_18
23. Kassa GM, Tadesse A, Gelaw YA, et al. Predictors of mortality among multidrug-resistant tuberculosis patients in central Ethiopia: a retrospective follow-up study. Epidemiol Infect. 2020;148:e258. doi:10.1017/S0950268820002514
24. Kwon YS, Kim YH, Suh GY, et al. Treatment outcomes for HIV-uninfected patients with multidrug-resistant and extensively drug-resistant tuberculosis. Clin Infect Dis. 2008;47(4):496–502. doi:10.1086/590005
25. Benova L, Fielding K, Greig J, et al. Association of BMI category change with TB treatment mortality in HIV-positive smear-negative and extrapulmonary TB patients in Myanmar and Zimbabwe. PLoS One. 2012;7(4):e35948. doi:10.1371/journal.pone.0035948
26. Leveri TH, Lekule I, Mollel E, Lyamuya F, Kilonzo K. Predictors of treatment outcomes among multidrug resistant tuberculosis patients in Tanzania. Tuberc Res Treat. 2019;2019:1–10. doi:10.1155/2019/3569018
27. Wahid A, Ahmad N, Ghafoor A, et al. Effectiveness of shorter treatment regimen in multidrug-resistant tuberculosis patients in Pakistan: a multicenter retrospective record review. Am J Trop Med Hyg. 2021;104(5):1784–1791. doi:10.4269/ajtmh.20-1134
28. Schwœbel V, Trébucq A, Kashongwe Z, et al. Outcomes of a nine-month regimen for rifampicin-resistant tuberculosis up to 24 months after treatment completion in nine African countries. EClinicalMedicine. 2020;20:100268. doi:10.1016/j.eclinm.2020.100268
29. Magassouba AS, Touré AA, Diallo BD, et al. Malnutrition prevalence and associated biochemical factors among drug-resistance tuberculosis (DR-TB) patients at key treatment sites in Conakry City, Republic of Guinea. Pan Afr Med J. 2021;38(279). doi:10.11604/pamj.2021.38.279.27270
30. Whitehouse ER, Perrin N, Levitt N, Hill M, Farley JE. Cardiovascular risk prevalence in South Africans with drug-resistant tuberculosis: a cross-sectional study. Int J Tuberc Lung Dis. 2019;23(5):587–593. doi:10.5588/ijtld.18.0374
31. Nambi E. Prevalence and factors associated with malnutrition among adult Tuberculosis patients attending the national referral tuberculosis program clinic at Mulago Hospital; 2015. Available from: http://makir.mak.ac.ug/handle/10570/5691.
32. World Health Organisation. WHO Global Lists of High Burden Countries for Tuberculosis (TB), TB/HIV and Multidrug/Rifampicin-Resistant TB (MDR/RR-TB), 2021–2025. World Health Organisation; 2021.
33. Baluku JB, Nakazibwe B, Naloka J, et al. Treatment outcomes of drug resistant tuberculosis patients with multiple poor prognostic indicators in Uganda: a countrywide 5-year retrospective study. J Clin Tuberculos Other Mycobacter Dis. 2021;23:100221. doi:10.1016/j.jctube.2021.100221
34. Kasozi S, Kirirabwa NS, Kimuli D, et al. Addressing the drug-resistant tuberculosis challenge through implementing a mixed model of care in Uganda. PLoS One. 2020;15(12):e0244451. doi:10.1371/journal.pone.0244451
35. Baluku JB, Bongomin F. Treatment outcomes of pregnant women with drug resistant tuberculosis in Uganda: a retrospective review of 18 cases. Int J Infect Dis. 2021;105:230–233. doi:10.1016/j.ijid.2021.02.032
36. World Health Organization. Haemoglobin Concentrations for the Diagnosis of Anaemia and Assessment of Severity. World Health Organization; 2011.
37. Bailey KV, Ferro-Luzzi A. Use of body mass index of adults in assessing individual and community nutritional status. Bull World Health Organ. 1995;73(5):673–680.
38. World Health Organization. Definitions and Reporting Framework for Tuberculosis–2013 Revision. World Health Organization; 2013.
39. Grobler L, Nagpal S, Sudarsanam TD, Sinclair D. Nutritional supplements for people being treated for active tuberculosis. Cochrane Database Syst Rev. 2016;(6). doi:10.1002/14651858.CD006086.pub4
40. Diallo A, Diallo BD, Camara LM, et al. Different profiles of body mass index variation among patients with multidrug-resistant tuberculosis: a retrospective cohort study. BMC Infect Dis. 2020;20:315. doi:10.1186/s12879-020-05028-0
41. Narasimhan P, Wood J, MacIntyre CR, Mathai D. Risk factors for tuberculosis. Pulm Med. 2013;2013:828939. doi:10.1155/2013/828939
42. Gelaw Y, Getaneh Z, Melku M. Anemia as a risk factor for tuberculosis: a systematic review and meta-analysis. Environ Health Prev Med. 2021;26(1):13. doi:10.1186/s12199-020-00931-z
43. Valdez-Miramontes CE, Martínez LAT, Torres-Juárez F, et al. Nicotine modulates molecules of the innate immune response in epithelial cells and macrophages during infection with M. tuberculosis. Clin Exp Immunol. 2020;199(2):230–243. doi:10.1111/cei.13388
44. O’Leary SM, Coleman MM, Chew WM, et al. Cigarette smoking impairs human pulmonary immunity to Mycobacterium tuberculosis. Am J Respir Crit Care Med. 2014;190(12):1430–1436. doi:10.1164/rccm.201407-1385OC
45. Baluku J, Musaazi J, Mulwana R, Mugabo A, Bongomin F, Katagira W. Prevalence and predictors of CD4+ T-lymphocytopenia among HIV-negative tuberculosis patients in Uganda. Res Rep Trop Med. 2020;11:45–51. doi:10.2147/RRTM.S252550
46. Mendonça EB, Schmaltz CA, Sant’Anna FM, et al. Anemia in tuberculosis cases: a biomarker of severity? PLoS One. 2021;16(2):e0245458. doi:10.1371/journal.pone.0245458
47. Nagu TJ, Spiegelman D, Hertzmark E, et al. Anemia at the initiation of tuberculosis therapy is associated with delayed sputum conversion among pulmonary tuberculosis patients in Dar-es-Salaam, Tanzania. PLoS One. 2014;9(3):e91229. doi:10.1371/journal.pone.0091229
48. Shangase ZP, Tsoka-Gwegweni JM, Egbe CO. Barriers to smoking cessation among drug-resistant tuberculosis patients in South Africa. Ann Glob Health. 2017;83(3–4):501–508. doi:10.1016/j.aogh.2017.05.007
49. Hella J, Cercamondi CI, Mhimbira F, et al. Anemia in tuberculosis cases and household controls from Tanzania: contribution of disease, coinfections, and the role of hepcidin. PLoS One. 2018;13(4):e0195985. doi:10.1371/journal.pone.0195985
50. Demitto FO, Araújo-Pereira M, Schmaltz CA, et al. Impact of persistent anemia on systemic inflammation and tuberculosis outcomes in persons living with HIV. Front Immunol. 2020;11:2465. doi:10.3389/fimmu.2020.588405
51. Kliiman K, Altraja A. Predictors of poor treatment outcome in multi- and extensively drug-resistant pulmonary TB. Eur Respir J. 2009;33(5):1085–1094. doi:10.1183/09031936.00155708
52. Ali MH, Alrasheedy AA, Hassali MA, Kibuule D, Godman B. Predictors of multidrug-resistant tuberculosis (MDR-TB) in Sudan. Antibiotics (Basel). 2019;8(3):90. doi:10.3390/antibiotics8030090
 © 2021 The Author(s). This work is published and licensed by Dove Medical Press Limited. The full terms of this license are available at https://www.dovepress.com/terms.php and incorporate the Creative Commons Attribution - Non Commercial (unported, v3.0) License.
By accessing the work you hereby accept the Terms. Non-commercial uses of the work are permitted without any further permission from Dove Medical Press Limited, provided the work is properly attributed. For permission for commercial use of this work, please see paragraphs 4.2 and 5 of our Terms.
© 2021 The Author(s). This work is published and licensed by Dove Medical Press Limited. The full terms of this license are available at https://www.dovepress.com/terms.php and incorporate the Creative Commons Attribution - Non Commercial (unported, v3.0) License.
By accessing the work you hereby accept the Terms. Non-commercial uses of the work are permitted without any further permission from Dove Medical Press Limited, provided the work is properly attributed. For permission for commercial use of this work, please see paragraphs 4.2 and 5 of our Terms.