")
Back to Journals » HIV/AIDS - Research and Palliative Care » Volume 11
Undernutrition and associated factors among HIV-positive adult patients enrolled in antiretroviral therapy (ART) clinics in the Arba Minch area, southern Ethiopia
Authors Zemede Z, Tariku B , Kote M , Estifanos W
Received 2 January 2019
Accepted for publication 21 February 2019
Published 1 July 2019 Volume 2019:11 Pages 147—154
DOI https://doi.org/10.2147/HIV.S200120
Checked for plagiarism Yes
Review by Single anonymous peer review
Peer reviewer comments 2
Editor who approved publication: Professor Bassel Sawaya
Zale Zemede,1 Befikadu Tariku,2 Mesfin Kote,2 Wubshet Estifanos3
1Arba Minch Zuria District Health Office, Arba Minch, Ethiopia; 2Department of Public Health, Arba Minch University, Arba Minch, Ethiopia; 3Department of Nursing, Arba Minch University, Arba Minch, Ethiopia
Background: Undernutrition constitutes an important threat to the success of HIV programs in sub-Saharan Africa, and failure to effectively address it may jeopardize the benefits gained so far in the fight against HIV. The aim of the study was to assess undernutrition and associated factors among HIV-positive adult patients enrolled in antiretroviral therapy (ART) clinics in Arba Minch area, south Ethiopia.
Methods: A facility-based cross-sectional study was conducted in 2017. There were 351 adult individual study participants who were enrolled in ART clinics in Arba Minch area public health facilities. Variables with P-value less than 0.25 on binary logistic regression analysis were entered into a multivariate logistic regression model to outline the independent predictors of undernutrition. CI of 95% was used to assess precision of the study.
Results: Out of all the participants, 18.23% (95% CI: 14.52–22.65) were undernourished. The prevalence of undernutrition was significantly lower among those consuming food from five or more food groups per day (AOR: 0.33; 95% CI: 0.16–0.71) and undergoing ART for more than a year (AOR: 0.24; 95% CI: 0.08–0.73). On the contrary, the prevalence was significantly higher among those who were currently smoking tobacco (AOR: 6.67; 95% CI: 1.45–30.76). In addition, those with WHO clinical stage 3 had a significantly higher prevalence of undernutrition compared to those with WHO clinical stage 1 (AOR: 311; 95% CI: 1.47–6.60).
Conclusion: The prevalence of undernutrition was high among adults with HIV/AIDS enrolled in ART clinics in the study area. The prevalence of undernutrition was lower among those who consumed diverse food groups and had been receiving ART for longer (more than a year).On the contrary, the prevalence of undernutrition was higher among those who consumed tobacco and with higher WHO clinical stage. Therefore, efforts should be made to enhance the dietary diversity of these individuals.
Keywords: ART, undernutrition, malnutrition, dietary diversity score, DSS, WHO clinical stage
Introduction
Globally more than 35.1 million adults were living with HIV in 2017.1 In 2013, sub-Saharan African countries accounted for 74% of death from AIDS-related illnesses.2 According to the Ethiopian demographic and health survey report of 2016, the prevalence of HIV among adults was nearly 1%.3
Introduction of ART has changed the course of HIV infection through suppressing viral replication, allowing recovery of the immune system, and consequently reducing the incidence of opportunistic infection, hospitalization, and death among individuals living with HIV/AIDS.4,5 In Ethiopia, the number of people living with HIV/AIDS enrolled in ART programs has increased significantly, and currently the number is more than 870,000.6
There is a significant association between HIV infection and undernutrition.7 Even though there have been advancements in the treatment of patients with HIV, many deaths are related to malnutrition.8 Malnutrition, especially undernutrition, is the most common clinical finding among HIV patients.7,9,10 Even among people taking ART, weight loss and wasting is the most common problem and significantly prevalent in sub-Saharan African countries.9,11,12
Undernutrition constitutes an important threat to the success of HIV programs in sub-Saharan Africa, and failure to effectively address it may jeopardize the benefits gained so far in the fight against HIV. The objective of study was to assess undernutrition and associated factors among HIV-positive adult patients enrolled in ART clinics of Arba Minch area, southern Ethiopia.
Methods
Study area
The study was conducted in Arba Minch town and Arba Minch Zuria district public health facilities. Arba Minch is located 505 km south of Addis Ababa, the capital of Ethiopia. Based on the 2007 population census of Ethiopia, the projected population of Arba Minch town and Arba Minch Zuria district for 2016 was 310,454.13 The study area had ten health facilities and only four of them were delivering ART during the study period. Among the health facilities, there was one hospital and three health centers. Gamo-Gofa Zone Health department's report in 2016 showed that there were 1,823 adults living with HIV who were actively participating in ART programs in these health facilities.
Study design and period
A facility-based cross-sectional study was conducted among adults who were enrolled at ART clinics in Arba Minch area public health facilities. The study was conducted from January to February 2017.
Population
The study population consisted of all adult individuals (aged 15 years and above) who were enrolled in ART clinics at public health facilities of Arba Minch town and Arba Minch Zuria district.
Sample size determinations and sampling procedure
A single population proportion formula was used to calculate the sample size with 95% level confidence, 0.05 acceptable margin of error, and 10% expected non-response rate. In addition, from a study conducted at Hossan town, Ethiopia, the estimated prevalence of undernutrition among patients on ART (30%) was used to have the maximum sample size.14 As a result, the final sample size was 356. According to the total number of ART clients in each health facility, proportionate number of sample was assigned for each ART clinic. The list of each facility's patients was used as a sampling frame, and, by using computer-generated random number, participants were identified.
Data collection tools and procedures
Data were collected using a structured questionnaire, checklist, and measurements. The questionnaire was developed in English and translated to Amharic. The questionnaire included socio-demographics, household characteristics, diet, and behavioral issues. Variables for wealth status were adopted from EDHS 2011.15 Food security status of the household was measured using Household Food Insecurity Access Scale (HFIAS), which was developed and validated by Food and Nutrition Technical Assistance (FANTA).16 Food groups were based on Food and Agriculture Organization (FAO) guidelines for measuring household and individual dietary diversity.17 A checklist was developed to collect previous history, CD4 count, WHO clinical stage, and ART duration.
Weight and height measurements were done according to FANTA standards.18 Body weight (to the nearest 0.5 kg) was measured with the participant wearing light clothing and no shoes using a SECA digital scale. Height (to the nearest 0.5 cm) was measured using a stadiometer with participants wearing no shoes and no headwear.
Seven clinical nurses were recruited as data collectors and three health officers were supervisors of the data collection process. Two days' training was given for the data collectors and supervisors on the objectives of the study, how to collect the data, ethical issues, and on the use of the data collection format. At the time of the actual data collection, the data collectors arrived early in the morning at ART clinics and waited until the identified person arrived for the follow-up. Data collection was carried out immediately after patients received the required service.
Quality control
The English version questionnaire was translated into Amharic and back-translated into English to check its consistency. Data collection tools were developed by reviewing literature and pre-testing. Based on the pretest findings, data collection tools were amendmended. Trained nurses carried out the data collection. The supervisor and principal investigator checked completeness and followed the whole data collection process.
Data processing and analysis
Data were cleaned and entered into a computer using Epi Info Version 7, then transferred to Stata version 14 for analysis. Body mass index (BMI) was generated by dividing the weight in kg by square of height in meter. Undernutrition was categorized as BMI below 18.5 Kg/m2.19 Dietary Diversity Score (DDS) was calculated based on the number of individual food groups consumed over the past 24 hours. Categorization was made based on above and below the mean DDS.17 Using HFIAS, food security was dichotomized into two categories.16 Wealth index was generated by principal component analysis method using household assets and characteristics, which were adapted from EDHS 2011.15
Descriptive summaries of patients’ characteristics and outcome of interest were computed. Bivariate logistic regression was used to show the relation between undernutrition and various associated factors. Finally, all explanatory variables with P-value less than 0.25 in the bivariate analyses were entered into multivariable logistic regression model to identify independent predictors of undernutrition. CI of 95% was used to assess the precision of the study.
Ethics statement
Ethical approval including verbal consent was obtained from the Institutional Research Ethics Review Committee of Arba Minch University and the study was conducted in accordance with the Declaration of Helsinki. Verbal informed consent was obtained from study participants before interviews and measurements. Privacy of the study participants was maintained by interviewing the participants alone.
Results
Three hundred and fifty-one adult HIV-positive patients who were enrolled in ART clinics participated in the study. The response rate was 98.3%. Mean (SD) age of the participants was 39.5 (9.5) years and the majority (59.5%) were within the age group of 30 to 44 years. Nearly two thirds (60.7%) of the participants were females and most (84.0%) of them were urban residents. Married respondents comprised more than half (56.4%) and those who had formal education comprised nearly two thirds (Table 1). The mean (SD) DDS and BMI were 4.4 (1.7) and 21.9 (3.7) Kg/m2, respectively. Out of the total participants, 18.2% (95% CI: 14.5–22.7) were undernourished.
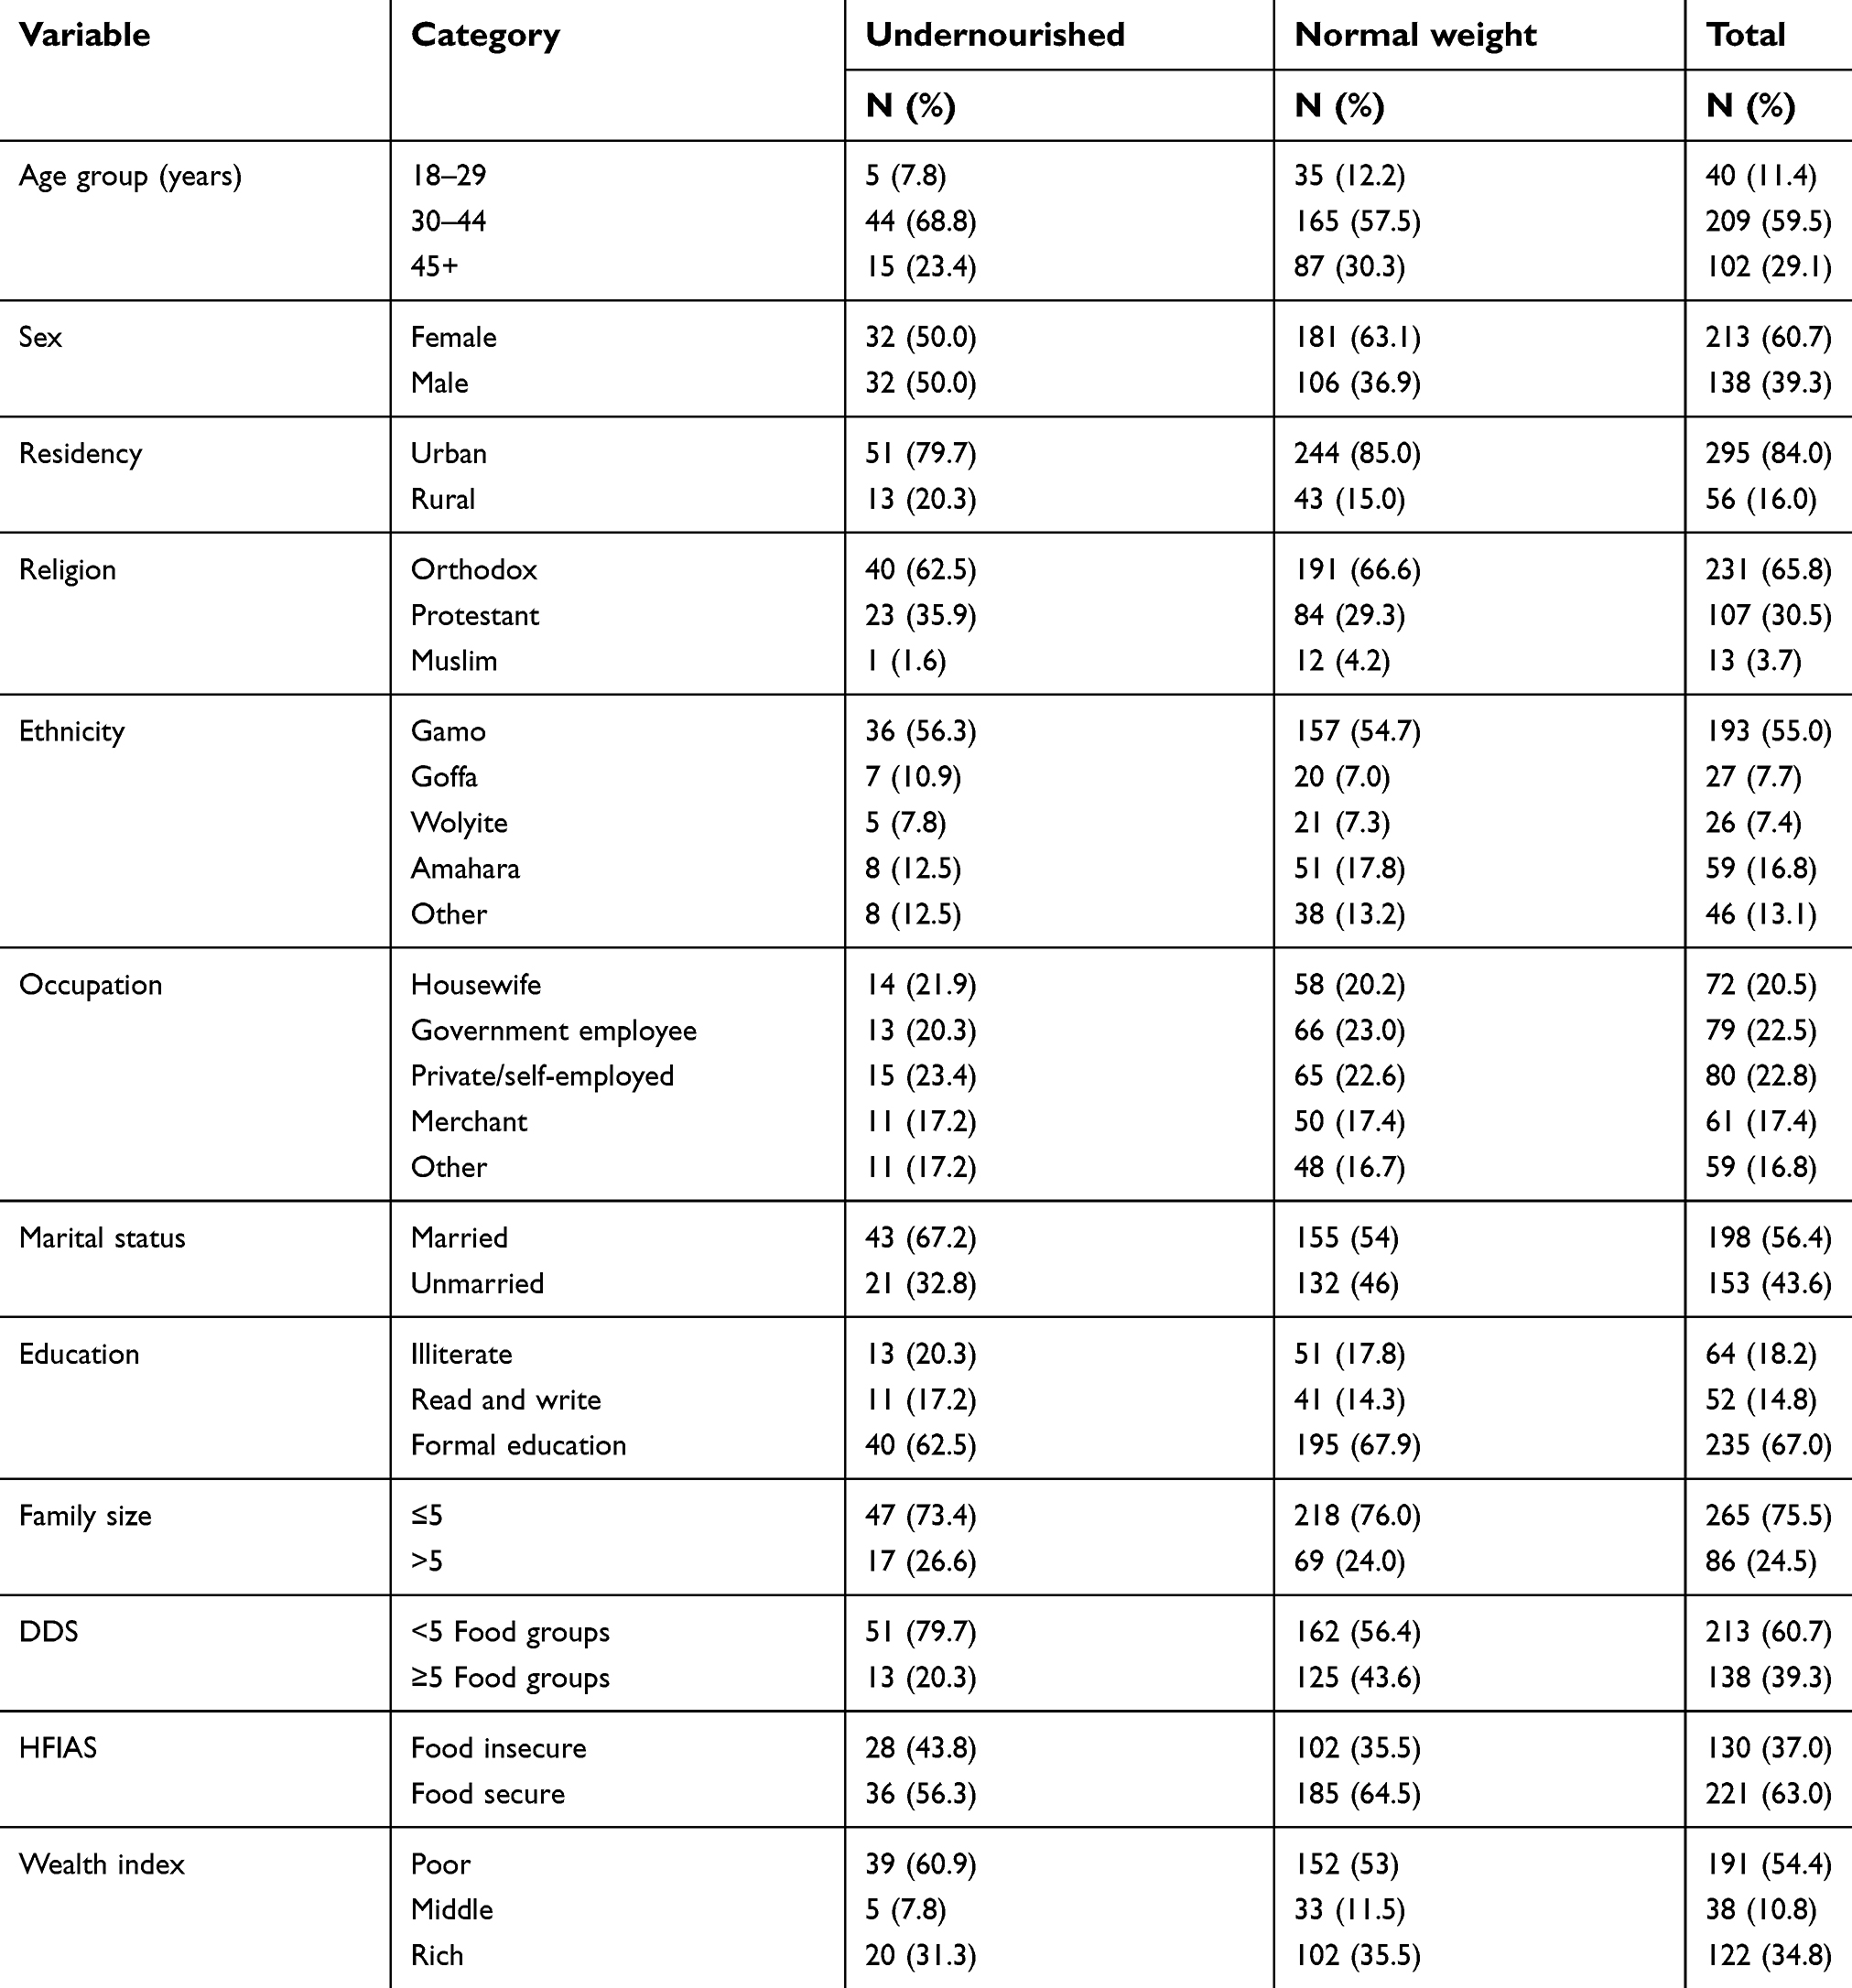 |
Table 1 Socio-demographic characteristics and nutritional status of adults receiving ART at public health facilities of Arba Minch area, southern Ethiopia, 2017 |
Almost all of the participants (97%) had good adherence to the ART treatment. Around one third of participants consumed alcohol. Nearly one in five of the participants had CD4 count level less than 350 cells/mm3. Nearly 88% of the study participants were using tuberculosis prophylaxis and 92% had a follow-up period of more than a year. Ten percent developed an opportunistic infection. An amount of 18.2% (64) were using ready to use therapeutic foods. Out of the undernourished participants, 51.5% (33), and out of the normal weight participants, 10.8% (31), were using ready to use therapeutic foods, respectively (Table 2).
Those who consumed food from five or more food groups were less likely (AOR =0.33, 95% CI: 0.16–0.71) to be undernourished compared to those who consumed food from less than five food groups per day. Those who have been enrolled at ART clinics for more than a year were less likely (AOR =0.34; 95% CI: 0.08–0.73) to be undernourished. Adults with WHO clinical stage 3 were at nearly three times (AOR: 3.11; 95% CI: 1.47–6.6) higher risk of being undernourished than patients with stage 1. Among study participants, current tobacco smokers were at higher risk of being undernourished (AOR: 6.67; 95% CI: 1.45–30.67) (Table 3).
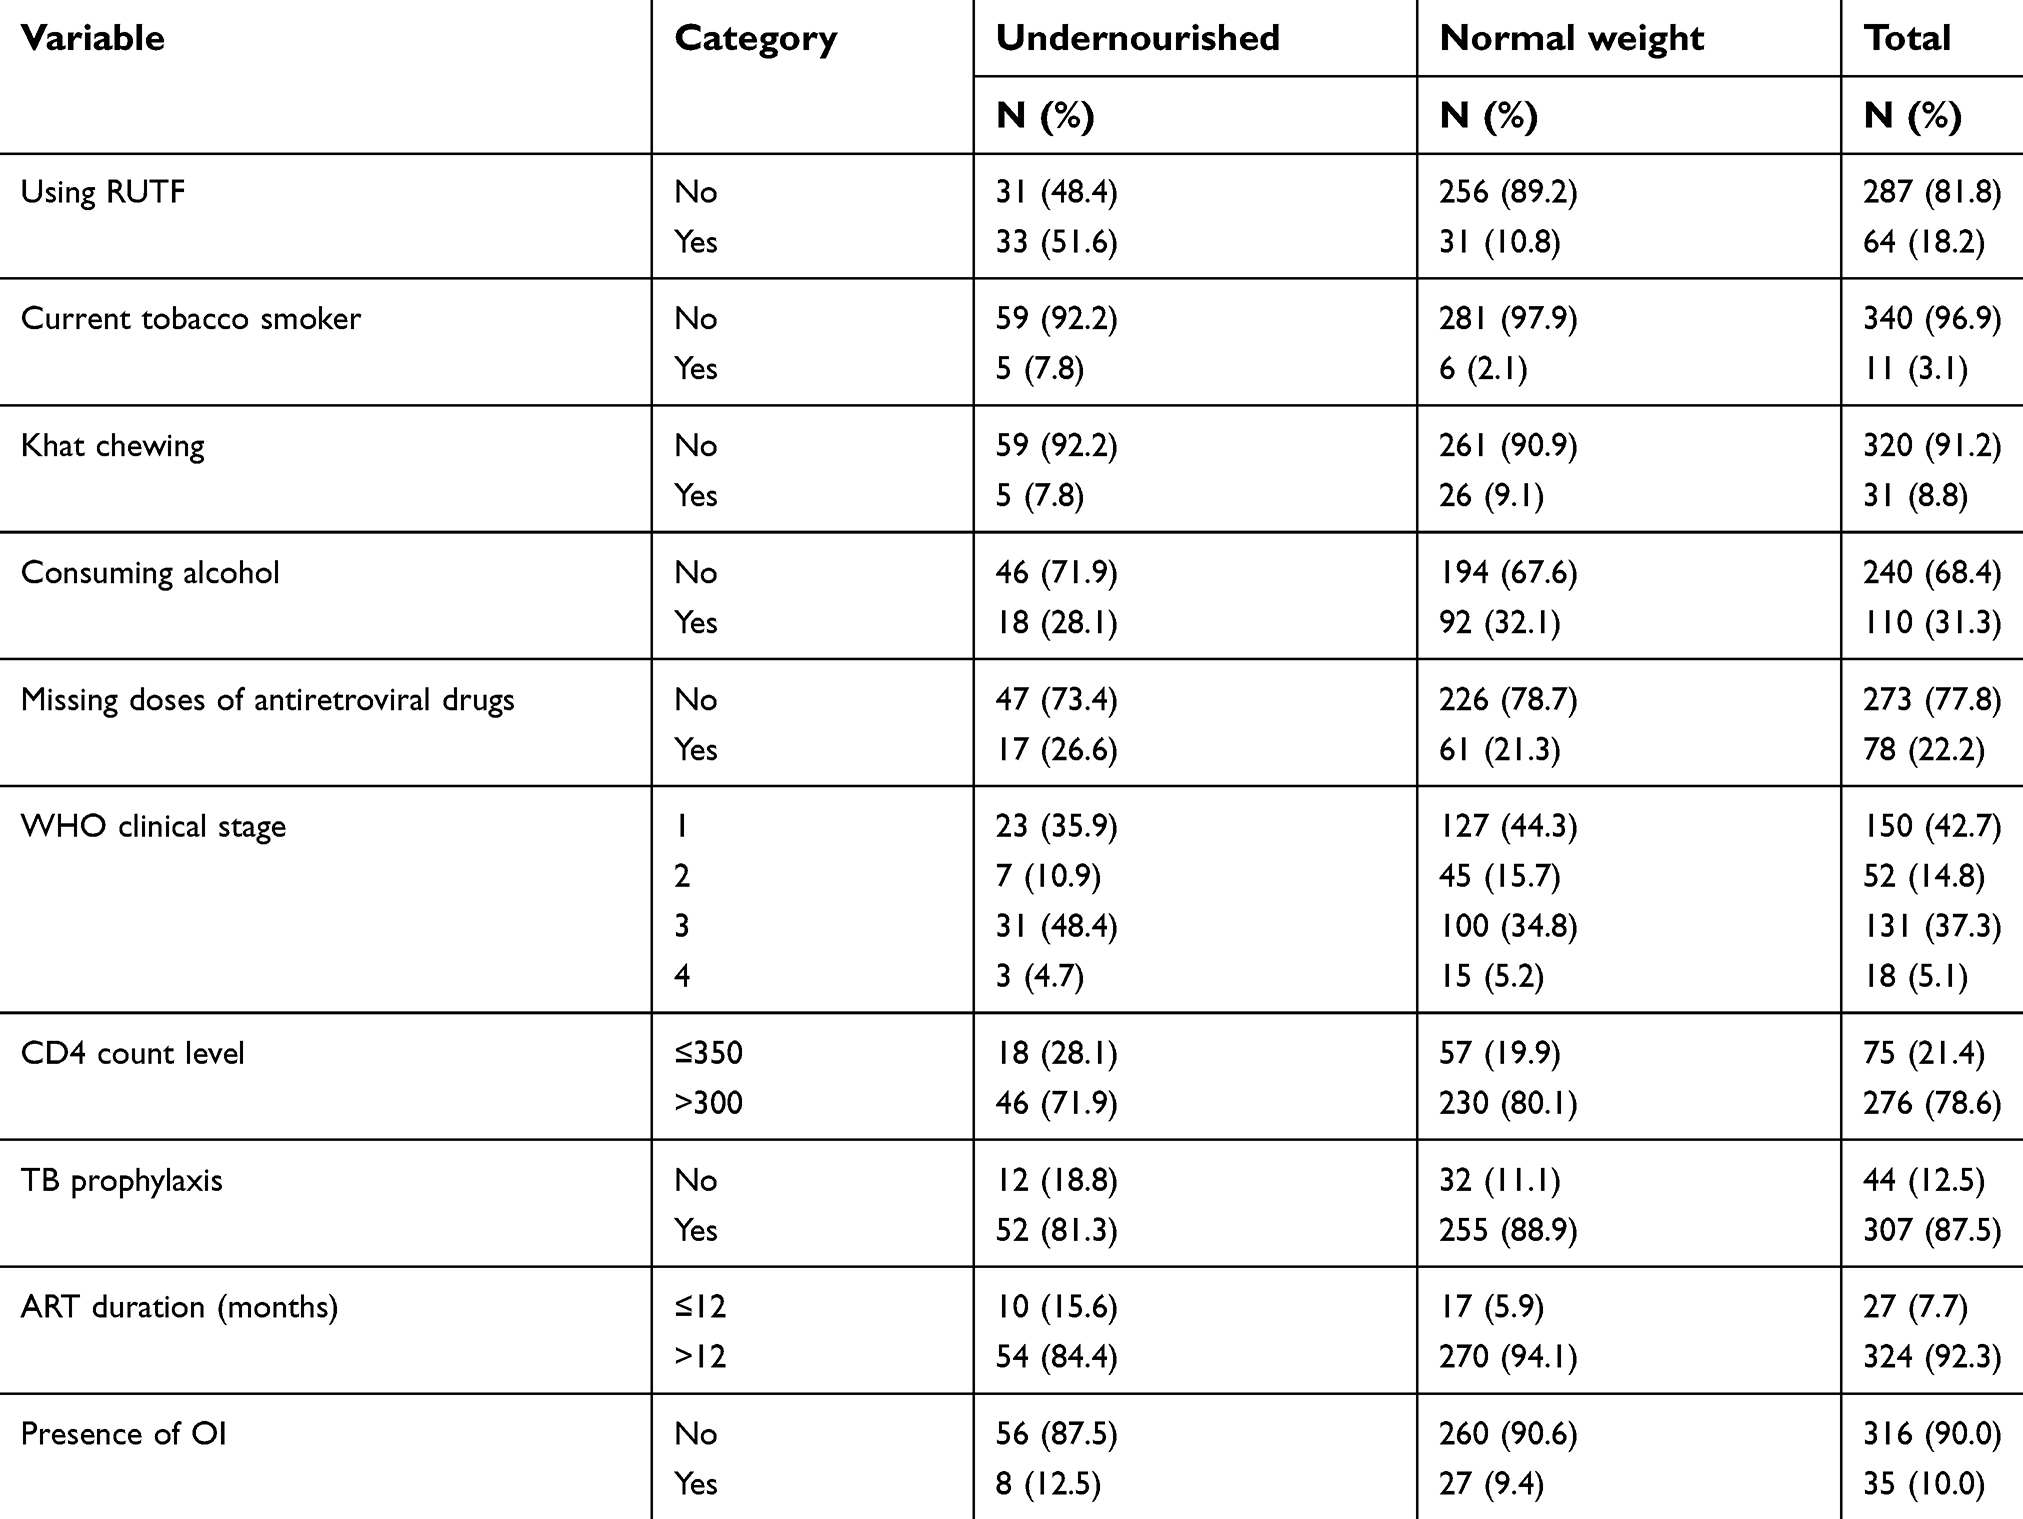 |
Table 2 Clinical and lifestyle-related characteristics and nutritional status of adults receiving ART at public health facilities of Arba Minch area, southern Ethiopia, 2017 |
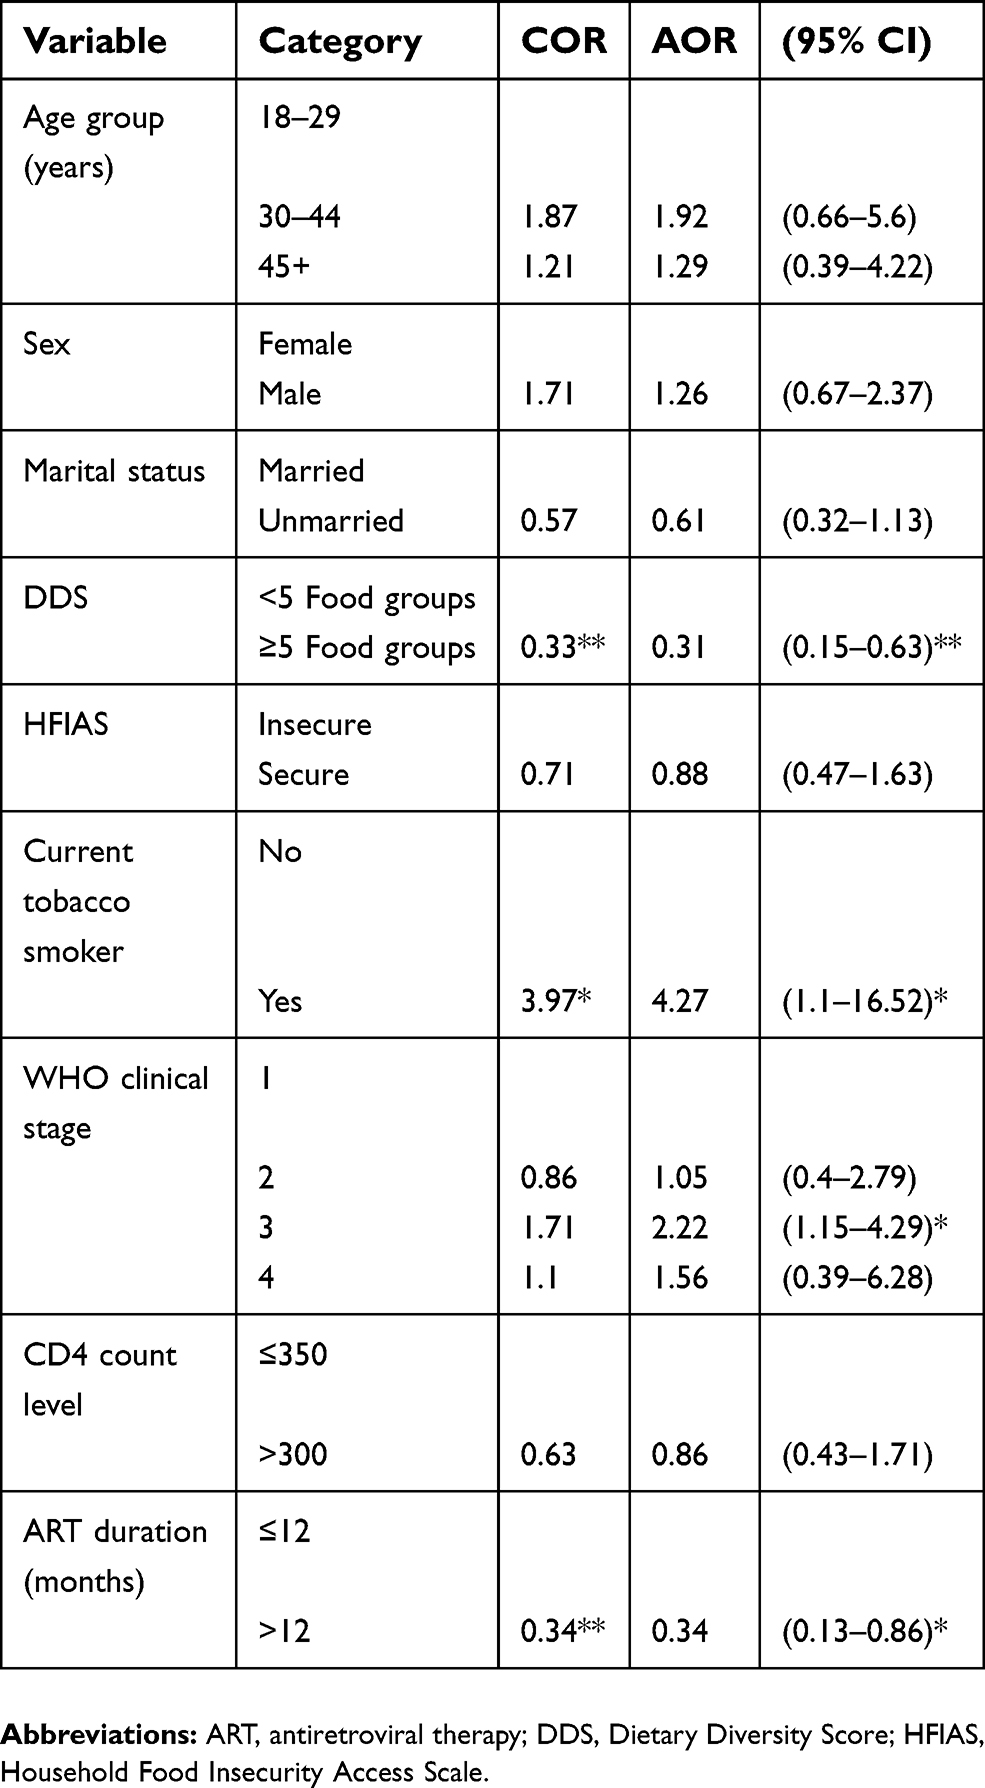 |
Table 3 Factors associated with undernutrition among adults receiving ART in public health facilities of Arba Minch area, southern Ethiopia 2017 |
Discussion
The mean (SD) BMI of individuals on ART programs at Arba Minch area was 21.9 (3.7) Kg/m2. This finding was similar to findings of studies conducted at different places in Ethiopia. For instance, studies conducted at Bahir Dar (20.5 Kg/m2), Gondar (21.5 Kg/m2), Dilla (19.5 Kg/m2), Butajira (nearly 21 Kg/m2), and Dembia (20.3 Kg/m2) health facilities showed similar findings to our report.20–24 In addition, studies conducted in other countries like Iran (22.12 kg/m2), Senegal (23.4 kg/m2), and Zambia (23.5 kg/m2) also showed similar findings.25–27 The current protocol for treatment of people living with HIV/AIDS who are malnourished indicates that those who have been identified as undernourished are eligible for RUTF.28 The findings of this research showed that 18.2% of the study participants were taking RUTF as part of their treatment; half of this study's participants were undernourished based on our assessment.
In this report, nearly one in five adult patients enrolled for ART were undernourished. The finding of this study was similar to those of other studies at different health facilities in Ethiopia, such as in Dembia (23.2%), West Showa Zone (23.6%), Butajira (25.2%), and Bahir Dar (25.5%).20–22,29 It was also similar to studies conducted at Tanzania, Nepal, and Senegal, which showed rates of malnutrition of 18.4% 19.9%, and 22.9%, respectively.25,30,31 However, the finding of this report was higher compared to findings from studies from Brazil (7.3%), Zimbabwe (10%), Iran (11.1%), and Dilla Ethiopia (12.3%).24,26,27,32 This difference might be related to socio-economic differences and seasonal variation within the studies. However, it was lower compared to study findings at health facilities of East Hararge Zone, Oromia region; Tigray regional state; and Amhara regional state which showed rates of malnutrition of 30%, 50.5%, and 55.6%, respectively.14,33,34 The prevalence of undernutrition among people living with HIV may be related to the consequences of the infection which result in defective absorption, storage, and utilization of nutrients.35
Undernutrition was associated with current tobacco smoking, WHO clinical stage, DDS, and duration of ART use among HIV patients enrolled in ART at Arba Minch area health facilities. Current tobacco-smoking adults enrolled in ART programs were at higher risk of being undernourished (AOR of 6.67). A comparative study between smokers and non-smokers in Canada showed that smokers consumed a less healthy diet.36 But a study conducted in Nepal indicated that undernutrition was not associated with smoking.31 There was an inverse relationship between smoking and BMI, not only among people living with HIV but also among the general population.37
DDS measures the quality of food intake in Africa.38 This study showed that increased dietary diversity was associated with decreased probability of undernutrition among ART-enrolled adults. A study conducted at referral hospitals of Amhara regional state, Ethiopia showed that those HIV patients with lower dietary diversity were at higher risk of undernutrition.34 But studies conducted in Senegal and Butajira, Ethiopia indicated that undernutrition was not associated with dietary diversity.21,25
Patients on ART for more than a year were less likely to be undernourished compared to those using ART for less than a year. This finding was consistent with the finding at Felege Hiwot Referral Hospital, Bahir Dar, Northern Ethiopia and West Shewa Zone, Central Ethiopia.20,29 In addition, at the start of ART, there is a risk that opportunistic infections, immune reconstitution inflammatory syndrome, and early adverse drug reactions may develop, which contribute to undernutrition.39
In this study, WHO clinical stage was associated with undernutrition. ART patients with WHO clinical stage 1 were less likely to be undernourished than those with WHO clinical stage 3. A cohort study in Singapore showed that there was a significant association between clinical disease stage and nutritional status.40 Similarly, the studies at Gonder and West Shewa Zone Ethiopia and Kathmandu Valley, Nepal indicated that the risk of undernutrition increased from WHO clinical stage 1 to 4.23,29,31 There was a relationship between weight change and HIV clinical stage, which showed that there were distinct patterns of weight loss that occured in stage 4 HIV infection.41
In this study, we tried to identify factors associated with undernutrition among adults receiving ART at Arba Minch area public health facilities. To avoid recall bias, medical charts were checked with primary data by using a structured interview questionnaire and checklist. However, the cross-sectional nature of the study limited the investigation to the level of the association between determinants and undernutrition. In this assessment, both undernourished and well-nourished adults had been using RUTF. Another limitation is that we did not assess the reason for its use. In addition, we did not take into consideration the seasonal variation related to intake of food (DDS).
Conclusion
In this study, the prevalence of undernutrition was high among adult HIV/AIDS clients enrolled in ART programs. The prevalence of undernutrition was lower among those who consumed diversified food groups and had been receiving ART for a longer period of time. On the contrary, the prevalence of undernutrition was higher among those who consumed tobacco and when the WHO clinical stage was higher. Therefore, efforts should be made to enhance the dietary diversity and to strengthen systems for cessation of tobacco smoking among those enrolled in ART programs. Nutrition-related attention should be given based on individuals' WHO clinical stage (especially 3 and 4), and to those who have recently enrolled in ART programs. Further investigations need to be done to assess the impact of RUTF on the nutritional status of adults receiving ART.
Acknowledgments
We would like to thank the health facilities, data collectors, and study participants for their support and participation in the data collection process. In addition, we extend our thanks to Arba Minch Zuria District Health Office for providing material support for data collection purposes. Arba Minch Zuria District Health Office supported the data collection process but was not directly involved in the planning or write-up of this analysis.
Author contributions
All authors contributed toward data analysis, drafting and revising the paper, gave final approval of the version to be published and agreed to be accountable for all aspects of the work.
Disclosure
The authors report no conflicts of interest in this work.
References
1. Joint United Nations Programme on HIV/AIDS (UNAIDS). UNAIDS data 2018. Geneva: UNAIDS. 2018.
2. Kharsany AB, Karim QA. HIV infection and AIDS in sub-Saharan Africa: current status, challenges and opportunities. The open AIDS journal. 2016;10:34.
3. CSA. Ethiopia Demographic and Health Survey 2016 – HIV Prevalence Report. Addis Ababa (Ethiopia); Rockville (MD): Central Statistical Agency; The DHS Program ICF; 2018.
4. Candiani T, Pinto J, Cardoso CAA, et al. Impact of highly active antiretroviral therapy (HAART) on the incidence of opportunistic infections, hospitalizations and mortality among children and adolescents living with HIV/AIDS in Belo Horizonte, Minas Gerais State, Brazil. Cad Saude Publica. 2007;23:S414–S423.
5. Palella
6. FMoH. Health Service Delivery and Quality of Care. HSDP-IV Annual Performance Report EFY. Addis Ababa, Ethiopia: Federal Ethiopia Ministry of Health; 2015.
7. Ivers LC, Cullen KA, Freedberg KA, et al. HIV/AIDS, undernutrition, and food insecurity. Clin Infect Dis. 2009;49(7):1096–1102. doi:10.1086/605573
8. Duggal S, Das CT, Duggal AK. HIV and malnutrition: effects on immune system. Clin Dev Immunol. 2012;2012:8 p.
9. Mangili A, Murman DH, Zampini AM, Wanke CA, Mayer KH. Nutrition and HIV infection: review of weight loss and wasting in the era of highly active antiretroviral therapy from the nutrition for healthy living cohort. Clin Infect Dis. 2006;42(6):836–842. doi:10.1086/500398
10. Argemi X, Dara S, You S, et al. Impact of malnutrition and social determinants on survival of HIV-infected adults starting antiretroviral therapy in resource-limited settings. Aids. 2012;26(9):1161–1166. doi:10.1097/QAD.0b013e328353f363
11. Wanke CA, Silva M, Knox TA, Forrester J, Speigelman D, Gorbach SL. Weight loss and wasting remain common complications in individuals infected with human immunodeficiency virus in the era of highly active antiretroviral therapy. Clin Infect Dis. 2000;31(3):803–805. doi:10.1086/314027
12. Uthman OA. Prevalence and pattern of HIV-related malnutrition among women in sub-Saharan Africa: a meta-analysis of demographic health surveys. BMC Public Health. 2008;8(1):226. doi:10.1186/1471-2458-8-226
13. CSA. Population Projection of Ethiopia for All Regions at Wereda Level from 2014–2017. Federal Democratic Republic of Ethiopia Central Statistical Agency; 2013. doi:10.1186/1746-4269-3-28
14. Dedha M, Damena M, Egata G, Negesa L. Undernutrition and associated factors among adults human immunodeficiency virus positive on antiretroviral therapy in hospitals, East Hararge Zone, Oromia, Ethiopia: a cross-sectional study. Int J Health Sci (Qassim). 2017;11(5):35.
15. CSA Icfi. Ethiopia Demographic and Health Survey 2011. Addis Ababa (Ethiopia); Calverton, MD: Cent Stat Agency ICF Int; 2012:430.
16. Coates J, Swindale A, Bilinsky P. Household Food Insecurity Access Scale (HFIAS) for Measurement of Food Access: Indicator Guide. Washington (DC); 2007. doi:10.1007/s13398-014-0173-7.2
17. Kennedy G, Ballard T, Dop MC. Guidelines for Measuring Household and Individual Dietary Diversity. Rome, Italy: Food and Agriculture Organization of the United Nations; 2011.
18. Cogill B. Anthropometric Indicators Measurement Guide.
19. WHO. Physical Status: The Use of and Interpretation of Anthropometry, Report of a WHO Expert Committee. Geneva: World Health Organization; 1995; WHO technical report series: 854(9):1–452.
20. Daniel M, Mazengia F, Birhanu D. Nutritional status and associated factors among adult HIV/AIDS clients in Felege Hiwot Referral Hospital, Bahir Dar, Ethiopia. Sci J Public Heal. 2013;1(1):24–31. doi:10.11648/j.sjph.20130101.14
21. Gedle D, Gelaw B, Muluye D, Mesele M. Prevalence of malnutrition and its associated factors among adult people living with HIV/AIDS receiving anti-retroviral therapy at Butajira Hospital, southern Ethiopia. BMC Nutr. 2015;1(1):5. doi:10.1186/2055-0928-1-5
22. Mitiku A, Ayele TA, Assefa M, Tariku A. Undernutrition and associated factors among adults living with human immune deficiency virus in Dembia District, northwest Ethiopia: an institution based cross-sectional study. Arch Public Heal. 2016;74(1):33. doi:10.1186/s13690-016-0143-y
23. Fentie M, Wassie MM, Tesfahun A, Alemu K, Mequanent M, Ayele TA. Chronic energy deficiency and associated factors among adults living with HIV in Gondar University Referral Hospital northwest Ethiopia. BMC Nutr. 2017;3(1):11. doi:10.1186/s40795-017-0129-3
24. Hailemariam S, Bune GT, Ayele HT. Malnutrition: prevalence and its associated factors in people living with HIV/AIDS, in Dilla University Referral Hospital. Arch Public Heal. 2013;71(1):13. doi:10.1186/0778-7367-71-13
25. Benzekri NA, Sambou J, Diaw B, et al. High prevalence of severe food insecurity and malnutrition among HIV-infected adults in Senegal, West Africa. PLoS One. 2015;10(11):e0141819. doi:10.1371/journal.pone.0141819
26. Takarinda KC, Mutasa-Apollo T, Madzima B, et al. Malnutrition status and associated factors among HIV-positive patients enrolled in ART clinics in Zimbabwe. BMC Nutr. 2017;3(1):15. doi:10.1186/s40795-017-0132-8
27. Hamzeh B, Pasdar Y, Darbandi M, Majd SP, Mohajeri SAR. Malnutrition among patients suffering from HIV/AIDS in Kermanshah, Iran. Ann Trop Med Public Heal. 2017;10(5):1210. doi:10.4103/ATMPH.ATMPH_315_17
28. FMoH. Ethiopian Guide to Clinical Nutrition Care for Children and Adults Living with HIV, Trainees Manual; 2010.
29. Gebremichael DY, Hadush KT, Kebede EM, Zegeye RT. Food insecurity, nutritional status, and factors associated with malnutrition among people living with HIV/AIDS attending antiretroviral therapy at public health facilities in West Shewa Zone, Central Ethiopia. Biomed Res Int. 2018;2018:9 p.
30. Ritte SA, Kessy AT. Social factors and lifestyle attributes associated with nutritional status of people living with HIV/AIDS attending care and treatment clinics in Ilala district, Dar es Salaam. East Afr J Public Health. 2012;9(1):33–38.
31. Thapa R, Amatya A, Pahari DP, Bam K, Newman MS. Nutritional status and its association with quality of life among people living with HIV attending public anti-retroviral therapy sites of Kathmandu Valley, Nepal. AIDS Res Ther. 2015;12(1):14. doi:10.1186/s12981-015-0056-9
32. Bassichetto KC, Bergamaschi DP, Garcia VRS, Veras MADSM. Factors associated with undernourishment among people 20 years old or over with HIV/AIDS, attending public health services in the São Paulo municipality, Brazil. Cad Saude Publica. 2014;30(12):2578–2586. doi:10.1590/0102-311X00174513
33. Berhe N, Tegabu D, Alemayehu M. Effect of nutritional factors on adherence to antiretroviral therapy among HIV-infected adults: a case control study in Northern Ethiopia. BMC Infect Dis. 2013;13(1):233. doi:10.1186/1471-2334-13-233
34. Haile A, Hailu M, Tesfaye E. Prevalence and associated factors of malnutrition among adult hospitalized patients at Amhara National Regional State Referral Hospitals, Ethiopia. Age (Omaha). 2015;18(40):181.
35. Katona P, Katona-Apte J. The interaction between nutrition and infection. Clin Infect Dis. 2008;46(10):1582–1588. doi:10.1086/587658
36. Palaniappan U, Starkey LJ, O’Loughlin J, Gray-Donald K. Fruit and vegetable consumption is lower and saturated fat intake is higher among Canadians reporting smoking. J Nutr. 2001;131(7):1952–1958. doi:10.1093/jn/131.7.1952
37. Perkins KA. Metabolic effects of cigarette smoking. J Appl Physiol. 1992;72(2):401–409. doi:10.1152/jappl.1992.72.2.401
38. Savy M, Martin-Prével Y, Sawadogo P, Kameli Y, Delpeuch F. Use of variety/diversity scores for diet quality measurement: relation with nutritional status of women in a rural area in Burkina Faso. Eur J Clin Nutr. 2005;59(5):703. doi:10.1038/sj.ejcn.1602135
39. FMoH. National Guidelines for Comprehensive HIV Prevention, Care and Treatment; Addis Ababa, Ethiopia: Federal Minister of Health; 2014.
40. Paton NI, Sangeetha S, Earnest A, Bellamy R. The impact of malnutrition on survival and the CD4 count response in HIV‐infected patients starting antiretroviral therapy. HIV Med. 2006;7(5):323–330. doi:10.1111/j.1468-1293.2006.00383.x
41. Macallan DC, Noble C, Baldwin C, Foskett M, McManus T, Griffin GE. Prospective analysis of patterns of weight change in stage IV human immunodeficiency virus infection. Am J Clin Nutr. 1993;58(3):417–424. doi:10.1093/ajcn/58.3.417
 © 2019 The Author(s). This work is published and licensed by Dove Medical Press Limited. The full terms of this license are available at https://www.dovepress.com/terms.php and incorporate the Creative Commons Attribution - Non Commercial (unported, v3.0) License.
By accessing the work you hereby accept the Terms. Non-commercial uses of the work are permitted without any further permission from Dove Medical Press Limited, provided the work is properly attributed. For permission for commercial use of this work, please see paragraphs 4.2 and 5 of our Terms.
© 2019 The Author(s). This work is published and licensed by Dove Medical Press Limited. The full terms of this license are available at https://www.dovepress.com/terms.php and incorporate the Creative Commons Attribution - Non Commercial (unported, v3.0) License.
By accessing the work you hereby accept the Terms. Non-commercial uses of the work are permitted without any further permission from Dove Medical Press Limited, provided the work is properly attributed. For permission for commercial use of this work, please see paragraphs 4.2 and 5 of our Terms.