")
Back to Journals » OncoTargets and Therapy » Volume 12
Ultrasound-microbubbles-mediated microRNA-449a inhibits lung cancer cell growth via the regulation of Notch1
Authors Meng L, Yuan S, Zhu L, ShangGuan Z, Zhao R
Received 26 May 2019
Accepted for publication 12 August 2019
Published 13 September 2019 Volume 2019:12 Pages 7437—7450
DOI https://doi.org/10.2147/OTT.S217021
Checked for plagiarism Yes
Review by Single anonymous peer review
Peer reviewer comments 2
Editor who approved publication: Prof. Dr. Takuya Aoki
Lingwu Meng,1 Shaofei Yuan,2 Linjia Zhu,2 Zongxiao ShangGuan,2 Renguo Zhao2
1Department of Minimally Invasive Therapy, First People’s Hospital of Shangqiu, Shangqiu 476100, People’s Republic of China; 2Department of Thoracic Oncology, The Third Affiliated Hospital of Wenzhou Medical University, Ruian, Zhejiang Province 325200, People’s Republic of China
Correspondence: Linjia Zhu
Department of Thoracic Oncology, The Third Affiliated Hospital of Wenzhou Medical University, No. 108 Wansong Road, Ruian, Zhejiang Province 325200, People’s Republic of China
Tel +86 05 776 586 6340
Fax +86 05 776 586 6340
Email [email protected]
Background: The application of gene-loaded microbubbles (MBs) combined with ultrasound that results in increased delivery efficiency may be an excellent method of gene delivery. This study aimed to discuss the effects of ultrasound-MB-mediated microRNA (miR)-449a on lung cancer (LC) development by targeting Notch1.
Methods: Initially, miR-449a expression in LC tissues, paracancerous tissues, LC cell lines, and lung epithelial cells was detected and its association with LC patients’ clinical characteristics was analyzed. The gain-of-function studies were performed to probe the roles of miR-449a and ultrasound-MB-mediated miR-449a in LC progression. Then, RT-qPCR combined with Western blot analysis was applied to verify the levels of miR-449a, Notch1, proliferation- and apoptosis-related proteins. Moreover, xenograft tumors in nude mice were also applied for in vivo experiments.
Results: Poorly expressed miR-449a was observed in LC, and its expression was associated with clinical staging, differentiation and lymph node metastasis of LC patients. Overexpression of miR-449a suppressed LC cell proliferation and promoted G2/M arrest and apoptosis. Ultrasound-MB-mediated miR-449a strengthened inhibitory effects of miR-449a on cell growth and resistance to apoptosis. miR-449a inhibited H1299 cell activity by targeting Notch1.
Conclusion: Our data supported that miR-449a overexpression inhibited LC cell growth, and ultrasound-MB-mediated miR-449a reinforced the repressive effects of miR-449a on LC progression. This investigation may offer new insight for LC treatment.
Keywords: lung cancer, microRNA-449a, H1299, ultrasound-mediated microbubbles, Notch1
Introduction
Lung cancer (LC) has long been the most concerned malignancy worldwide since it occupies the highest morbidity among the male and the second highest among the female.1 At present, most patients are diagnosed with LC at advanced stage due to the lack of early stage symptoms, and unfortunately, the 5-year survival rate is only 16%.2 Smoking is identified to be the major cause of LC, that is responsible for over 80% cases, and notably, the incidence emerged to decline where had sever tobacco control implements.3 The novel treatments based on molecular pathways, mainly the epidermal growth factor receptor, anaplastic lymphoma kinase, and serine/threonine-protein kinase B-Raf, are now as emerging approaches for LC treatment.4 In the last decade, improved understanding of molecular events essential for tumor initiation and progression has accelerated the development of molecular-targeted regimens for cancers, which are widely recognized as precious therapeutic treatment of cancer.5 Therefore, finding novel biomarkers in the early diagnosis and effective treatment of LC based on molecular-targeted regimens has become increasingly important.
MicroRNAs (miRs) are a group of small non-coding RNA molecules, owing important effects in cell differentiation, proliferation, and apoptosis, and their abnormal expression leads to tumor progression, including LC.6 The miR-34/449 superfamily that mediates multiciliated cell differentiation consists of miR-34a/b/c and miR-449a/b/c, among which miR-34b/c and miR-449a/b/c are massively expressed in multiciliated cells where they function as pleiotropic modulators of vertebrate multi-ciliogenesis via the suppression of Notch.7 It has been observed that miR-449a is frequently poorly expressed in several malignant tumors, including prostate cancer, gastric cancer, bladder cancer, and LC.8,9 In our study, we found miR-449a targeted Notch and inhibited its expression according to bioinformatics prediction and dual-luciferase reporter gene assay. Notch activation displays an oncogenic potential mechanism in many diseases, including lung tumorigenesis.10 Notch signaling pathway has previously been acclaimed to play key roles in the occurrence of LC and cross-talks with several transcriptional factors to enhance epithelial–mesenchymal transition, leading to the LC progression.11 Ultrasound as a diagnostic tool disturbs cell membranes and accelerates genes to enter into cells, while microbubbles (MBs) play critical roles in enhancing gene delivery efficiency without causing cell damage.12 It has been acclaimed that plasmid-binding cationic MBs promote the efficiency of ultrasound-mediated gene delivery in cell cultivation and hind limb tumor xenografts, and have the potential to selectively transmit therapeutic genes to disease sites.13 Interestingly, ultrasound-targeted MB destruction of miR-133a inhibited the tumor growth and improved the survival rate in breast cancer mice.14 From all above, we hypothesize miR-449a may regulate H1299 cell growth in vitro and in vivo via ultrasound-mediated MBs.
Materials and methods
Ethics statement
This study was conducted in accordance with the Declaration of Helsinki and got approved and supervised by the Institutional Ethics Committee of the First People’s Hospital of Shangqiu. All the subjects signed the informed consents.
Sample collection
From September 2017 to September 2018, 64 LC patients (45 males and 19 females, with a median age of 36–77 years and an average age of 59.5±10.4 years) diagnosed and treated in First People’s Hospital of Shangqiu were enrolled in this experiment for collection of LC tissues and paracancerous tissues (at least 5 cm away from LC tissues). Inclusion criteria were: 1) all patients were diagnosed as LC by pathological examination after operation; 2) no patients received radiotherapy or chemotherapy before operation; and 3) all patients had complete clinical data. Patients complicated with chronic system diseases or other malignant tumors would be excluded.
Preparation of MBs
Cationic lipid MBs were synthesized by ultrasonic dispersion of polyethylene glycol-40 stearate (1 mg/mL), 1-bisstearoyl phosphatidylcholine (2 mg/mL), 1,2-bisstearoyl-3-trifluoromethylpropane (0.4 mg/mL) and decafluorobutane (all from Avanti Polar Lipids Inc., Alabaster, AL, USA) in a water tank. Subsequently, the synthesized MBs were observed and detected by an inverted fluorescence microscope (DM 4000B, Leica Microsystems, Mannheim, Germany) and a nanometer particle size analyzer (NS-90, OMEC Instruments Co., Ltd. Zhuhai, Guangdong, China). Next, the MBs were filtered via a filtration membrane. miR-499a mimic (1 μg) was mixed with MBs suspension (50 μL) and cultured at 37°C for 30 mins. The unbounded miR-499a was washed off with 0.16 M phosphate buffer saline (PBS) to obtain miR-499a-MB.
Cell cultivation
Human LC cell lines L9981, 95C, H1299, A549, and lung epithelial cell BEAS-2B purchased from the Cell Resource Center of Shanghai Institute of Biology, Chinese Academy of Sciences (Shanghai, China) were cultured in dishes at 1×10⁵ cells/cm2 in Roswell Park Memorial Institute (RPMI)-1640 medium consisting of 10% fetal bovine serum (FBS), CM7-1 medium, F12K medium and LHC-9 medium (Gibco, Grand Island, NY, USA) in a 37°C incubator with 5% CO2 for 48 hrs. After cell confluence reached 80–90%, cells were detached with 0.025 trypsin (Gibco, Grand Island, NY, USA) and subcultured.
Cell transfection and treatment
H1299 cells and L9981 cells at P3 generation in the logarithmic growth phase were assigned into the blank group, the miR-449a- negative control (NC) group, miR-449a mimic group, and miR-449a-MB group based on instructions of lipofectamine 2000 (Invitrogen Inc., Carlsbad, CA, USA). After mixing 1 μg synthesized miR-449-NC and miR-449a mimic with 2 μL Lipofectamine 2000, respectively, cells were resuspended with 500 μL RPMI-1640, and the mixed solution was added to the corresponding cells at 50 μL/well. Cells in the miR-449a-MB group were added with miR-449a-MB at 50 μL/well and subjected to 10 Mhz ultrasound for 30 mins. After successful transfection and ultrasound treatment, cells in each group were collected for subsequent experiments.
Reverse transcription-quantitative polymerase chain reaction (Rt-qPCR)
Trizol (Invitrogen, Carlsbad, CA, USA) one-step method was utilized to extract total RNA of tissues and cells, and the extracted high-quality RNA was verified with ultraviolet analysis and formaldehyde denaturation electrophoresis. One μg RNA was reversely transcribed into cDNA using avian myeloblastosis virus reverse transcriptase. The qPCR was conducted with SYBR Green method with glyceraldehyde-3-phosphate dehydrogenase (GAPDH) and U6 as internal references. PCR primers were designed and synthesized by Shanghai Sangon Biotechnology Co., Ltd. (Shanghai, China) (Table 1). PCR reaction system was 20 μL and reaction conditions were: pre-denaturation 5 mins at 94°C, followed by 30 cycles of denaturation 40 s at 94°C, annealing 40 s at 60°C, extension 60 s at 72°C, and finally extension 10 mins at 72°C. The products were verified with agarose gel electrophoresis. The data were analyzed by 2−ΔΔCt method, which indicated the multiple relationship between the experiment and control groups. ΔΔCt = [Ct (target gene) - Ct (reference gene)] experimental group - [Ct (target gene) - Ct (reference gene)] control group.
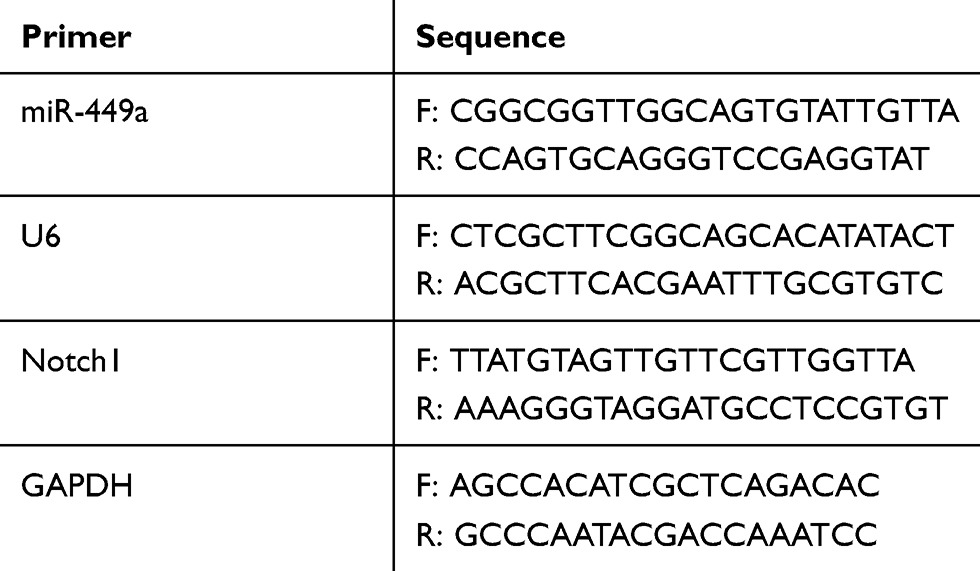 |
Table 1 Primer sequences of RT-qPCR |
Western blot analysis
The concentration of protein extracted from each tissue and cell was determined in accordance with the instructions of bicinchoninic acid (BCA) kit (Qiagen GmbH, Hilden, Germany). The extracted proteins were separated using sodium dodecyl sulfate (SDS) polyacrylamide gel electrophoresis (PAGE) with the voltage changing from 80 v to 120 v and then transformed into the polyvinylidene fluoride (PVDF) membranes by semi-dry transformation at 100 mv for 30–45 mins. The membranes were sealed 1 hr in 5% bovine serum albumin (BSA) at room temperature and incubated with primary antibodies (all from Abcam Inc., Cambridge, MA, USA): cleaved caspase 3 (1:1000, ab2302), B-cell lymphoma (Bcl)-xl (1:1000, ab32370), cleaved poly (ADP-ribose) polymerase (PARP) (1:5000, ab32064), Notch1 (1:5000, ab194123), p53 (1:1000, ab32389), N-methyl berbamine (NMB) (1:3000, ab134141), gastric releasing peptide (GRP) (1:2000, ab130401) and β-actin (1:5000, ab227387) at 4°C overnight. Afterward, the membranes were rinsed 3 times (5 mins/time) in tris-buffered saline tween (TBST), and then cultured with secondary antibody (Beyotime Biotechnology Co., Ltd, Shanghai, China) 1 hr at room temperature. After 3 washes (5 mins/time), the membranes were developed in chemiluminescence reagent and the bands were visualized using the Bio-Rad Gel Dol EZ imager (Bio-Rad Laboratories, Hercules, CA, USA). The target band was tested using Image J software (National Institutes of Health, Bethesda, Maryland, USA) for gray value analysis.
Colony formation assay
H1299 cells were detached with trypsin, after which the cell suspension was fully dispersed, and then approximately 200 cells were seeded into a 6-well plate. The plate was shaken gently, so that cells were evenly dispersed and cultured for 2–3 weeks. When visible cell clones appeared, the cultivation was terminated with culture medium removed, and cells were washed 3 times with PBS. Afterward, cells were fixed with 4% paraformaldehyde for 30 mins followed by 3 PBS washes. Subsequently, cells were stained with Giemsa solution (Sigma, St Louis, MO, USA) for 60 mins, and the dyeing solution was washed away slowly by running water and cells were dried. Finally, cell clones were counted under the microscope.
3-(4, 5-dimethylthiazol-2-yl)-2,5-diphenyltetrazolium bromide (MTT) assay
H1299 cells were cultivated for 24 hrs, 48 hrs, 72 hrs, and 96 hrs, and 5 mg/mL MTT solution (Sigma, St Louis, MO, USA) was added into each well for culturing in a 37°C incubator with 5% CO2 for 4 hrs. After termination of cell culture, the culture medium was discarded. A dose of 150 μL dimethyl sulfoxide (DMSO) solution was put into each well and the crystallization was fully dissolved after 10 mins of gentle shaking. The optical density (OD) value was detected at 450 nm wavelength using a microplate reader. MTT curve was drawn with OD value as the X-axis and time as the Y-axis. The OD value of each group was measured 3 times to get the average.
5-ethynyl-2ʹ-deoxyuridine (EdU) assay
The DNA replication ability of cells was measured in line with the instructions of a Cell-light EdU fluorescence detection kit (RiboBio, Guangzhou, Guangdong, China). Five visual fields were randomly photographed under the fluorescence microscope (Olympus FSX100). Blue fluorescence represented all cells, while red fluorescence represented the replicating cells infiltrated by EdU. The percentage of EdU-positive cells was then calculated.
Flow cytometry
After treatment, suspended cells were mixed, centrifuged, and collected with supernatant discarded. Cells were re-suspended and washed by PBS with the concentration adjusted into 1×10⁶ cells/mL to disperse single cell suspension. Cells were then centrifuged at 2000 rpm for 5 mins with supernatant removed. Afterward, cells in each group were added with 500 μL cold ethanol with a volume fraction of about 70% and fixed 2 hrs to overnight at 4°C. After discarding the fixative liquid, 1 mL PBS was added to further elute the fixative liquid. Cells were centrifuged at 2000 rpm for 3 mins with the supernatant removed, added with 100 μL RNase A in a 37°C for 30 mins in water bath and stained with 400 μL propidium iodide (PI) at 4°C for 30 mins in a dark room. Subsequently, the red fluorescence at 488 nm excitation wavelength was recorded.
After treatment, cell suspension was mixed with 2 μL Annexin-V- fluorescein isothiocyanate (FITC) (20 μg/mL) and placed on ice for 15 mins in the dark. Then, cells were transferred to the flow detection tube and added with 300 μL PBS. Each sample was added with 1 μL PI (50 μg/mL) before detection and tested within 30 mins. Then, Annexin-V was set as the X-axis while PI was set as the Y-axis, in which the mechanically damaged cells were in the upper left quadrant, apoptotic or necrotic cells in the upper right quadrant, negative normal cells in the left lower quadrant, and early apoptotic cells in the right lower quadrant.
Hoechst 33258 staining
H1299 cells in the logarithmic growth phase were inoculated at into 6-well plates with a cover glass at the density of 1×10⁵ cells/mL (3 mL per well). After cells were cultivated in a 37°C incubator with 5% CO2 for 24 hrs, the culture medium was removed. The fixative liquid was removed after cells were fixed for 10 mins, and then the Hoechst 33,258 dyeing (Shanghai Beyotime Biotechnology Co., Ltd, Shanghai, China) was added following cell washing. Cells were stained 5 mins at room temperature in the dark, and then the dyeing solution was removed and cells were washed with PBS. The cover glass attached with cells was taken out and placed on a slide dripped with anti-fluorescence quenching agent. The slide was observed and photographed under fluorescence microscope.
Dual-luciferase reporter gene assay
Target Scan was employed to identify the sites of Notch1 binding to miR-449a. According to the prediction results, mutant type (MT) sequences and wild type (WT) sequences of binding sites between Notch1 and miR-449a were designed, respectively. The MUT and WT sequence fragments were cloned and combined with Promega vector. H1299 cells were co-transfected with MT plasmids combined with miR-449a or miR-449a-NC and were named as the MT+mimic group and the MT+NC group, respectively. In addition, WT plasmids combined with miR-449a mimic or miR-449a-NC were transfected into 293T cells, respectively, and were assigned to the WT+mimic group and the WT+NC group. Forty-eight hours after transfection, the fluorescence activity of cells in each group was detected using a luciferase kit (Beijing Yuanpinghao Biotechnology Co., Ltd, Beijing, China).
Xenograft tumors in nude mice
Forty specific pathogen-free (SPF) BALB/C nude mice (4–6-week-old, 20±2 g) (Beijing Vital River Laboratory Animal Technology Co., Ltd, Beijing, China, SCXK (Beijing) 2015–0001) were numbered based on body weight and randomly assigned into blank group, miR-449a-NC group, miR-449a group, and miR-449a-MB group, with 10 mice in each group. A total of 4×10⁶ H1299 cells were dispersed by saline and injected subcutaneously into the right axilla of mice, respectively. The constructed plasmids, miR-449a-NC and miR-449a mimic, were diluted with 2 mL saline and then injected into mice via tail vein. Mice in the miR-449a-MB group were injected with 50 μL constructed miR-449a-MB via tail vein and treated with 10 Mhz ultrasound for 30 mins. Mice in the blank group were injected with equal amount of saline. Tumor volume was measured every 7 days, mice were sacrificed 21 days later, and the tumors were taken out and weighed for immunohistochemistry. The volume of the tumors was calculated by the formula M12× M2×0.5236,14 in which M1 represented the shortest axis and M2 represented the longest axis. All animal studies were performed according to protocols approved by the Ethics Committee of the First People’s Hospital of Shangqiu. Significant efforts were made in order to minimize both the number of animals and their suffering.
Immunohistochemistry
Tumor tissues of mice were paraffin-embedded and sliced. Five serial sections were taken from each mouse. After xylene dewaxing and gradient alcohol rehydration, the sections were placed in boiling 0.01M citrate buffer for antigen repair. Sections were cleaned by PBS 3 times and dripped with 3% H2O2 for 15 mins at room temperature to eliminate the activity of endogenous peroxidase. After 3 washes by PBS, sections were dripped with normal goat serum blocking fluid, and kept 15 mins at room temperature. After that, sections were incubated with 50 μL rabbit anti-human Ki67 antibody (1:500, ab15580, Abcam Inc., Cambridge, MA, USA) at 4°C overnight. After 3 PBS washes, sections were incubated with secondary antibody at 37°C for 15 mins. The sections were washed by PBS 3 times, dripped with 40 μL horseradish peroxidase-labeled streptavidin-working solution and incubated at 37°C for 15 mins. Then, sections were washed with PBS 3 times again, visualized with 2,4-diaminobutyric acid (DAB), re-stained with hematoxylin for 30 s after washing with distilled water, and sealed with neutral gum seals after dehydration. Five non-overlapping visual fields were selected in each section for observation under the microscope. The cells with brown-yellow or brown granules in the nucleus were Ki67-positive cells. Five regions were selected at random in each section to sum up the positive cells expressing Ki67 protein.
Statistical analysis
SPSS 21.0 (IBM Corp., Armonk, NY, USA) was applied for data analysis. Kolmogorov–Smirnov test showed whether the data were in normal distribution. The results were presented in mean±standard deviation. The Unpaired t-test was employed for analysis of comparisons between two groups, one-way analysis of variance (ANOVA) for comparisons among multi-groups, and Tukey’s multiple comparison test for pairwise comparisons after ANOVA. Fisher’s exact test was employed to compare the counting data. P was obtained by two-tailed test and P<0.05 indicated significant difference.
Results
miR-449a was poorly expressed in LC
miR-449a expression in LC tissues, paracancerous tissues, LC cells, and lung epithelial cells was detected with RT-qPCR. The results indicated the expression rate of miR-449a in LC tissues was evidently lower than that in paracancerous tissues (P<0.01) (Figure 1A), and miR-449a expression in lung epithelial cell BEAS-2B was higher than that in LC cells L9981, 95C, H1299, and A549 (all P<0.05) (Figure 1B). These results indicated miR-449a expression was abnormally low in LC. H1299 and L9981 cell lines with the lowest miR-449a expression were chosen for the follow-up study.
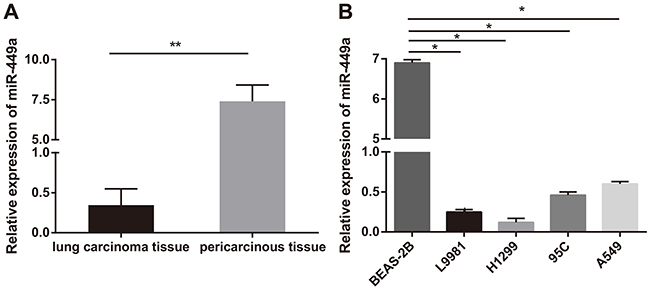 |
Figure 1 miR-449a was poorly expressed in LC. (A) Relative expression of miR-449a in LC tissues and paracancerous tissues. N represents for 64, **P<0.01; (B) Relative expression of miR-449a in L9981, 95C, H1299, A549, and BEAS-2B cell lines. N represents for 3, *P<0.05. Abbreviations: LC, lung cancer; miR-449a, microRNA-449a. |
miR-449a expression is related to clinical staging, differentiation, and lymph node metastasis
We further analyzed the association between miR-449a expression and LC patients’ clinical characteristics. The median relative expression of miR-449a was 0.25. The patients whose relative expression of miR-449a was lower than 0.25 were regarded as low expression group, otherwise they were regarded as the high expression group. The results displayed that in LC tissues, miR-449a expression was related to clinical staging, lymph node metastasis, and tumor differentiation. miR-449a expression decreased with the increase of clinical staging of LC, and its expression in LC patients at stage III + IV was substantially lower than that of patients at stage I + II (P<0.05). miR-449a expression in LC tissues with lymph node metastasis was dramatically lower than that without lymph node metastasis (P<0.05). There was no notable correlation between miR-449a expression and age, sex and tumor size (all P>0.05) (Table 2).
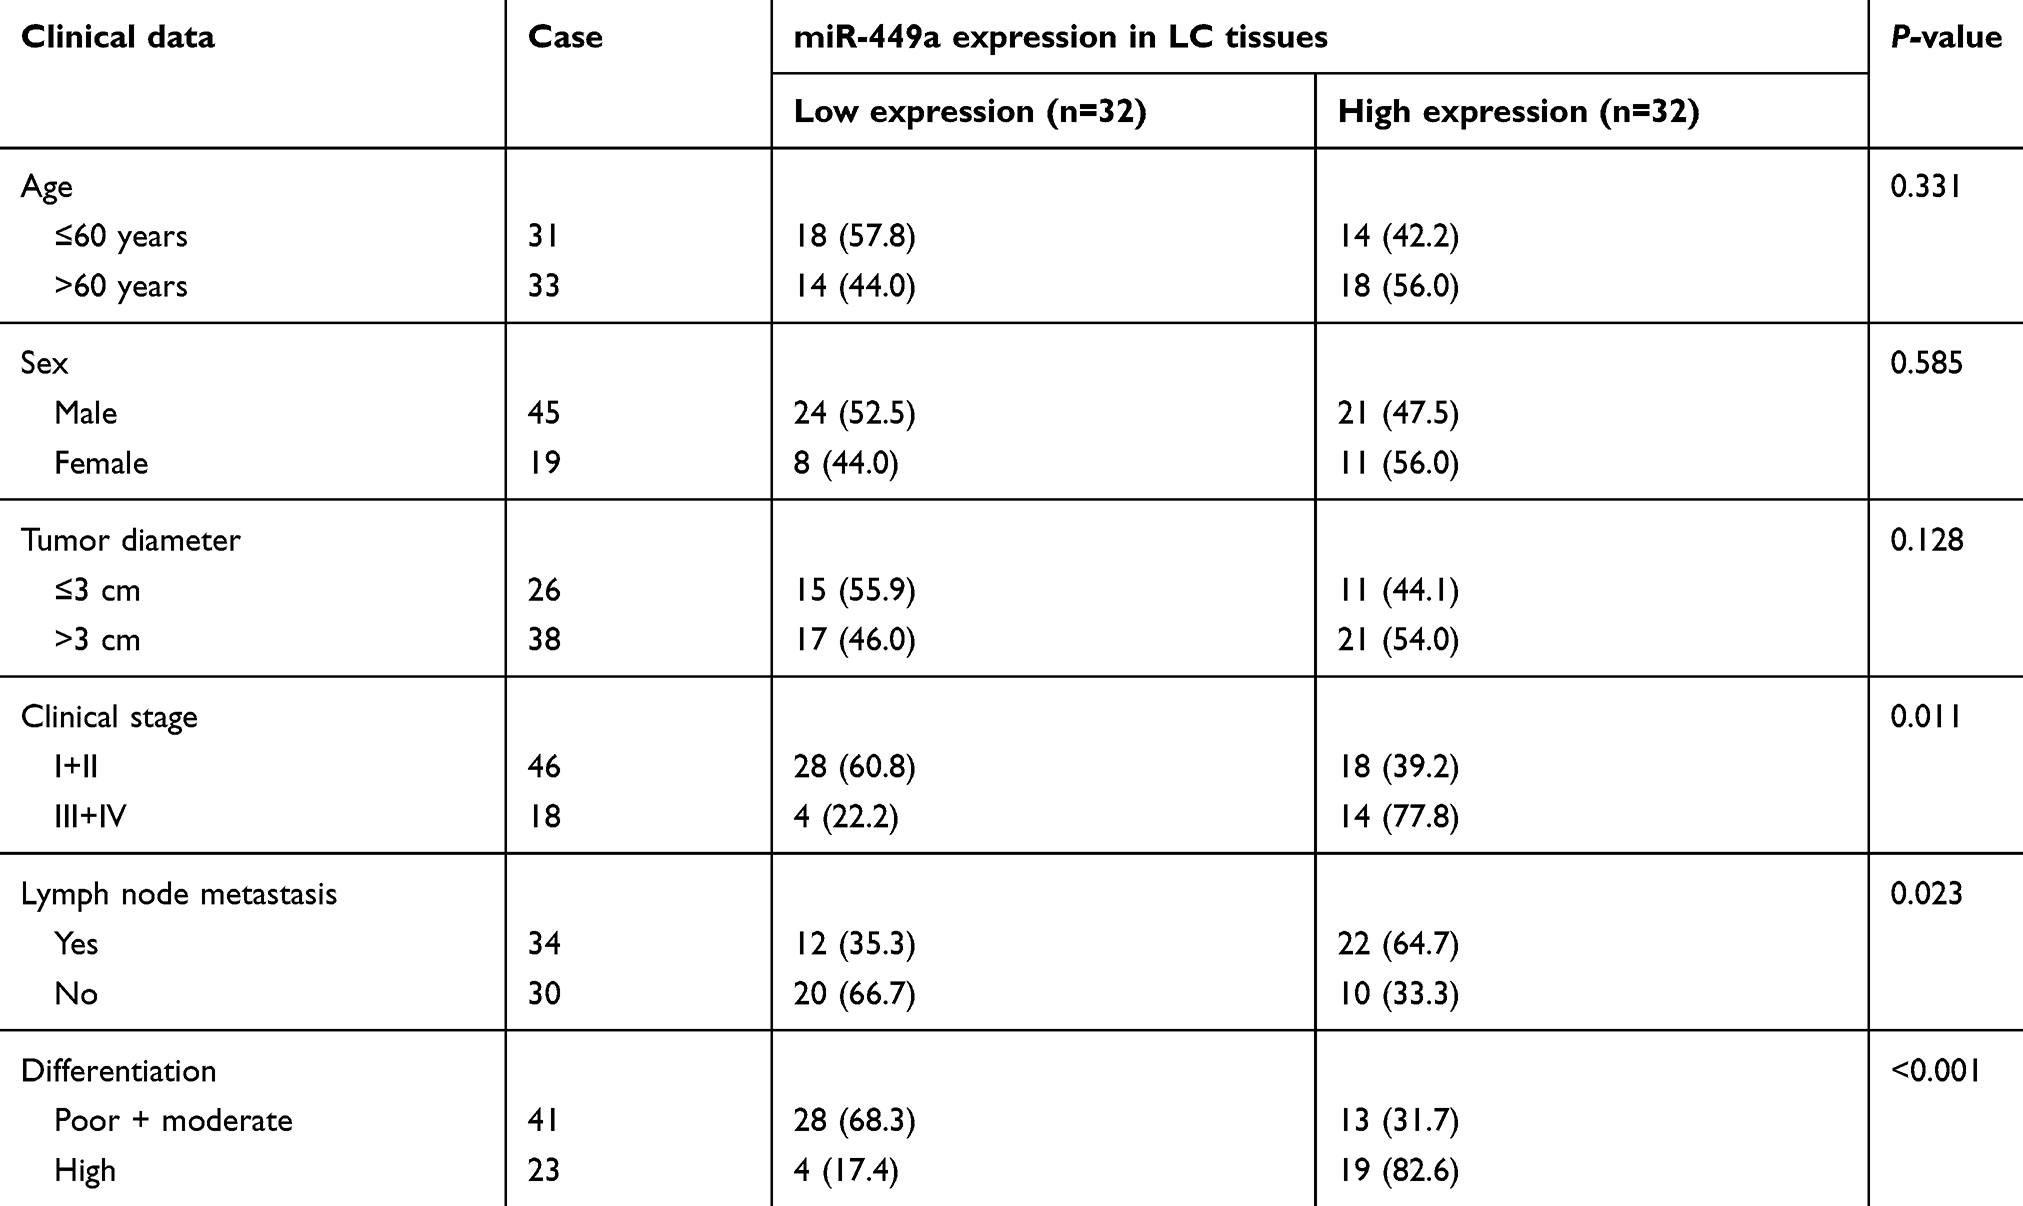 |
Table 2 Relationship between miR-449a expression and LC patients’ clinical characteristics |
Identification of MBs
The prepared MBs were milky white suspension, and they were spherical and uniformly dispersed under the microscope, without obvious aggregation (Figure 2A) with an average particle size of 2.25–4.63 μm (Figure 2B). Subsequently, MBs with particle size larger than 1 μm were filtered out by using a 1-μm filtration membrane. The original concentration of MBs was (1.6–3.2)×109/mL, which was adjusted to (0.8–1.6)×109/mL for experiments.
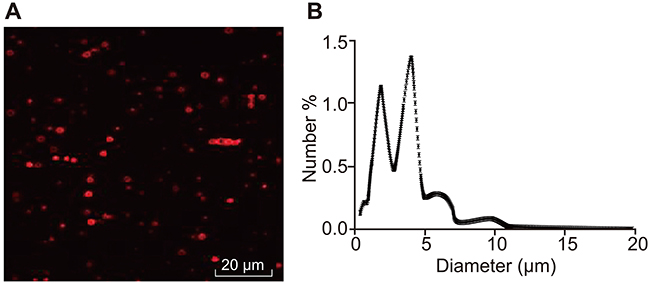 |
Figure 2 Identification of MBs. (A) Prepared MBs observed under the inverted microscope; (B) Particle size of prepared MBs determined by nanometer particle size analyzer. Abbreviation: MB, microbubble. |
Ultrasound-MB-mediated miR-449a enhances the repressing effect of miR-449a on H1299 cell proliferation
In order to construct H1299 and L9981 cell lines with stable overexpression of miR-499a, we used lipofectamine 2000 transfection kit (Invitrogen Inc., Carlsbad, CA, USA) to transfect the constructed miR-449a mimic into H1299 and L9981 cells. After 48 hrs of transfection, the expression of miR-449a in H1299 and L9981 cells increased significantly as showed by RT-qPCR (P<0.05) (Figure 3A), indicating H1299 and L9981 cell lines with overexpression of miR-449a were successfully constructed.
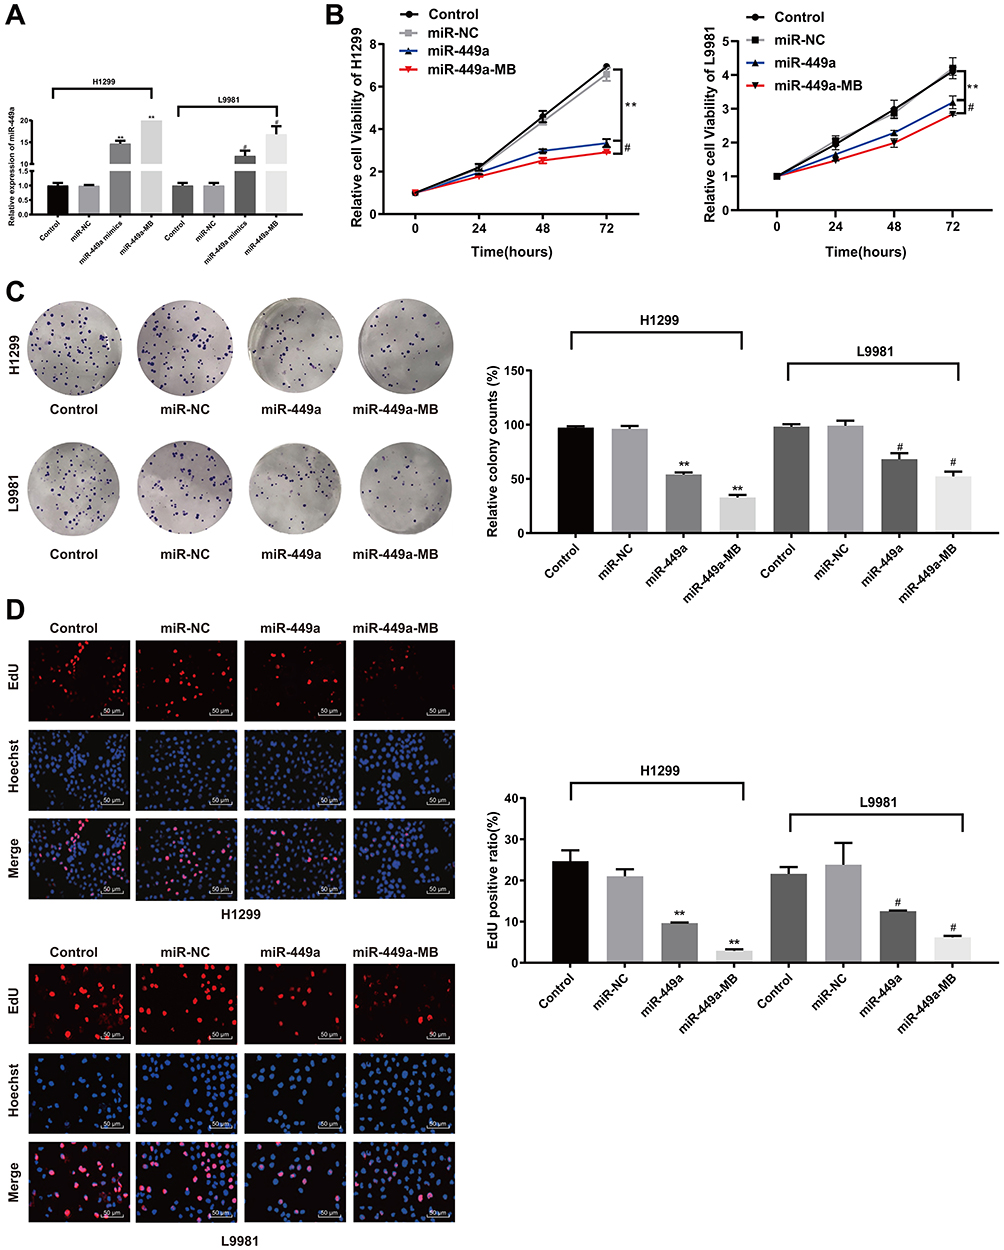 |
Figure 3 Ultrasound-MB-mediated miR-449a inhibits LC cell proliferation. (A) Relative expression of miR-449a detected by RT-qPCR. N represents for 3, **P<0.01; (B) Relative cell viability detected with MTT assay; (C) Relative number of clones detected by colony formation assay; (D) Relative EdU-positive rate measured by EdU assay; Compared to the control group, **P<0.01; Compared to the miR-449a group, #P<0.05. Abbreviations: MB, microbubble; miR-449a, microRNA-449a; RT-qPCR, reverse-transcription quantitative polymerase chain reaction; MTT, 3-(4, 5-dimethylthiazol-2-yl)-2,5-diphenyltetrazolium bromide; EdU, 5-ethynyl-2ʹ-deoxyuridine. |
MTT assay showed that there was no marked differences in cell viability between the blank and miR-449a NC groups (P>0.05), but viability of cells in the miR-449a group at 48 hrs, 72 hrs, and 96 hrs was substantially lower than that in the blank and miR-449a NC groups, and the cell proliferation rate was markedly slowed down. After ultrasound treatment of LC cells in the miR-449a-MB group, the cell viability and proliferation rate were further decreased (all P<0.05) (Figure 3B).
The H1299 and L9981 cell colony formation ability was tested by colony formation assay. The results revealed no notable difference in clone number between the blank group and the miR-449a NC group (P>0.05). But compared to the blank group, the clone number in the miR-449a group decreased obviously, and the clone number in the miR-449a-MB group decreased more notably after ultrasound treatment (all P<0.05) (Figure 3C). These results stated that overexpression of miR-449a inhibited LC cell proliferation.
EdU assay results showed that the DNA replication activity of cells in the blank group was similar to that in the miR-449a NC group. However, after stable transfection of miR-449a, the DNA replication activity of LC cells significantly decreased, showing that the rate of EdU-positive cells decreased dramatically. After ultrasound treatment of LC cells in the miR-449a-MB group, the rate of EdU-positive cells decreased more noticeably (all P<0.05) (Figure 3D).
Ultrasound-MB-mediated miR-449a promotes LC cell cycle G2/M arrest and apoptosis
Flow cytometry was applied to detect the effect of upregulation of miR-449a on cell cycle of LC cells. There were no remarkable differences in cell proportion in each phase between the blank and miR-449a NC groups (all P>0.05); compared to the blank group, the number of cells in G2/M phase was significantly increased while the number of cells in G0/G1 phase was obviously decreased in the miR-449a group (all P<0.05) (Figure 4A). These results suggested that upregulation of miR-449a could induce G2/M arrest in LC cells, and inhibit cell cycle progression.
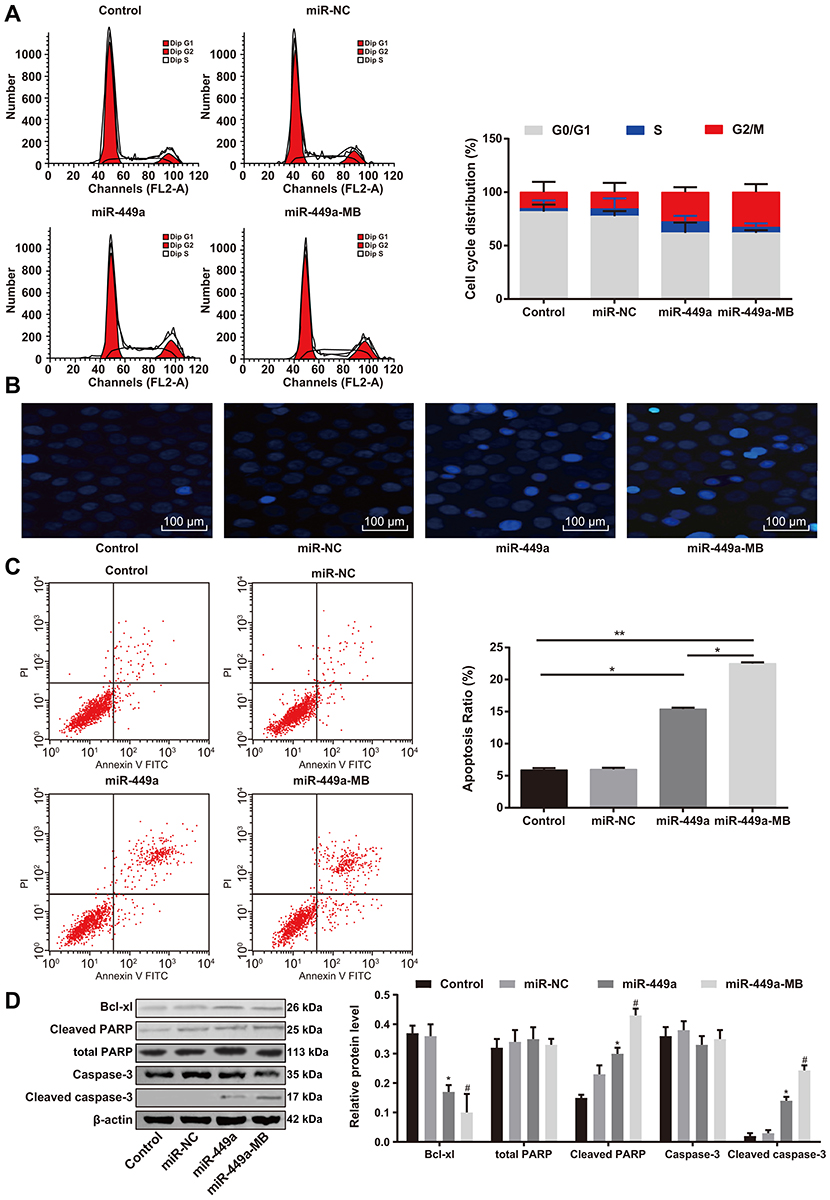 |
Figure 4 Ultrasound-MB-mediated miR-449a induces H1299 G2/M phase arrest and apoptosis. (A) H1299 cell cycle distribution measured by flow cytometry after miR-449a transfection and ultrasound treatment; (B) H1299 cell apoptosis analyzed by Hoechst 33258 staining after miR-449a transfection and ultrasound treatment; (C) H1299 cell apoptosis analyzed by flow cytometry after miR-449a transfection and ultrasound treatment; (D) The apoptosis-related markers (cleaved caspase-3, cleaved PARP and Bcl-xl) detected by Western blot analysis. Significant values compared to control group: *P<0.05, **P<0.01; significant values compared to miR-449a: #P<0.05. Abbreviations: MB, microbubble; miR-449a, microRNA-449a; PARP, poly(ADP-ribose) polymerase; Bcl, B-cell lymphoma. |
Morphological changes of apoptotic cells were observed by Hoechst 33258 staining combined with a fluorescence microscope. The nuclei of normal cells were round, with clear edges and uniform staining, while the nuclei of apoptotic cells showed irregular edges, chromatin agglutination, heavy staining, nuclear pyknosis, and increased fragments of nucleosomes. The apoptotic cells in the miR-449a group were markedly higher than that in the blank and miR-449a NC groups. Moreover, apoptotic cells were increased further in the miR-449a-MB group (all P<0.05) (Figure 4B).
Moreover, flow cytometry also showed the apoptotic rate of H1299 cells in the miR-449a and miR-449a-MB groups was obviously higher than that in the blank and miR-449a NC groups (all P<0.05) (Figure 4C), indicating the restoration of miR-449a could induce LC cell apoptosis.
Western blot analysis results (Figure 4D) suggested that the levels of cleaved caspase-3, cleaved PARP, and Bcl-xl presented little difference between the blank and miR-449a NC groups. But these levels enhanced in the miR-449a group. While compared to the miR-449a group, the levels of cleaved caspase-3 and cleaved PARP were further increased, but Bcl-xl level was downregulated in the miR-449a-MB group (all P<0.05), indicating miR-449a could induce LC cell apoptosis.
Ultrasound-MB-mediated miR-449a further inhibits the growth of xenograft tumors
Western blot analysis was utilized to identify the proteins extracted from tumor tissues. Instead of the synthesis of p53 protein and GRP, NMB protein was found in the tumor tissues, suggesting that the extracted tumor tissues were derived from H1299 cell xenograft tumors (Figure 5A).
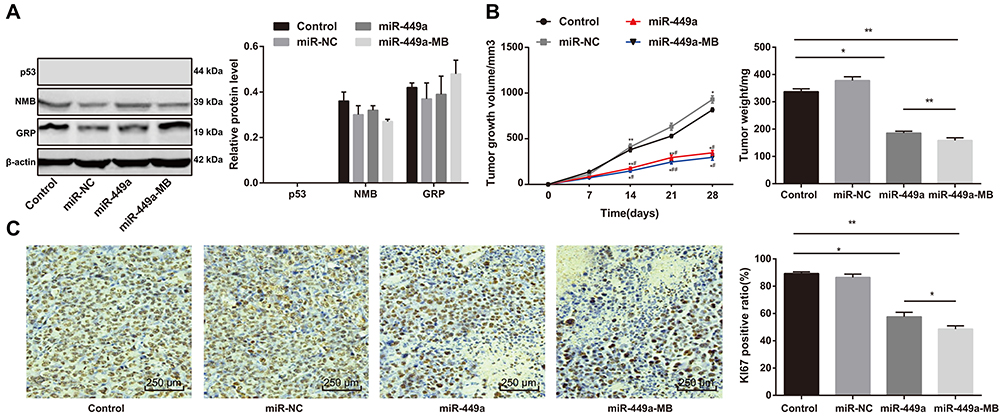 |
Figure 5 Ultrasound-MB-mediated miR-449a inhibits growth of xenograft tumor. (A) Relative protein levels of p53, NMB, and GRP detected by Western blot analysis; (B) Volume and weight of xenograft tumor in vivo; (C) Relative Ki67-positive rate measured by immunohistochemistry, the brown events indicating Ki67 positive and blue events indicating negative. Compared to the control group, *P<0.05, **P<0.01; Compared to the miR-449a group, #P<0.05, ##P<0.01. Abbreviations: MB, microbubble; miR-449a, microRNA-449a; NMB, N-methyl berbamine; GRP, gastric releasing peptide. |
Compared with the blank group, there was no noteworthy difference in tumor volume in the miR-449a NC group, but the tumor was noticeably volume reduced in the miR-449a group. After ultrasound treatment, the tumor volume of the miR-449a-MB group was further reduced, and after 28 days of culture, the weight and volume of tumors in mice were also consistent (all P<0.05) (Figure 5B). It could be concluded that miR-449a inhibited H1299 cell proliferation in vivo and promoted H1299 cell apoptosis, thus inhibiting the growth of xenograft tumors.
Ki67 is a proliferating cell-related nuclear antigen that is closely related to mitosis and is indispensable in cell proliferation. In clinic, the malignant degree of tumors could be judged by the positive rate of Ki67 in tumors. Immunohistochemistry results showed there was no marked difference in the positive rate of Ki67 between the miR-449a NC and blank groups. However, in the miR-449a group, the positive rate of Ki67 obviously decreased and further decreased in the miR-449a-MB group treated by ultrasound (all P<0.05) (Figure 5C). Thus, we came to the conclusion that ultrasound-MB-mediated miR-449a further suppressed the growth of xenograft tumors.
Notch1 is a target gene of miR-449a
It was suggested in a previous study that Notch1 was highly expressed in Chinese patients with small cell LC.15 It was also pointed out that overexpression of Notch1 could promote the proliferation, invasion, and migration of NCI-H358 cells and H1299 cells.16,17 Thus, we employed the online prediction software Target Scan (http://www.targetscan.org/vert_72/) and found that miR-449a directly bound to the 3ʹ-UTR region of Notch1 (Figure 6A). Then, a dual-luciferase reporter gene assay was performed to further identify the binding relation, which showed that there was no dramatic difference in luciferase activity between the MT+mimic group and the MT+NC group, but the luciferase activity in the WT+mimic group was greatly lower than that in the WT+NC group (P<0.01) (Figure 6B).
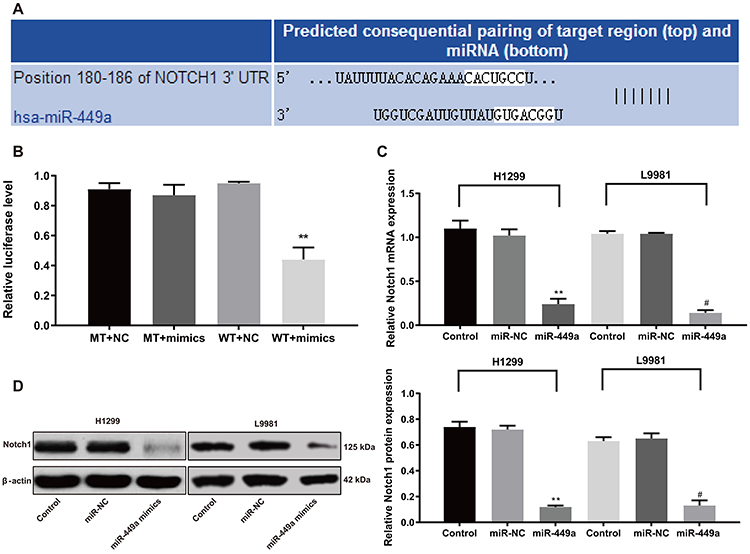 |
Figure 6 miR-449a inhibits H1299 proliferation by regulating Notch1 activity. (A) Target scan predicts miR-449a and Notch1 binding sequence; (B) Relative luciferase activity; (C) Relative mRNA expression of Notch1 detected by RT-qPCR; (D) Relative protein level of Notch1 detected by Western blot analysis. **P<0.01. Significant values compared to miR-449a: #P<0.05. Abbreviations: miR-449a, microRNA-449a; RT-qPCR, reverse-transcription quantitative polymerase chain reaction. |
The results of RT-qPCR and Western blot analysis showed no noteworthy difference in Notch1 levels of in H1299 and L9981 cells between the miR-449a NC and blank groups. But Notch1 levels in the miR-449a group were remarkably lower than that in the blank group (all P<0.05) (Figure 6C and D). These results suggested miR-449a inhibited the activity of H1299 and L9981 cells by targeting Notch1.
Specific activation of Notch1 alleviates the inhibition of cell activity induced by overexpression of miR-449a
To further verify the relationship between Notch1 and miR-449a in H1299 cells, we added Notch-specific activator (Recombinant Human Jagged 1 Fc Chimera Protein, 1277-JG-050, R&D) into H1299 cells in the miR-449a group. The results showed that the addition of Notch1-specific activator Jagged 1 could alleviate the inhibition of cell activity (Figure 7A–D) induced by overexpression of miR-449a and reduce the apoptosis (Figure 7E–F).
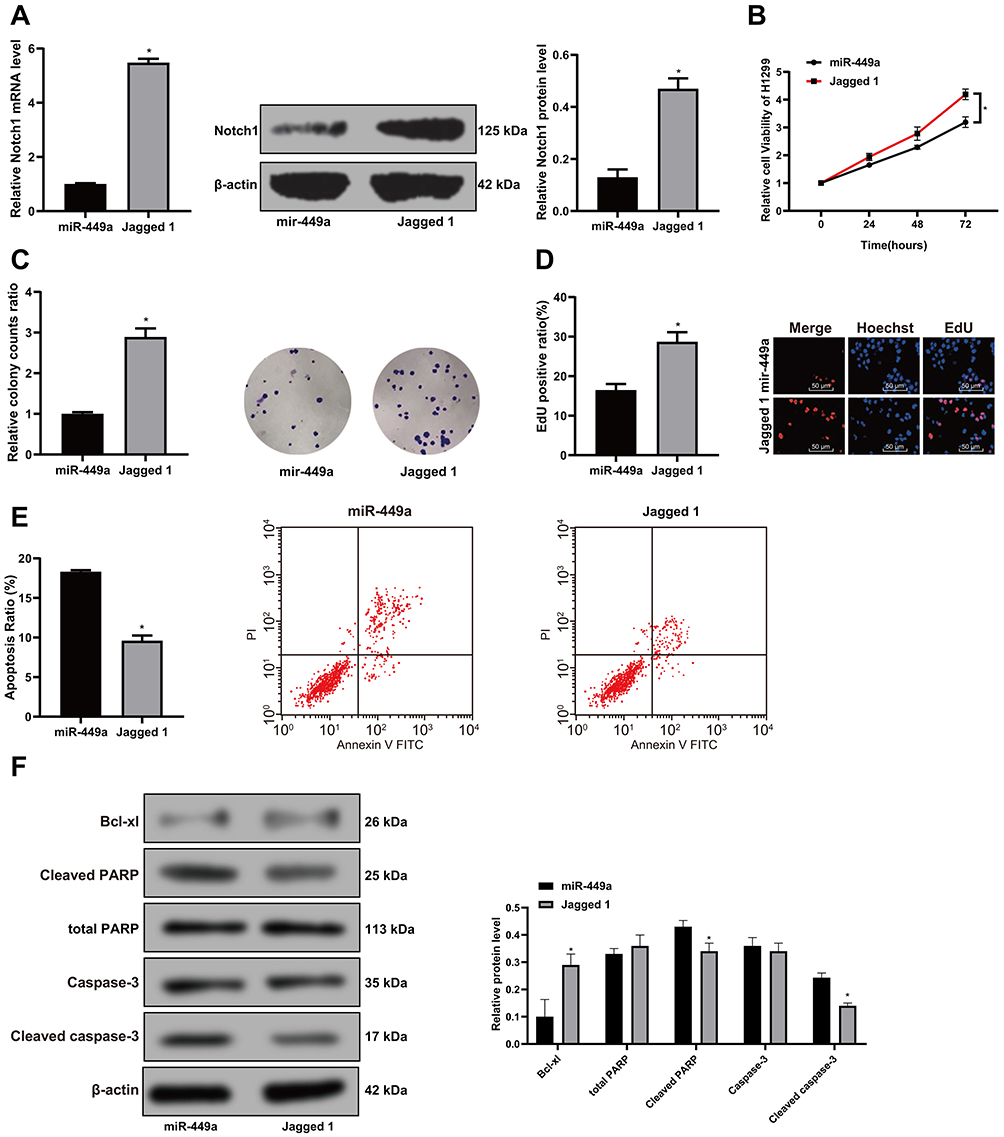 |
Figure 7 Activation of Notch1 alleviates the inhibition of cellular activity induced by overexpression of miR-449a. (A) Relative expression of Notch1 mRNA and protein detected by RT-qPCR and Western blot after the Jagged 1 treatment. N represents for 3, *P<0.01; (B) Overexpression of miR-449a could reduce H1299 cell viability; (C–D) H1299 cell proliferation was suppressed after the miR-449a transfection by colonies experiments and EdU staining; (E–F) H1299 apoptosis was determined by flow cytometry and Western blot assay, Compared to the miR-449a group, *P<0.05. |
Discussion
As a most frequently diagnosed and fatal human cancers, LC patients showed very low 5-year survival rate owing to lack of recognized markers in the early stage.18 Importantly, it had been highlighted that miR-218 participated in LC progression in vivo, and overexpression of miR-218 repressed H1299 cell migration and invasion.19 The feasibility of ultrasound MB-mediated antisense miR-224 and miR-122a was verified in NSCLC.20 In this study, we assumed there may be roles of ultrasound-MB-mediated miR-449a in LC cell growth. Consequently, our findings revealed overexpression of miR-449a inhibited LC cell growth, and ultrasound-MB-mediated miR-449a could further enhance the repressing effects of miR-449a on LC progression.
First, the results of RT-qPCR showed the expression rate of miR-449a in LC was noticeably lower than that in paracancerous tissues and lung epithelial cells. Meanwhile, in LC tissues, miR-449a expression was related to clinical staging, lymph node metastasis, and tumor differentiation. Ren et al showed miR-449a level was obviously reduced in human LC tissues and its downregulation had close association with cancer recurrence and poor survival rate of LC patients.9 Luo et al reported that lowly expressed miR-449a was correlated with advanced pathological staging, lymph node metastasis and poor survival in NSCLC patients.8 Therefore, low expression of miR-449a might be used as a possible diagnostic biomarker for LC. Besides, our data discovered miR-449a overexpression could suppress LC cell proliferation, induce G2/M cell cycle arrest, induce cell apoptosis, presenting elevated cleaved caspase-3, cleaved PARP, and reduce Bcl-xl expression. miR-449a level was dramatically decreased in type II endometrial cancer tissues, and its overexpression inhibited cell proliferation and invasion, and promoted cell apoptosis in endometrial cancer.21 miR-449a overexpression inhibited proliferation and induced senescence in LC cells, thus suppressing the tumorigenicity of A549 cells in nude mouse xenograft model.9 You J and Zhang Y found overexpressed miR-449a induced LC cell cycle arrest, promoted cell apoptosis, and suppressed cell growth,22 which was in agreement with our results. Bcl-xl, a critical apoptosis inhibitor, was always overexpressed in NSCLC, contributing to inhibited apoptosis and undesirable prognosis, thus played a key role in tumor progression.23 Caspase-3 was a key effector protease to be cleaved and activated in the process of apoptosis, which in turn cleaved PARP, whose cleavage was a helpful biomarker of apoptosis.24 A novel research claimed that the treatment of fucoidan combined with cisplatin suppressed LC cell viability by promoting apoptotic responses, namely increasing cleaved caspase-3 and PARP expression.25 Likely, miR-224 attenuated tumor necrosis factor-α-induced apoptosis by targeting caspase-3, leading to the reduction of cleaved PARP1 in LC cells.26
Moreover, bioinformatics prediction and dual-luciferase reporter gene assay verified miR-449a could target Notch1 and negatively regulate its expression. A former study stated activation of Notch1 suppressed cell growth, invasion, and migration in small cell lung cancer and was also associated with poor outcome in NSCLC patients.27 Capuano et al identified that miR-449a could bind to Notch1, and miR-449a overexpression inhibited Notch1 expression in celiac disease.28 That is to say, the effects of high miR-449a expression in LC cell proliferation and apoptosis may be achieved by the inhibition of Notch1. From the results obtained in the study, we came to the conclusion that ultrasound-MB-mediated miR-449a strengthened the repressive effects of miR-449a on LC development. Ultrasound MBs were well-known nanobubbles and showed the advantages of high safety, stability, and transfection efficiency.29 Yanlei Ji et al confirmed the application of ultrasound-MB-mediated miR-133a in breast cancer treatment.14 Interestingly, A549 cells treated with ultrasound MBs-mediated-antisense miR-224 and miR-122a displayed inhibited cell activity, invasion, and colony formation ability, giving a strong basis for gene therapies of NSCLC.20
All in all, our study supported miR-449a overexpression repressed LC cell growth in vitro and in vivo, and ultrasound-MB-mediated miR-449a reinforced the repressive effects of miR-449a in LC progression. These results indeed discovered a novel approach for LC treatment. Meanwhile, we found miR-449a could target a series of genes such as SATB2, SIRT1, ADAM10, MAP2K1, CRIP2, and Notch1. In the future, we will further explore the mechanism of other targets of miR-449a. Although our findings offer therapeutic implication in LC treatment, the experiment results and effective application into clinical practice need further validation.
Data availability statement
All the data generated or analyzed during this study are included in this published article.
Disclosure
The authors declare no conflict of interest.
References
1. Santos FN, de Castria TB, Cruz MR, Riera R. Chemotherapy for advanced non-small cell lung cancer in the elderly population. Cochrane Database Syst Rev. 2015;(10):CD010463.
2. Bach PB, Mirkin JN, Oliver TK, et al. Benefits and harms of CT screening for lung cancer: a systematic review. JAMA. 2012;307(22):2418–2429. doi:10.1001/jama.2012.5521
3. Reck M, Popat S, Reinmuth N, et al. Metastatic non-small-cell lung cancer (NSCLC): ESMO clinical practice guidelines for diagnosis, treatment and follow-up. Ann Oncol. 2014;25(Suppl 3):iii27–iii39. doi:10.1093/annonc/mdu199
4. Zarogoulidis P, Baka S, Labaki S, Lazaridis G, Trakada G. Targeted lung cancer treatments and eye metastasis. Med Hypothesis Discov Innov Ophthalmol. 2017;6(1):10–13.
5. Yao Z, Fenoglio S, Gao DC, et al. TGF-beta IL-6 axis mediates selective and adaptive mechanisms of resistance to molecular targeted therapy in lung cancer. Proc Natl Acad Sci U S A. 2010;107(35):15535–15540. doi:10.1073/pnas.1009472107
6. Shen J, Liao J, Guarnera MA, et al. Analysis of MicroRNAs in sputum to improve computed tomography for lung cancer diagnosis. J Thorac Oncol. 2014;9(1):33–40. doi:10.1097/JTO.0000000000000025
7. Mercey O, Popa A, Cavard A, et al. Characterizing isomiR variants within the microRNA-34/449 family. FEBS Lett. 2017;591(5):693–705. doi:10.1002/1873-3468.12595
8. Luo W, Huang B, Li Z, et al. MicroRNA-449a is downregulated in non-small cell lung cancer and inhibits migration and invasion by targeting c-Met. PLoS One. 2013;8(5):e64759. doi:10.1371/journal.pone.0064759
9. Ren XS, Yin MH, Zhang X, et al. Tumor-suppressive microRNA-449a induces growth arrest and senescence by targeting E2F3 in human lung cancer cells. Cancer Lett. 2014;344(2):195–203. doi:10.1016/j.canlet.2013.10.031
10. Chen Y, Li D, Liu H, et al. Notch-1 signaling facilitates survivin expression in human non-small cell lung cancer cells. Cancer Biol Ther. 2011;11(1):14–21. doi:10.4161/cbt.11.1.13730
11. Yuan X, Wu H, Han N, et al. Notch signaling and EMT in non-small cell lung cancer: biological significance and therapeutic application. J Hematol Oncol. 2014;7:87. doi:10.1186/s13045-014-0087-z
12. Suzuki R, Oda Y, Utoguchi N, Maruyama K. Progress in the development of ultrasound-mediated gene delivery systems utilizing nano- and microbubbles. J Control Release. 2011;149(1):36–41. doi:10.1016/j.jconrel.2010.05.009
13. Wang DS, Panje C, Pysz MA, et al. Cationic versus neutral microbubbles for ultrasound-mediated gene delivery in cancer. Radiology. 2012;264(3):721–732. doi:10.1148/radiol.12112368
14. Ji Y, Han Z, Shao L, Zhao Y. Evaluation of in vivo antitumor effects of low-frequency ultrasound-mediated miRNA-133a microbubble delivery in breast cancer. Cancer Med. 2016;5(9):2534–2543. doi:10.1002/cam4.840
15. Hu J, Wang Y, Zhang Y, et al. Comprehensive genomic profiling of small cell lung cancer in Chinese patients and the implications for therapeutic potential. Cancer Med. 2019. doi:10.1002/cam4.2199
16. Liu J, Liu S, Deng X, et al. MicroRNA-582-5p suppresses non-small cell lung cancer cells growth and invasion via downregulating NOTCH1. PLoS One. 2019;14(6):e0217652. doi:10.1371/journal.pone.0217652
17. Wang X, Zhang G, Cheng Z, et al. Knockdown of LncRNA-XIST suppresses proliferation and TGF-beta1-induced EMT in NSCLC through the Notch-1 pathway by regulation of miR-137. Genet Test Mol Biomarkers. 2018;22(6):333–342. doi:10.1089/gtmb.2018.0026
18. Torre LA, Siegel RL, Jemal A. Lung cancer statistics. Adv Exp Med Biol. 2016;893:1–19. doi:10.1007/978-3-319-24223-1_1
19. Shi ZM, Wang L, Shen H, et al. Downregulation of miR-218 contributes to epithelial-mesenchymal transition and tumor metastasis in lung cancer by targeting Slug/ZEB2 signaling. Oncogene. 2017;36(18):2577–2588. doi:10.1038/onc.2016.414
20. Guo XY, Lu M, Chen XQ, He FD, Li A. Correlation study of biological characteristics of non-small cell lung cancer A549 cells after transfecting plasmid by microbubble ultrasound contrast agent. Asian Pac J Trop Med. 2016;9(6):582–586. doi:10.1016/j.apjtm.2016.04.007
21. Ye W, Xue J, Zhang Q, et al. MiR-449a functions as a tumor suppressor in endometrial cancer by targeting CDC25A. Oncol Rep. 2014;32(3):1193–1199. doi:10.3892/or.2014.3303
22. You J, Zhang Y, Liu B, et al. MicroRNA-449a inhibits cell growth in lung cancer and regulates long noncoding RNA nuclear enriched abundant transcript 1. Indian J Cancer. 2014;51(Suppl 3):e77–e81. doi:10.4103/0019-509X.154055
23. Othman N, In LL, Harikrishna JA, Hasima N. Bcl-xL silencing induces alterations in hsa-miR-608 expression and subsequent cell death in A549 and SK-LU1 human lung adenocarcinoma cells. PLoS One. 2013;8(12):e81735. doi:10.1371/journal.pone.0081735
24. Xu P, Cai X, Zhang W, et al. Flavonoids of Rosa roxburghii Tratt exhibit radioprotection and anti-apoptosis properties via the Bcl-2(Ca(2+))/Caspase-3/PARP-1 pathway. Apoptosis. 2016;21(10):1125–1143. doi:10.1007/s10495-016-1270-1
25. Hsu HY, Lin TY, Hu CH, Shu DTF, Lu MK. Fucoidan upregulates TLR4/CHOP-mediated caspase-3 and PARP activation to enhance cisplatin-induced cytotoxicity in human lung cancer cells. Cancer Lett. 2018;432:112–120. doi:10.1016/j.canlet.2018.05.006
26. Cui R, Kim T, Fassan M, et al. MicroRNA-224 is implicated in lung cancer pathogenesis through targeting caspase-3 and caspase-7. Oncotarget. 2015;6(26):21802–21815. doi:10.18632/oncotarget.5224
27. Quan X, Yin Z, Fang X, Zhou B. Single nucleotide polymorphism rs3124599 in Notch1 is associated with the risk of lung cancer in northeast Chinese non-smoking females. Oncotarget. 2017;8(19):31180–31186. doi:10.18632/oncotarget.16101
28. Capuano M, Iaffaldano L, Tinto N, et al. MicroRNA-449a overexpression, reduced NOTCH1 signals and scarce goblet cells characterize the small intestine of celiac patients. PLoS One. 2011;6(12):e29094. doi:10.1371/journal.pone.0029094
29. Guo X, Guo S, Pan L, Ruan L, Gu Y, Lai J. Anti-microRNA-21/221 and microRNA-199a transfected by ultrasound microbubbles induces the apoptosis of human hepatoma HepG2 cells. Oncol Lett. 2017;13(5):3669–3675. doi:10.3892/ol.2017.5910
 © 2019 The Author(s). This work is published and licensed by Dove Medical Press Limited. The full terms of this license are available at https://www.dovepress.com/terms.php and incorporate the Creative Commons Attribution - Non Commercial (unported, v3.0) License.
By accessing the work you hereby accept the Terms. Non-commercial uses of the work are permitted without any further permission from Dove Medical Press Limited, provided the work is properly attributed. For permission for commercial use of this work, please see paragraphs 4.2 and 5 of our Terms.
© 2019 The Author(s). This work is published and licensed by Dove Medical Press Limited. The full terms of this license are available at https://www.dovepress.com/terms.php and incorporate the Creative Commons Attribution - Non Commercial (unported, v3.0) License.
By accessing the work you hereby accept the Terms. Non-commercial uses of the work are permitted without any further permission from Dove Medical Press Limited, provided the work is properly attributed. For permission for commercial use of this work, please see paragraphs 4.2 and 5 of our Terms.