")
Back to Journals » Drug Design, Development and Therapy » Volume 16
Ultrasound-Assisted Extraction of Total Saponins from Aralia taibaiensis: Process Optimization, Phytochemical Characterization, and Mechanism of α-Glucosidase Inhibition
Authors Li H, Zhai B, Sun J , Fan Y, Zou J, Cheng J, Zhang X, Shi Y, Guo D
Received 21 October 2021
Accepted for publication 15 December 2021
Published 6 January 2022 Volume 2022:16 Pages 83—105
DOI https://doi.org/10.2147/DDDT.S345592
Checked for plagiarism Yes
Review by Single anonymous peer review
Peer reviewer comments 2
Editor who approved publication: Dr Jianbo Sun
Huan Li,1,2 Bingtao Zhai,1,2 Jing Sun,1,2 Yu Fan,3 Junbo Zou,1,2 Jiangxue Cheng,1,2 Xiaofei Zhang,1,2 Yajun Shi,1,2 Dongyan Guo1,2
1State Key Laboratory of Research & Development of Characteristic Qin Medicine Resources (Cultivation), Shaanxi University of Chinese Medicine, Xi’an, 712046, People’s Republic of China; 2The Key Laboratory of Basic and New Drug Research of Traditional Chinese Medicine, Shaanxi University of Chinese Medicine, Xi’an, 712046, People’s Republic of China; 3College of Basic Medicine, Shaanxi University of Chinese Medicine, Xi’an, 712046, People’s Republic of China
Correspondence: Dongyan Guo
State Key Laboratory of Research & Development of Characteristic Qin Medicine Resources (Cultivation), Shaanxi University of Chinese Medicine, Xi’an, 712046, People’s Republic of China
Tel +86 29-3818-5180
Email [email protected]
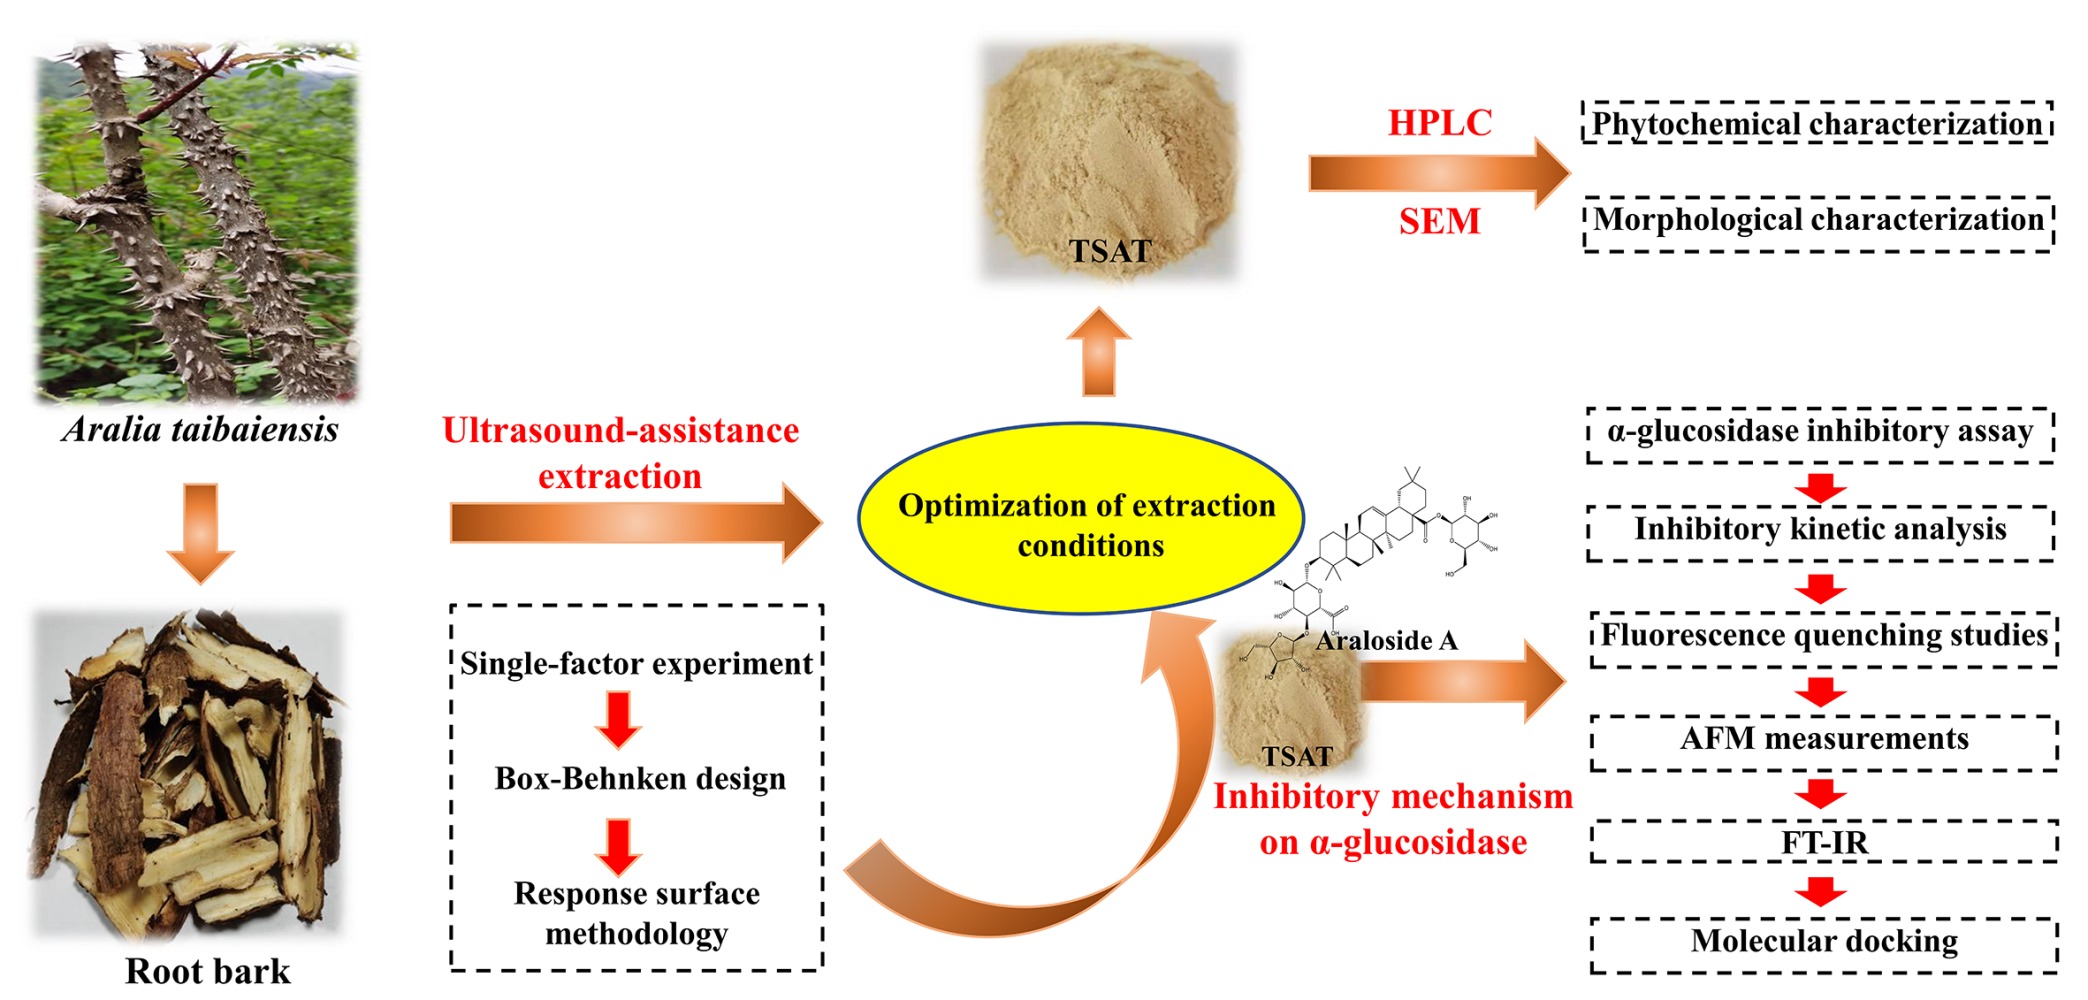
Purpose: Aralia taibaiensis, a medicinal food plant, and total saponins from its root bark extract inhibit α-glucosidase activity, which is associated with type 2 diabetes; however, the inhibitory mechanism is unknown. Furthermore, a green extraction technique superior to conventional hot reflux extraction (HRE) is needed for the rapid and easy extraction of A. taibaiensis total saponins (TSAT) to exploit and utilize this resource. Our aim was to develop a green extraction method for obtaining TSAT and to investigate the mechanism by which TSAT inhibits α-glucosidase.
Materials and Methods: In this study, the ultrasound-assisted extraction (UAE) process was optimized using a Box–Behnken design, and the extraction mechanism was investigated using scanning electron microscopy (SEM). High-performance liquid chromatography (HPLC) was used for qualitative and quantitative analyses of TSAT. In vitro glycosylation assays, enzyme kinetics, fluorescence spectroscopy measurements, atomic force microscopy (AFM), Fourier transform infrared spectroscopy (FT-IR) and molecular docking techniques were used to investigate the mechanism by which the A. taibaiensis active ingredients inhibit α-glucosidase.
Results: The optimal parameters for the extraction yield were obtained as an ethanol concentration of 73%, ultrasound time of 34 min, ultrasound temperature of 61 °C and solid–liquid ratio of 16 g/mL, which were better than HRE. The SEM analysis showed that UAE effectively disrupted plant cells, thus increasing the TSAT yield. In vitro α-glucosidase inhibition experiments showed that both TSAT and its active ingredient, araloside A, inhibited α-glucosidase activity by binding to α-glucosidase, thereby changing the conformation and microenvironment of α-glucosidase to subsequently inhibit enzyme activity.
Conclusion: The optimal extraction conditions identified here established a basis for future scale-up of ultrasound extraction parameters with the potential for obtaining maximum yields. In vitro enzyme inhibition experiments investigated the mechanism of the TSAT interaction with α-glucosidase and further explored whether araloside A may be the main contributor to the good inhibition of α-glucosidase activity by TSAT.
Keywords: Aralia taibaiensis total saponins, ultrasound-assisted extraction, Box–Behnken design, α-glucosidase, inhibitory mechanism
Graphical Abstract:
Introduction
As one of the largest global health problems in the 21st century, diabetes is a metabolic disease characterized by elevated blood glucose levels that occurs when insulin production is inadequate or insulin is underutilized in the body. Postprandial hyperglycaemia is the main feature of type 2 diabetes and its complications. A common strategy to reduce blood sugar levels is to inhibit the activity of carbohydrate hydrolase, especially α-glucosidase located in the brush border of small intestinal epithelial cells.1,2 α-Glucosidase inhibitors improve postprandial hyperglycaemia by reducing enzyme activity and delaying the digestion of carbohydrates. Some drugs, such as acarbose, voglibose and miglitol, are common α-glucosidase inhibitors. However, in clinical applications, they often cause flatulence, abdominal pain and diarrhoea.3 Therefore, the identification of effective α-glucosidase inhibitors with few side effects is very important. Pentacyclic triterpene saponins are secondary metabolites that are widely distributed in various plants, including Lagerstroemia, Schisandra and Xanthoceras sorbifolia Bunge, and have been regarded as potential sources of therapeutic agents for diabetes due to their antihyperglycaemic properties.4–6 Hou et al7 reported that six pentacyclic triterpene compounds isolated from the leaves of Lagerstroemia speciosa exhibited good inhibitory activity against α-glucosidase. In addition, Ding et al reported that the pentacyclic triterpene saponin betulinic acid tightly binds to the active site of α-glucosidase, which might hinder the entrance of the substrate, leading to decreased enzyme activity.8
Aralia taibaiensis (Araliaceae) is a medicinal and edible plant that is widely distributed in the Qinba Mountains in western China.9 In China, A. taibaiensis root bark extract has been used to treat diabetes for many years, and its main active ingredients are pentacyclic triterpenoid saponins.10 Previous studies reported that the antidiabetic activity of A. taibaiensis is related to its high saponin content.11 In addition, A. taibaiensis total saponins (TSAT) exert an inhibitory effect on α-glucosidase in vitro and possess antioxidant activity.11,12 Researchers have speculated that the C-3 position in the active ingredient structure, such as the β-D-glucopyranosyl-(1→2)-[β-D-glucopyranosyl-(1→3)]-β-D-glucuronopyranosyl oligosaccharide moiety, and other glycosyl substitutions are responsible for the antioxidant and antiglycosyl activities.13 However, to the best of our knowledge, these studies mainly focused on the inhibition of α-glucosidase activity but did not describe its inhibitory mechanism.
In addition, TSAT was obtained using traditional extraction methods, which were time-consuming, costly and inefficient. In recent years, ultrasound-assisted extraction (UAE) has recently attracted significant research interest due to its natural advantages over conventional methods, such as higher saponin content yields, faster release kinetics, shorter processing time, and greater economic value.14–16 When ultrasound is applied, a strong mixing effect of the liquid medium is induced, producing cavitation bubbles. The explosion of the cavitation bubbles generates shock waves that lead to high shear and turbulence in the liquid medium and accelerate interparticle collisions. When cavitation bubbles explode continuously on or near the surface of the plant tissue matrix, the high velocity shock waves cause tissue surface flaking, erosion and particle fragmentation, which reduce the size of tissue particles, increase the surface area and disrupt the cellular junction structure of the plant matrix, thereby increasing mass transfer efficiency and improving extraction rates.17–20 However, the shortcomings of UAE are that the effective action area (ultrasonic) is restricted by the ultrasonic attenuation factor. If the diameter of the extraction tank is too large, an ultrasonic blank area is formed on the peripheral wall of the tank.21 Admittedly, the extraction rate of active plant components is usually influenced by factors such as temperature, time, liquid to solid ratio, ultrasound power and solvent polarity.22–24 Therefore, the extraction process must be optimized to maximize the extraction rate and pharmacological effects of bioactive substances. The response surface method (RSM) is a widely used mathematical and statistical tool for optimizing extraction processes to account for the interaction of independent variables.25 The Box–Behnken design (BBD), one type of RSM, is easier to interpret and perform than other designs.26
To the best of our knowledge, no studies have reported the optimization of TSAT with UAE based on yield, and the lack of understanding of the in vitro hypoglycaemic mechanism of TSAT and its active compounds has limited the development and utilization of A. taibaiensis. This study aimed to use BBD-RSM to determine the best condition for UAE of TSAT and obtain the best yield. In addition, using enzyme kinetic analyses, fluorescence quenching, AFM, FT-IR and molecular docking, the mechanism of action of TSAT and its active compounds on α-glucosidase was thoroughly studied. This research will provide new insights into the development and utilization of A. taibaiensis to consolidate its many valuable pharmacological attributes.
Materials and Methods
Materials and Chemicals
Tarasaponin IV (≥98%, Lot number: HS191222B1), araloside C (≥98%, Lot number: HS191219B1), stipuleanoside R2 (≥98%, Lot number: HS191221B1), pseudoginsenoside RT1 (≥98%, Lot number: HS191224B1), araloside A (≥98%, Lot number: 18091305) and Chikusetsu saponin Iva (≥98%, Lot number: 111861–201001) standards were provided by Chenguang Biotechnology Co., Ltd. (Baoji, China). Ascorbic acid were obtained from Sigma–Aldrich (St. Louis, MO, USA). Acarbose α-glucosidase (EC 3.2.1.20) from Saccharomyces cerevisiae was obtained from Shanghai Yuan Ye Biotechnology Co., Ltd. (Shanghai, China) and was dissolved in sodium phosphate buffer (0.1 M, pH 6.8). Acarbose and p-nitrophenyl-α-D-glucopyranoside (pNPG), which were purchased from Sigma–Aldrich Co. (St Louis, MO, USA), were both dissolved in sodium phosphate buffer. The DMSO content was less than 0.2% and had no effect on the activity of α-glucosidase in the present study. HPLC-grade acetonitrile was obtained from Thermo Fisher Scientific Co. (Waltham, MA, USA). All other reagents used were of analytical grade and purchased from Aladdin (Shanghai, China), and ultrapure water was used throughout the whole experiment.
Plant Material
The root bark of A. taibaiensis was collected in the Qinba Mountains, Shaanxi Province, China, and was botanically identified by Dr. Jitao Wang (Shaanxi University of Chinese Medicine). A voucher specimen (SUCM, No. 20201003) was deposited in the Herbarium of Shaanxi University of Chinese Medicine. A. taibaiensis root bark was washed with double distilled water, dried at 60 °C and crushed. Before the experiment, the powder was placed in a cool and dry place.
UAE Procedure
The UAE of TSAT was performed in a water-bath sonicator (KQ500DE, Ultrasonic Instrument Factory, Kunshan city, China). The effects of different variables, such as the solvent concentration, ultrasound power, ultrasound time, ultrasound temperature, liquid to solid ratio and number of extractions, are known to affect the extraction rate. In this case, six process variables, ie, the ethanol concentration (%), ultrasound power (W), ultrasound time (min), ultrasound temperature (°C), solid–liquid ratio (g/mL) and number of extractions, were tested in a preliminary experiment to determine the effects of factors and levels on the TSAT extraction process (shown in Table 1). All operations were performed three times in parallel, and the optimum extraction process was determined based on the maximum yield of TSAT.
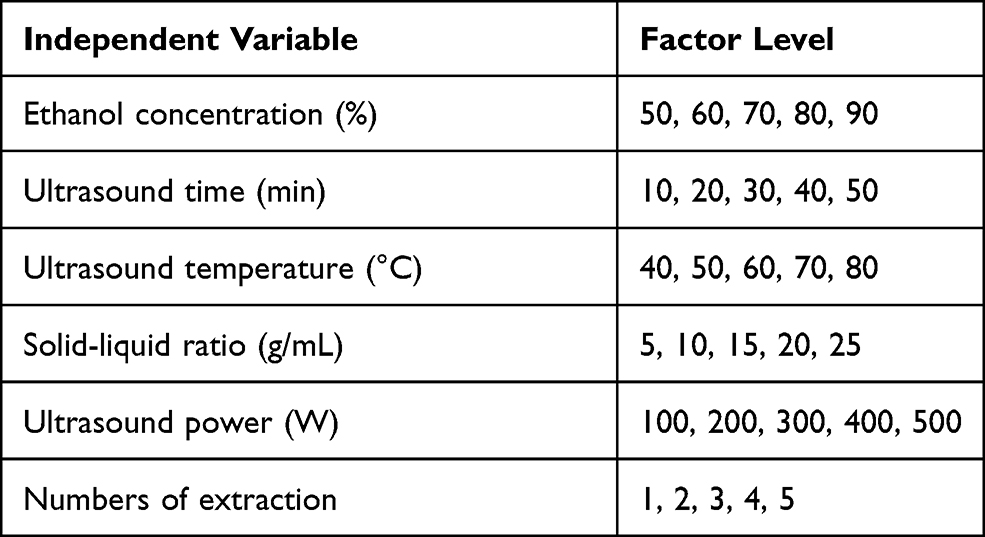 |
Table 1 Design of the Single Factor Experiment |
Optimization by RSM
BBD-RSM was used to optimize the extraction process parameters and to obtain their interactions based on the results of single-factor tests. The effects of independent variables of UAE on the TSAT contents were investigated using the following indicators: ethanol concentration (%) (X1), ultrasound time (min) (X2), ultrasound temperature (°C) (X3) and solid–liquid ratio (g/mL) (X4). A mathematical second-order polynomial regression equation was used to calculate the value of Y, as shown in Equation (1):
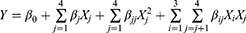
where Y is the response variable; β0 is a fixed value that indicates the intercept of the model; βj, βjj and βij are the linear, quadratic and interactive coefficients, respectively; and Xi and Xj represent the coded level of independent variables.
Conventional Heat Reflux Extraction (HRE)
A comparison between the HRE and UAE was carried out to estimate the efficiency of the UAE process established in the present study. The HRE of TSAT from was performed under the optimized UAE conditions with slight modifications. Briefly, 5.0 g of the preprepared sample were extracted three times under reflux with 75 mL of 70% ethanol at 78°C, each time for 2 h. After HRE, the combined extract solution was then concentrated in vacuo, and the extract was stored at 4°C until further analysis.
Determination of TSAT
The total saponin content of the extracts was determined using the method described by Hu et al with slight modifications.23 The TSAT content was reported as equivalents of oleanolic acid, and the absorbance was recorded immediately at 545 nm using a UV–Vis spectrophotometer (UV-2600, Shimadzu, Kyoto, Japan). The regression equation of the oleanolic acid standard curve was obtained as Y =38.062X-0.2648 (R2 = 0.9993).
Regarding the method for standard curve preparation, 1 mL of prepared sample was used for standard curve preparation, and 1 mL of prepared sample was added to measure the saponin content in the extract. The total saponins extraction rate was calculated. The yield rate of TSAT was calculated using the following equation:
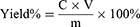
where C is the saponin content in prepared samples (mg/mL), V is the volume of prepared samples (mL), and m is the weight of prepared samples (mg).
HPLC Analysis
The conditions for the HPLC analysis were based on previous studies with slight modifications.27 The purified TSAT was analysed using an HPLC-DAD system (Agilent 1260 series liquid chromatograph, USA) equipped with a COSMOSIL5C18-MS-II chromatography column (5 μm, 250 mm × 4.6 mm id). The mobile phase consisted of acetonitrile (solvent A) and a 0.1% aqueous phosphoric acid solution (V/V) (solvent B). The elution procedure was as follows: 0–10 min, 5–20% A; 10–25 min 20–28% A; 25–35 min, 28–33% A; 35–45 min, 33–38% A; 45–55 min, 38–46% A; 55–60 min, 46–60% A; 60–68 min, 60–75% A; and 68–70 min, 75–45% A. The operating conditions of the instrument were a temperature of 30°C and a flow rate of 0.8 mL/min. The injection volumes of standards and samples were 10 μL. The detection wavelength was set to 203 nm. Before injection, all samples were passed through a 0.22 μm filter. After matching with the standard, the peak was determined based on the retention time. The linear calibration curve of the standard was used for quantification.
Method Validation
The method was validated for linearity, limit of detection (LOD), limit of quantification (LOQ), precision (interday and intraday precision), stability, accuracy and recovery rate according to the International Conference on Harmonization (ICH) guidelines and previous reports.28,29
Morphology
The surface structure of treated samples was analysed and compared with untreated A. taibaiensis powder using VEGA3-TESCAN.
α-Glucosidase Inhibition Assay
An α-glucosidase inhibition assay was performed as previously described with minor modifications.3 The reaction system consisted of 50 μL of 0.2 M potassium phosphate buffer (pH 6.8), 50 μL of test sample (25–500 μg/mL) and 100 μL of 0.1 U/mL α-glucosidase. It was incubated at 37°C for 10 min. Then, 50 μL of a 5 mM pNPG solution were added. The enzymatic reaction was incubated at 37°C for 10 min. The reaction was finally terminated by adding 50 μL of 1 mol/L Na2CO3. The absorbance of p-nitrophenol was measured at 405 nm using a microplate reader. Acarbose was used as a positive control. The experiments were conducted three times in parallel. α-Glucosidase inhibition was calculated using the following equation:
where A0 represents the absorbance of the negative control without the sample; A1 represents the test system containing the sample; A2 represents the absorbance of the blank system. The IC50 value was calculated.
Inhibitory Kinetic Analysis
The kinetic models of TSAT and araloside A versus α-glucosidase were determined by performing an enzyme activity assay. The reaction rate was determined by changing the concentrations of the substrate and inhibitor. The inhibition type and mechanism were analysed by constructing Lineweaver–Burk plots of the enzyme reaction velocity (ν) versus the substrate concentration, and the relevant parameters were calculated using the following equations:
The secondary plots were constructed from:
where V is the enzyme reaction rate, Vmax is the maximum enzyme reaction rate, [S] denotes the concentration of substrate, [I] represents the concentrations of TSAT and araloside A, and km represents the Michaelis–Menten constant.
Fluorescence Quenching Studies
Fluorescence quenching studies were performed using a spectrofluorometer (model F-7000 Hitachi, Tokyo, Japan) as described in the study by Wei-Ming et al,30 with some modifications. Fluorescence spectra were measured at two different temperatures (298 K and 310 K) in the range of 298–370 nm with an excitation wavelength of 280 nm. The excitation and emission bandwidths were both set to 2 nm. Different concentrations of TSAT and araloside A were added a to the buffer solution (0.1 M sodium phosphate buffer, pH 6.9) containing a fixed amount of α-glucosidase (0.1 U/mL). All the mixtures were incubated for 10 min to equilibrate before measurements were recorded. The fluorescence spectra of the buffer were subtracted as the background fluorescence.
AFM Measurements
Twenty microliters of α-glucosidase (0.1 U/mL) with or without 20 μL of araloside A (0.02 mg/mL) were incubated at 37°C for 1 h, added to the mica substrate and dried at room temperature for 12 h. AFM measurements were determined in air using a Bruker MM8 instrument (USA).
FT-IR Spectroscopy
The FT-IR spectra of α-glucosidase (0.1 U/mL) and its araloside A-α-glucosidase complex were measured in the range of 4000–500 cm−1 in sodium phosphate buffer, pH 7.0, at room temperature. All spectra were recorded using the ATR method with a resolution of 4 cm−1 and 60 scans. The final concentration of araloside A was 0.2 mg/mL. The corresponding absorbance values of free araloside A and buffer solutions were recorded with the same instrumental parameters and subtracted. The curves were fitted using Origin software (version 8.0, Origin Lab, Northampton, MA, USA).
Molecular Docking
Molecular docking was applied to determine the possible binding site(s) between acarbose, araloside A and α-glucosidase. The structure of α-glucosidase was determined through homology modelling (PDB ID: 3A4A). After removing extraneous small molecules from protein molecules using PyMOL 2.3 software, protein molecules were imported into AutoDock Tools-1.5.6 software to remove water molecules, hydrogen atoms were added, and the structures were saved as pdbqt files. Small-molecule compounds were imported into AutoDock Tools-1.5.6 software, water molecules were removed, atomic charges were added, atom types were assigned, all flexible bonds were made rotatable by default, and the files were saved as pdbqt files. All docking experiments were performed using AutoDock Tools-1.5.6 software. During the calculations, an 80x80x70 dot matrix module with 0.375 intervals and centre settings (−15.640, −35.005, −3.958) was used. Molecular docking calculations were performed using the Lamarckian genetic algorithm with the following parameters: a population of 150, a maximum of 25 million energy evaluations, a maximum number of 2000, a crossover rate of 0.8, a mutation rate of 0.02, 50 independent docking runs and an evaluation of the final docking structure based on the binding free energy. Docking results were visualized using PyMOL 2.3 software.
Statistical Analysis
Design-Expert version 10 software (Stat-Ease Inc., Minneapolis, MN, USA) was employed for the RSM design and statistical analysis. Differences between the means were considered statistically significant at p<0.05. All experiments were repeated in triplicate, and the values are presented as the means ± standard deviations (S.D.). The experimental analyses and calculations were performed using GraphPad Prism 6 software (La Jolla, CA. USA).
Results and Discussion
Single-Factor Experiments
Figure 1 shows the effect of each factor on the total saponin contents. Figure 1A shows the trend of increasing TSAT yields with an increasing number of extractions. The yield decreased slightly when more than 3 extractions were performed, and the process consumed excess energy and time. Thus, 3 extractions are considered optimal. Ultrasound power significantly affects the yield. As shown in Figure 1B, the yield increased with increasing ultrasound power due to the increased amplitude of the ultrasound waves passing through the solvent, resulting in increased “acoustic cavitation”. However, above 400 W, the drift of the extraction was accelerated, and consequently, the efficiency of the ultrasonic energy transfer into the medium was reduced, resulting in lower yields.31,32 As the ethanol concentration increases from 50% to 70%, the total saponin yield increased steadily, reaching a peak at 70% (Figure 1C). According to the theory of similarity and phase solubility, the release of components from the cells is facilitated when the polarities of the solute and solvent are similar.15,33 Extraction time affects the surface contact between the solute and solvent. As shown in Figure 1D, increasing the ultrasound time from 10 min to 30 min resulted in a significant increase in yield, which was attributed to the prolonged contact time between the solute and solvent that facilitated the diffusion of the target compound. However, prolonged extraction was not suitable for the extraction of bioactive compounds, probably due to the degradation of the components.34 In the present study, the ultrasound time was chosen to be 30 min. As shown in Figure 1E, a regular increase in yield was observed when the temperature increased to 60°C. The maximum yield was obtained at 60°C, the temperature that increased the solubility of the saponins and accelerated the molecular movement of the solute.35 As shown in Figure 1F, the greater the amount of solvent, the greater the contact area, and the stronger the ultrasound waves applied to the plant surface, leading to greater fragmentation, erosion and pore formation effects and resulting in higher yields. However, as the solid–liquid ratio increased, saponin yields tended to decrease. This result may be attributed to the enhanced cavitation effect, resulting in the production of more impurities that hinder the dissolution of the saponins.23,32 In the present study, the maximum yield was obtained at a solid–liquid ratio of 15 g/mL.
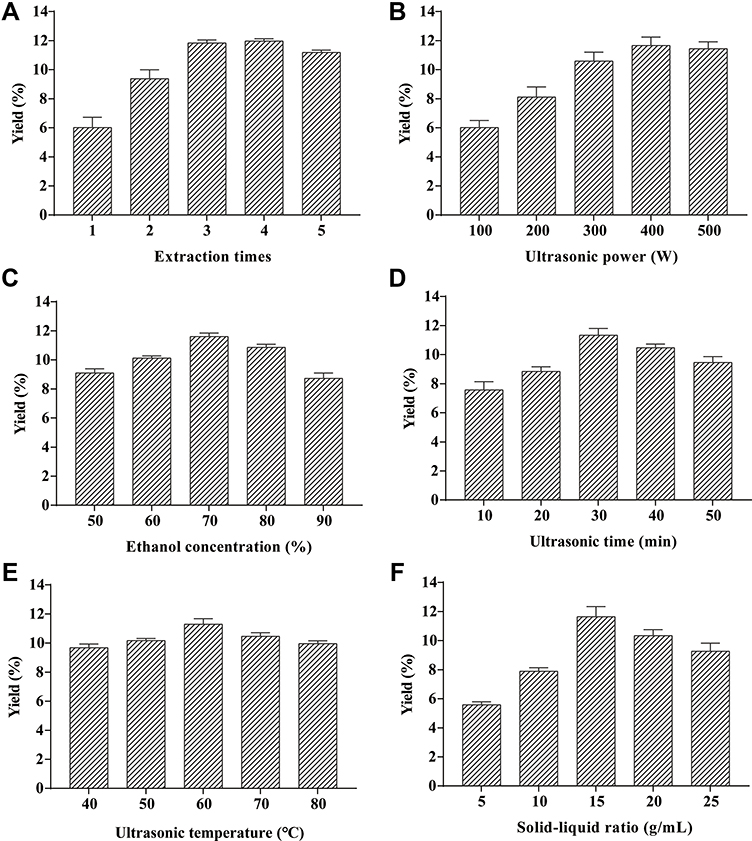 |
Figure 1 Effect of different factors on the extraction yield of TSAT. (A) extraction times, (B) ultrasonic power, (C) ethanol concentration, (D) ultrasound time, (E) ultrasound temperature and (F) solid-liquid ratio. |
Optimization of TSAT Extraction by BBD
Model Fitting and Statistical Analysis
Based on the results of previous single-factor experiments, the ethanol concentration (%), ultrasound time (min), ultrasound temperature (°C) and solid–liquid ratio (g/mL) were selected as the main influencing factors. The experimental design matrix of the independent variables used for the RSM and their codes and levels are shown in Table 2. The results of 29 experimental runs using the Box–Behnken design along with the measured and predicted values for both responses for each trial in the experimental design are shown in Table 3.
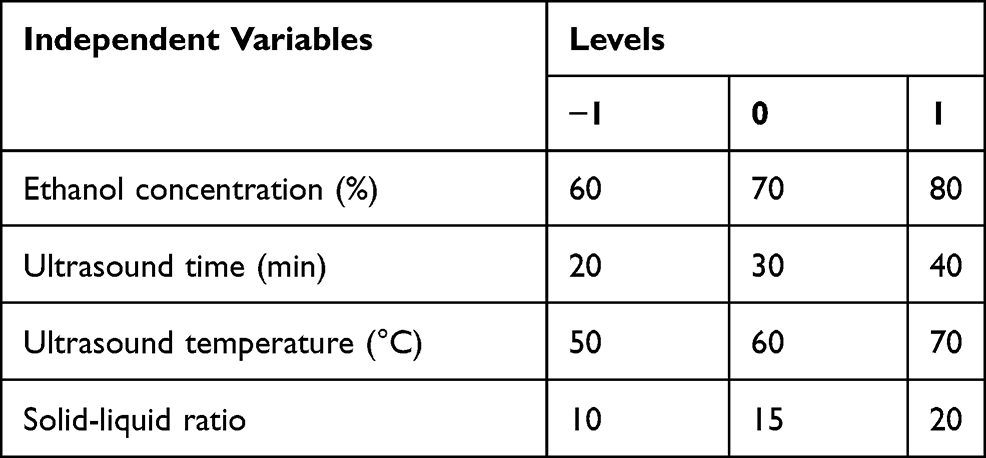 |
Table 2 Variables and Their Levels Used in the Experiments |
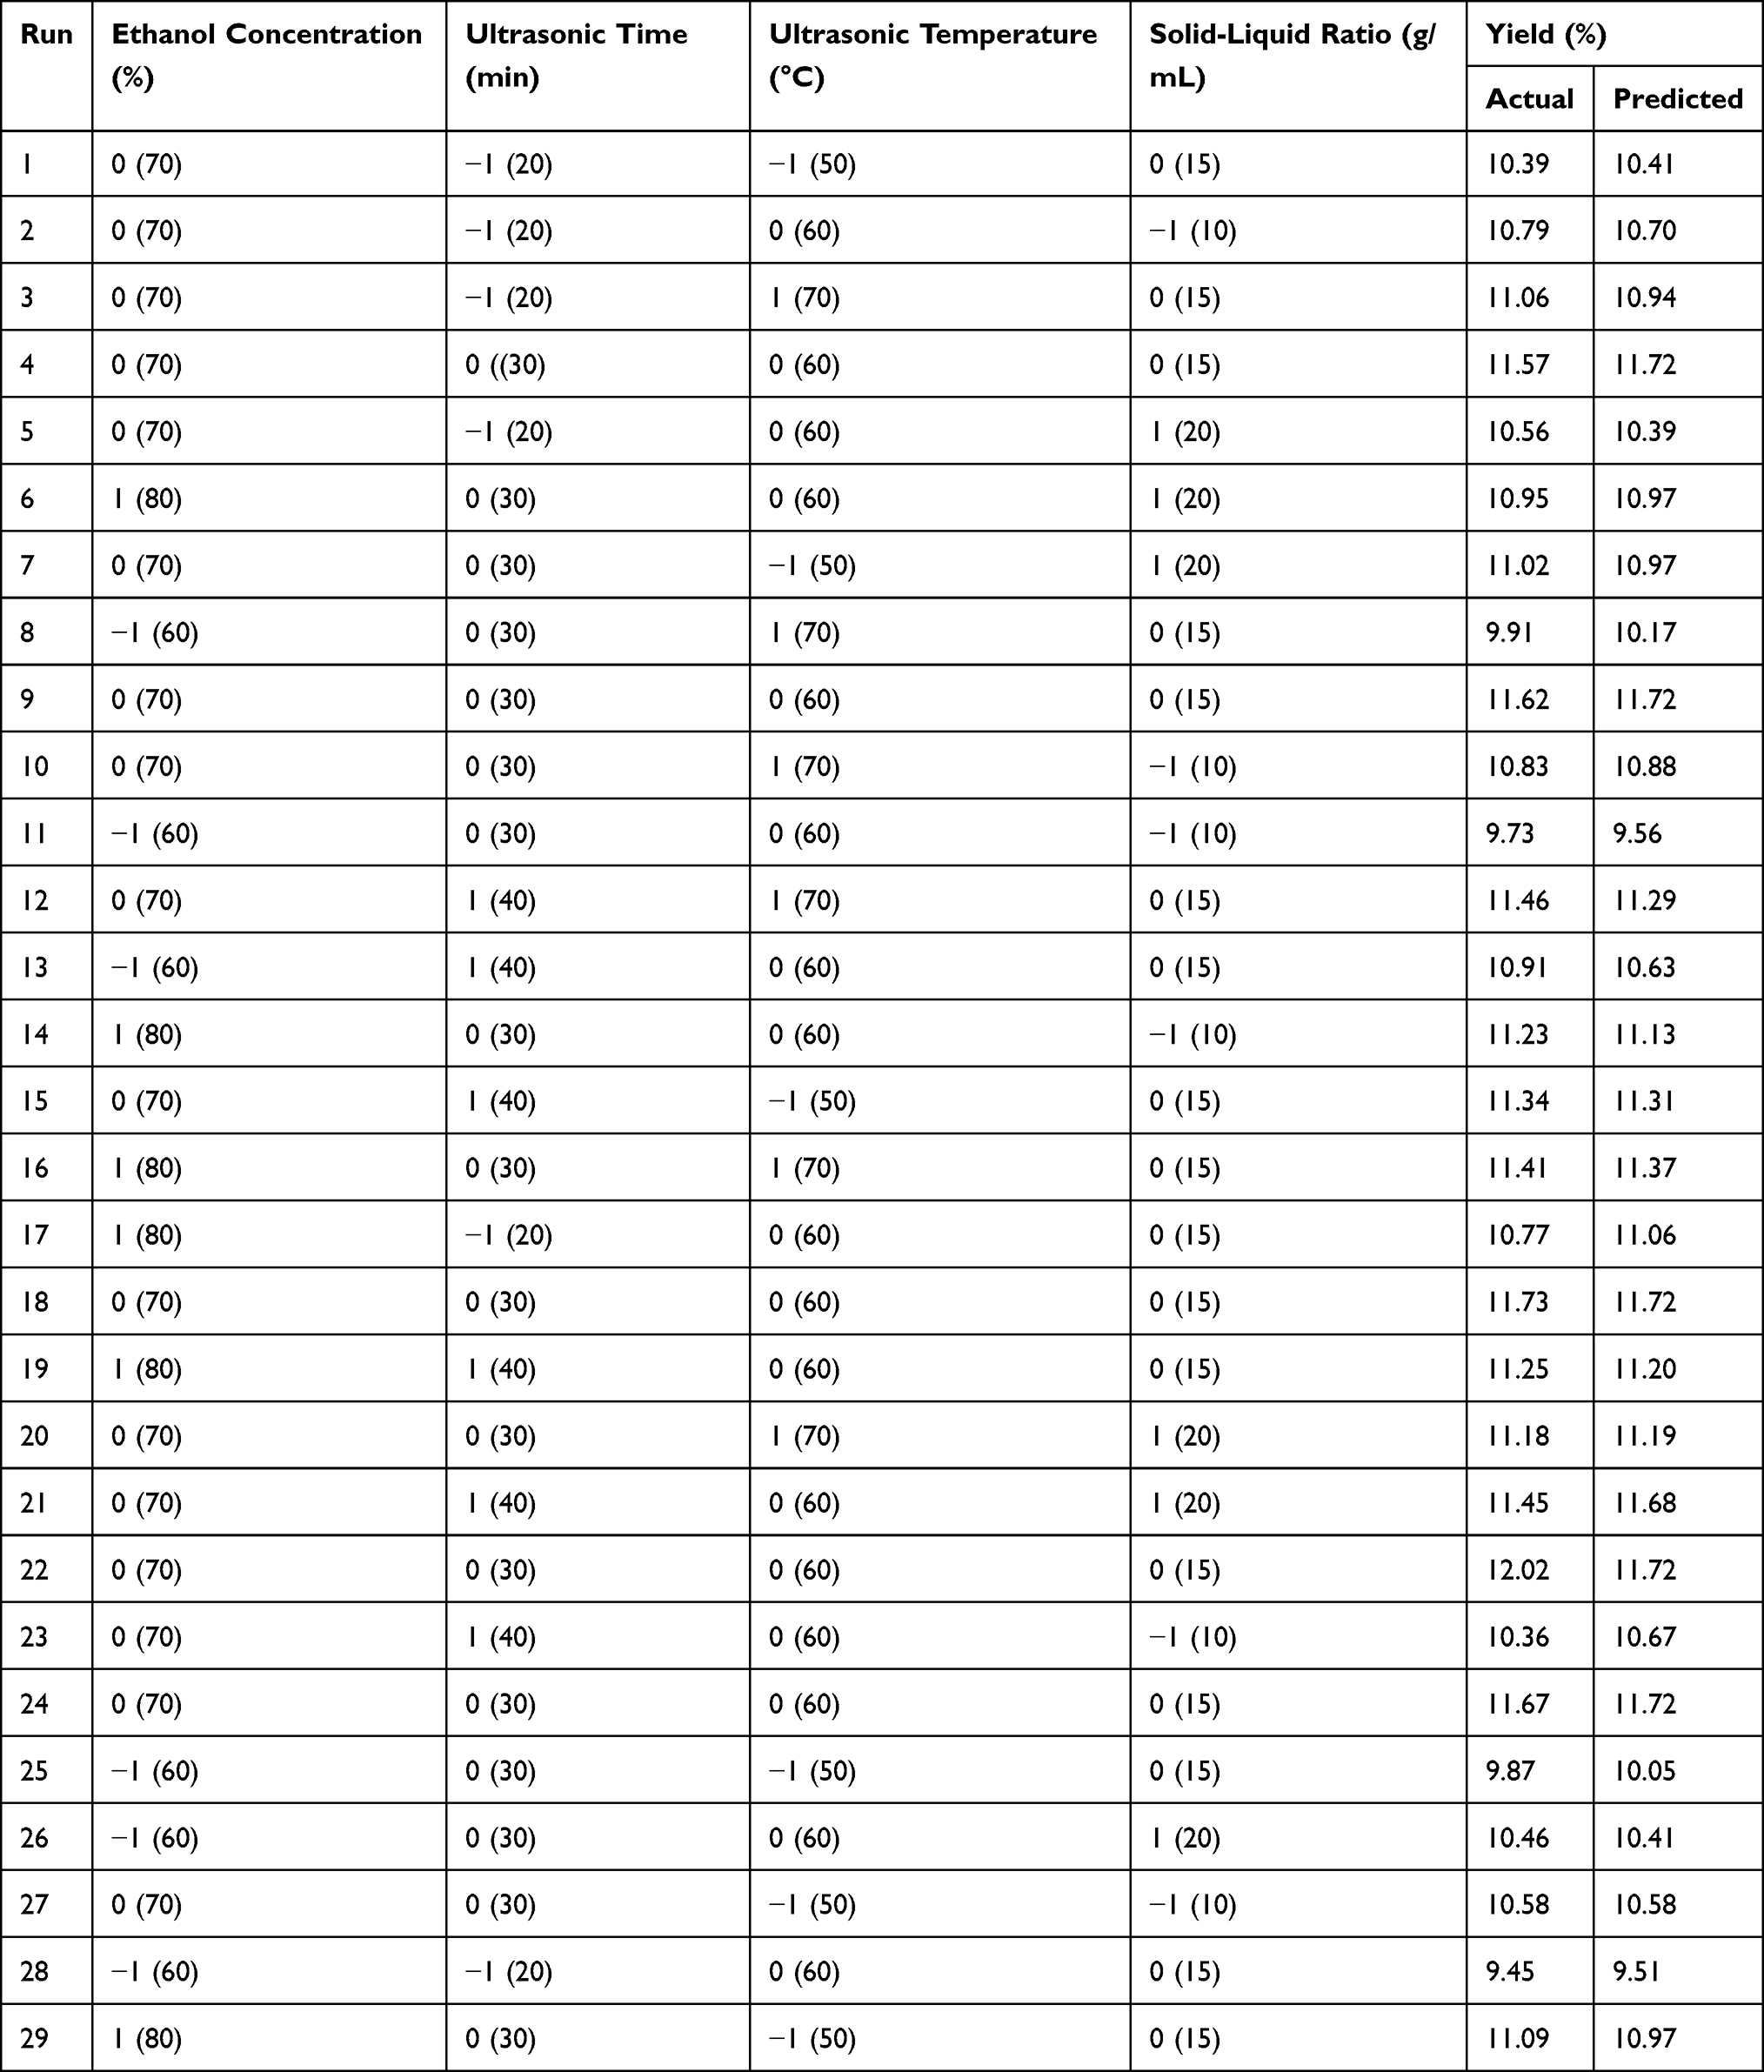 |
Table 3 Experimental Design and Observed Response |
The ANOVA results are presented in Table 4. The p value was calculated to evaluate the significance of each coefficient and indicate the interaction pattern between the variables. X1, X2, X4, X1X2, X1X4 and X2X4 were significant (p<0.05), while X3, X1X3 and X2X3 were not (p>0.05). One-way ANOVA indicated that the model was highly significant (p<0.0001) with high F values (15.64). The correlation coefficient (R2) for Y is 0.9399, and the R2 value was calculated to judge the adequacy of the model. The results indicate that the model developed here was significant (p<0.0001). The R2pred of 0.6997 is reasonably consistent with the R2adj of 0.8798, and the difference is less than 0.2. The value of R2adj indicated a total variation of 88% in the total saponin yield attributable to the independent variables. Additionally, the low value of the CV (2.03%) implies high precision and good reliability of the actual values. Adeq precision (AP) (value is 13.87) compares the range of the predicted values at the design points to the average prediction error. Ratios greater than 4 indicate adequate model discrimination. The model can be used to navigate the design space.
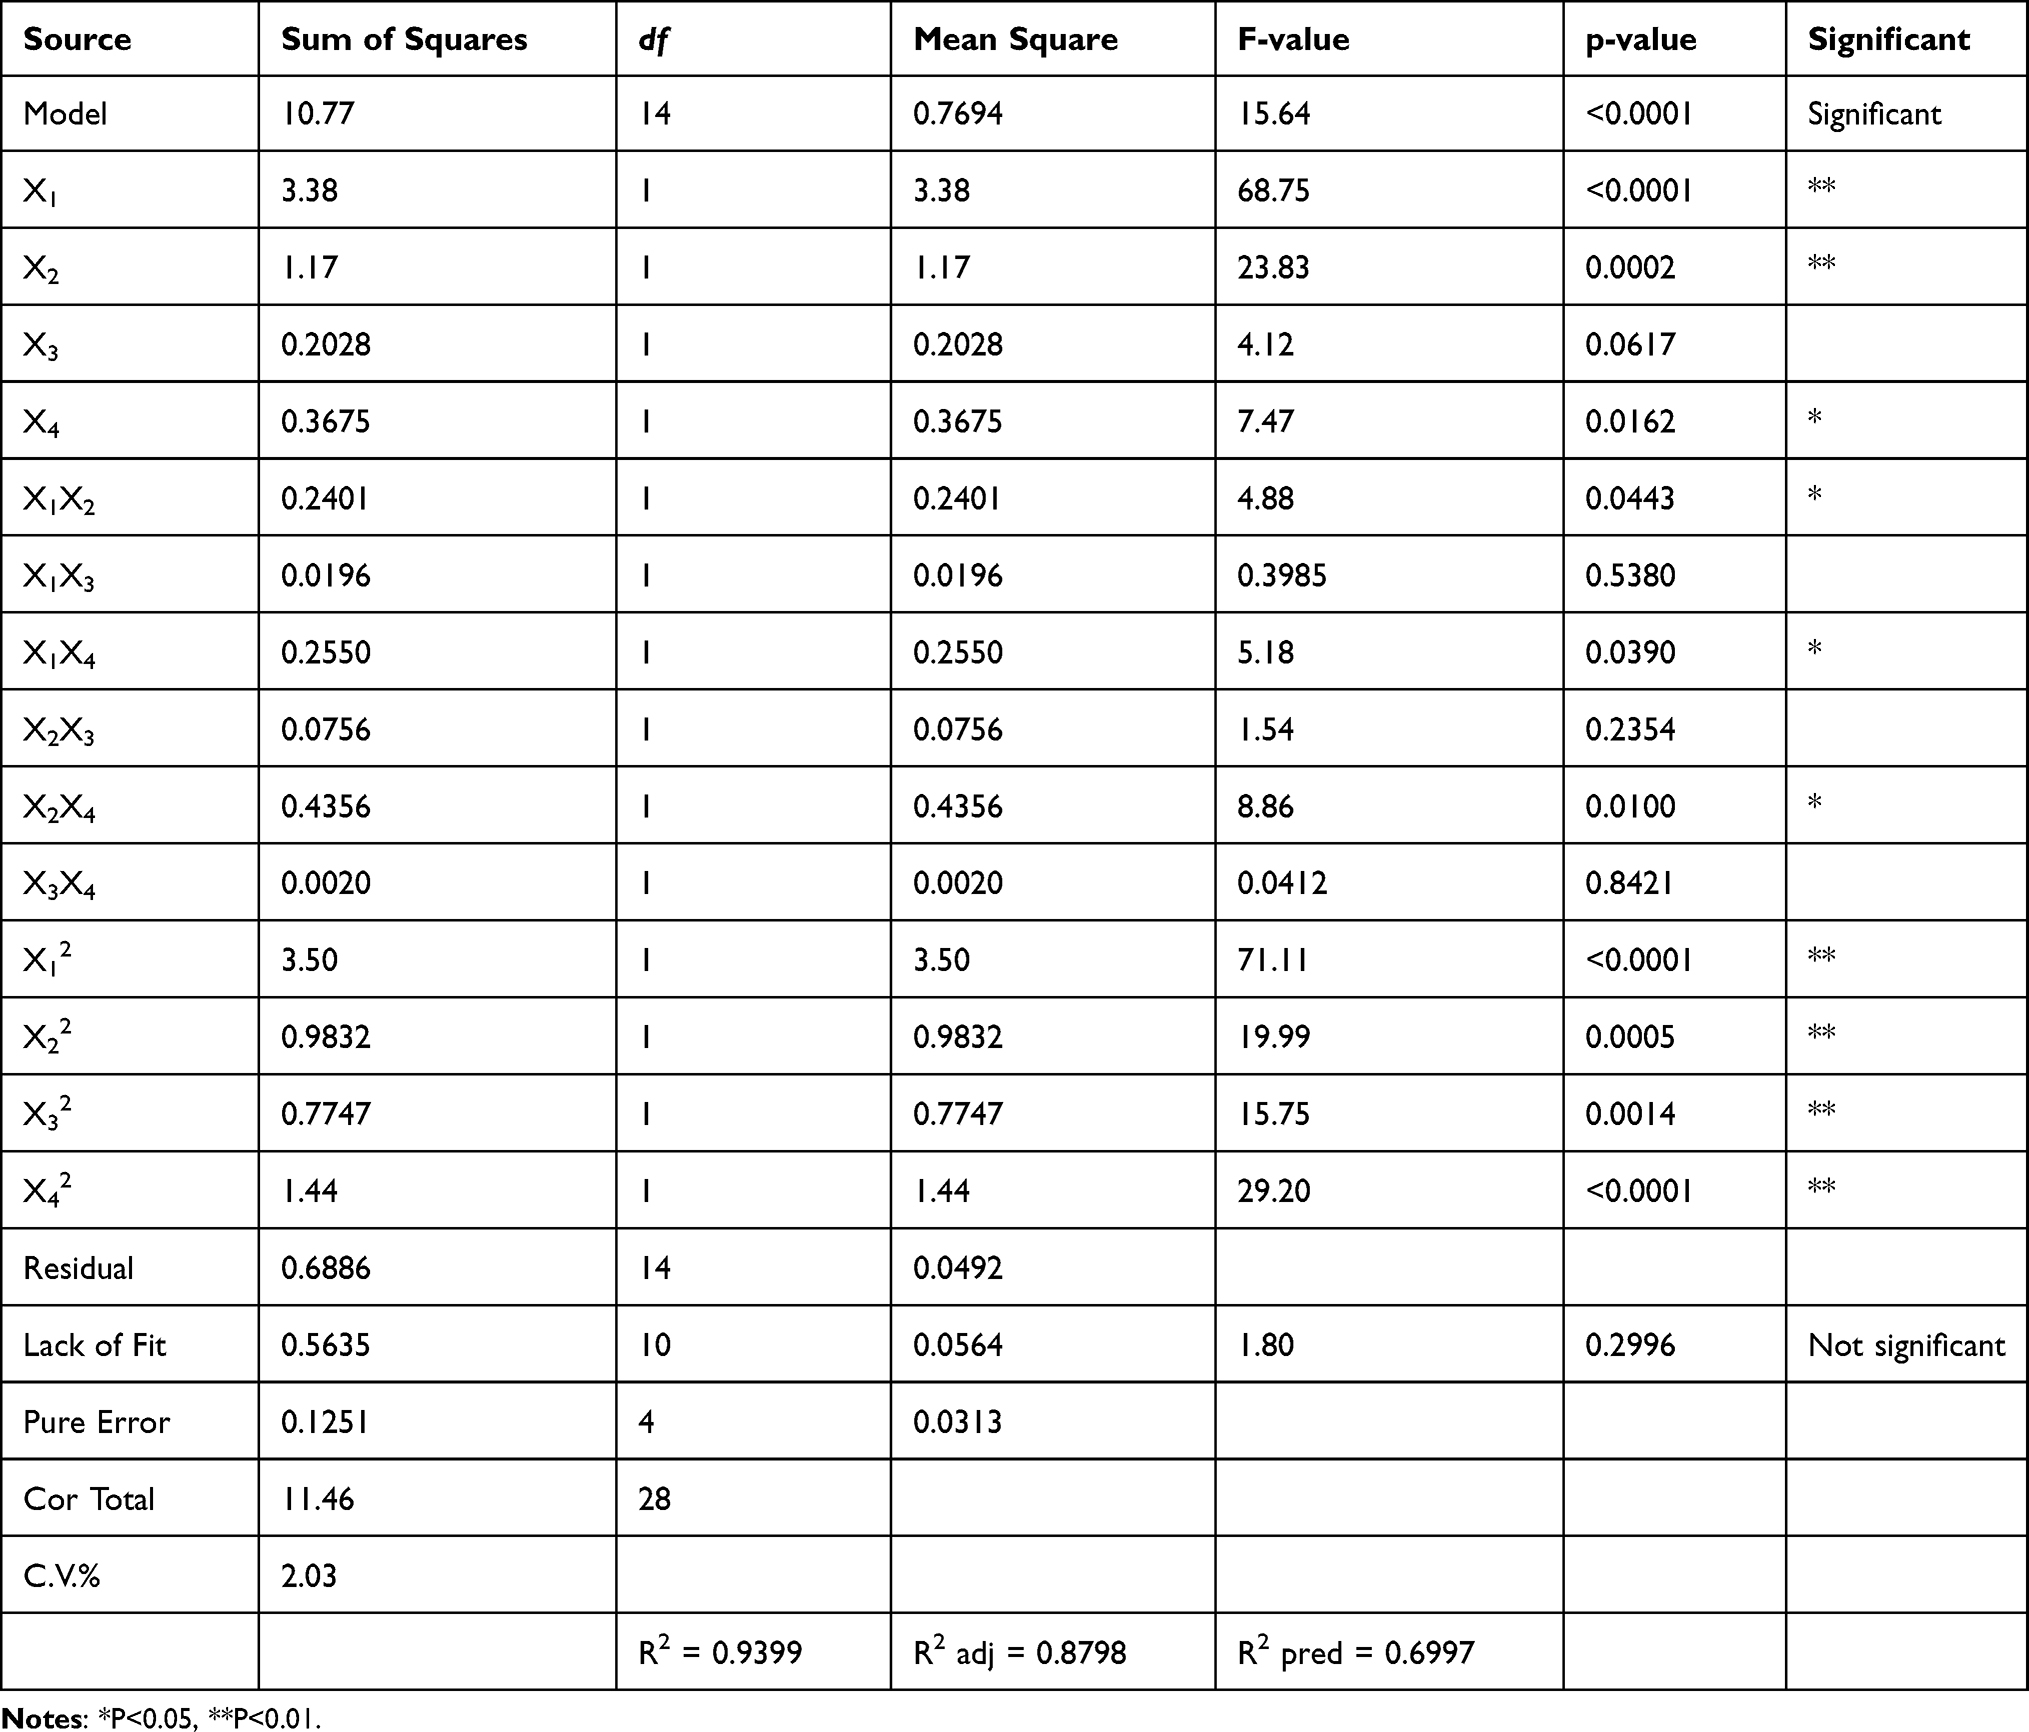 |
Table 4 ANOVA for Regress Equation |
The following second-order polynomial equation was generated to analyse the effects of independent variables on the total saponin extraction yield:
Yield (%) = 11.72 + 0.5308X1 + 0.3125X2 + 0.1300X3 + 0.1750X4 −0.2450X1X2 + 0.0700X1X3 - 0.2525X1X4 - 0.1375X2X3 + 0.3300X2X4 - 0.0225X3X4 - 0.7343X12 - 0.3893X22 - 0.3456X32 - 0.4706X42
The fitted model must often be checked to ensure that it adequately approximates the actual system. The residuals of the least square method are critical for determining the adequacy of a model. As shown in Figure 2A, the predicted values were very close to the experimental values. Internal studentised residuals were analysed by constructing satisfactory model fits for the experimental runs, which showed that all data points were within the limits (Figure 2B). Figure 2C shows the normal probability of the response residual plot and is normally distributed, as the points are reasonably close to the straight line and no variance bias is observed. The model effectively enhances the relationship between the process variables and the responses. Box–Cox plots of the power transformations of the variables (Figure 2D) show the perturbations of the variables within the determined range. These plots are satisfactory; therefore, we concluded that the empirical model is adequate for describing the total saponin extraction yield in the response surface plot.
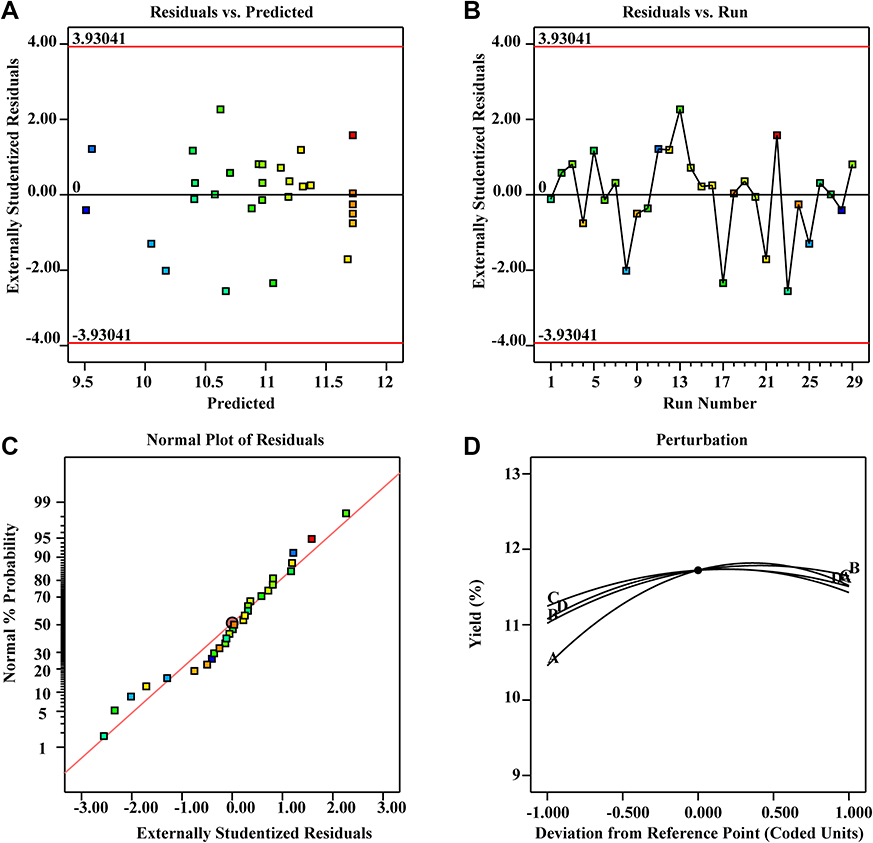 |
Figure 2 Diagnostic plots for the Box–Behnken model adequacy of the tested variable (predicted vs actual) against the TSAT yield. (A) Residuals vs predicted; (B) residuals vs run; (C) normal plot of residuals; (D) perturbation. |
Analysis of the Response Surface and Contour Plots
Response surface plots were generated by Design-Expert software to explain the interactions between the variables and to determine the optimum level of each variable that would obtain the maximum response value. The 3D response surface plots are shown in Figure 3. Surface ellipses typically indicate interaction effects between two independent variables on the dependent variable, with circles indicating opposite results. Figure 3A, C and E show that the TSAT yield increased with increasing ethanol concentrations, ultrasound time and solid–liquid ratio, but further increases in the levels of these factors did not result in greater yields. This result is consistent with the single-factor test. The response surface analysis showed significant interactions between X1X2, X1X4 and X2X4 (p<0.05). Figure 3 shows the trend of increasing TSAT yield with increasing ultrasound temperature, ethanol concentration and solid–liquid ratio, followed by a slight decrease. However, the circular 3D surface and contour plots indicate that the X1X3, X2X3 and X3X4 interactions were not significant (p>0.05). The results are consistent with the ANOVA.
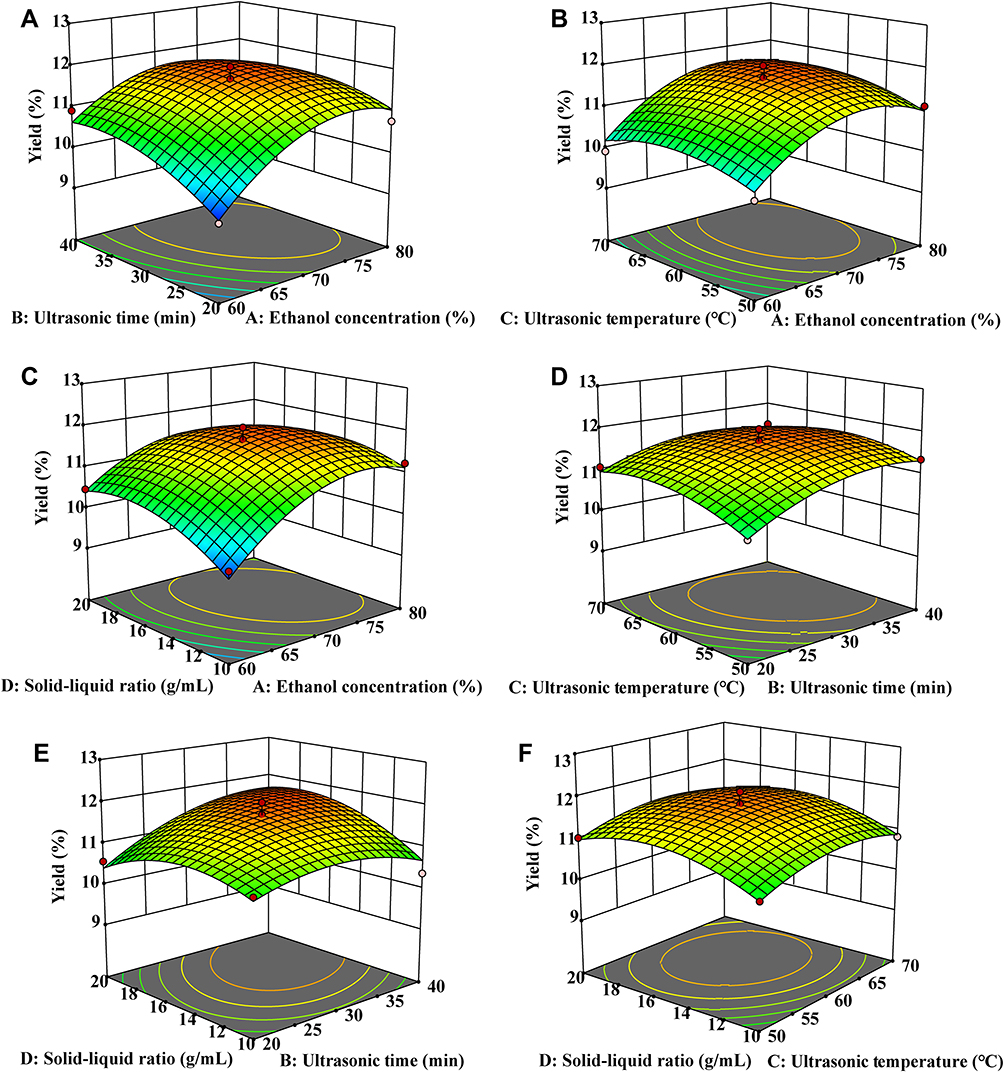 |
Figure 3 Response surface plots showing the interaction between different variables on the TSAT yield. (A) ultrasonic time and ethanol concentration; (B) ultrasonic temperature and ethanol concentration; (C) solid-liquid ratio and ethanol concentration; (D) ultrasonic temperature and ultrasonic time; (E) solid-liquid ratio and ultrasonic time; (F) solid-liquid ratio and ultrasonic temperature. |
Validation of the Optimized Model
The optimum process conditions for TSAT obtained with BBD-RSM were as follows: an ethanol concentration (X1) of 72.55%, ultrasound time (X2) of 34.09 min, ultrasound temperature (X3) of 61.24°C and solid–liquid ratio (X4) of 16.29 g/mL. Considering the feasibility of the experimental operation, the optimum conditions were modified as follows: ethanol concentration of 73%, ultrasound time of 34 min, ultrasound temperature of 61°C and solid–liquid ratio of 16 g/mL. Subsequently, validation experiments were conducted by numerical optimization three times in parallel to confirm the reliability of the predicted model. The TSAT yield from the validation experiments was 11.83±0.108%, which was consistent with the theoretical value (11.88%). These results confirm that the response surface model adequately reflects the desired optimized conditions.
In this study, HRE was also performed to confirm the superiority of UAE of TSAT. The TSAT yield obtained using UAE under optimized conditions was higher than that obtained by HRE (11.53±0.124%). Admittedly, many previous studies have reported that UAE resulted in a higher content of active ingredients than HRE.36,37
SEM Measurements
SEM was used to further reveal the potential mechanism of UAE. Compared to the pre-extraction sample (Figure 4A), the image captured at a magnification of 1000×g clearly shows the debris on the surface of TSAT obtained using the UAE method, as well as the enlarged pores (Figure 4B), indicating cell rupture and cell structure damage after UAE, which facilitates easier and more efficient penetration of the solvent into the plant. Similar conclusions were drawn by other researchers who reported that ultrasound-induced “acoustic cavitation” led to changes in the plant fibre structure.38
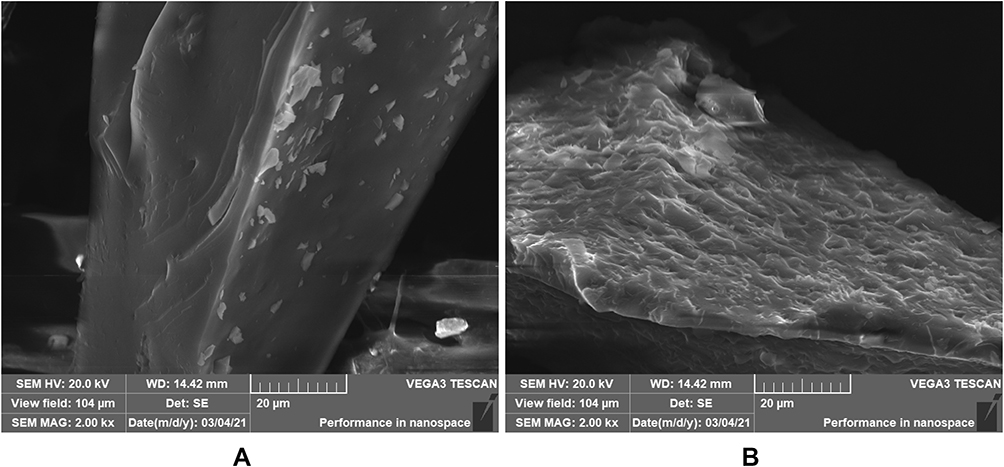 |
Figure 4 SEM images of the powder before (A) and after ultrasonic treatment (B). Images were taken at 1000× magnification. |
Validation of the Method for the Quantitative Analysis of Six Saponins
Supplementary Table S1 lists the linear equation, correlation coefficient (R2), linear range, LOD, and LOQ of each compound determined. All calibration curves showed good linearity (R2≥0.9991) within the tested concentration range. For these compounds, the LOD values ranged from 0.61–9.74 µg/mL, while the LOQ values ranged from 1.18–18.51 µg/mL. The results of the precision, stability and accuracy tests are shown in Supplementary Table S2. The RSD values for both intraday and interday precision ranged from 1.57–2.09% and 1.75–2.75%, respectively, which indicated the good precision of the developed method. The results of the stability test showed that the RSD values for the peak areas of all six compounds were <2.85%, indicating that the sample was stable for 12 h at room temperature. According to the calculation, the mean recoveries of the six compounds ranged from 98.14–99.68%, with RSD values ranging from 0.71–1.42%, suggesting the good accuracy of the developed method. In summary, the validation tests showed that the developed method was feasible for the simultaneous quantification of the six compounds in TSAT.
HPLC Analysis of Saponins in the Extracts
Undoubtedly, the pharmacological activity of A. taibaiensis depends on its chemical composition. Therefore, the saponins in the A. taibaiensis extract were analysed using HPLC. Figure 5 shows highly similar characteristics of the HPLC profiles of the extracts obtained using UAE and HRE. Six triterpenoid saponins were identified, including tarasaponin IV, araloside C, stipuleanoside R2, pseudoginsenoside RT1, araloside A and Chikusetsu saponin IVa, with retention times of 44.661, 45.298, 46.959, 50.598, 51.703 and 53.701 min, respectively. Based on the results of the quantitative HPLC analysis, the contents of the six saponins (mg/g plant material, dry weight) were in the following descending order: araloside A (32.679±0.137 mg/g) > araloside C (23.405± 0.159 mg/g) > stipuleanoside R2 (22.216±0.120 mg/g) > tarasaponin IV (13.143 ± 0.114 mg/g) > pseudoginsenoside RT1 (8.863±0.114 mg/g) > Chikusetsu saponin IVa (2.203±0.049 mg/g). However, the contents of six saponins extracted using HRE were all lower than those extracted using UAE: araloside A (29.844±0.242 mg/g) > araloside C (21.358± 0.179 mg/g)>stipuleanoside R2 (20.281±0.151 mg/g)>tarasaponin IV (12.025±0.099 mg/g) > pseudoginsenoside RT1 (7.978±0.188 mg/g)>Chikusetsu saponin Iva (1.936±0.041 mg/g). Thus, UAE will be a promising extraction method for the separation of bioactive saponins from A. taibaiensis in the future.
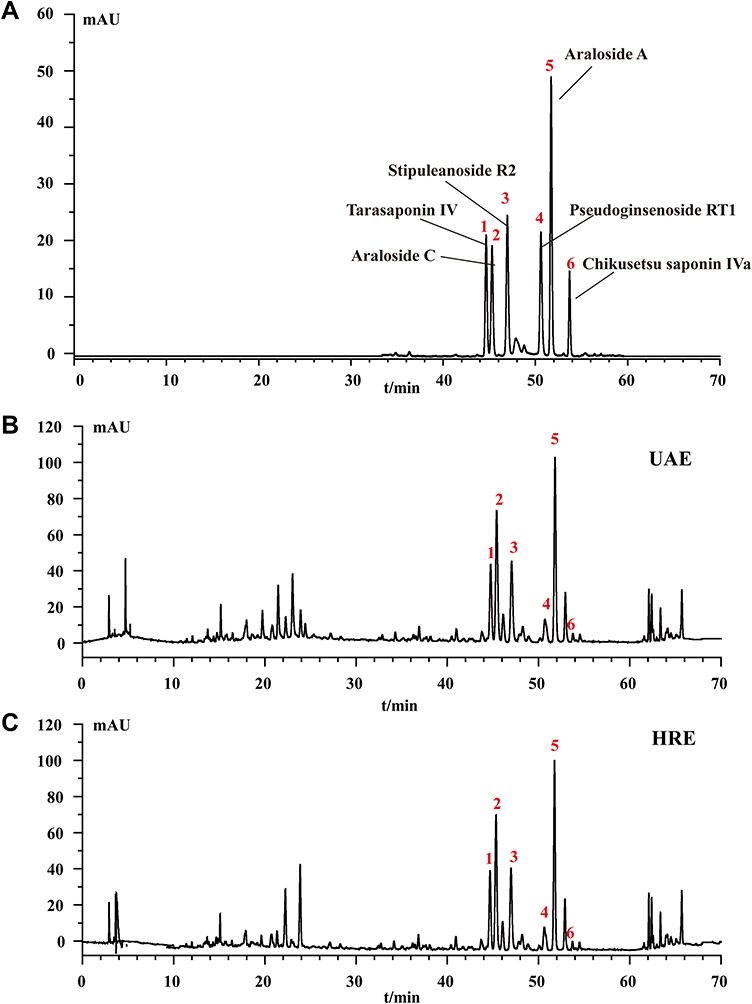 |
Figure 5 HPLC profiles of standard mixtures (A) and TSAT obtained by optimized UAE (B). TSAT obtained by HRE (C). Peaks: (1) Tarasaponin IV, (2) araloside C, (3) stipuleanoside R2, (4) pseudoginsenoside RT1, (5) araloside A and (6) chikusetsu saponin IVa. |
α-Glucosidase Inhibition
As shown in Figure 6A, TSAT and its active compounds exerted a dose-dependent effect on inhibiting α-glucosidase. The concentrations of TSAT, tarasaponin IV, araloside C, stipuleanoside R2, pseudoginsenoside RT1, araloside A and Chikusetsu saponin IVa resulting in a 50% loss of enzyme activity were determined to be 0.224 mg/mL, 2.939 mg/mL, 2.688 mg/mL, 2.287 mg/mL, 6.011 mg/mL, 0.809 mg/mL and 1.133 mg/mL, respectively. The IC50 values for acarbose (Figure 6B) measured under the same conditions were much smaller than those for TSAT and its target components, but inhibition of α-glucosidase by TSAT and its six target components was still evident. The IC50 values for TSAT towards α-glucosidase were lower than those previously reported (0.48 mg/mL).12 This discrepancy may be due to slight differences in the composition of the active compounds in TSAT obtained under different conditions. The strong inhibition of α-glucosidase by TSAT compared to the pure compounds might be attributed to the synergistic effect of the multiple active components in the TSAT, as reported in a previous study.11 Previous studies have shown that sugar substitutions at the C-3 and C-28 positions attached to the pentacyclic triterpene backbone contribute to increased inhibitory activity against α-glucosidase.13 Additionally, the inhibitory activity is enhanced by the presence of two neighbouring methyl groups at the C-20 position on the E ring, which are electron-donating groups such as hydroxyl groups attached to the unsaturated C. The interposition of the hydroxyl group is reported to inhibit activity by decreasing the electron cloud density of the I-band on the E ring, while the neighbouring hydroxyl group increases the inhibitory activity.1,39 These results explain the α-glucosidase inhibitory activity of A. taibaiensis containing mainly pentacyclic triterpenoid saponins. Araloside A (Figure 6C) may be the main contributor to the good α-glucosidase inhibitory ability of TSAT; however, the detailed conformational relationship of araloside A requires further study.
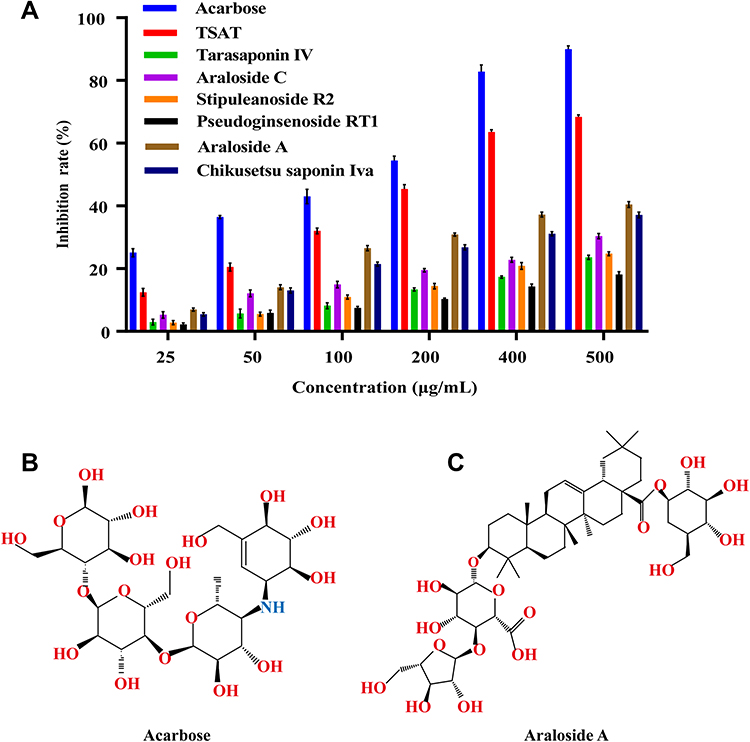 |
Figure 6 (A) α-Glucoside inhibitory activity of acarbose, TSAT, tarasaponin IV, araloside C, stipleanoside R2, pseudoinsenoside RT1, araloside A and chikusetsu saponin IVa. Structures of acarbose (B) and araloside A (C). |
Kinetics of Inhibition
A plot of V versus [α-glucosidase] in the presence of different concentrations of TSAT or araloside A is shown in Figure 7. If the plot of V against the enzyme concentration passes through the origin, it indicates reversible inhibition. In our study, all straight lines crossed the origin of the coordinates and the slope decreased with increasing drug concentration. Figure 7A and B shows reversible inhibition of α-glucosidase activity by TSAT or araloside A, respectively.
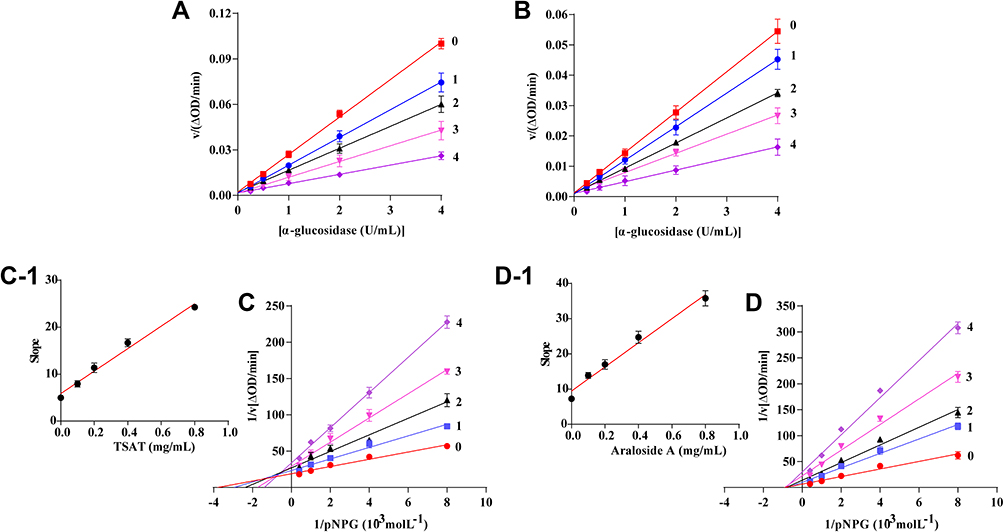 |
Figure 7 Reversible test and Lineweaver−Burk plots of TSAT/araloside A against α-glucosidase. (A) Reversible test plots of v vs [α-glucosidase]. The concentrations of TSAT for curves 0–4 were 0, 0.1, 0.2, 0.4 and 0.8 mg/mL. (B) Reversible test plots of v vs [α-glucosidase]. The concentrations of araloside A for curves 0–4 were 0, 0.1, 0.2, 0.4 and 0.8 mg/mL, respectively. (C) Lineweaver−Burk plots of TSAT against α-glucosidase, c (TSAT) = 0, 0.1, 0.2, 0.4 and 0.8 mg/mL, and inhibition constants of TSAT on α-glucosidase. (D) Lineweaver–Burk plots of araloside A against α-glucosidase. c (Araloside A) = 0, 0.1, 0.2, 0.4 and 0.8 mg/mL; inhibition constants of araloside A on α-glucosidase. |
Lineweaver-Burk plots were constructed to understand the inhibitory behaviours and mechanisms of inhibition, and the plots are shown in Figure 7C and D. In the Lineweaver-Burk plots, a series of lines intersected in the second quadrant for the reactions containing different concentrations of TSAT, and the maximum reaction rate Vmax decreased and the Mie constant km decreased, suggesting that TSAT exhibits a mixed inhibitory mechanism for α-glucosidase. Mixed inhibition is an intermediate between competitive and noncompetitive inhibition. Namely, TSAT was able to bind free α-glucosidase and α-glucosidase-substrate complexes to inhibit α-glucosidase activity. This finding is consistent with the previously reported results of inhibition of α-glucosidase by quinoa bran total saponin and rooibos total saponin through mixed competition.40,41 In Figure 7D, all the lines also crossed quadrants 1, 2 and 3 but intersected in the negative direction of the x-axis in the Lineweaver-Burk plot, the km values remained constant, and the Vmax decreased with increasing concentrations of araloside A, suggesting that araloside A is a noncompetitive inhibitor. Ding et al1 also reported that the pentacyclic triterpenoid oleanolic acid was a noncompetitive inhibitor of α-glucosidase. The secondary replot of slope vs [TSAT/araloside A] was linear (Figure 7C-1, D-1), suggesting that TSAT/araloside A had a single inhibition site or a single class of inhibition sites on α-glucosidase.
Fluorescence Intensity
Fluorescence spectroscopy was used to further investigate the interaction between TSAT or araloside A and α-glucosidase. The fluorescence emission spectra of α-glucosidase in the presence/absence of TSAT or araloside A were measured at different temperatures (T=298 K and 310 K, λex=280 nm). As shown in Figure 8, a strong emission peak near 334 nm was observed in the α-glucosidase spectrum, whereas almost no fluorescence from TSAT or araloside A was detected under the same conditions. The absorption in this region may be attributed to the aromatic amino acids in α-glucosidase, with tryptophan being the main contributor.3 The natural fluorescence of the tryptophan residues in glycosidases and their changing values reflect changes in the protein itself and its surroundings.2 α-Glucosidase fluorescence intensity decreased sequentially with the addition of TSAT or araloside A and with increasing temperature, providing direct evidence of the interaction of TSAT or araloside A with α-glucosidase. In addition, the position of the emission peak changed slightly following the addition of TSAT or araloside A, resulting in a redshift of the maximum fluorescence from 334 nm to 336 nm. Based on this result, TSAT-α-glucosidase binding or araloside A-α-glucosidase binding alters the microenvironment around α-glucosidase and causes a spatial shift in the α-glucosidase structure.42
 |
Figure 8 Fluorescence spectra of α-glucosidase in the presence of TSAT at different temperatures (pH 7.0, λex = 280 nm): (A) T=298 K and (B) T=310 K. c (α-glucosidase) = 0.1 U/mL, c (TSAT) = 0, 0.2, 0.3, 0.4, 0.5, 0.6, 0.8 and 1 mg/mL for curves a → h, respectively. (D) T=298 K and (E) T=310 K. c (α-glucosidase) = 0.1 U/mL, c (araloside (A)=0, 0.25, 0.35, 0.5, 0.8, 1 and 1.2 mg/mL for curves a → g, respectively. (C and F) Stern–Volmer plots of α-glucosidase for fluorescence quenching at different temperatures. |
Small molecule-enzyme interactions, molecular rearrangements and excited state reactions all cause endogenous fluorescence quenching of proteins, with dynamic and static quenching identified as the two quenching mechanisms.43 The fluorescence quenching data were analysed using the Stern-Volmer equation to elucidate the probable quenching mechanism between TSAT, araloside A and α-glucosidase:
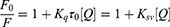
where F0 and F are the fluorescence intensities (334 nm) of the enzyme in the absence and presence of different concentrations of TSAT/araloside A, respectively. [Q] is the corresponding concentration of TSAT and araloside A. Ksv is the Stern-Volmer quenching constant (Ksv=Kqτ0), which is determined from a linear regression analysis of a plot of F0/F against [Q]. Kq is the quenching rate constant, and τ0 is the average lifetime of the fluorophore without a quencher (the value of τ0 for the biopolymer is 10−8 s).
As shown in Figure 8, all Stern-Volmer plots linearly fit the regression equation well (R2>0.99). The values of KSV decreased with increasing temperature, indicating the presence of static quenching. Static quenching is caused by the formation of a nonfluorescent ground state complex between the quencher and the protein fluorescent moiety rather than a dynamic collision. Thus, the formation of the TSAT-α-glucosidase complex or the araloside A-α-glucosidase complex is the primary cause of α-glucosidase fluorescence quenching.3
Binding Constant and Number of Binding Sites
For static quenching, an improved method was used to calculate the binding constant (Ka) and the number of binding sites (n):
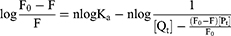
F0 and F are the same as in Equation (6); [Pt] and [Qt] indicate the total concentrations of α-glucosidase and TSAT/araloside A, respectively. The values of Ka (the binding constant) and n (the number of binding sites per enzyme molecule) were calculated from the slope and intercept of the plots of log(F0−F)/F versus log([Qt]−[Pt](F0−F)/F), and the results are summarized in Table 5. The value of n was approximately equal to 1, indicating that TSAT/araloside A has one binding site or class of inhibition sites in α-glucosidase, consistent with the results of the Lineweaver-Burk plot. The Ka values at 298 K were 1.29×10^3 L/g and 1.18×10^3 L/g, indicating a high affinity between TSAT/araloside A and α-glucosidase. The trend of decreasing Ka with increasing temperature indicated that the stability of the TSAT/araloside A-α-glucosidase complex decreased at higher temperatures.44 The results further reveal that fluorescence quenching is a static quenching process.
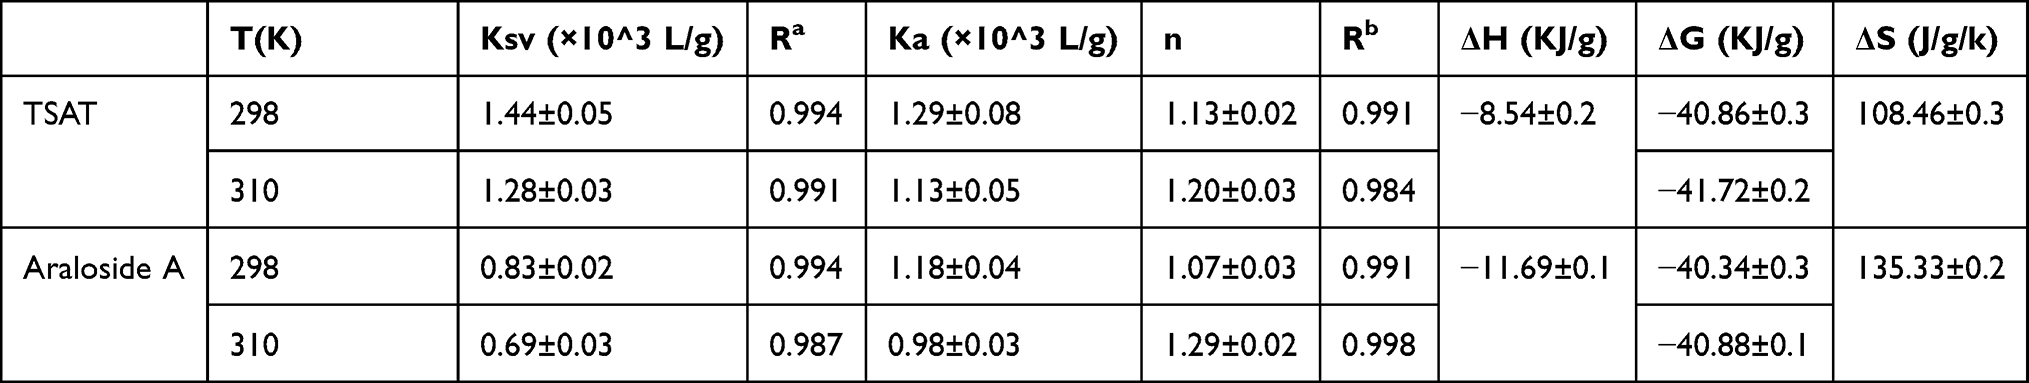 |
Table 5 The Quenching Constants (KSV), Binding Constants (Ka), Number of Binding Sites (n) and Relative Thermodynamic Parameters for the Interaction Between TSAT/Araloside A and α-Glucosidase at Different Temperatures |
Thermodynamic Analysis and Binding Forces
Four main types of noncovalent interactions occur between the ligand and macromolecule, ie, electrostatic interactions, multiple hydrogen bonds, van der Waals interactions and hydrophobic forces. The thermodynamic parameters (enthalpy change ΔH, entropy change ΔS and free energy change ΔG) were determined using the van’t Hoff equation (Equation 8 and Equation 9) to further determine the type of binding force between TSAT or arachidonic A and α-glucosidase. If little change in temperature is observed, then ∆H can be considered a constant. Therefore, ∆H, ∆S and ∆G values were evaluated using the van’t Hoff equation as follows:

where Ka is the binding constant at the corresponding temperature (T), T represents the absolute temperature used in the experiment and R is the gas constant (8.314 J mol−1K−1). The plot between log Ka and 1/T showed good linearity, from which the values of ΔH and ΔS were obtained. The negative value of ΔG indicated that the interaction between TSAT/araloside A and α-glucosidase was spontaneous, and the negative value of ΔH indicated that the interaction is an exothermic process, consistent with the decreasing trend of Ka with temperature.45 Furthermore, positive values for ∆S and negative values for ∆H suggest that hydrogen bonding and hydrophobic forces are the main forces driving the interaction between TSAT/araloside A and α-glucosidase.2
AFM Studies
AFM has been used to study the structure of biomolecules. In this study, we used the AFM knock pattern to study the interaction between araloside A and α-glucosidase. As shown in Figure 9A and C free α-glucosidase was clearly visible and distributed on the surface of mica. However, when araloside A was added, free α-glucosidase appeared to aggregate. As shown in Figure 9B and D, free proteases such as α-glucosidase, trypsin, and tyrosinase are among the different molecules that participate in hydrophobic interactions and hydrogen bonding. A stable structure is formed under force. Once the balance of intermolecular forces is disrupted, proteases may aggregate to form a new stable body that reduces the water contact.46 After araloside A was mixed with α-glucosidase, it changed the microenvironment around the α-glucosidase molecule, exposing the protein structure to a more hydrophobic environment. α-Glucosidase began to accumulate and increase to reduce the surface area in contact with water and form a stable structure.47 Therefore, agglomerated α-glucosidase was observed, indicating that a hydrophobic interaction formed between araloside A and α-glucosidase.
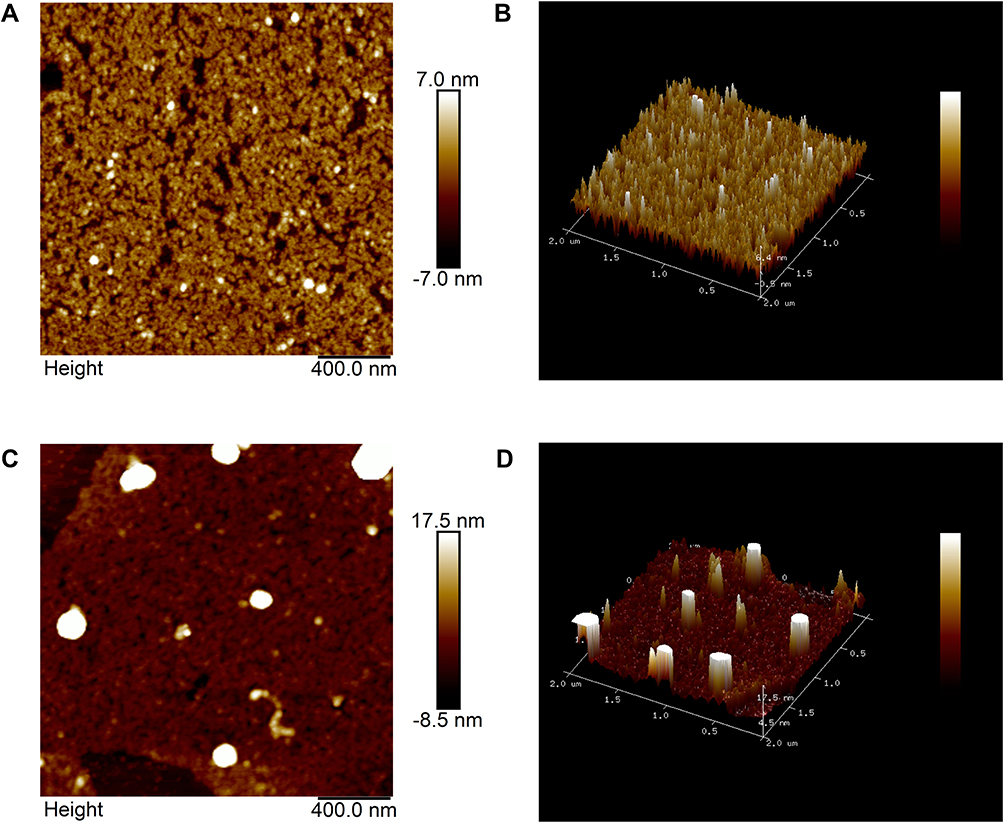 |
Figure 9 AFM image of free α-glucosidase (A) and the araloside A-α-glucosidase complex (B). c(α-glucosidase) = 0.1 U/mL, and c (araloside A) = 0.02 mg/mL. (C and D) are the three-dimensional graphs for panels A and B, respectively. |
FT-IR
To further determine the structure changes of enzymes by araloside A, the interactions of α-glucosidase with araloside A were analysed by FT-IR spectroscopy.48 As shown in Figure 10, no new characteristic peaks appeared in the FT-IR spectra of the α-glucosidase-araloside A composites, indicating that no new covalent bonds formed during their interaction.49 It has been reported that enzymes containing several amide bands would exert signals in the region 1700–1600 and 1600–1500 cm−1, representing the stretching vibration of C=O (amide I) and N-H (amide II), respectively.50,51 Therefore, the alteration of amide bands is often used in characterising the chemical composition and conformation of enzymes. The peak position of amide I (1635.33 cm−1) bands of free α-glucosidase shifted slightly to 1636.79 cm−1 and its intensity enhanced with the addition of araloside A, while the amide II bands became smooth or even disappeared with the addition of araloside A. These observations suggested that araloside A interacted with N-H groups, inducing the rearrangement of the polypeptide carbonyl hydrogen bonding pattern and destroying the interaction of amide II groups.48
 |
Figure 10 FT-IR spectra of α-glucosidase with araloside A. |
Molecular Simulation of Araloside a Binding to α-Glucosidase
Molecular docking was performed and related structural changes were characterized to further understand the binding mode of araloside A and α-glucosidase. Acarbose was used as a positive control. Figure 11A and B show the clustering results of the docking conformation of the ligand molecule and the protein. Based on the clustering result in Figure 11A with an RMSD of 2.0, the conformation produced by the docking of acarbose is mainly distributed between −6.0 kcal/mol ~ −4.0 kcal/mol, indicating that the acarbose molecule may form a variety of conformations that match the active pocket of the 3A4A protein, which also shows that the acarbose molecule forms a stable complex with glucosidase. The conformation with the most negative binding energy of acarbose to proteins (−7.63 kcal/mol) was analysed to further evaluate the binding of acarbose molecules to the protein. As shown in Figure 11D, the acarbose molecule matched the active pocket of the protein. Multiple residues in the active site form strong hydrogen bonds with the small molecule acarbose to facilitate an interaction, such as GLU-411, ASP-215, ASP-242, ASP-69 and carboxyl oxygen atoms of other amino acids and acarbose. The protons of the hydroxyl group form stable hydrogen bond interactions. The hydrogen bond distances are 2.4 Å, 2.4 Å, 2.9 Å, and 2.2 Å, which are much smaller than the traditional hydrogen bond distance of 3.5 Å. Therefore, acarbose molecules bind tightly to proteins and form a stable complex, preventing them from leaving the pocket. In addition, based on the clustering result graph with an RMSD of 2.0, the conformation produced by the docking of araloside A is mainly distributed between −5.0 kcal/mol and −3.0 kcal/mol, and the docking result is slightly worse than that of acarbose (−5.97 kcal/mol). This difference may be because the two ends of the araloside A molecule are bound to glycosides, the middle exerts a strong hydrophobic effect, and the overall volume is large, which hinders the interaction with the active site of the protein to a certain extent. On the other hand, the hydrophobic chain in the middle will also increase the rigidity of the small molecule, preventing it from twisting to adapt to the active site of the protein. However, combined with the binding mode of araloside A and the active site of the protein (Figure 11C and E), we found that araloside A partially binds to the surface of the protein and forms multiple hydrogen bond interactions with amino acids such as GLU-411 and ASP-307. The carboxyl oxygen atom and the hydroxyl proton of araloside A form a stable hydrogen bond interaction. The hydrogen bond distances are 1.8 Å and 2.2 Å, which are much smaller than the traditional hydrogen bond of 3.5 Å. Thus, the araloside A molecule also binds tightly to the protein. Small molecules that stabilize the active pocket are very important. In addition, protons on the nitrogen of GLN-279 and ARG-325 form a strong hydrogen bond with the hydroxyl oxygen atom of araloside A. The hydrogen bond distance is short, and the binding affinity is strong, confirming the thermodynamic analysis results. In summary, the araloside A molecule interacts with the active site of α-glucosidase through hydrogen bonding and hydrophobic interactions to form a stable complex, which is consistent with the results of the spectroscopy analysis and provides supporting data for the inhibition of α-glucosidase by araloside A.
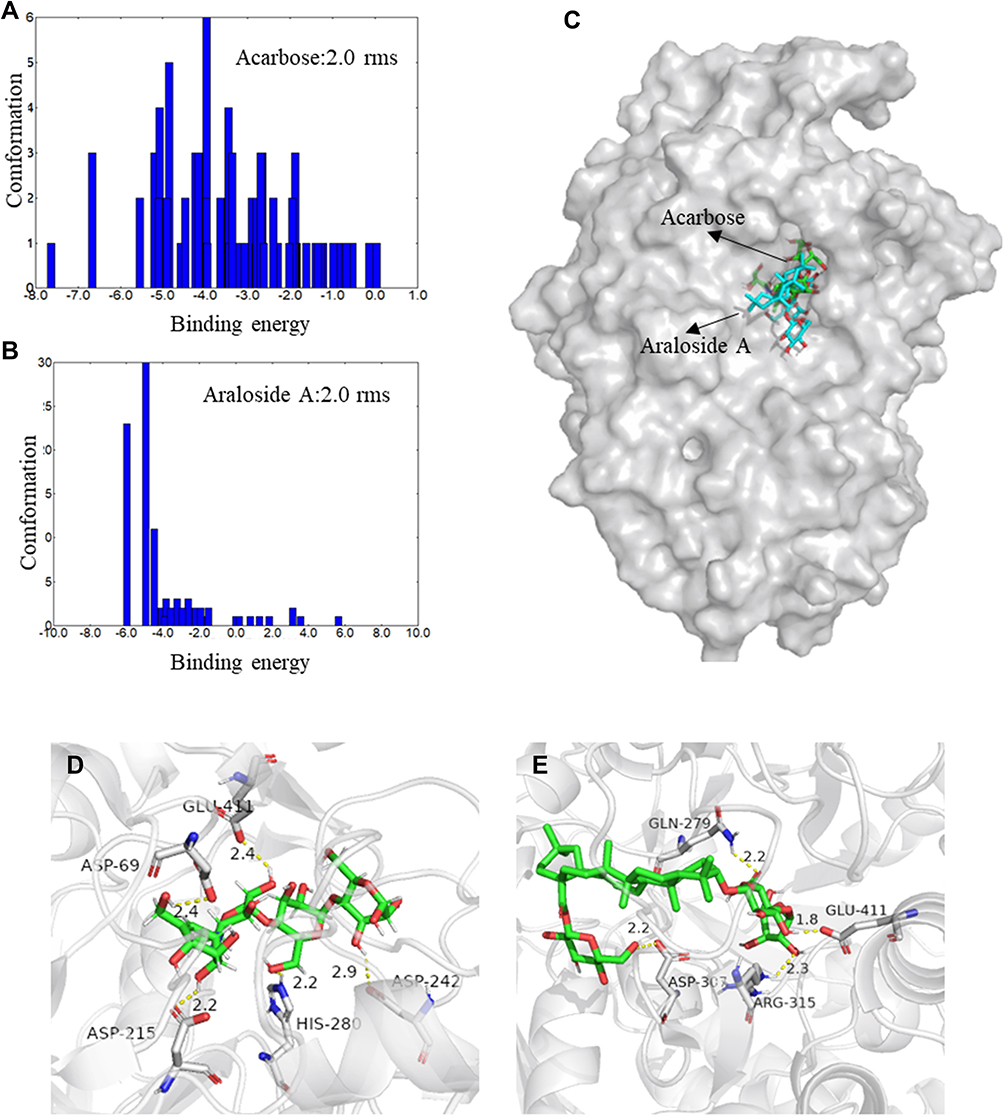 |
Figure 11 (A and B) Cluster analyses of the AutoDock docking runs of acarbose and araloside A with α-glucosidase. (C) Predicted binding mode of acarbose and araloside A docked with α-glucosidase on the molecular surface. (D) The interaction between acarbose and α-glucosidase. (E) The interaction between araloside A and α-glucosidase. The short solid yellow line stands for hydrogen bonds. |
Conclusions
In the present study, UAE was proven to be a rapid and efficient method for the extraction of total saponins from A. taibaiensis, and the optimal process parameters optimized using BBD-RSM were as follows: an ethanol concentration of 73%, ultrasound time of 34 min, ultrasound temperature of 61°C and solid-to-liquid ratio of 16 g/mL. Under optimized UAE conditions, the yield of TSAT was 11.83±0.108%, which was higher than that obtained using HRE. HPLC analysis further suggested that UAE was more suitable than HRE for the extraction of the six saponins. Furthermore, the TSAT obtained using the optimized UAE method and araloside A reversibly inhibited α-glucosidase activity in a mixed and noncompetitive manner, respectively. α-Glucosidase fluorescence was quenched by hydrogen bonding and hydrophobic interactions driven by the formation of the TSAT/araloside A-α-glucosidase complex, which was produced spontaneously (ΔG<0). AFM and FT-IR further showed that the interaction of araloside A with α-glucosidase alters the microenvironment and conformation of the enzyme. Docking results showed that araloside A binds to the cavity of α-glucosidase mainly through hydrogen bonding and hydrophobic interactions to form the araloside A-α-glucosidase complex that leads to a decrease in enzyme activity, supporting the results of thermodynamic analysis. Overall, UAE is a more effective method for extracting total saponins from Aralia taibaiensis. In addition, TSAT and its active ingredient, araloside A, exhibit good α-glucosidase inhibition and show potential as a natural ingredient in functional foods to control postprandial blood glucose levels.
Author Contributions
All authors made a significant contribution to the work reported, whether that is in the conception, study design, execution, acquisition of data, analysis and interpretation, or in all these areas; took part in drafting, revising or critically reviewing the article; gave final approval of the version to be published; have agreed on the journal to which the article has been submitted; and agree to be accountable for all aspects of the work.
Funding
This study was supported by the National Natural Science Foundation of China (No. 81703925) and the Disciplinary Innovation Team Construction Project of Shaanxi University of Chinese Medicine (No. 2019-YL11).
Disclosure
The authors have no conflicts of interest for this work to declare.
References
1. Ding H, Hu X, Xu X, Zhang G, Gong D. Inhibitory mechanism of two allosteric inhibitors, oleanolic acid and ursolic acid on α-glucosidase. Int J Biol Macromol. 2018;107:1844–1855. doi:10.1016/j.ijbiomac.2017.10.040
2. Zeng L, Zhang G, Liao Y, Gong D. Inhibitory mechanism of morin on α-glucosidase and its anti-glycation properties. Food Funct. 2016;7(9):3953–3963. doi:10.1039/c6fo00680a
3. Wang H, Wang J, Liu Y, Ji Y, Guo Y, Zhao J. Interaction mechanism of carnosic acid against glycosidase (α-amylase and α-glucosidase). Int J Biol Macromol. 2019;138:846–853. doi:10.1016/j.ijbiomac.2019.07.179
4. Alqahtani A, Hamid K, Kam A, et al. The pentacyclic triterpenoids in herbal medicines and their pharmacological activities in diabetes and diabetic complications. Curr Med Chem. 2013;20(7):908–931. doi:10.2174/0929867311320070007
5. Li Y, Xiang Z, Cui H, et al. Two new oleanane-type saponins from the husks of Xanthoceras sorbifolia Bunge. Nat Prod Res. 2013;27(3):208–214. doi:10.1080/14786419.2012.666748
6. Woo K, Cha J, Choi S, Lee K. A new triterpene glycoside from the stems of Lagerstroemia indica. Arch Pharm Res. 2016;39(5):631–635. doi:10.1007/s12272-016-0746-4
7. Hou W, Li Y, Zhang Q, et al. Triterpene acids isolated from Lagerstroemia speciosa leaves as alpha-glucosidase inhibitors. Phytother Res. 2009;23(5):614–618. doi:10.1002/ptr.2661
8. Ding H, Wu X, Pan J, Hu X, Gong D, Zhang G. New insights into the inhibition mechanism of betulinic acid on α-Glucosidase. J Agric Food Chem. 2018;66(27):7065–7075. doi:10.1021/acs.jafc.8b02992
9. Xi M, Hai C, Tang H, et al. Antioxidant and antiglycation properties of triterpenoid saponins from Aralia taibaiensis traditionally used for treating diabetes mellitus. Redox Rep. 2010;15(1):20–28. doi:10.1179/174329210x12650506623041
10. Xi M, Hai C, Tang H, Chen M, Fang K, Liang X. Antioxidant and antiglycation properties of total saponins extracted from traditional Chinese medicine used to treat diabetes mellitus. Phytother Res. 2008;22(2):228–237. doi:10.1002/ptr.2297
11. Cui J, Li Y, Jia N, et al. Insulin-secretagogue activity of eleven plant extracts and twelve pure compounds isolated from Aralia taibaiensis. Life Sci. 2013;92(2):131–136. doi:10.1016/j.lfs.2012.11.014
12. Dou F, Xi M, Wang J, et al. alpha-Glucosidase and alpha-amylase inhibitory activities of saponins from traditional Chinese medicines in the treatment of diabetes mellitus. Die Pharmazie. 2013;68(4):300–304.
13. Bi L, Tian X, Dou F, Hong L, Tang H, Wang S. New antioxidant and antiglycation active triterpenoid saponins from the root bark of Aralia taibaiensis. Fitoterapia. 2012;83(1):234–240. doi:10.1016/j.fitote.2011.11.002
14. Zhao S, Kwok K, Liang H. Radix BupleuriInvestigation on ultrasound assisted extraction of saikosaponins from. Sep Purif Technol. 2007;55(3):307–312. doi:10.1016/j.seppur.2006.12.002
15. Hadidi M, Ibarz A, Pagan J. Optimisation and kinetic study of the ultrasonic-assisted extraction of total saponins from alfalfa (Medicago sativa) and its bioaccessibility using the response surface methodology. Food Chem. 2020;309:125786. doi:10.1016/j.foodchem.2019.125786
16. Rostagno M, Palma M, Barroso C. Ultrasound-assisted extraction of soy isoflavones. J Chromatogr A. 2003;1012(2):119–128. doi:10.1016/s0021-9673(03)01184-1
17. Fu X, Belwal T, Cravotto G, Luo Z. Sono-physical and sono-chemical effects of ultrasound: primary applications in extraction and freezing operations and influence on food components. Ultrason Sonochem. 2020;60:104726. doi:10.1016/j.ultsonch.2019.104726
18. Chemat F, Rombaut N, Sicaire A, Meullemiestre A, Fabiano-Tixier A, Abert-Vian M. Ultrasound assisted extraction of food and natural products. Mechanisms, techniques, combinations, protocols and applications. A review. Ultrason Sonochem. 2017;34:540–560. doi:10.1016/j.ultsonch.2016.06.035
19. Wen L, Zhang Z, Sun D, Sivagnanam S, Tiwari B. Combination of emerging technologies for the extraction of bioactive compounds. Crit Rev Food Sci Nutr. 2020;60(11):1826–1841. doi:10.1080/10408398.2019.1602823
20. Dranca F, Oroian M. Optimization of ultrasound-assisted extraction of total monomeric anthocyanin (TMA) and total phenolic content (TPC) from eggplant (Solanum melongena L.) peel. Ultrason Sonochem. 2016;31:637–646. doi:10.1016/j.ultsonch.2015.11.008
21. Ammar A, Naoufal L, Azam B, Dennis W, David L. Phytochemicals: extraction, isolation, and identification of bioactive compounds from plant extracts. Plants. 2017;6(4):42. doi:10.3390/plants6040042
22. Deng J, Liu Q, Zhang C, Cao W, Fan D, Yang H. Extraction optimization of polyphenols from waste kiwi fruit seeds (Actinidia chinensis Planch.) and evaluation of its antioxidant and anti-inflammatory properties. Molecules. 2016;21(7):832. doi:10.3390/molecules21070832
23. Hu T, Guo Y, Zhou Q, et al. Optimization of ultrasonic-assisted extraction of total saponins from Eclipta prostrasta L. using response surface methodology. J Food Sci. 2012;77(9):C975–82. doi:10.1111/j.1750-3841.2012.02869.x
24. Quintero Quiroz J, Naranjo Duran A, Silva Garcia M, Ciro Gomez G, Rojas Camargo J. Ultrasound-assisted extraction of bioactive compounds from annatto seeds, evaluation of their antimicrobial and antioxidant activity, and identification of main compounds by LC/ESI-MS analysis. Int j Food Sci. 2019;2019:3721828. doi:10.1155/2019/3721828
25. Yolmeh M, Habibi Najafi M, Farhoosh R. Optimisation of ultrasound-assisted extraction of natural pigment from annatto seeds by response surface methodology (RSM). Food Chem. 2014;155:319–324. doi:10.1016/j.foodchem.2014.01.059
26. Li W, Zhao L, Sun Y, et al. Optimization of pressurized liquid extraction of three major acetophenones from Cynanchum bungei using a box-behnken design. Int J Mol Sci. 2012;13(11):14533–14544. doi:10.3390/ijms131114533
27. Li H, Zhai B, Sun J, et al. Aralia taibaiensisantioxidant, anti-aging and organ protective effects of total saponins from. Drug Des Devel Ther. 2021;15:4025–4042. doi:10.2147/dddt.S330222
28. Bae I, Ham H, Jeong M, Kim D, Kim H. Simultaneous determination of 15 phenolic compounds and caffeine in teas and mate using RP-HPLC/UV detection: method development and optimization of extraction process. Food Chem. 2015;172:469–475. doi:10.1016/j.foodchem.2014.09.050
29. Zhou F, Zhang L, Gu L, et al. Simultaneous quantification of 13 compounds in guanxin shutong capsule by HPLC method. J Chromatogr Sci. 2016;54(6):971–976. doi:10.1093/chromsci/bmw029
30. Chai W, Wei M, Wang R, Deng R, Zou Z, Peng Y. Avocado proanthocyanidins as a source of tyrosinase inhibitors: structure characterization, inhibitory activity, and mechanism. J Agric Food Chem. 2015;63(33):7381–7387. doi:10.1021/acs.jafc.5b03099
31. Yang B, Zhang M, Weng H, Xu Y, Zeng L. AnoectochilusOptimization of Ultrasound Assisted Extraction (UAE) of Kinsenoside Compound from (Wall.) Lindl by Response Surface Methodology (RSM). Molecules. 2020;25(1). doi:10.3390/molecules25010193
32. Kumar K, Srivastav S, Sharanagat V. Ultrasound assisted extraction (UAE) of bioactive compounds from fruit and vegetable processing by-products: a review. Ultrason Sonochem. 2021;70:105325. doi:10.1016/j.ultsonch.2020.105325
33. Shen S, Zhu L, Wu Z, Wang G, Ahmad Z, Chang M. Ganoderma lucidumProduction of triterpenoid compounds from spore powder using ultrasound-assisted extraction. Prep Biochem Biotechnol. 2020;50(3):302–315. doi:10.1080/10826068.2019.1692218
34. Lee J, Mo E, Choi J, et al. Effect of Korean Red Ginseng extraction conditions on antioxidant activity, extraction yield, and ginsenoside Rg1 and phenolic content: optimization using response surface methodology. J Ginseng Res. 2016;40(3):229–236. doi:10.1016/j.jgr.2015.08.001
35. Yang L, Cao Y, Jiang J, Lin Q, Chen J, Zhu L. Response surface optimization of ultrasound-assisted flavonoids extraction from the flower of Citrus aurantium L. var. amara Engl. J Sep Sci. 2010;33(9):1349–1355. doi:10.1002/jssc.200900776
36. Hou M, Hu W, Wang A, et al. Pteris creticaultrasound-assisted extraction of total flavonoids from L.: process optimization, HPLC analysis, and evaluation of antioxidant activity. Antioxidants. 2019;8(10). doi:10.3390/antiox8100425
37. Yang Q, Gan R, Ge Y, Zhang D, Corke A. Phaseolus vulgarisultrasonic treatment increases extraction rate of common bean (L.) antioxidants. Antioxidants. 2019;8(4). doi:10.3390/antiox8040083
38. Shi W, Jia J, Gao Y, Zhao Y. Influence of ultrasonic pretreatment on the yield of bio-oil prepared by thermo-chemical conversion of rice husk in hot-compressed water. Bioresour Technol. 2013;146:355–362. doi:10.1016/j.biortech.2013.07.094
39. Wang Y, Zhang G, Pan J, Gong D. Novel insights into the inhibitory mechanism of kaempferol on xanthine oxidase. J Agric Food Chem. 2015;63(2):526–534. doi:10.1021/jf505584m
40. Dong Q, Tan L, Hu N, Wang H. Study on the optimization of the extraction technology by response surface methodology and inhibitory activity ofα-glucoside of total saponins from the bran of Chenopodium quinoa willd. Nat Prod Res Dev. 2021;33(6):935–942.
41. Yang W, Li C, Yu K, Liu H, Qi X. Inhibitory effect of mogrosides crude extract on α-glucosidase in vitro. Sci Technol Food Ind. 2016;37(24):111–115.
42. Wang M, Shi J, Wang L, et al. Inhibitory kinetics and mechanism of flavonoids from lotus (Nelumbo nucifera Gaertn.) leaf against pancreatic α-amylase. Int J Biol Macromol. 2018;120:2589–2596. doi:10.1016/j.ijbiomac.2018.09.035
43. Zhang G, Wang L, Pan J. Probing the binding of the flavonoid diosmetin to human serum albumin by multispectroscopic techniques. J Agric Food Chem. 2012;60(10):2721–2729. doi:10.1021/jf205260g
44. Zhao D, Zhou A, Du Z, Zhang Y, Zhang K, Ma Y. Coumarins with α-glucosidase and α-amylase inhibitory activities from the flower of Edgeworthia gardneri. Fitoterapia. 2015;107:122–127. doi:10.1016/j.fitote.2015.10.012
45. Lin M, Chai W, Zheng Y, Huang Q, Ou-Yang C. Inhibitory kinetics and mechanism of rifampicin on α-glucosidase: insights from spectroscopic and molecular docking analyses. Int J Biol Macromol. 2019;122:1244–1252. doi:10.1016/j.ijbiomac.2018.09.077
46. Wang Y, Zhang G, Wang L. Potential toxicity of phthalic acid esters plasticizer: interaction of dimethyl phthalate with trypsin in vitro. J Agric Food Chem. 2015;63(1):75–84. doi:10.1021/jf5046359
47. Wang C, Wang J, Deng L. Evaluating interaction forces between BSA and rabbit anti-BSA in sulphathiazole sodium, tylosin and levofloxacin solution by AFM. Nanoscale Res Lett. 2011;6(1):579. doi:10.1186/1556-276x-6-579
48. Yan J, Zhang G, Pan J, Wang Y. α-Glucosidase inhibition by luteolin: kinetics, interaction and molecular docking. Int J Biol Macromol. 2014;64:213–223. doi:10.1016/j.ijbiomac.2013.12.007
49. Yz A, Wy A, Ws A, et al. Inhibition of porcine pancreatic α-amylase activity by chlorogenic acid - ScienceDirect. J Funct Foods. 2020;64:103587.
50. Zheng Y, Tian J, Yang W, et al. Inhibition mechanism of ferulic acid against α-amylase and α-glucosidase. Food Chem. 2020;317:126346. doi:10.1016/j.foodchem.2020.126346
51. Zhang S, Qiu B, Zhu J, Khan M, Liu X. Investigation of the interaction of 2,4-dimethoxy-6,7-dihydroxyphenanthrene with α-glucosidase using inhibition kinetics, CD, FT-IR and molecular docking methods. Spectrochim Acta A Mol Biomol Spectrosc. 2018;203:13–18. doi:10.1016/j.saa.2018.05.077
 © 2022 The Author(s). This work is published and licensed by Dove Medical Press Limited. The full terms of this license are available at https://www.dovepress.com/terms.php and incorporate the Creative Commons Attribution - Non Commercial (unported, v3.0) License.
By accessing the work you hereby accept the Terms. Non-commercial uses of the work are permitted without any further permission from Dove Medical Press Limited, provided the work is properly attributed. For permission for commercial use of this work, please see paragraphs 4.2 and 5 of our Terms.
© 2022 The Author(s). This work is published and licensed by Dove Medical Press Limited. The full terms of this license are available at https://www.dovepress.com/terms.php and incorporate the Creative Commons Attribution - Non Commercial (unported, v3.0) License.
By accessing the work you hereby accept the Terms. Non-commercial uses of the work are permitted without any further permission from Dove Medical Press Limited, provided the work is properly attributed. For permission for commercial use of this work, please see paragraphs 4.2 and 5 of our Terms.