")
Back to Journals » OncoTargets and Therapy » Volume 9
Tumoral angiogenesis in both adrenal adenomas and nonadenomas: a promising computed tomography biomarker for diagnosis
Authors Wang X, Li K, Sun H, Zhao J, Zhang Z, Zheng L, Li W, Bai R, Zhang G
Received 6 August 2015
Accepted for publication 18 January 2016
Published 30 March 2016 Volume 2016:9 Pages 1823—1830
DOI https://doi.org/10.2147/OTT.S93868
Checked for plagiarism Yes
Review by Single anonymous peer review
Peer reviewer comments 3
Editor who approved publication: Dr Jianmin Xu
Xifu Wang,1 Kangan Li,1 Haoran Sun,2 Jinglong Zhao,1 Zhuoli Zhang,3 Linfeng Zheng,1 Weiguo Li,3 Renju Bai,2 Guixiang Zhang1
1Department of Radiology, Shanghai General Hospital, Shanghai Jiaotong University, Shanghai, 2Department of Radiology, Tianjin Medical University General Hospital, Tianjin, People’s Republic of China; 3Department of Radiology, Feinberg School of Medicine, Northwestern University, Chicago, IL, USA
Abstract: To explore the correlation between the typical findings of dynamic contrast-enhanced computed tomography (DCE-CT) and tumoral angiogenesis (microvessel density [MVD] and vascular endothelial growth factor [VEGF]) in adenomas and nonadenomas such that the enhancement mechanism of DCE-CT in adrenal masses can be explained more precisely. Forty-two patients with 46 adrenal masses confirmed by surgery and pathology were included in the study; these masses included 23 adenomas, 18 nonadenomas, and 5 hyperplastic nodules. The findings of DCE-CT and angiogenesis in adrenal masses were studied. The features of DCE-CT in adenomas and nonadenomas were evaluated to determine whether the characteristics of DCE-CT in adrenal masses were closely correlated with tumoral angiogenesis. Adrenal adenomas were significantly different from nonadenomas in the time density curve and the mean percentage of enhancement washout at the 7-minute delay time in DCE-CT. The mean MVD and VEGF expression exhibited significant differences between the rapid washout group (types A and C) and the slow washout group (types B, D, and E) and between the relative washout (Washr) ≥34% and the absolute washout (Washa) ≥43% on the 7-minute enhanced CT scans (P=0.000). Adenomas were suggested when adrenal masses presented as types A and C, and/or the Washr ≥34%, and/or the Washa ≥43%, and the opposite was suggested for nonadenomas. These results showed a close correlation between the characteristics of DCE-CT and both MVD and VEGF expression in adrenal masses. There was also a significant difference in MVD and VEGF expression between adenomas and nonadenomas. In conclusion, MVD and VEGF expression are two important pathological factors that play important roles in the characterization of DCE-CT in adrenal masses because they cause different time density curve types, the Washr and the Washa for adrenal adenomas and nonadenomas.
Keywords: tumoral angiongenesis, adrenal adenomas and nonadenomas, x-ray computed tomography, biomarker, diagnosis
Introduction
Angiogenesis is essential for tumor growth and metastasis formation.1 Currently, although the detection of microvessel density (MVD) by immunohistochemistry is the gold standard for evaluating tumor angiogenesis,2 there is strong evidence that angiogenic activity is also reflected in the vascular permeability of tumors. Vascular endothelial growth factor (VEGF) has been identified as a powerful enhancer of endothelial hyperpermeability,3 and the leakage of serum proteins is considered an essential step in the angiogenic process.4 Many strategies are used to evaluate the role of angiogenesis in tumor progression.5–7
Several authors1,8–10 have assessed the washout characteristics of adrenal lesions with dynamic contrast-enhanced computed tomography (DCE-CT). Adrenal adenomas exhibit a greater washout of contrast material than do adrenal nonadenomas. Therefore, the percentage change in the washout of contrast material is a useful method for differentiating adrenal adenomas and nonadenomas. Szolar and Kammerhuber11 suggest that the greater washout of contrast material is a unique characteristic of adrenal adenomas. In addition, a greater wash-in of contrast material in adrenal adenomas also was demonstrated. Although there are no pathophysiologic data on this subject in the literature, they speculated that possible histopathologic explanations of different angioarchitecture of adenomas and nonadenomas might be related to the preservation of cellular membrane integrity and the smaller expansion of the effective extracellular space due to tumor infiltration in adrenal adenomas. With the exception of few articles,12 the enhancement mechanism of DCE-CT has not yet been thoroughly studied.
The purpose of our present study was to investigate the correlation between the findings of DCE-CT and angiogenesis (MVD and VEGF) in adrenal adenomas and nonadenomas and to determine the enhancement mechanism of DCE-CT.
Materials and methods
Study population
The study protocol was approved by and conducted in accordance with the recommendations of the human research committee at Tianjin Medical University General Hospital. All patients provided written informed consent.
Forty-two patients with 46 adrenal masses were consecutively examined with helical CT and considered for entry into the protocol. The study group comprised 13 male and 29 female patients (mean age, 43.9 years; range: 9–64 years). The presence of individual masses was confirmed by surgery and pathology. The mass involved 23 left and 23 right adrenal glands. The mean transaxial diameter of the masses was 3.3±2.1 cm (range: 0.9–9.9 cm). The masses consisted of 23 adenomas, 18 nonadenomas, and 5 hyperplastic nodules. The 18 nonadenomas included the following: pheochromocytoma (n=11), metastases (n=3), cortical carcinoma (n=1), and neurogenic tumors (n=3).
Imaging protocol
Studies were performed on a HiSpeed CT/i scanner (GE Medical Systems, Milwaukee, WI, USA). Helical scans were obtained before and after an intravenous bolus injection of contrast material. The protocol consisted of a volumetric data acquisition through the adrenal glands (upper abdomen) with 3 or 5 mm collimation, 1:1 pitch, 120 kVp, and 220 mA. The scanning time for one revolution of the X-ray tube was 1 second. Each scan (acquisition time, 18–24 seconds) was obtained with the patient in full inspiration to optimize the reproducibility of starting measurements.
Initially, a baseline scan without contrast agent injection was obtained through the adrenal glands in each individual patient. Subsequently, dynamic enhanced scans were obtained after an intravenous injection of 100–120 mL of Ultravist 370 (Bayer Schering Pharma, Berlin, Germany) or Omnipaque 350 (Nycomed/GE Healthcare, Milwaukee, WI, USA) depending on the patient size. Intravenous contrast material was administered with a power injector (MCT Plus, Medrad, Stellant Dual Saline Syringe Kit; Indianola, PA, USA) at a rate of 2.5 mL/s. The imaging parameters were similar for all six phases and consisted of the following: the same collimation, table feed, and duration as the first scan. The following scan delays included 30 seconds, 1 minute, 2 minutes, 3 minutes, 5 minutes, and 7 minutes after the start of contrast material injection. Images were obtained with standard soft-tissue settings.
Image and data analysis
Image interpretation and attenuation measurements were performed retrospectively by two radiologists experienced in CT, who had no knowledge of the clinical and histologic findings and who worked independently (without consultation). For all adrenal masses, the CT attenuation values were measured using the circular region of interest (ROI) cursors placed on images of the adrenal lesion in question. The ROI circle was made as large as possible, which covered at least one-half of the mass; lesion edges were avoided to prevent partial volume effects. The necrotic, cystic, and hemorrhagic components of adrenal masses were excluded whenever possible. At least two measurements were obtained for each mass at each imaging phase. The measurements obtained by the two radiologists were averaged.
The time density (TD) curves were obtained based on the absolute CT attenuation value at each delay time point. The TD curves of masses were classified into the following five types: type A represents a rapidly rising slope (wash-in) during the early phase (≤1 minute), followed by a rapid washout phase, after the peak enhancement is achieved; type B represents a rapidly rising slope during the early phase (≤1 minute), that is followed by smooth decay or plateau in the latter portion; type C represents a slowly rising slope during the early phase (≥2 minutes), followed by rapid washout phases after the peak enhancement; type D represents a slowly rising slope during the early phase (≥2 minutes) followed by smooth decay or plateau in the latter portion; and type E represents a slowly and gradually rising slope during the period of the scan.
The same radiologist recorded the mean attenuation values and calculated the relative washout (Washr) for all adrenal masses using the following equation: Washr = (Dmax − Dpost)/Dmax ×100%. The absolute washout (Washa) was calculated using the following equation: Washa = ([Dmax − Dpre] − [Dpost − Dpre])/(Dmax − Dpre) ×100%. Dmax is the enhancement peak of the CT attenuation value in adrenal masses following the administration of contrast material; Dpost is the CT attenuation value at different time delays after the enhancement peak of the mass; and Dpre is the unenhanced CT attenuation value of adrenal masses.
The adrenal masses were divided into three groups, including adenomas, nonadenomas, and hyperplastic nodules, based on the histopathological results. The TD curves and the percentage of enhancement washout in DCE-CT among three groups were compared.
Immunohistochemistry
All surgical specimens were cut in the transaxial plane resembling (with an approximate accuracy of 3–5 mm) the sections obtained by DCE-CT. Visual inspection of gross tumor tissue was compared with CT scans to ensure consistency with the areas of histopathological examination with the ROI selected on the CT images. The surgical specimens were fixed in 10% neutral formaldehyde and then embedded in paraffin. The specimens were cut into 4 mm sections, with the intention of obtaining the closest match between the ROIs and the examined specimens. Three consecutive sections were collected from each tumor for hematoxylin and eosin staining and immunohistochemistry (MVD and VEGF). Because different ROIs were obtained from different CT scans, the three consecutive sections came from each matched CT slice, although their thicknesses varied.
Immunohistochemistry was performed by using a PV6002 two-step method (immunoglobulin-peroxidase method). Mouse antihuman CD31 monoclonal antibody, mouse antihuman VEGF monoclonal antibody, goat antimouse PV6002 antibody, and a 3,3-diaminobenzidine kit were purchased commercially (Beijing Zhongshan Biotech Co., Ltd, Beijing, People’s Republic of China). The immunohistochemistry images were acquired by the computerized medical image analysis system and AGFA-II scanner (Image Center of Beijing University of Aeronautics & Astronautics, Beijing, People’s Republic of China). Cells staining positive for endothelial cell marker CD31 had brown or yellow–brown granules, microvessels with positive-staining cells without background were marked, and MVD was counted. The criteria used for vessel counting were those established by Weidner13 and the microvessels with identifiable positive-staining cells or cell clusters served as a blood vessel. Sections were observed at low magnification (×40), and three hot areas with the highest blood vessel density were recorded at a higher magnification (×200; n/0.74 mm2), photographed, and then the mean counts with the highest MVD were calculated. Staining for VEGF was also performed. VEGF-positive cells were recognized by brown or yellow–brown granules in the cytoplasm or on the cell membrane, a light blue nucleus, and an absent background. The mean counts of positive and negative cells within three hot spots with the most intensive area of positive cells were calculated to determine the average positive rate of VEGF expression. According to the classification criteria developed by Liu et al,14 the VEGF expression was classified into four grades: grade I, <25%; grade II, 25%–50%; grade III, 50%–75%; and grade IV, >75%. Furthermore, immunoreactivities were further graded on a four-point scale: grade I = slight; grade II = moderate; and grade III–IV = strong expression according to the staining intensity around vessels including the stromal intensity.
Statistical analysis
The correlation between MVD and VEGF expression and the characteristics of DCE-CT in adrenal masses was evaluated. The counting data, including the types of TD curves and VEGF expression between the groups, were analyzed using Pearson’s chi-squared test. The measurement data, including MVD and the percentage of enhancement washout between groups, were analyzed using a two sample average t-test. If a nonnormal distribution was present and remained after numeric conversion, the Mann–Whitney rank-sum application test was used. P<0.05 was considered to be statistically significant. For the DCE-CT data set, we calculated the sensitivity, specificity, accuracy, positive predictive value, and negative predictive value for the diagnosis of adrenal adenoma.
Results
The findings of DCE-CT in adrenal adenomas, nonadenomas, and hyperplastic nodules
The types of TD curves in adrenal masses were divided into two groups based on the changes observed following the enhancement peak in DCE-CT: rapid washout and slow washout. Types A and C were characterized by rapid washout of contrast material, and types B, D, and E were characterized by slow washout of contrast material. Table 1 and Figure 1 show a significant difference in the distribution of TD curve types between adrenal adenomas and nonadenomas (P=0.000).
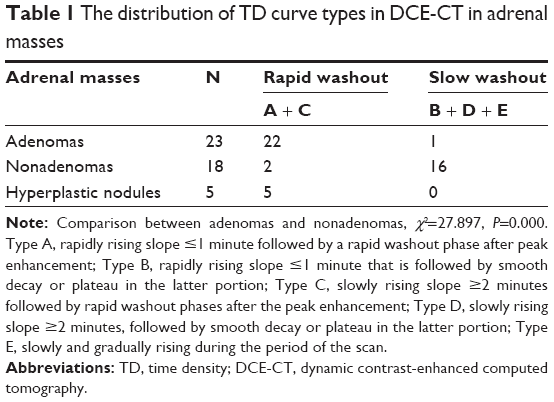 | Table 1 The distribution of TD curve types in DCE-CT in adrenal masses |
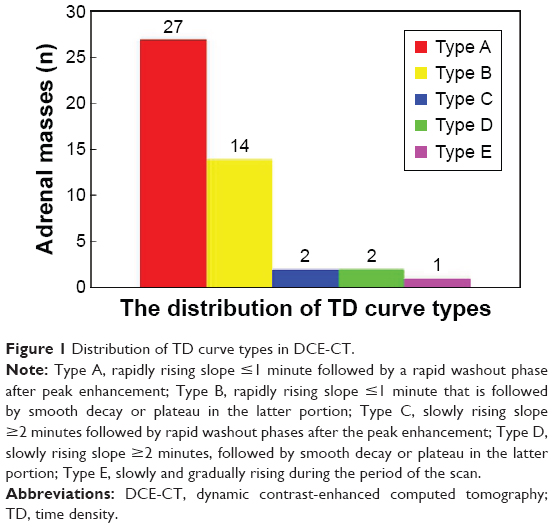 | Figure 1 Distribution of TD curve types in DCE-CT. |
The significant differences in the Washr and the Washa between adenomas and nonadenomas are shown in Table 2 at the 7-minute enhanced CT scans (P=0.000). The Washr and the Washa obtained for the adenomas at the 7-minute enhanced scans were substantially higher than those obtained for nonadenomas.
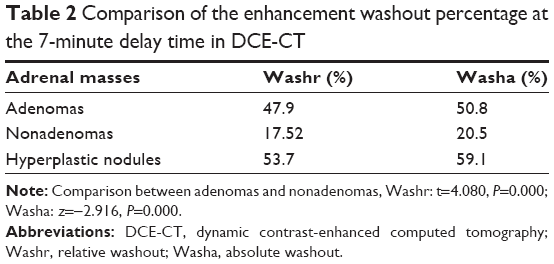 | Table 2 Comparison of the enhancement washout percentage at the 7-minute delay time in DCE-CT |
The optimal threshold values of percentage enhancement washout were identified statistically using ROC curve analysis. The Washr ≥34% was suggestive of adenomas, and the Washr <34% was considered nonadenomas; in contrast, the Washa ≥43% suggested adenomas, whereas the Washa <43% indicated nonadenomas.
Diagnostic value of TD curve for adrenal masses
The distribution of types of TD curves in 46 adrenal masses was as follows: type A (n=27), type B (n=14), type C (n=2), type D (n=2), and type E (n=1). Based on the diagnostic criteria used for the TD curve, 29 adrenal masses were correctly characterized as adenomas compared with 17 nonadenomas. These findings indicated a sensitivity, specificity, and accuracy of 96%, 70%, and 83%, respectively, for the detection of adrenal adenoma. The positive predictive value was 76%, and the negative predictive value was 94% (Table 3).
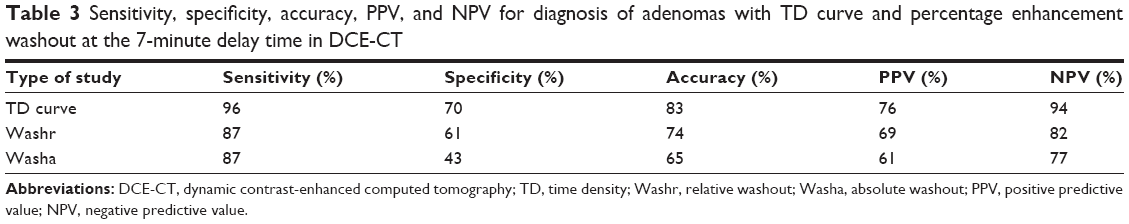 | Table 3 Sensitivity, specificity, accuracy, PPV, and NPV for diagnosis of adenomas with TD curve and percentage enhancement washout at the 7-minute delay time in DCE-CT |
Diagnostic value of the mean percentage enhancement washout for adrenal masses
On the 7-minute delayed enhanced scans, 29 adrenal masses were characterized as adenomas and 17 as nonadenomas, based on the optimal threshold value for the Washr. The associated sensitivity, specificity, and accuracy were 87%, 61%, and 74%, respectively, for the diagnosis of adrenal adenomas, with the threshold of 34%. The positive predictive value was 69%, and the negative predictive value was 82%. In comparison, 33 adrenal masses were diagnosed as adenomas and 13 as nonadenomas, based on the optimal threshold for the Washa. The associated sensitivity, specificity, and accuracy were 87%, 43%, and 65%, respectively, for the detection of adrenal adenoma at the threshold of 43%. The positive predictive value was 61%, and the negative predictive value was 77% (Table 3).
Correlation between the findings of DCE-CT and VEGF and MVD in adrenal masses
There was a significant deference in MVD and VEGF expression between the rapid washout groups (types A and C) and the slow washout groups (types B, D, and E) in the distribution of TD curve type (P=0.000). The expression of both MVD and VEGF in the rapid washout group was higher than that in the slow washout group (Table 4; Figures 2–5).
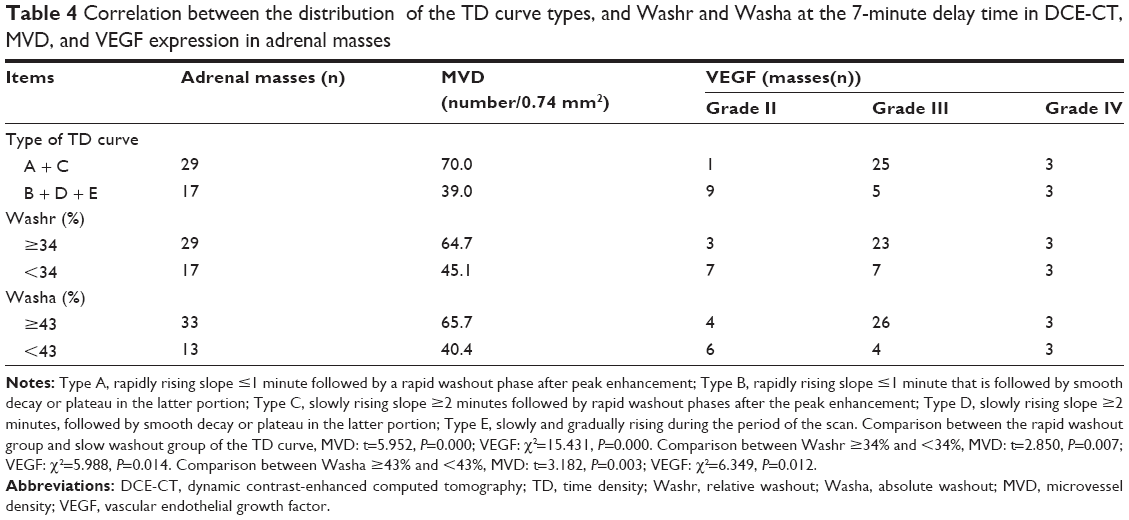 | Table 4 Correlation between the distribution of the TD curve types, and Washr and Washa at the 7-minute delay time in DCE-CT, MVD, and VEGF expression in adrenal masses |
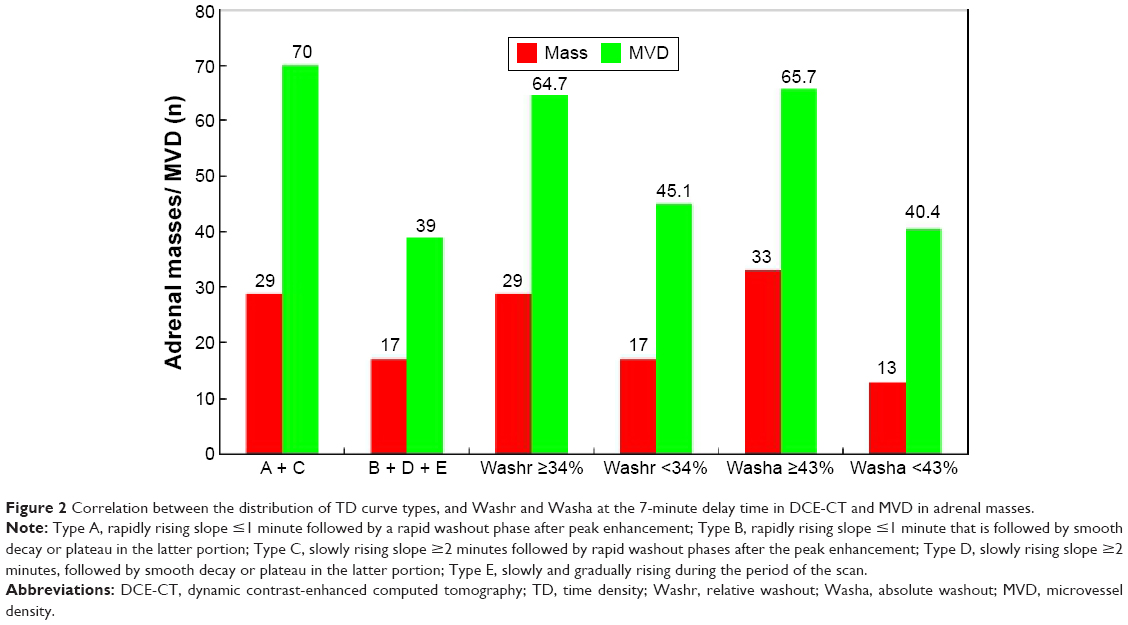 | Figure 2 Correlation between the distribution of TD curve types, and Washr and Washa at the 7-minute delay time in DCE-CT and MVD in adrenal masses. |
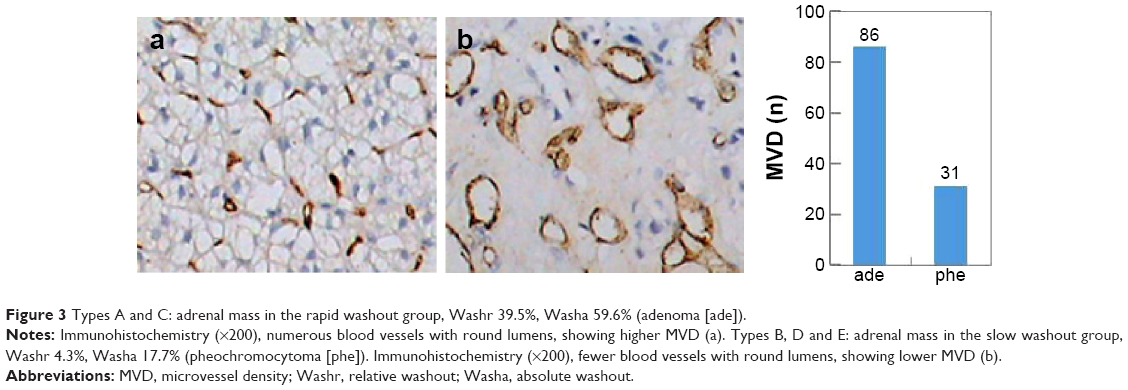 | Figure 3 Types A and C: adrenal mass in the rapid washout group, Washr 39.5%, Washa 59.6% (adenoma [ade]). |
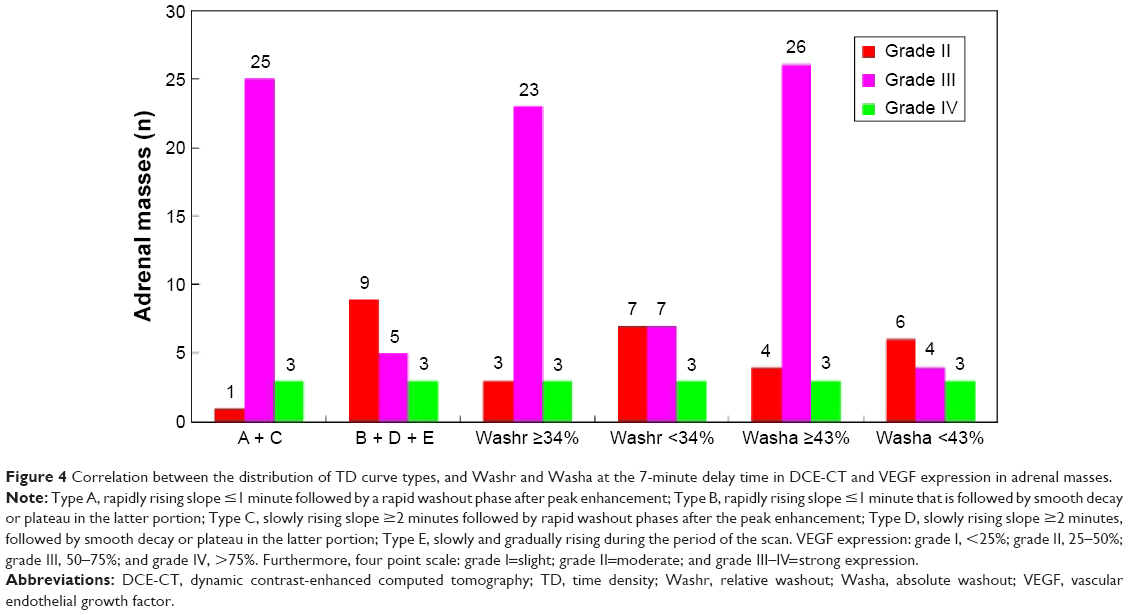 | Figure 4 Correlation between the distribution of TD curve types, and Washr and Washa at the 7-minute delay time in DCE-CT and VEGF expression in adrenal masses. |
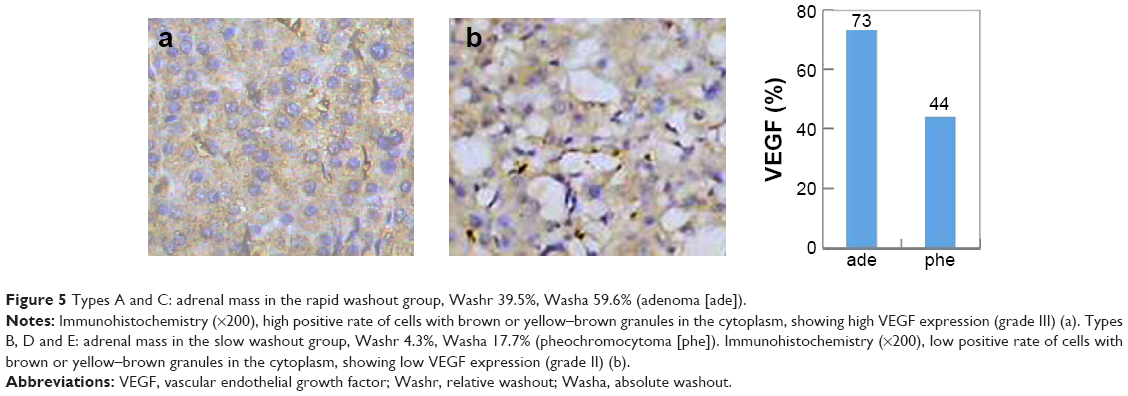 | Figure 5 Types A and C: adrenal mass in the rapid washout group, Washr 39.5%, Washa 59.6% (adenoma [ade]). |
There was a significant difference in the expression of both MVD and VEGF between the Washr ≥34% group and the <34% group in DCE-CT (P=0.007; P=0.014). The expression of both MVD and VEGF in the Washr ≥34% group was higher than that in the <34% group (Table 4; Figures 2–5).
There was a significant deference in expression of both MVD and VEGF between the Washa ≥43% group and the <43% group in DCE-CT (P=0.003; P=0.012). The expression of both MVD and VEGF in the Washa ≥43% group was higher than that in the <43% group (Table 4; Figures 2–5).
Discussion
This present study showed that there were significant differences in the features of DCE-CT between adrenal adenomas and nonadenomas. The mean percentage enhancement washout in adenomas was faster than that in nonadenomas; in particular, the TD curve demonstrated a higher accuracy for distinguishing adenomas from nonadenomas. However, the TD curve is recommended because of its simplicity and intuition for higher diagnostic accuracy and its ability to be combined with the percentage enhancement washout, if necessary, for the diagnosis of adrenal masses.
Correlations between the findings of medical imaging and angiogenesis in tumors have been reported in many studies, which have agreed that tumor angiogenesis could be reflected noninvasively by using imaging modalities, which play a more important role in evaluating prognosis in patients with tumors, screening for metastasis in high-risk cases, providing guidance for clinical treatment, and assessing treatments. The enhancement mechanism used in the imaging of tumors was explained by using the correlation mentioned eariler, which resulted in the interpretation of features of medical imaging. Furthermore, imaging could help make a correct disease diagnosis.
Few studies have reported the enhancement mechanism of DCE-CT/magnetic resonance imaging in adrenal masses.12 Krestin et al8,9 first hypothesized that the features of CT and magnetic resonance imaging in adrenal tumors are related to blood perfusion and vascular permeability disorders. Thus, the correlation between the characteristics of DCE-CT in adrenal masses and angiogenesis was investigated preliminarily in the present study.
Many studies have shown correlations between the findings of DCE-CT and MVD in certain tumors;10,12,15,16 the results of the present study supported these findings. There were significant differences in MVD between the rapid washout group (types A and C) and the slow washout group (types B, D, and E) in the distribution of the TD curve type, between the Washr ≥34% group and the <34% group, and between the Washr ≥43% group and the <43% group at the 7-minute delay time in DCE-CT. The MVDs in the rapid washout group of the TD curve, the Washr ≥34% group, and the Washr ≥43% group were significantly higher than the MVDs in the slow washout group of TD curve, the Washr <34% group, and the Washa <43% group. Therefore, the MVD in adrenal masses is one of the most important factors that affect the distribution of the TD curve type and the difference in enhancement washout in DCE-CT.
In addition, there was a significant difference in the distribution of TD curve type between adrenal adenomas and nonadenomas. Types A and C TD curves are characteristics of adrenal adenomas, which show rapid washout; in contrast, types B, D, and E TD curves characterize adrenal nonadenomas, which show slow washout. There was also a significant difference in the Washr and the Washa in DCE-CT between adenomas and nonadenomas. Because there was a significant difference in MVD between adenomas and nonadenomas (the MVD of adenomas is higher than that of nonadenomas), it could be concluded that MVD is one of most important histopathological factors and results in the ability to differentiate adenomas from nonadenomas. It is thus believed that a higher MVD in adenomas can cause types A and C TD curves and rapid washout in DCE-CT, which is the basis of adrenal adenoma diagnoses.
In our study, there were significant differences in VEGF expression between the rapid washout groups (types A and C) and the slow washout groups (types B, D, and E) in the distribution of TD curve type, between the Washr ≥34% group and <34% group and between the Washa ≥43% group and <43% group at 7-minute delay time in DCE-CT. The VEGF expression in the rapid washout group of TD curve, the Washr ≥34% group, and the Washa ≥43% group was significantly higher than that in the slow washout group of TD curve, the Washr <34% group, and the Washa <43% group. Therefore, VEGF expression in adrenal masses is also one of most important factors that affect the distribution of the TD curve type and the difference of enhancement washout at the 7-minute delay time in DCE-CT.
In addition, there is a significant difference in the distribution of TD curve type, and the Washr and the Washa at the 7-minute delay time in DCE-CT between adrenal adenomas and nonadenomas. The results also show that the VEGF expression of adenomas is higher than that of nonadenomas. Therefore, it is speculated that VEGF expression is also an important pathogenesis that leads to the findings of DCE-CT in adrenal masses and the ability to differentiate adenomas from nonadenomas. It is concluded that a higher VEGF expression in adenomas is predominantly responsible for types A and C TD curves and rapid washout in DCE-CT, which can be used in the diagnosis of adrenal adenomas.
Our current study shows that there is correlation between the findings of DCE-CT and angiogenesis (MVD and VEGF) in both adrenal adenomas and nonadenomas. The significant differences of the correlations between adrenal adenomas and nonadenomas should be served as imaging biomarkers for diagnosis.
Acknowledgment
Shanghai Pujiang Talent Program (14PJD028); Biomedical Engineering Cross Fund of Shanghai Jiaotong University (YG2015MS31); Medical Education Research of Shanghai Jiaotong University School.
Disclosure
The authors report no conflicts of interest in this work.
References
Korobkin M, Brodeur FJ, Francis IR, Quint LE, Dunnick NR, Londy F. CT time-attenuation washout curves of adrenal adenomas and nonadenomas. AJR Am J Roentgenol. 1998;170(3):747–752. | ||
Hawighorst H, Knapstein PG, Knopp MV, Vaupel P, van Kaick G. Cervical carcinoma: standard and pharmacokinetic analysis of time-intensity curves for assessment of tumor angiogenesis and patient survival. MAGMA. 1999;8(1):55–62. | ||
Brown LF, Berse B, Jackman RW, et al. Expression of vascular permeability factor (vascular endothelial growth factor) and its receptors in breast cancer. Hum Pathol. 1995;26(1):86–91. | ||
Kim KJ, Li B, Winer J, et al. Inhibition of vascular endothelial growth factor-induced angiogenesis suppresses tumor growth in vivo. Nature. 1993;362(6423):841–844. | ||
Sharma S, Sharma MC, Sarkar C. Morphology of angiogenesis in human cancer: a conceptual overview, histoprognostic perspective and significance of neoangiogenesis. Histopathology. 2005;46(5):481–489. | ||
Vermeulen PB, Gasparini G, Fox SB, et al. Second international consensus on the methodology and criteria of evaluation of angiogenesis quantification in solid human tumours. Eur J Cancer. 2002;38(12):1564–1579. | ||
Białas M, Dyduch G, Dudała J, et al. Study of microvessel density and the expression of vascular endothelial growth factors in adrenal gland pheochromocytomas. Int J Endocrinol. 2014;2014:104129. | ||
Krestin GP, Steinbrich W, Friedmann G. Adrenal masses: evaluation with fast gradient-echo MR imaging and Gd-DTPA-enhanced dynamic studies. Radiology. 1989;171(3):675–680. | ||
Krestin GP, Freidmann G, Fischbach R, Neufang KF, Allolio B. Evaluation of adrenal masses in oncologic patients: dynamic contrast-enhancement MR vs. CT. J Comput Assist Tomogr. 1991;15(1):104–110. | ||
Pena CS, Boland GW, Hahn PF, Lee MJ, Mueller PR. Characterization of indeterminate (lipid-poor) adrenal masses: use of washout characteristics at contrast-enhanced CT. Radiology. 2000;217(3):798–802. | ||
Szolar DH, Kammerhuber FH. Adrenal adenomas and nonadenomas: assessment of washout at delayed contrast-enhanced CT. Radiology. 1998;207(2):369–375. | ||
Qin HY, Sun H, Wang X, Bai R, Li Y, Zhao J. Correlation between CT perfusion parameters and microvessel density and vascular endothelial growth factor in adrenal tumors. PLoS One. 2013;8(11):e79911. | ||
Weidner N. Current pathologic methods for measuring intratumoral microvessel density within breast carcinoma and other solid tumors. Breast Cancer Res Treat. 1995;36(2):169–180. | ||
Liu PF, Bao RX, Niu Y, Yu Y. Angiogenesis and dynamic contrast enhanced MRI of benign and malignant breast lesions: preliminary results. Chin J Radiol. 2002;36(11):967–972. | ||
Zagzag D, Goldenberg M, Brem S. Angiogenesis and blood-brain barrier breakdown modulate CT contrast enhancement: an experimental study in a rabbit brain-tumor model. AJR Am J Roentgenol. 1989;153(1):141–146. | ||
Tateishi U, Nishihara H, Watanabe S, Morikawa T, Abe K, Miyasaka K. Tumor angiogenesis and dynamic CT in lung adenocarcinoma: radiologic-pathologic correlation. J Comput Assist Tomogr. 2001;25(1):23–27. |
 © 2016 The Author(s). This work is published and licensed by Dove Medical Press Limited. The full terms of this license are available at https://www.dovepress.com/terms.php and incorporate the Creative Commons Attribution - Non Commercial (unported, v3.0) License.
By accessing the work you hereby accept the Terms. Non-commercial uses of the work are permitted without any further permission from Dove Medical Press Limited, provided the work is properly attributed. For permission for commercial use of this work, please see paragraphs 4.2 and 5 of our Terms.
© 2016 The Author(s). This work is published and licensed by Dove Medical Press Limited. The full terms of this license are available at https://www.dovepress.com/terms.php and incorporate the Creative Commons Attribution - Non Commercial (unported, v3.0) License.
By accessing the work you hereby accept the Terms. Non-commercial uses of the work are permitted without any further permission from Dove Medical Press Limited, provided the work is properly attributed. For permission for commercial use of this work, please see paragraphs 4.2 and 5 of our Terms.