")
Back to Journals » OncoTargets and Therapy » Volume 7
Tumor heterogeneity in the recurrence of epithelial ovarian cancer demonstrated by polycomb group proteins
Authors Gui T, Bai H, Zeng J, Zhong Z, Cao D, Cui Q, Chen J, Yang J, Shen K
Received 11 May 2014
Accepted for publication 12 July 2014
Published 25 September 2014 Volume 2014:7 Pages 1705—1716
DOI https://doi.org/10.2147/OTT.S67570
Checked for plagiarism Yes
Review by Single anonymous peer review
Peer reviewer comments 4
Ting Gui,1,* Huimin Bai,1,* Jianfang Zeng,1 Zhaoji Zhong,1 Dongyan Cao,1 Quancai Cui,2 Jie Chen,2 Jiaxin Yang,1 Keng Shen1
1Department of Obstetrics and Gynecology, 2Department of Pathology, Peking Union Medical College Hospital, Peking Union Medical College, Chinese Academy of Medical Sciences, Beijing, People's Republic of China
*These authors contributed equally to this work
Purpose: To investigate tumor heterogeneity in the recurrence of epithelial ovarian cancer demonstrated by polycomb group (PcG) proteins.
Methods: Tissue microarrays containing matched primary and recurrent ovarian tumors from the same patients were constructed for detection of PcG protein expression. Survival analyses of clinicopathological parameters and expression of PcG proteins were performed on progression-free survival (PFS) and overall survival (OS) of patients. Genetic and epigenetic heterogeneity was explored in aspects of gene copy number and microRNA (miRNA) profiling.
Results: PcG proteins were heterogeneously expressed in primary versus recurrent tumors (P<0.05). In univariate survival analysis of the ovarian carcinoma cohorts, a significant association of intensive expression of BMI1 and EZH2 in first-onset lymph node metastases with shortened PFS was demonstrated (P=0.010, P=0.019); and a significant association of intensive expression of BMI1 and EZH2 in recurrent tumors with shortened OS was demonstrated (P=0.042, P=0.047). Importantly, BMI1 and EZH2 expression provided significant independent prognostic parameters in multivariate analyses (P<0.05). Gene amplification did not always coincide with PcG protein expression. Eight miRNAs were found to be downregulated in recurrent tumors, among which miR-298 might indirectly regulate the expression of EZH2 through transcription factor ILF3.
Conclusion: Tumor heterogeneity exists in the recurrence of epithelial ovarian cancer, manifested by PcG protein expression and underlying genetic and epigenetic alterations. Intensive expression of BMI1 and EZH2 are predictors of earlier relapse and shorter OS, independent of grade and chemotherapy sensitivity. EZH2 and miR-298 have great potential to be new targets for treatment of recurrent ovarian cancer.
Keywords: PcG protein, miRNA
Introduction
Ovarian cancer is the leading cause of death due to gynecological malignancies all over the world. Serous ovarian cancer represents the most common histology and is responsible for the majority of advanced-stage cases.1 Most women with advanced ovarian cancers recur and ultimately succumb to their diseases. Treatment failure has often been attributed to chemoresistance. However, emerging evidence indicates an important role of tumor heterogeneity.2 Each case of tumor is thought to originate from a single progenitor cell.3 As tumors develop, they undergo an evolutionary departure from a monoclonal state to a state consisting of multiple subclones.4 Subpopulations of tumor cells present with significant discrepancies in morphology, protein expression, biological functions, and genetic characteristics. Cells that acquire advantageous mutations have stronger survival ability under selective pressure and become the origin of tumor relapse.
Polycomb group (PcG) proteins are key regulators of cell-fate decisions, essential for the normal development of organisms, by working as transcriptional repressors of several thousand genes controlling differentiation pathways during development.5 A large number of clinical studies have also provided evidence that some PcG proteins are abnormally expressed in many cancers, and play a role in cancer invasion, metastasis, and progression, and thus can be viewed as molecular markers or prognostic indicators through silencing some tumor suppressor genes, correlating with noncoding RNA in oncogenesis, or regulating the stem cells.6
So far, investigations concerning tumor heterogeneity in the recurrence of ovarian cancer have been sparse. Our objectives in this study are therefore threefold: 1) to determine the expression pattern of PcG proteins in ovarian cancer recurrence, 2) to analyze the prognostic significance and clinical outcome of PcG proteins, and 3) to explore the underlying genetic and epigenetic alterations. Determining the molecular events that control this tumor trait might provide us potential targets for the treatment of ovarian cancer recurrence.
Materials and methods
Patient materials
Between January 2001 and December 2010, 100 patients with advanced ovarian serous cystadenocarcinoma (Féderation Internationale de Gynécologie et d’Obstétrique [FIGO] III–IV) were included in our study. Inclusive criteria were as follows: 1) patients underwent primary and secondary cytoreductive surgery at Peking Union Medical College Hospital (PUMCH), 2) patients did not receive neoadjuvant chemotherapy before surgery, and 3) patients received standard platinum/paclitaxel-based chemotherapy.
Matched formalin-fixed, paraffin-embedded (FFPE) tumor tissues from the same patients were collected from the Department of Pathology at PUMCH, including primary ovarian tumors at presentation (P), abdominal disseminated lesions at presentation (A), lymph nodes metastases at presentation (LN), and tumor lesions at relapse (R). Each sample was diagnosed by two independent pathologists.
Patient information, including age, FIGO stage, histological grade, ascites, CA125 level at presentation, CA125 level at relapse, and chemotherapy courses at complete remission, was collected from clinical database. Progression-free survival (PFS) was calculated from the date of cytoreductive surgery to tumor recurrence. Overall survival (OS) was calculated from the date of diagnosis to patient death or the last follow-up. All investigations were performed in accordance with a protocol approved by the ethics committee at PUMCH.
Tissue microarray construction
Tissue microarrays were constructed according to a method described previously.7 Two tissue cores (diameter 1.0 mm, height 3–4 mm) taken from a donor block were placed in a recipient block using a tissue arraying instrument (MiniCore® Tissue Arrayer; Alphelys, Plaisir, France). Four tissue microarrays were constructed as research models for tumor heterogeneity. Up to December 2012, of the 100 patients included with advanced ovarian cancers, 76 patients had relapse diseases and 24 patients did not. Furthermore, of the 76 patients having relapse diseases, 50 patients had four matched samples (P + A + LN + R) reserved. For the other 26 patients having relapse diseases and the 24 patients having not, only paired primary ovarian tumor tissues and abdominal disseminated lesions at presentation were reserved.
Immunohistochemistry (IHC)
Immunostaining was performed following a protocol described previously.8 Primary and secondary antibodies are listed in Table S1. A negative control was obtained by normal non-immune IgG. Known immunostaining-positive slides were used as positive controls. Positive expression of PcG proteins was defined as presence of yellow-brown granules in nuclei. Staining results were evaluated by a semi-quantitative scoring criterion evaluating both the intensity and proportion of immunopositive cells.9 A staining index was calculated by multiplying the staining intensity (negative =1, primrose yellow =2, yellowish brown =3, or dark brown =4) and the proportion of immunopositive cells (≤10% =1, 10%–50% =2, 50%–75% =3, >75% =4). Points ≤4 were marked as (−), 4–8 as (+), 8–12 as (++), and 12–16 as (+++). For statistical analysis, (−) and (+) were counted as low expression, and (++) and (+++) as intensive expression. Results were assessed by two independent pathologists without knowing the sample information.
Cell culture
Three epithelial ovarian cancer cell lines were investigated. Two cell lines, A2780 and SKOV3, were obtained from Cell Support Center, Institute of Basic Medical Science, Chinese Academy of Medical Sciences. The other one, OVCAR8, was kindly provided by the National Institute of Health, USA. Cells were maintained in RPMI (Roswell Park Memorial Institute)-1640 with 10% fetal bovine serum (Gibco, Gaitherburg, MD, USA) in a humidified atmosphere with 5% CO2 at 37°C.
Fluorescence in situ hybridization (FISH)
The FISH reaction was performed as previously described.10 Deparaffinized sections were treated with proteinase K (400 μg/mL) at 37°C for 30 minutes, denatured in 70% formamide, 2× standard saline citrate (SSC) at 75°C for 6 minutes. About 50 ng of FAM (carboxyfluorescein)-labeled (green) probe, mixed in a 20 μL hybridization mixture (containing 55% formamide, 2× SSC, and 2 μg human Cot-1 DNA®), was denatured at 75°C for 6 minutes and then hybridized to the denatured tissue microarray sections at 37°C for 24 hours. After washing, the slides were counterstained with 1 μg/mL DAPI (4′,6-diamidino-2-phenylindole) in an antifade solution, and examined under a laser scanning confocal microscope (TCS SP5; Leica Microsystems, Wetzlar, Germany). FISH signals in over 300 cells in each specimen were counted. Gene amplification was defined as presence of six or more gene signals in tumor cells.11 The probe sequence for gene BMI1 was 5′-ACG GTA GTA CCC GCT TTT AGG CAT ACA GAT TTA TGG TTG TGG CAT CAA TGA AGT ACC CTC CGG ACA TCA CAA ATA GGA CAA TAC TTG CTG G-3′. The probe sequence for gene EZH2 was 5′-ATG TAC TCT GAT TTT ACA CGC TTC CGC CAA AGC ATT TGG TCC ATC TAT GTT GGG GGT ACA GTG ACT CTA AAC TCA TAC ACC TGT CTA CAT-3′.
MicroRNA (miRNA) microarray expression profiling
Total RNA (≥100 ng) was labeled with miRNA Complete Labeling and Hyb Kit and hybridized on Human miRNA Microarray Kit (Agilent Technologies, Santa Clara, CA, USA), which contains 60,000 probes for 1,205 human miRNAs. Hybridization signals were detected by Microarray Scanner (Agilent Technologies), and the scanned images were analyzed with Feature Extraction (Agilent Technologies) software.
RNA isolation and real-time polymerase chain reaction (PCR)
For FFPE tissues, total RNA including miRNA was collected using AllPrep DNA/RNA FFPE Kit (Qiagen, Valencia, CA, USA).12 miRNA was reversed to cDNA using miRcute miRNA First-Strand cDNA Synthesis Kit (TIANGEN, Beijing, People’s Republic of China). Primers for miR-298 were as follows: forward primer, 5′-ACA CTC AGC TGG GAG CAG AAG CAG GGA G-3′; reverse primer, 5′-GGT GTC GTG GAG TCG-3′. Primers for miR-4261 were as follows: forward primer, 5′-ACA CTC AGC TGG GAG GAA ACA GGG ACC C-3′; reverse primer 5′-GGT GTC GTG GAG TCG-3′. Real-time PCR was performed on an Applied Biosystems 7500 Real-time PCR system (Applied Biosystems, Foster City, CA, USA) with SuperReal Premix Kit and miRcute miRNA qPCR Detection Kit (SYBRGreen) (TIANGEN). The results were analyzed using a comparative method of 2−ΔΔCT.13 Each sample was tested in triplicate.
Luciferase reporter assay
Luciferase reporter vectors were constructed by cloning miR-4261 and miR-298 into pcDNA6.2 vector (Invitrogen; Thermo Fisher Scientific, Waltham, MA, USA), 3′-untranslated region (UTR) of ZNF207 and 3′-UTR of ILF3 into pGL3 vector (Invitrogen), ZNF207 and ILF3 into pcDNA3.1 vector (Invitrogen), and promoter of EZH2 into pGL3 vector (Invitrogen). SKOV3 cells were cotransfected with pcDNA6.2 or pcDNA3.1 vector and pGL3 vector by Lipofectamine 2000. After 48 hours, luciferase assays were performed using the dual luciferase reporter assay system (Promega Corporation, Fitchburg, WI, USA). Firefly luciferase activity was normalized to Renilla luciferase activity for each sample. All assays were performed in triplicate.
Statistical analyses
Statistical analyses were performed with SPSS 19.0 software. Student’s t-test and Wilcoxon signed rank test were used to compare the differences between two independent samples and paired samples from the same patients. Kaplan–Meier analysis and Cox model were used to study the risk factors of PFS and OS. P<0.05 was considered significant statistically.
Results
Tumor heterogeneity demonstrated by PcG protein expression in the recurrence of ovarian cancer
PcG protein expression in different tumor tissues
PcG protein family mainly includes 12 members, EZH2, EED, SUZ12, BMI1, MEL18, RING1, RING2, CBX2, CBX4, PHF1, PHC1, and RYBP. IHC staining indicated that seven proteins (BMI1, EZH2, CBX2, CBX4, PHF1, RING1, and RING2) had significantly higher expression levels in recurrent tumors than primary ovarian tumors at presentation (P<0.05) (Table 1 and Figure 1). Furthermore, three proteins, BMI1, EZH2, and RING2, showed significantly elevated expression levels in lymph node metastases at presentation than in primary ovarian tumors (P<0.05) (Table 1). However, no significant differences were observed in 12 PcG protein expression in primary ovarian tumor tissues versus abdominal disseminated lesions at presentation (Table 1).
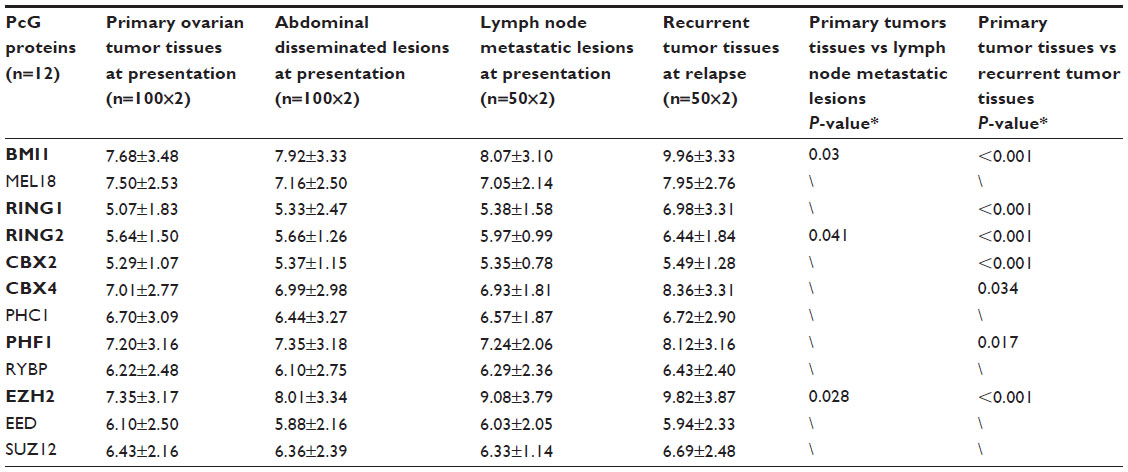 | Table 1 Staining index for 12 PcG proteins in four groups of ovarian tumor tissues |
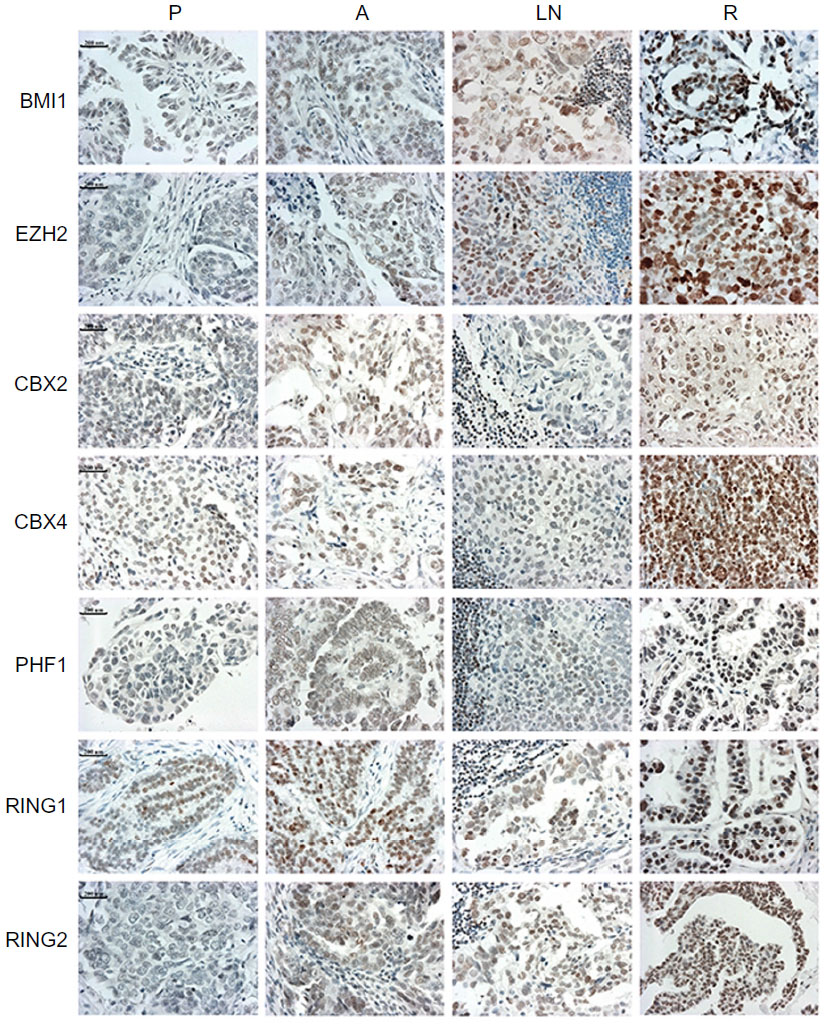 | Figure 1 Immunohistochemical staining of seven polycomb group proteins in matched specimens from the same patients with ovarian serous cystadenocarcinoma. Increased staining could be observed in recurrent tumors. |
Relationship between clinicopathological variables, PcG protein expression, and recurrence and survival of ovarian cancer patients
In univariate survival analysis, to confirm the representativeness of the ovarian carcinomas in our study, we analyzed established prognostic predictors of patient prognosis. Kaplan–Meier analysis demonstrated a significant impact of FIGO stage and histological grade on PFS before recurrence (P=0.024, P=0.010), and FIGO stage, histological grade, and chemotherapy sensitivity on OS (P=0.016, P=0.002, P<0.001) (Table S2). Patients with tumors having intensive expression of BMI1 and EZH2 in lymph node metastases at presentation had earlier relapse (P=0.01, P=0.019) (Table S3). Patients with tumors having intensive expression of BMI1, EZH2, and PHF1 in recurrent tumor tissues had shorter OS (P=0.042, P=0.047, and P=0.010) (Table S3).
The following multivariate analysis demonstrated that intensive expression of BMI1 and EZH2 in lymph node metastases were prognostic factors of early recurrence, independent of histological grade, and intensive expression of BMI1, EZH2, and PHF1 in recurrent lesions were predictors of poor OS, independent of histological grade and chemotherapy sensitivity (Table 2).
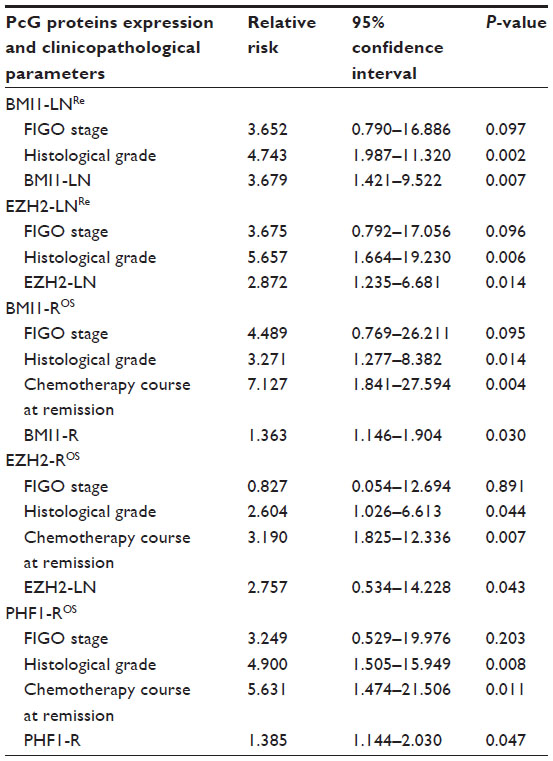 | Table 2 Multivariate analysis of clinicopathological parameters and PcG proteins expression on patients with ovarian serous cystadenocarcinoma |
Tumor heterogeneity in genetic and epigenetic features associated with heterogeneous expression of PcG proteins
Amplification of PcG genes BMI1 and EZH2 in recurrent ovarian tumors
FISH was performed in tissue microarray sections containing 50 pairs of primary and recurrent ovarian tumor tissues to determine whether the upregulation of PcG protein expression was correlated with gene copy number increment. The results demonstrated that fluorescence signals were informative in 30 (30/50, 60%, BMI1) or 36 (36/50, 72%, EZH2) pairs of specimens, among which 21 (21/30, 70%, BMI1) and 27 (27/36, 75%, EZH2) recurrent tumor tissues had intensive protein expression. Only six (6/30, 20%, BMI1) and eight (8/36, 22%, EZH2) pairs of samples showed gene amplification and protein expression upregulation in recurrent lesions simultaneously (Figure 2). Amplification of BMI1 or EZH2 was not observed in the other 15 (15/30, 50%, BMI1) or 19 (19/36, 53%, EZH2) recurrent tumors.
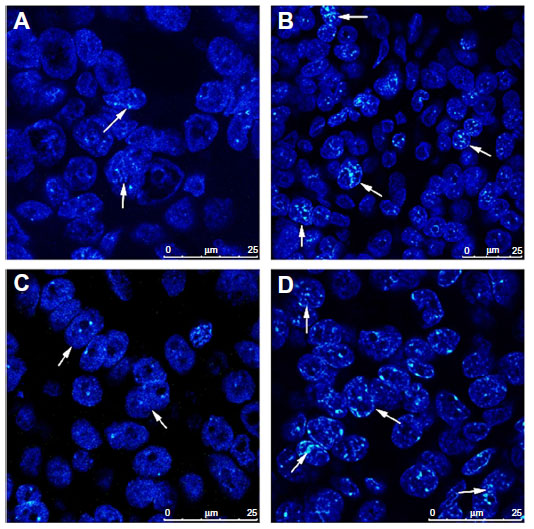 | Figure 2 Genetic heterogeneity underlying the heterogeneous expression of polycomb group proteins. Amplification of BMI1 and EZH2 was observed by fluorescence in situ hybridization in recurrent tumor tissues, with intensive expression of proteins detected by immunohistochemistry simultaneously. (A) BMI1 signals in primary tumors. (B) BMI1 signals in recurrent tumors. (C) EZH2 signals in primary tumors. (D) EZH2 signals in recurrent tumors. |
miRNA microarray expression profiling in paired primary and recurrent ovarian tumor tissues
Since gene amplification could only explain the heterogeneous expression of PcG proteins in some cases of ovarian cancer recurrence, we then performed miRNA microarray expression profiling in six pairs of primary and recurrent ovarian cancer tissues. Eight miRNAs were identified downregulated in recurrent lesions compared with primary tumors (more than a twofold change, P<0.05) (Figure 3A).
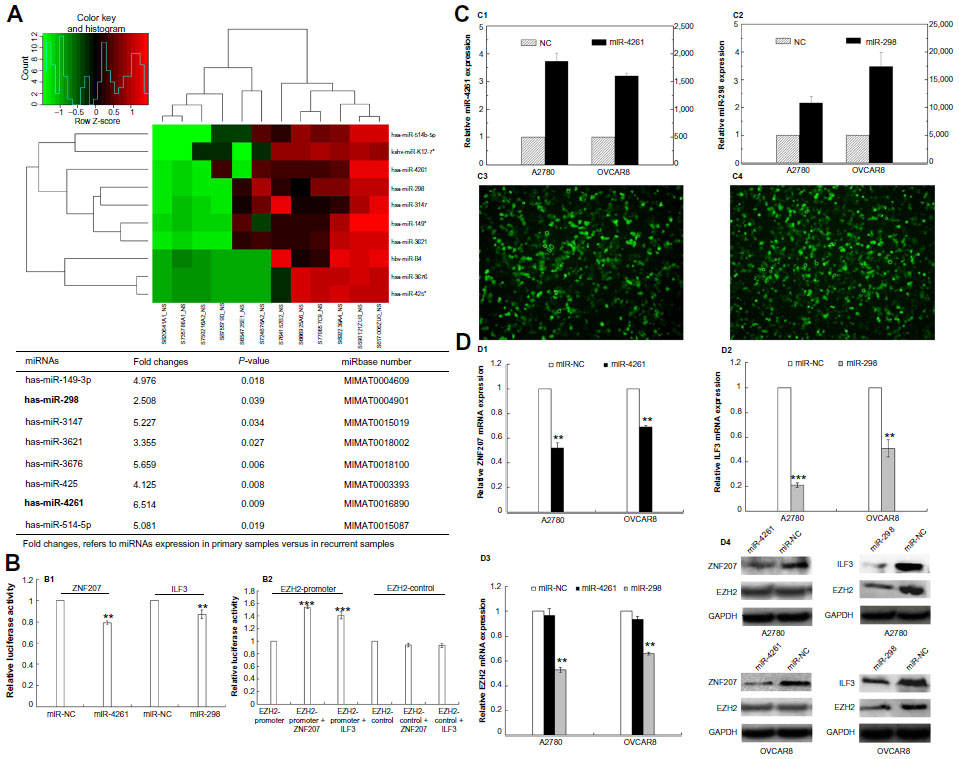 | Figure 3 Epigenetic heterogeneity underlying the heterogeneous expression of polycomb group proteins. |
Through Target Scan Software and Transfact Database, we found two transcription factors for the PcG core gene EZH2; ZNF207 and ILF3 were also the targets of miR-4261 and miR-298, respectively. To further confirm the reliability of miRNA microarray, we performed real-time PCR in 36 pairs of primary and recurrent ovarian tumors, results indicating that miR-4261 and miR-298 indeed were downregulated in the recurrent lesions (P=0.024, P=0.03) (Table S4).
Luciferase reporter assays were then performed, and the results showed that miR-4261 and miR-298 significantly suppressed the luciferase activity of ZNF207 and ILF3 (P=0.001, P=0.008), and in turn, ZNF207 and ILF3 significantly promoted the luciferase activity of EZH2-promoter reporter plasmid (P=0.000, P=0.000) (Figure 3B). Nevertheless, the luciferase activity of ZNF207 and ILF3 was not affected by miRNA negative control, and the empty-pGL3-EZH2 reporter plasmid was also unaffected by transfection with ILF3/ZNF207.
To further validate whether EZH2 is negatively regulated by miR-4261 and miR-298, we transfected miR-4261 and miR-298 mimics into A2780 and OVCAR8 ovarian cancer cells and examined ZNF207, ILF3, and EZH2 mRNA and protein levels. The transfection efficiency was confirmed by real-time PCR and fluorescence (Figure 3C). miR-4261 and miR-298 upregulation led to a significant reduction of ZNF207 and ILF3, respectively, at mRNA and protein levels in A2780 and OVCAR8 cells (Figure 3D) (for ZNF207, P=0.001 both; for ILF3, P=0.000, P=0.001). However, EZH2 expression was only concomitantly reduced significantly by miR-298 overexpression (Figure 3D) (P=0.001 both).
Discussion
Although accumulating evidence demonstrates tumor heterogeneity in ovarian cancer,14–17 little attention has been focused on the recurrent diseases and the incorporation of tumor heterogeneity into clinical applications, such as prediction of patient prognosis and exploration of potential therapeutic targets.
PcG proteins were originally identified in Drosophila as regulators of HOX (homeotic box) gene during development that antagonizes gene activation by the TrxG (Trithorax group) proteins.18 In mammals, PcG proteins are also implicated in HOX gene suppression, which may contribute to aberrant cellular proliferation and carcinogenesis.19 Studies have shown that abnormal expression of PcG proteins is favorably associated with poor clinical outcome in diverse human cancers. However, to our best knowledge, there is little information about prognostic status of PcG proteins in ovarian cancer recurrence. In our study, seven members of the PcG protein family were upregulated in recurrent lesions, confirming that tumor heterogeneity existed in primary versus recurrent tumors at protein expression level. Through survival analyses, we found that intensive expression of BMI1 and EZH2 were predictors of earlier recurrence and shorter OS, independent of clinical parameters, such as histological grade and chemotherapy sensitivity.
These findings raise an important question of what mechanisms might be involved in the heterogeneous expression of PcG proteins in the recurrent lesions. Genetic/epigenetic heterogeneity is a ubiquitous characteristic of neoplasms, and is fundamental to the process of neoplastic progression.20,21 Gene amplification is a common pathological mechanism of gene overexpression in human cancers. To determine whether the upregulation of BMI1 and EZH2 expression was caused by gene amplification, the status of gene copy number was examined by FISH. In our 30/36 pairs of informative cases by both IHC and FISH simultaneously, intensive expression of BMI1 and EZH2 were detected in about 20% of ovarian cancers that had gene amplification. Our results indicated that genetic heterogeneity indeed existed in primary versus recurrent lesions, but the expression level of PcG proteins did not always coincide with gene amplification, and other mechanisms should be involved in the regulation, such as epigenetic alterations.
Therefore, we next performed miRNA microarray expression profiling in six pairs of primary and recurrent ovarian cancer tissues, and found eight miRNAs downregulated in recurrent lesions. Through Target Scan Software and Transfact Database, we found that miR-4261 and miR-298 had seed match with ZNF207 3′-UTR and ILF3 3′-UTR, and in turn, ZNF207 and ILF3 are transcription factors of EZH2 promoter, suggesting that miR-4261 and miR-298 might indirectly regulate the expression of EZH2 through intermediate factors.
This postulation was then confirmed by subsequent luciferase reporter assay. Our results demonstrated that the activities of luciferase reporters with ZNF207 and ILF3 were significantly inhibited by miR-4261 and miR-298, and in turn, the luciferase activity of EZH2-promoter reporter plasmid was significantly promoted by ZNF207 and ILF3. In addition, transfection of ovarian cancer cells with miR-4261 and miR-298 mimics caused a dramatic decrease in ZNF207 and ILF3 mRNA and protein levels. However, EZH2 expression was only concomitantly reduced significantly by miR-298 overexpression. These findings provide evidence that miR-298 may repress EZH2 expression through intermediate transcription factor ILF3. Our results indicated that epigenetic heterogeneity also played an important role in ovarian cancer recurrence.
Overall, our study has investigated the role of tumor heterogeneity in ovarian cancer recurrence at two levels, expression of PcG proteins, and underlying genetic/epigenetic alterations. One problem posed by tumor heterogeneity is that the initial biopsy and testing results might not be representative for the residual tumor cells after first treatment, and accordingly not suitable as basis for the choice of subsequent treatment. As a result, tumor heterogeneity makes personalized medicine necessary, and identification of relapse-specific lesions may provide potential targets for the treatment.
Conclusion
Tumor heterogeneity exists in the recurrence of ovarian cancer, manifested by PcG protein expression and underlying genetic and epigenetic alterations. Intensive expression of BMI1 and EZH2 are predictors of earlier relapse and shorter OS, independent of histological grade and chemotherapy sensitivity. Genes EZH2 and miR-298 have great potential to be new targets for treatment of recurrent ovarian cancer.
Acknowledgments
This work is supported by National Natural Science Foundation of China (No 81172482) and National High Technology Research and Development Program of China (No 2012AA02A507).
Author contributions
All authors contributed toward data analysis, drafting and revising the paper and agree to be accountable for all aspects of the work.
Disclosure
The authors declare that no conflicts of interest exist.
References
Siegel R, Ma J, Zou Z, Jemal A. Cancer statistics, 2014. CA Cancer J Clin. 2014;64(1):9–29. | |
Gerlinger M, Rowan AJ, Horswell S, et al. Intratumor heterogeneity and branched evolution revealed by multiregion sequencing. N Engl J Med. 2012;366(10):883–892. | |
Nowell PC. The clonal evolution of tumor cell populations. Science. 1976;194(4260):23–28. | |
Durrett R, Foo J, Leder K, Mayberry J, Michor F. Intra-tumor heterogeneity in evolutionary models of tumor progression. Genetics. 2011;188(2):461–477. | |
Morey L, Helin K. Polycomb group protein-mediated repression of transcription. Trends Biochem Sci. 2010;35(6):323–332. | |
Lin YW, Chen HM, Fang JY. Gene silencing by the polycomb group proteins and associated with cancer. Cancer Invest. 2011;29(3):187–195. | |
Xie D, Sham JS, Zeng WF, et al. Heterogeneous expression and association of β-catenin, p16 and c-myc in multistage colorectal tumorigenesis and progression detected by tissue microarray. Int J Cancer. 2003;107(6):896–902. | |
Xie D, Zeng YX, Wang HJ, et al. Expression of cytoplasmic and nuclear Survivin in primary and secondary human glioblastoma. Br J Cancer. 2006;94(1):108–114. | |
Zhang F, Sui L, Xin T. Correlation of Bmi-1 expression and telomerase activity in ovarian cancer tissues. Exp Oncol. 2008;30(1):70–74. | |
Tang TC, Sham JS, Xie D, et al. Identification of a candidate oncogene SEI-1 within a minimal amplified region at 19q13.1 in ovarian cancer cell lines. Cancer Res. 2002;62(24):7157–7161. | |
Yang GF, He WP, Cai MY, et al. Intensive expression of Bmi-1 is a new independent predictor of poor outcome in patients with ovarian carcinoma. BMC Cancer. 2010;10:133. | |
Kotorashvili A, Ramnauth A, Liu C, et al. Effective DNA/RNA co-extraction for analysis of microRNAs, mRNAs, and genomic DNA from formalin-fixed paraffin-embedded specimens. PLoS One. 2012;7(4):e34683. | |
Livak KJ, Schmittgen TD. Analysis of relative gene expression data using real-time quantitative PCR and the 2−ΔΔCT method. Methods. 2001;25(4):402–408. | |
Bashashati A, Ha G, Tone A, et al. Distinct evolutionary trajectories of primary high-grade serous ovarian cancers revealed through spatial mutational profiling. J Pathol. 2013;231(1):21–34. | |
Cancer Genome Atlas Research Network. Integrated genomic analyses of ovarian carcinoma. Nature. 2011;474(7353):609–615. | |
Cooke SL, Ng CK, Melnyk N, et al. Genomic analysis of genetic heterogeneity and evolution in high-grade serous ovarian carcinoma. Oncogene. 2010;29(35):4905–4913. | |
Khalique L, Ayhan A, Weale ME, Jacobs IJ, Ramus SJ, Gayther SA. Genetic intra-tumour heterogeneity in epithelial ovarian cancer and its implications for molecular diagnosis of tumours. J Pathol. 2007;211(3):286–295. | |
Schuettengruber B, Chourrout D, Vervoort M, Leblanc B, Cavalli G. Genome regulation by polycomb and trithorax proteins. Cell. 2007;128(4):735–745. | |
Hodgson JW, Brock HW. Are polycomb group bodies gene silencing factories? Cell. 2011;144(2):170–171. | |
Merlo LM, Pepper JW, Reid BJ, Maley CC. Cancer as an evolutionary and ecological process. Nat Rev Cancer. 2006;6(12):924–935. | |
Hanahan D, Weinberg RA. The hallmarks of cancer. Cell. 2000;100(1):57–70. |
Supplementary materials
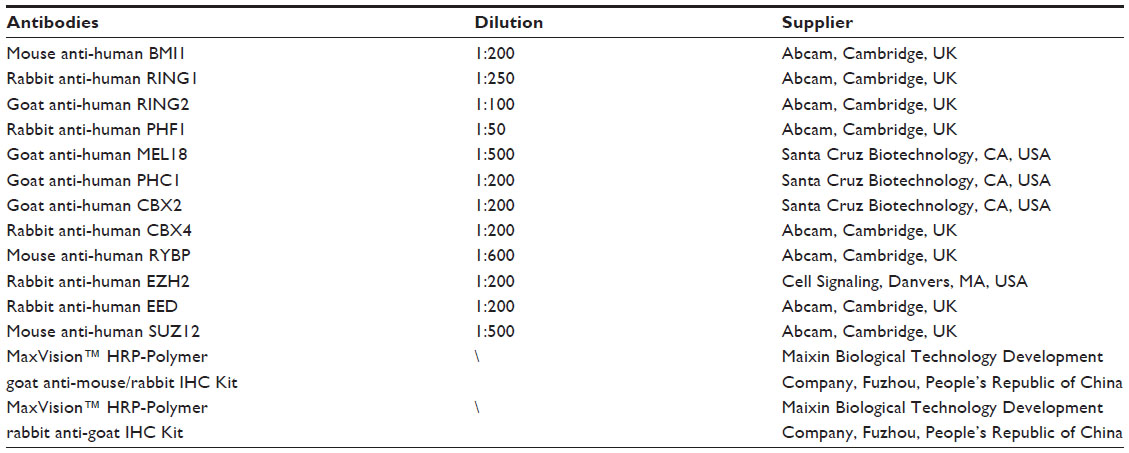 | Table S1 Details of primary and secondary antibodies used for immunohistochemical staining |
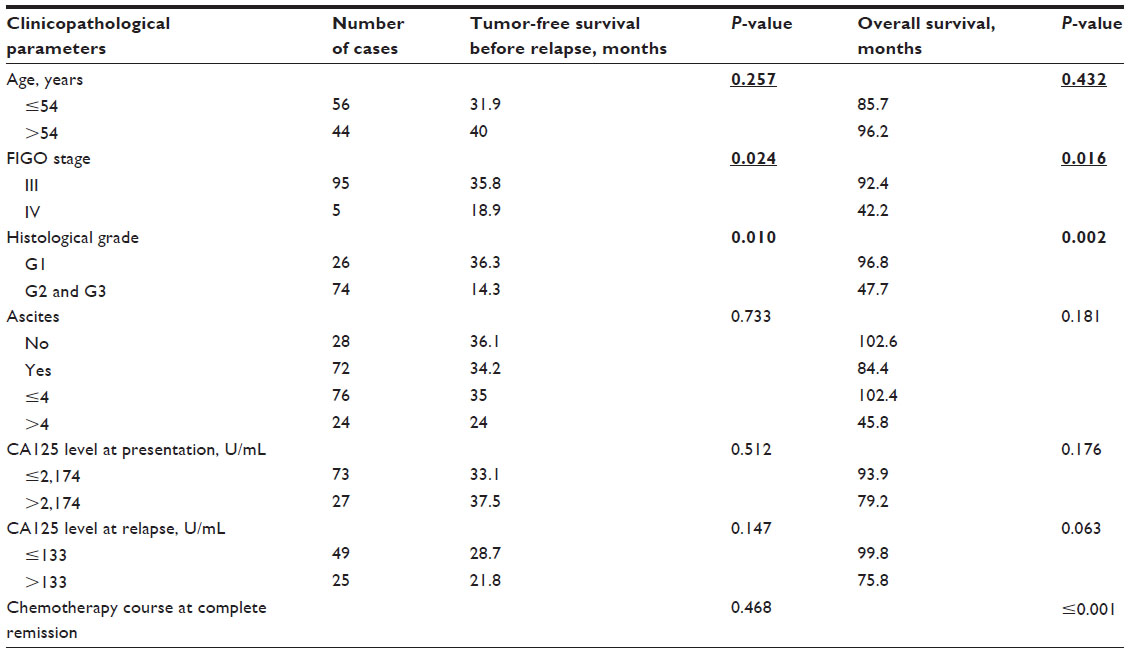 | Table S2 Univariate analysis of clinicopathological parameters on prognosis of patients with ovarian serous cystadenocarcinoma (log-rank test) |
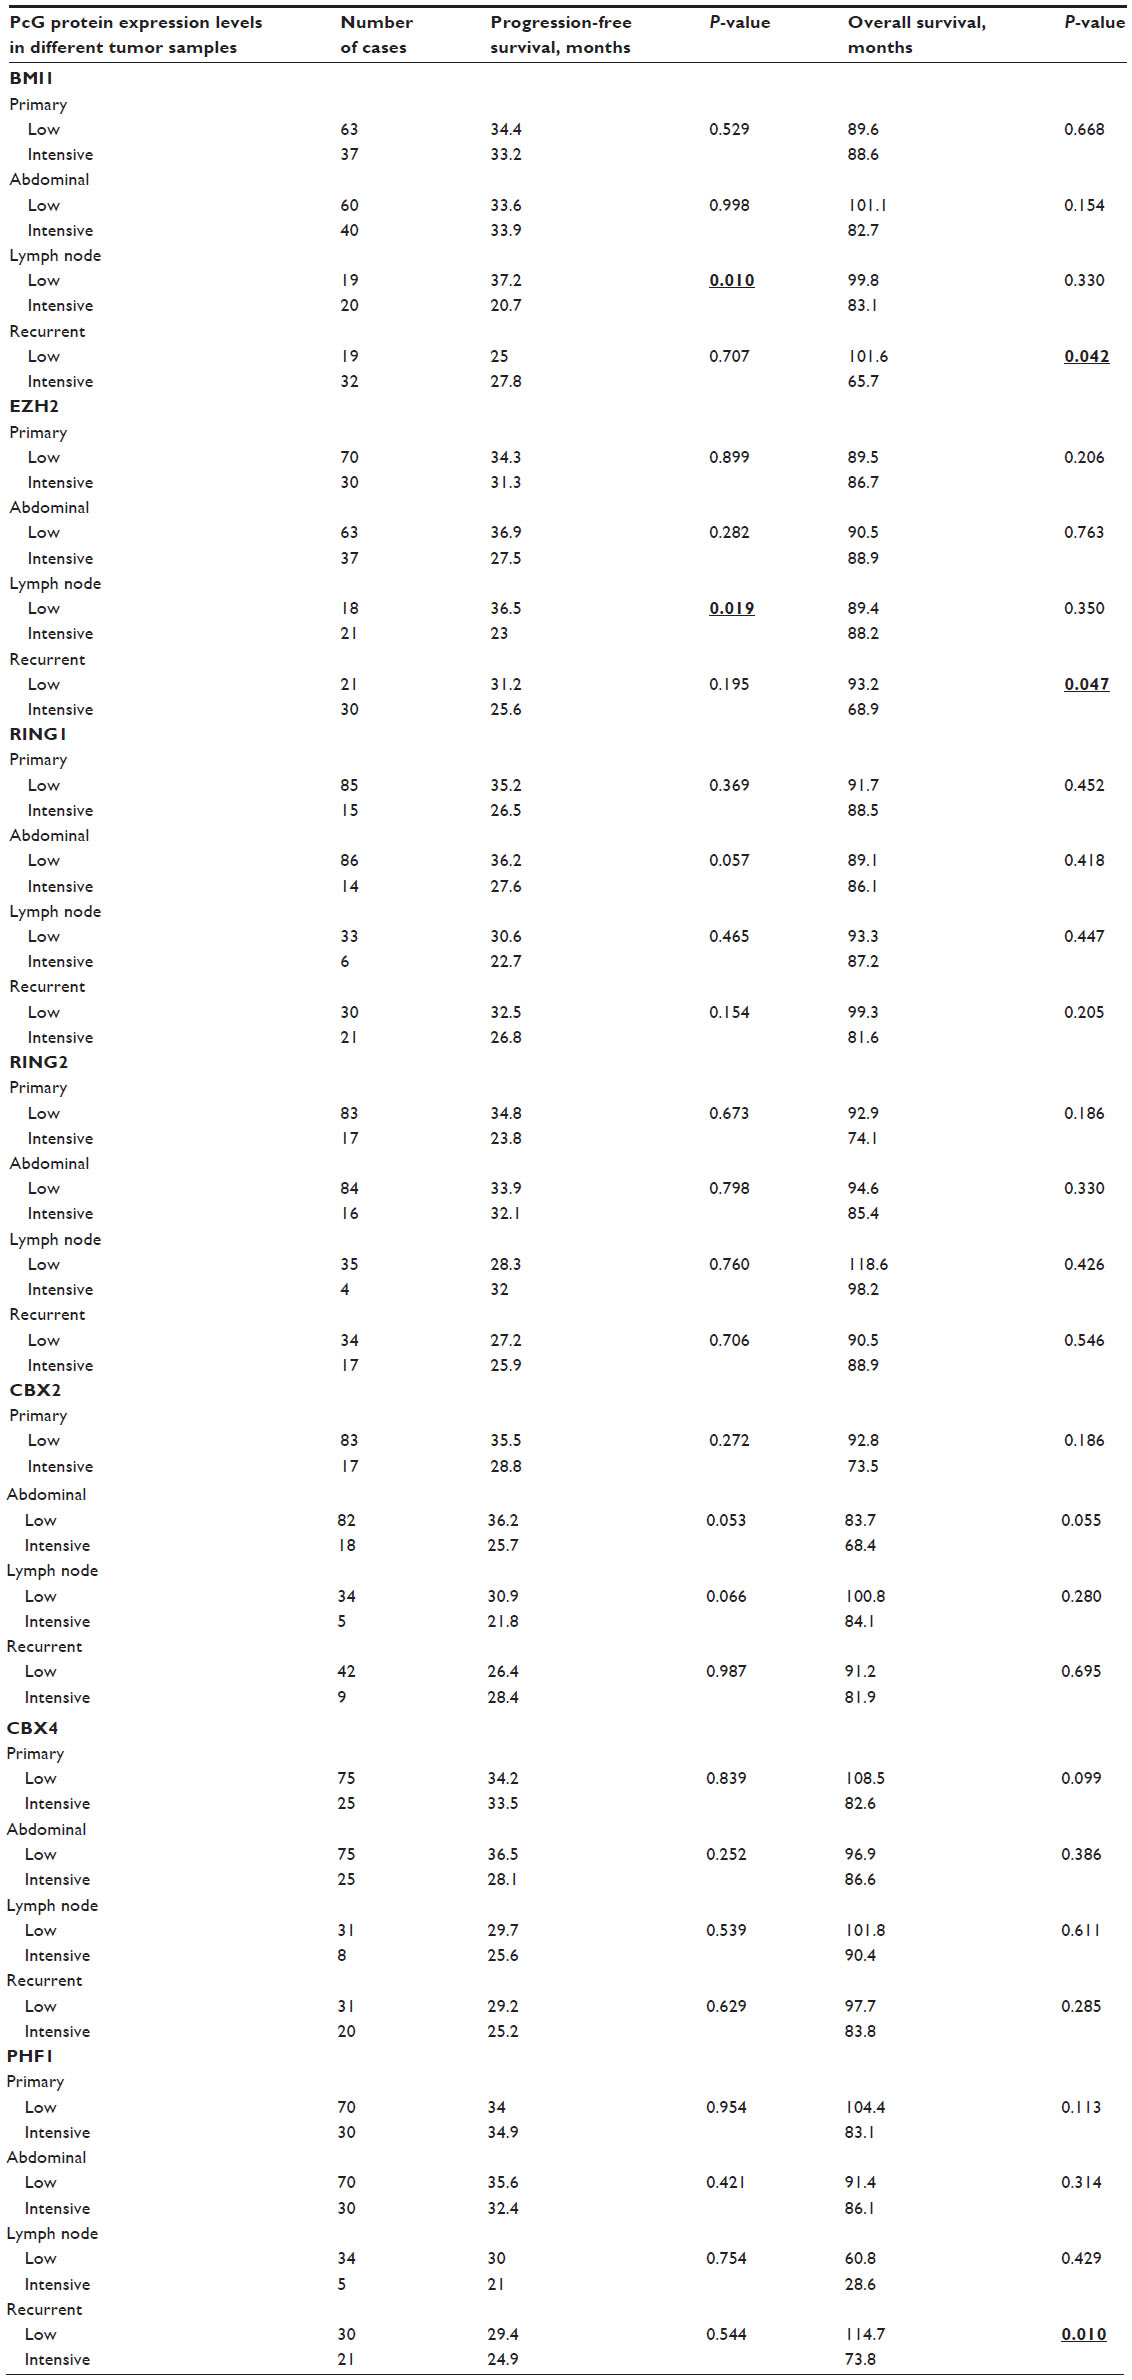 | Table S3 Univariate analysis of PcG protein expression on prognosis of patients with ovarian serous cystadenocarcinoma (log-rank test) |
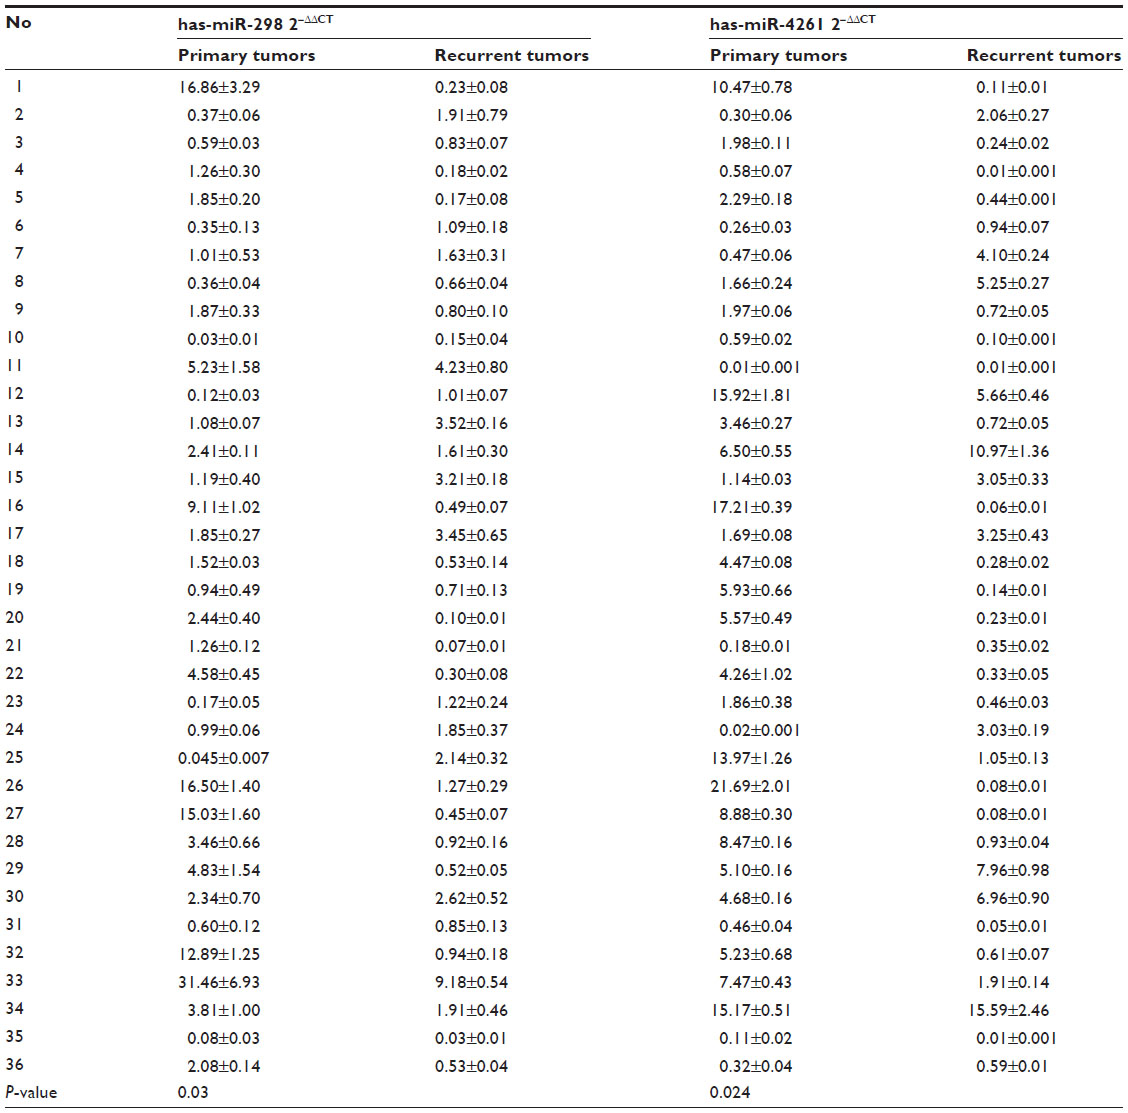 | Table S4 Validation of miR-298 and miR-4261 downregulation in 36 pairs of primary and recurrent ovarian cancer tissues |
 © 2014 The Author(s). This work is published and licensed by Dove Medical Press Limited. The full terms of this license are available at https://www.dovepress.com/terms.php and incorporate the Creative Commons Attribution - Non Commercial (unported, v3.0) License.
By accessing the work you hereby accept the Terms. Non-commercial uses of the work are permitted without any further permission from Dove Medical Press Limited, provided the work is properly attributed. For permission for commercial use of this work, please see paragraphs 4.2 and 5 of our Terms.
© 2014 The Author(s). This work is published and licensed by Dove Medical Press Limited. The full terms of this license are available at https://www.dovepress.com/terms.php and incorporate the Creative Commons Attribution - Non Commercial (unported, v3.0) License.
By accessing the work you hereby accept the Terms. Non-commercial uses of the work are permitted without any further permission from Dove Medical Press Limited, provided the work is properly attributed. For permission for commercial use of this work, please see paragraphs 4.2 and 5 of our Terms.