")
Back to Journals » Risk Management and Healthcare Policy » Volume 13
Triglycerides and Total Cholesterol Concentrations in Association with Hyperuricemia in Chinese Adults in Qingdao, China
Authors Cui N, Cui J, Sun J, Xu X, Aslam B, Bai L, Li D, Wu D, Ma Z, Gu H, Baloch Z
Received 22 December 2019
Accepted for publication 13 February 2020
Published 2 March 2020 Volume 2020:13 Pages 165—173
DOI https://doi.org/10.2147/RMHP.S243381
Checked for plagiarism Yes
Review by Single anonymous peer review
Peer reviewer comments 2
Editor who approved publication: Professor Marco Carotenuto
Nan Cui,1 Jing Cui,2 Jianping Sun,2 Xinping Xu,1 Bilal Aslam,3,4 Lan Bai,1 Decheng Li,1 Di Wu,1 Zhongren Ma,3 Hai Gu,1 Zulqarnain Baloch3
1Research Center for Health Policy and Management, Nanjing University, Nanjing, People’s Republic of China; 2Qingdao Centers for Disease Control and Prevention, Qingdao Institute for Preventive Medicine, Qingdao, People’s Republic of China; 3Biomedical Research Center, Northwest Minzu University, Lanzhou 730030, People’s Republic of China; 4Department of Microbiology, Government College University Faisalabad, Faisalabad, Punjab, Pakistan
Correspondence: Hai Gu
Research Center for Health Policy and Management, Nanjing University, 101 Longmian Avenue, Jiangning District, Nanjing 210093, People’s Republic of China
Tel/Fax +8613687616923
Email [email protected]
Zulqarnain Baloch
Biomedical Research Center, Northwest Minzu University, Minying Road, Lanzhou 730030, People’s Republic of China
Tel +86-18344564625
Email [email protected]
Objective: To assess the association between triglycerides (TG), total cholesterol (TC) and hyperuricemia (HUA) in the general Chinese population.
Methods: A population-based cross-sectional survey included 9680 participants aged 35– 74 years in 2006 and 2009 in Qingdao, China. TG, TC and uric acid (UA) were measured. The logistic regression model was performed to estimate the association between TG, TC, and HUA with an odds ratio (OR) and 95% confidence intervals (CI). Meanwhile, age stratification analysis (< 55 years group and ≥ 55 years group) was performed to evaluate whether age potentially affects the association between TG, TC and HUA using multivariable logistic regression.
Results: Higher TG and TC showed significantly increased HUA prevalence in both men and women (Ptrend all < 0.05). Multivariate logistic regression indicated that borderline high TG (OR: 1.68, 95% CI: 1.31, 2.15 and HTG (OR: 2.98, 95% CI: 2.39, 3.72) indicated increased risk for HUA in men, and borderline high TG (OR: 2.09; 95% CI: 1.68,2.62); HTG (OR: 3.62; 95% CI: 2.90,4.51), borderline high TC (OR: 2.09, 95% CI: 1.68, 2.62) and HTC (OR: 3.62, 95% CI: 2.90, 4.51) showed significant association with HUA in women after adjusted age, school years, marital status, geographic division, personal monthly income, BMI and HDL-C. Age stratification analyses demonstrated that the association between TG and HUA was stronger in males aged ≥ 55 years and female aged < 55 years, and the association between TC and HUA was stronger in both gender aged < 55 years.
Conclusion: This large cross-sectional study focusing on the association between single indictor of blood lipid as exposure and HUA as outcome on the east coast of China for the first time. From a sample of Chinese adults, this study demonstrated that elevated TG in men and women and TC in women were associated with increased HUA prevalence.
Keywords: triglycerides, total cholesterol, hyperuricemia, Qingdao, Chinese population
Introduction
Hyperuricemia (HUA), purine metabolic dysfunctions, is induced by excessive uric acid (UA) which is the final purine breakdown product in humans.1–3 Classically, HUA is related to nonmodifiable risk factors, such as gender, age, and genetics, and modifiable risk factors, such as dietary factors and lifestyle.4–7 HUA is a precursor and one of the main risk factors for gout, and maybe develop all sorts of complications, such as gouty arthritis,8,9 metabolic syndromes,10–13 diabetes,10,14 and acute and chronic kidney disease.15–17 Those complications affect the life quality of patients and make difficulties to manage HUA.18 The epidemic of HUA has become the biggest challenge for humans and a major health problem worldwide. The National Health and Nutrition Examination Survey (NHANES) from 2007–08 to 2015–16 showed that HUA was seen in 14.6% of the US population aged over 20 years and was much more common in men (24.7%) compared with women (5.2%).19 In mainland China, a meta-analysis involving 17,476 subjected reported that the prevalence of HUA was 13.3% in all individuals, 19.4% in men and 7.9% in women from 2000 to 2014.20
Recent researches recognized that the onset of HUA associated with dyslipidemia, which was the elevation of serum triglycerides (TG), total cholesterol (TC), or both.21–25 Though it is well known that HUA is closely associated with dyslipidemia,13 there are debate data about the role of TG, TC in promoting HUA. The Third NHANES (NHANES III) of 14,130 subjects aged 20 years or older revealed that TG and TC were strongly associated with serum UA in the US population according to linear regression modeling.23 A cross-sectional study among 3093 subjects aged 18–85 years reported that high TG and TC were positive associations with HUA in men, but not in women in Ganzi Tibetan Autonomous Prefecture, Sichuan, China.24 In Suzhou, China, a community-based cross-sectional study among 9580 subjects aged over 45 years showed that higher TG and TC were significantly associated with HUA in men, but only higher TG was significantly associated with HUA, and not higher TC in women.25 The association between TG, TC and HUA was complicated and not adequately appreciated worldwide. Simultaneously, there are few large epidemiological studies about dyslipidemia and HUA on the east coast of China. Therefore, it is very important to obtain more epidemiological data on TG, TC and HUA to improve these controversies and health problem this area. The objective of this study was to investigate the association between TG, TC and HUA using a community-based health promotion program, which represents a well-designed population-based study with a large sample size of adult aged 35–74 years in eastern coastal China.
Methods
Ethical Statement
The protocol used in this study was in accordance with the Declaration of Helsinki and was approved by the Ethics Committee at Qingdao Centers for Disease Control and Prevention/Qingdao Institute for Preventive Medicine, Qingdao China. Written consent was individually obtained from each participant.
Study Design
This cross-sectional study (2006 survey and 2009 survey) is from a community-based health promotion program and targeted the population at three rural districts (Huangdao, Jiaonan, and Jimo) and three urban districts (Shinan, Shibei, and Sifang) of Qingdao, China. A total of 12,100 individuals (6100 individuals in 2006 and 6000 individuals in 2009), aged 35–74 years and living at least 5 years in Qingdao, were selected according to a stratified, random, cluster sampling method in 2006 and 2009. In the cross-sectional survey, 1635 individuals (745 individuals in 2006 and 890 individuals in 2009) did not arrive at the survey field with or without various reasons, such as not contacting, ill or deceased. Finally, 10,465 individuals (5355 individuals in 2006 and 5110 individuals) were enrolled from this cross-sectional study with a response rate of 87.8% in 2006 and 85.2% in 2009, respectively. TG, TC, and UA were measured in this cross-sectional survey (Figure 1).
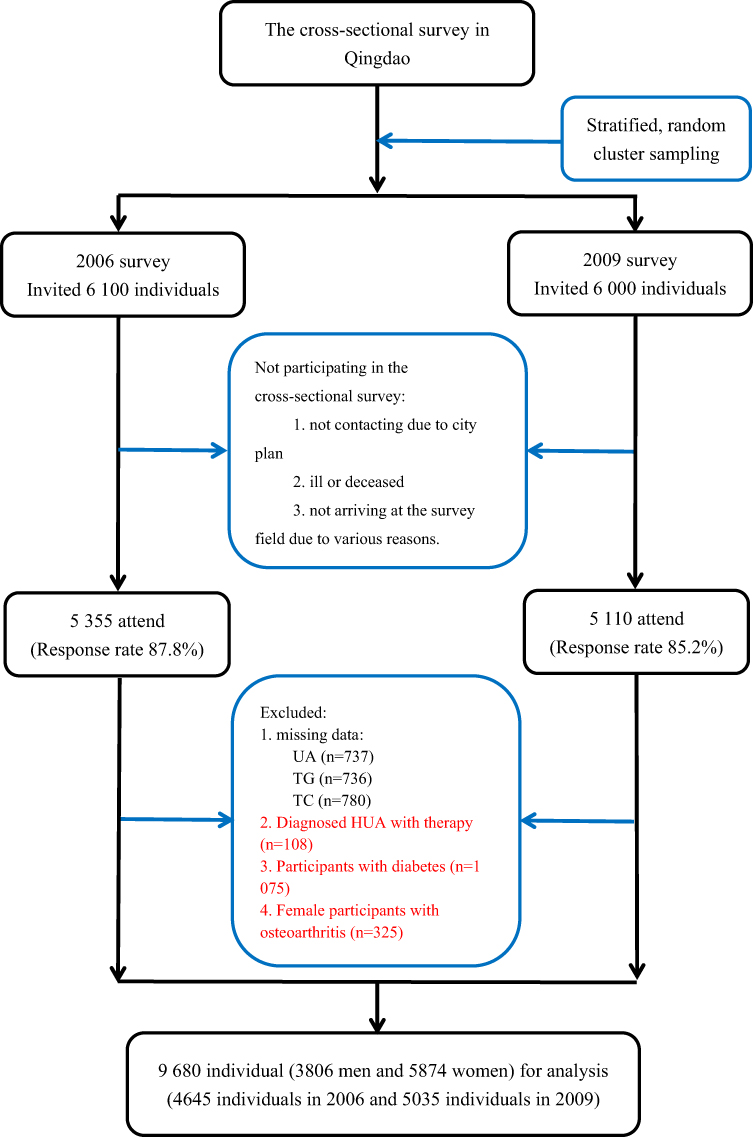 |
Figure 1 Flow chart of participant included and excluded in cross-sectional analysis. Abbreviations: UA, uric acid; TG, triglycerides; TC, total cholesterol. |
Study Population
The flow chart of the participant included and excluded in this cross-sectional survey is shown in Figure 1. The participants were excluded from the cross-sectional survey: 737 participants without UA, 736 participants without TG, and 780 participants without TC, 108 diagnosed HUA participants with therapy, 1075 participants with diabetes, and 325 female participants with osteoarthritis. Finally, 9680 participants (4645 participants in 2006 and 5035 participants in 2009) were included in the final cross-sectional analysis.
Ethical Approval and Statement
Ethical approval of this study was formally reviewed and approved by the ethics committee and institutional review board of Qingdao Municipal Center for Disease Control and Prevention in 2008, and the number was Document No.1. The informed consents were voluntarily signed by all the participant, and the privacy, anonymity, and security of participants were rigorously respected in this cross-sectional survey.
Data Collection
The standardized questionnaire was assessed by trained doctors or nurses through a face-to-face interview. The information on the questionnaire was collected: demographic characters (gender, age, marital status, family history of diabetes), socioeconomic information (educational attainment, personal monthly income) and lifestyle factors (smoking status, alcohol-drinking status). The marital status was divided into married (married or cohabiting) and unmarried (single, divorced, or widowed). The family history of diabetes was defined as having at least one first-degree family member (including parents, siblings and/or offspring) diagnosed as diabetes, without regarding the types of diabetes. Educational attainment was divided into two categories: school years ≤9 years (illiteracy, elementary school, junior high school) and >9 years (senior high school, college). The personal monthly income was categorized into three categories: ≤599 Chinese Yuan (CNY), 600-1999 CNY, and ≥2000 CNY. Smoking status was dichotomized as current smoking and nonsmoking. Current drinking was classified using a dichotomous categorical variable as current drinking and non-drinking.
The measures of body weight and height were collected for the participants. Bodyweight was measured in light clothes and barefoot adopting proofread digital scales accurate to the nearest 0.5 kg. Height was measured with barefoot adopting proofread height gauge accurate to the nearest 0.1 cms. The body mass index (BMI) was calculated according to the formula: BMI (kg/m2)=weight (kg)/height2 (m2).
Blood samples were collected after fasting 8–12 overweight in 2006 survey and 2009 survey. Blood samples to measure UA, TG, TC and high-density lipoprotein-cholesterol (HDL-C) were centrifuged and then transported to the central laboratory for analysis in the cold chain. The measure of UA, TG, TC and HDL-C was used enzymatic methods with Olympus automatic biochemical analyzer.
Outcome Definitions
The classification of UA levels was made according to the Chinese Multidisciplinary Expert Consensus on the Diagnosis and Treatment of HUA and Related Diseases.26 HUA was defined by the UA level >420μmol/L in men and >350μmol/L in females. The classification of TG and TC was detected according to the Guidelines on the prevention and treatment of blood lipid abnormality in Chinese adults.27 The level of TG was defined as normal TG (serum TG <150 mg/dl), borderline high TG (BHTG) (150 mg/dl ≤ TG <200 mg/dl), and hypertriglyceridemia (HTG) (TG ≥200 mg/dl). The level of TC was defined as normal TC (TC <200 mg/dl), borderline high TC (BHTC) (200 mg/dl ≤ TC <240 mg/dl), and hypercholesterolemia (HTC) (TC ≥240 mg/dl).
Statistical Analysis
The continuous variables with normal distribution, continuous variables with abnormal distribution and categorical variables of baseline characteristics were summarized as means ± standard deviation (SD), mean [95% confidence intervals (CI)] and number (percentage) in participants, respectively. T-test for continuous variables with normal distribution, Mann–Whitney U-test for continuous variables with abnormal distribution and Chi-squared test for categorical variables were used to compare the difference between men and women. The logistic regression model was performed to estimate the association between TG, TC, and HUA with an odds ratio (OR) and 95% confidence intervals (CI). Meanwhile, age stratification analysis (<55 years group and ≥55 years group) was performed to evaluate whether age potentially affects the association between TG, TC and HUA using multivariable logistic regression. All the data analyses were done with SPSS (version 20.0), and the statistical significance was at P <0.05.
Results
The baseline characteristics of the participants are shown in Table 1. A total of 9680 individuals participated, and the women proportion was up to 60.7%. Simultaneously, the women had younger age, less school years, less personal monthly income, a lower percentage of rural living, smoker, alcohol-drinker, and the higher mean of BMI and HDL-C, lower mean of TG and UA compared with men (P all <0.05). A total of 756 men (19.9%) and 683 women (11.6%) were diagnosed with HUA in this cross-sectional survey. The baseline characteristics of the participants with different UA levels are listed in Supplementary Table 1. The participants with HUA had older, more school years, higher personal monthly income, a lower percentage of rural living, a higher percentage of smoker and alcohol-drinker, the higher mean BMI, TG, and TC, and lower mean of HDL-C compared with the participant with normal UA.
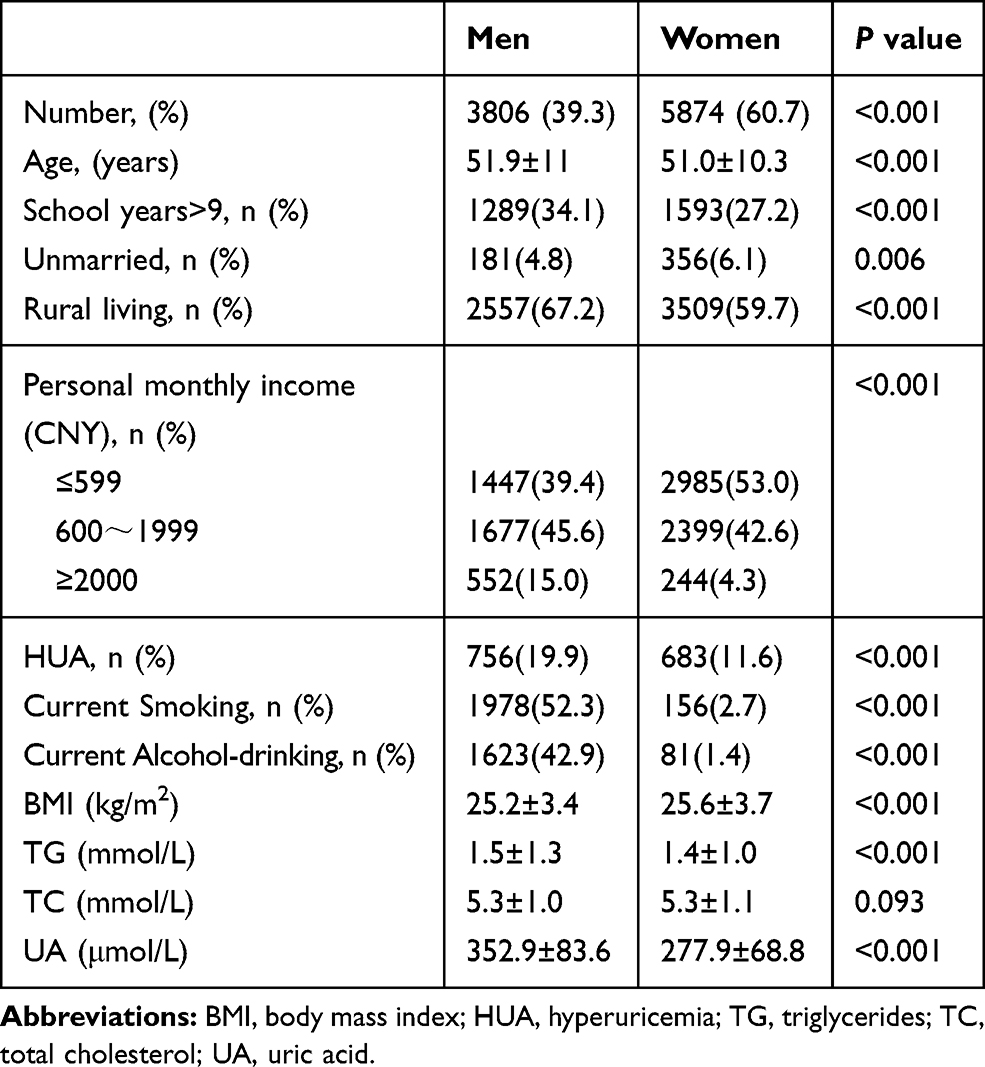 |
Table 1 Baseline Characteristics of the Participants |
Table 2 shows higher TG [borderline high TG (OR: 2.06; 95% CI: 1.64, 2.60), HTG (OR: 3.95; 95% CI; 3.23, 4.84)], higher TC [HTC (OR: 1.33; 95% CI: 1.07, 1.65)], more school years (OR: 1.81; 95% CI: 1.53, 2.13), higher personal monthly income [600~1999 CNY/month (OR: 1.45; 95% CI: 1.21,1.75); ≥2000 CNY/month (OR: 2.16; 95% CI: 1.71, 2.73)], current alcohol-drinking (OR: 1.31; 95% CI: 1.12, 1.54) and higher BMI (OR: 1.16; 95% CI: 1.13, 1.19) was found significantly associated with increased risk of HUA prevalence, however, higher age (OR: 0.99; 955CI: 0.98, 0.99), longer rural living (OR: 0.64; 95% CI: 0.55, 0.76), current smoking (OR: 0.70; 95% CI: 0.60, 0.82) and higher HDL-C (OR: 0.72; 95% CI: 0.60, 0.88) were significantly associated with decreased risk of HUA prevalence in men. Higher TG [borderline high TG (OR: 2.75; 95% CI: 2.23, 3.39); HTG (OR: 4.80; 95% CI: 3.91,5.89)], higher TC [borderline high TC (OR: 1.76; 95% CI: 1.45,2.12); HTC (OR: 2.75; 95% CI: 2.24, 3.37)], higher age (OR: 1.05; 95% CI: 1.04, 1.05), unmarried (OR: 1.53; 95% CI: 1.14, 2.05)), median personal monthly income [600~1999 CNY/month (OR: 1.23; 95% CI: 1.04, 1.45)] and higher BMI (OR: 1.12; 955CI: 1.10,1.15) were significantly associated with increased risk of HUA prevalence in women. But only longer rural living (OR: 0.71; 95% CI: 0.60, 0.83) and higher HDL-C (OR: 0.53; 95% CI: 0.42, 0.66) was associated with decreased risk of HUA prevalence in women.
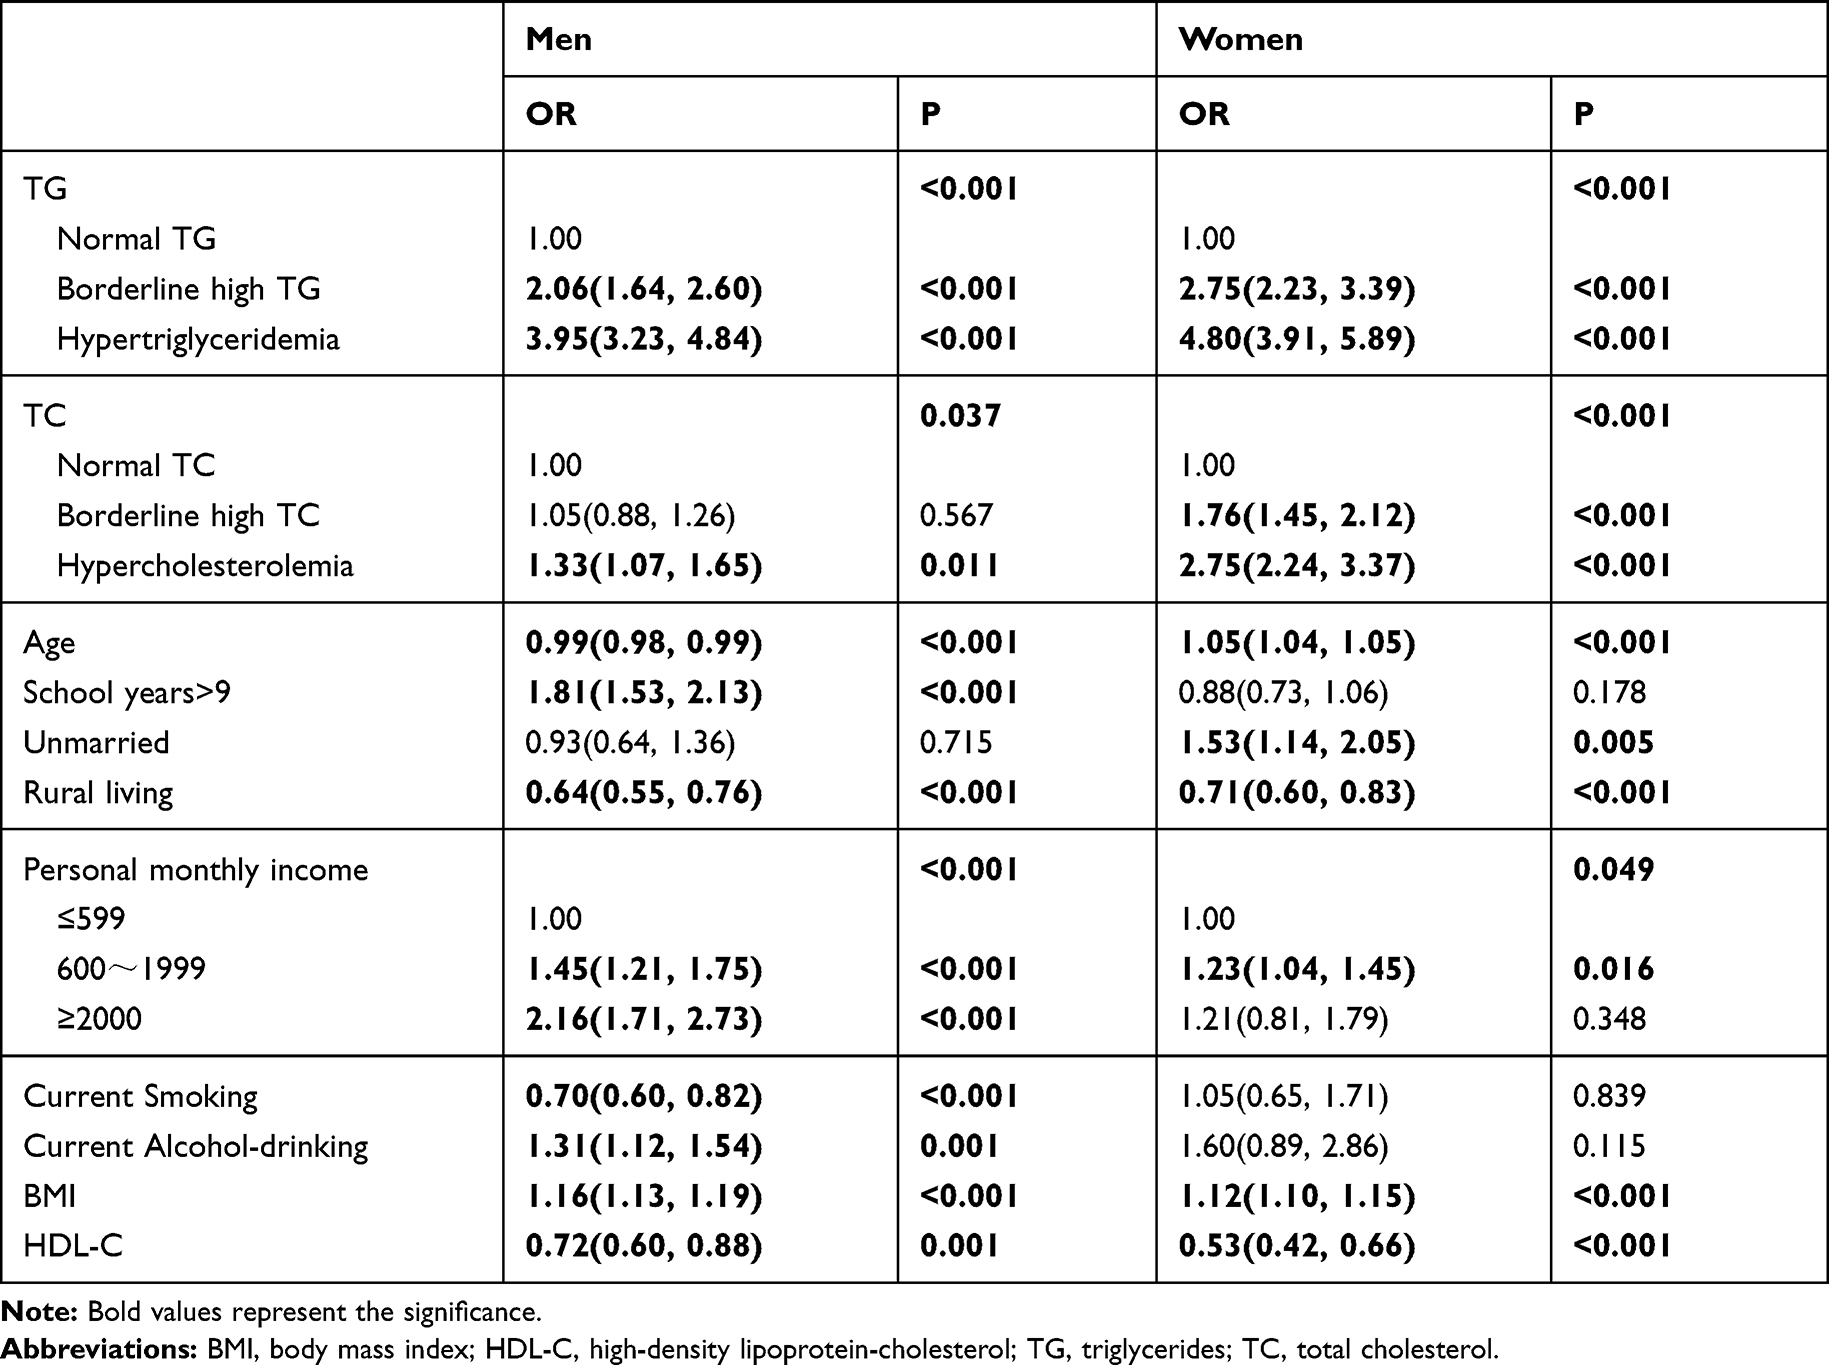 |
Table 2 Odds Ratio (95% Confidence Interval) for HUA in Association to Triglycerides and Total Cholesterol Concentration by Univariate Logistic Regression |
Multivariate logistic regression of the possible risk for HUA prevalence in men and women were presented in Table 3. Elevated TG [borderline high TG (OR: 1.75, 95% CI: 1.36, 2.24; HTG (OR: 3.13, 95% CI: 2.50, 3.94)] indicated increased risk for HUA in men even after adjusted for age, school years, marital status, geographic division, personal monthly income, smoking status, alcohol-drinking status, BMI and HDL-C. Both TG [borderline high TG (OR: 2.08; 95% CI: 1.66, 2.61); HTG (OR: 3.53; 95% CI: 2.80, 4.44)] and TC [borderline high TC (OR: 1.57, 95% CI: 1.28, 1.94); HTC (OR: 2.31, 95% CI: 1.83, 2.93)]showed significant association with HUA in women after adjusted age, school years, marital status, geographic division, personal monthly income, BMI and HDL-C.
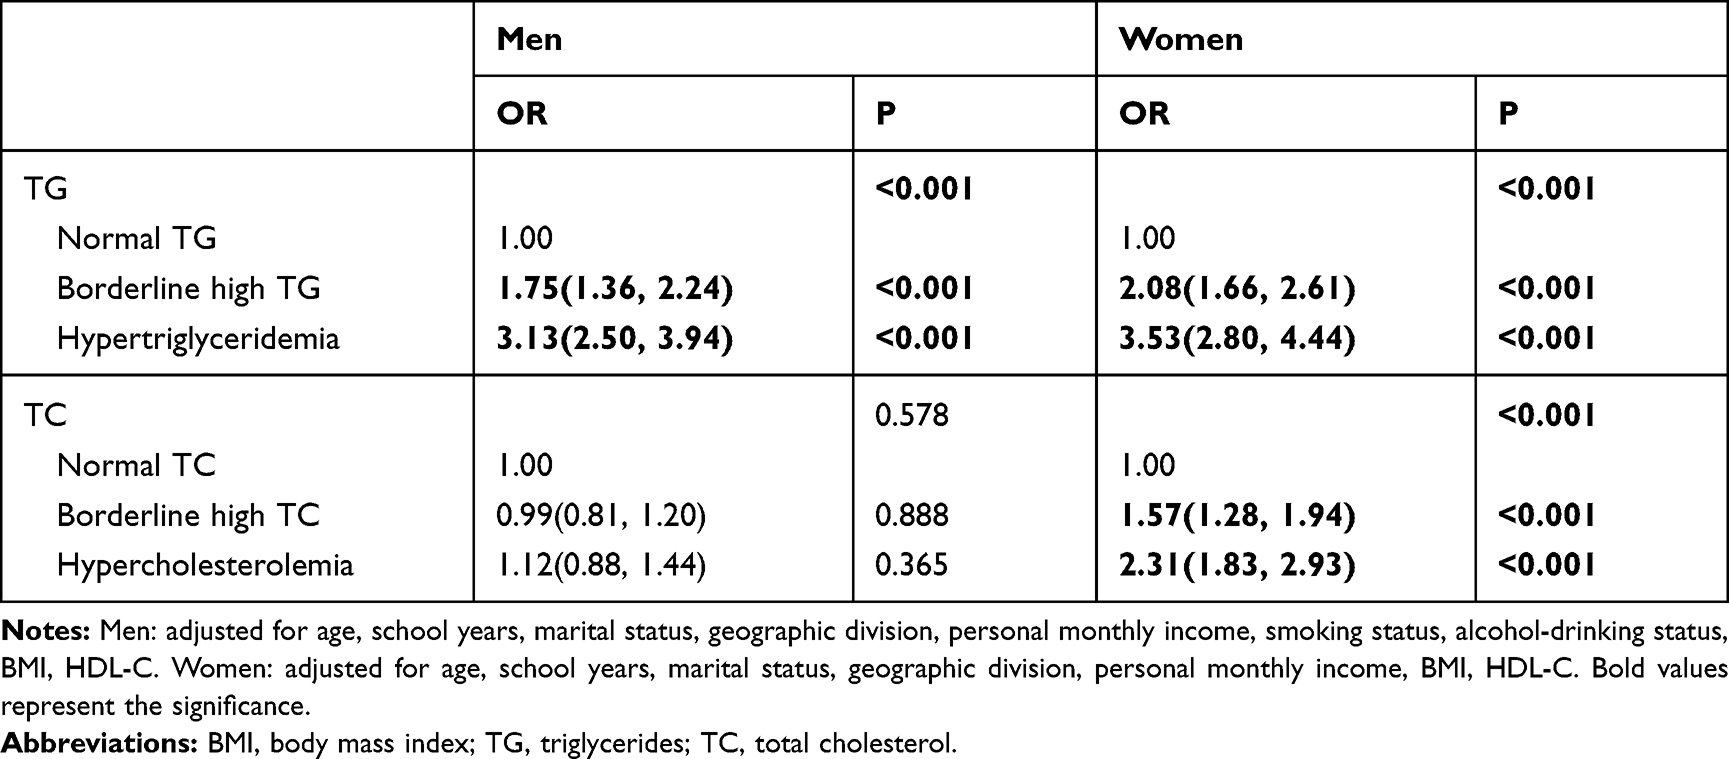 |
Table 3 OR (95% CI) for HUA in Association to TG and TC Concentration by Multivariable Logistic Regression |
Multivariate logistic regression of the possible risk for HUA prevalence in men and women by age stratification analysis is presented in Table 4. Age stratification analyses demonstrated that the association between TG and HUA was stronger in males aged ≥55 years and female aged <55 years, and the association between TC and HUA was stronger in both genders aged <55 years. Specially, compared with normal TC, the OR in hypercholesterolemia was 1.42 (95% CI: 1.04, 1.95) in male aged <55 years, the OR in borderline high TC and hypercholesterolemia was 1.74 (95% CI: 1.31, 2.31) and 2.93 (95% CI: 2.08, 4.13) in female aged <55 years, the OR in borderline high TC was 1.81 (95% CI: 1.30, 2.51) in female aged ≥55 years. However, there was no such effect on TC and HUA in borderline high TC among both genders and in hypercholesterolemia among male aged ≥55 years.
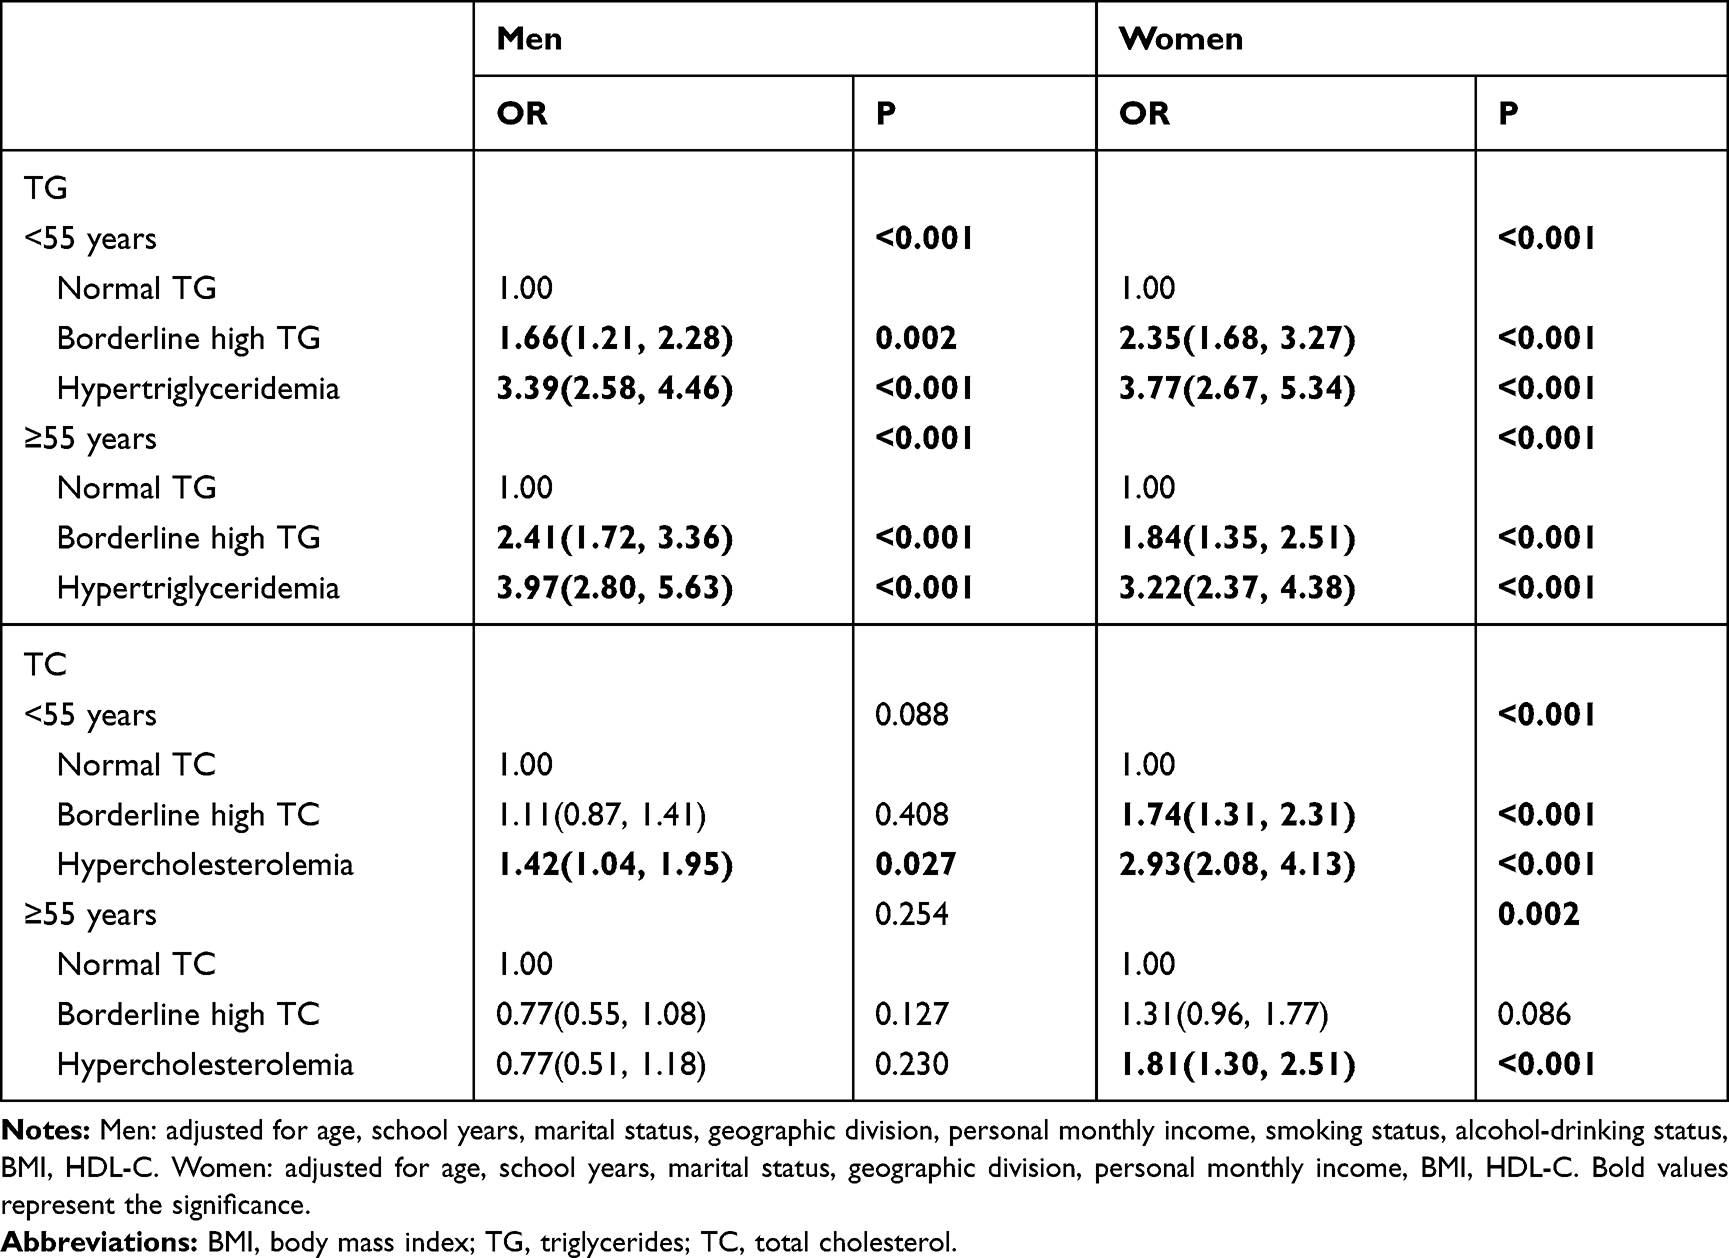 |
Table 4 OR (95% CI) for HUA in Association to TG and TC Concentration by Stratified Analysis of Age |
Discussion
In this cross-sectional study, higher TG and TC significantly increased the risk of HUA prevalence in both men and women. Multivariate logistic regression analysis showed that the elevated TG was significantly associated with HUA in men and women; however, elevated TC was significantly associated with HUA only in women, not in men. Age stratification analyses the elevated TG was significantly associated with HUA in both genders of all ages, however, elevated TG was significantly associated with HUA only in men aged <55 years, in women of all ages.
HUA is the most prevalent purine metabolic disorder and is a rising major public health issue in the world. In our study, the prevalence of HUA was 19.9% in men and 11.6% in women in Qingdao, China,20 which was similar to the systematic review and meta-analysis about the prevalence of HUA in mainland China from 2000 to 2014. While its prevalence in the Chinese men population in Qingdao was lower compared to US men population, NHANES from 2007–08 to 2015–16 study focused on an American population showed that the prevalence of HUA was 24.7% in men and 5.2% in women,19 which is significantly higher than that of our study. Also, higher TG and TC indicated significantly increased in men and women. Chen et al28 had performed a cross-sectional study in the China and found that the prevalence of HUA in the was significantly higher in the disease group than that of the control group. These observations are with our results. However, there was no study reported on the association between the prevalence of HUA and increased TC at present.
At present, the epidemiological studies of dyslipidemia (elevated TG and TC) and HUA have been reported. Some studies showed that elevated UA was associated with high TG, TC, low-density lipoprotein-cholesterol (LDL-C), very low-density lipoprotein-cholesterol (VLDL-C), and low HDL-C,23–25,29–31 which did not confirm a causal role for HUA and dyslipidemia. Matsuura et al32 pointed out that an increase in UA level could be the signal for overfeeding behavior and fat storage in Wistar rats, and then, elevated UA level could act on the urinary bladder mucosa and increases the level of triglyceride and total cholesterol by fructose-induced. Our previous study also found that elevated TG and TC was in association with metabolic syndrome.33,34 Lanaspa et al,35 have suggested that HUA is more prone to develop fatty liver, which generated elevated TG and TC. In addition, there are few mechanisms between uric acid metabolism and lipid metabolism. Some studies demonstrated that silent information regulator T1 (SIRT1) plays key roles in the regulation of lipid metabolism.36,37 Meanwhile, Wang et al38 reported that SIRT1 have clear anti-HUA functions in C57BL/6 mice, and one possible mechanism is the activation of ATP-binding cassette subfamily G member 2 through the PGC-1α/PPARγ pathway. Otherwise, Xu et al39 revealed that the serum uric acid and transcription of the MAPK/Nrf2/ARE (antioxidant responsive element) signaling pathway were elevated, leading to aggravated lipid peroxidation at 1d and 9d postmortem in breast muscle of broilers compared with high-current & low-frequency electrical stunning. It is important to further studies of common cellular signaling pathways between uric acid metabolism and lipid metabolism.
In the last few years, dyslipidemia’s effect on the development of HUA has been reported in different clinical and epidemiological studies. NHANES III demonstrated that serum TG and TC are significantly associated with serum UA levels in general adults.23 A population-based retrospective study including 3884 participants from the medical examination population showed that elevated TG was positively associated with HUA22 in Gansu, China, but no explored the association between TC and HUA. However, some other studies reported that gender differences excited in the association between TG, TC and HUA in Chinese adults.25,40 All the above mention observations are in line with our findings of logistic regression. Those results might be related to estrogen levels in the body,41,42 and the mechanism of estrogen needs to be further studied in the relationship between TG, TC, and HUA.
Normally, lipid parameters, such as TG and TC, are relatively economical and routinely available at hematology labs and can provide effective information for diagnosing HUA and other chronic diseases at clinics. In addition, the association between lipid parameters and HUA remains unclear; therefore, further studies are needed to explore the epidemiology and potential mechanisms between lipid parameters and UA etiology.
There are some strengths in this current study. First, this study was a population-based survey with a relatively large sample size in eastern coastal China. Secondly, the association between TG, TC and HUA was further investigated based on TG and HUA in present studies. Thirdly, the classification of TG and TC levels was detected according to the Guidelines on the prevention and treatment of blood lipid abnormality in Chinese adults. However, the present study suffered from a few potential limitations worth reviewing. This study was designed based on two cross-sectional studies, which could not explore the effect of TG, TC, and HUA. Secondly, the data of this study come from the self-report of participants and might exist the recall bias. Thirdly, the data of this current study collected for an existed Qingdao Diabetes Prevention Program, and some variables like LDL-C, physical exercise, dietary habits, the information of hormonal disorder of estrogen in women and renal failure were not collected. Fourth, this cross-sectional study adopted logistic regression, and the results should be seriously interpreted. Furthermore, confounding bias existed due to HUA relating to renal failure in this study, which may have an impact on the association between the elevation of TG, TC, and HUA. Further studies are needed in those fields.
Conclusion
This large cross-sectional study focusing on the association between single indictor of blood lipid as exposure and HUA as outcome on the east coast of China for the first time. From a sample of Chinese adults, this study demonstrated that elevated TG in men and women and TC in women were associated with increased HUA prevalence. This age-specific effect suggested that there may be a specific association between TG and TC in both genders aged ≥55 years, and between TC and HUA in both genders aged <55 years. Additionally, the more prospective, preclinical and clinical studies about underling mechanisms are required for further investigation between lipid subfractions (such as low-density lipoprotein-cholesterol, very low-density lipoprotein-cholesterol, high-density lipoprotein-cholesterol) and UA etiology.
Abbreviations
BMI, body mass index; CI, confidence intervals; HUA, hyperuricemia; OR, odds ratio; TC, total cholesterol; TG, triglycerides; UA, uric acid.
Acknowledgments
We also thank the participants, primary care doctors, and nurses who participated in this survey.
Author Contributions
Dr. Zulqarnain Baloch, Hai Gu and Jianping Sun designed the research and supervised the whole process. All authors contributed to data analysis, drafting or revising the article, gave final approval of the version to be published, and agree to be accountable for all aspects of the work.
Funding
This work was supported by grants from Qingdao Diabetes Prevention Program and World Diabetes Foundation (WDF05–108 and WDF07–308), Qingdao Science & Technology department program (19-6-1-5-nsh) and Qingdao Outstanding Health Professional Development Fund.
Disclosure
The authors declare that they have no conflicts of interest.
References
1. Paul BJ, Anoopkumar K, Krishnan V. Asymptomatic hyperuricemia: is it time to intervene? Clin Rheumatol. 2017;36(12):2637–2644. doi:10.1007/s10067-017-3851-y
2. Li M, Hou W, Zhang X, et al. Hyperuricemia and risk of stroke: a systematic review and meta-analysis of prospective studies. Atherosclerosis. 2014;232(2):265–270. doi:10.1016/j.atherosclerosis.2013.11.051
3. Bardin T, Richette P. Definition of hyperuricemia and gouty conditions. Curr Opin Rheumatol. 2014;26(2):186–191. doi:10.1097/BOR.0000000000000028
4. Alvarez-Lario B, Alonso-Valdivielso JL. Hyperuricemia and gout; the role of diet. Nutr Hosp. 2014;29(4):760–770. doi:10.3305/nh.2014.29.4.7196
5. Macfarlane LA, Kim SC. Gout: a review of nonmodifiable and modifiable risk factors. Rheum Dis Clin North Am. 2014;40(4):581–604. doi:10.1016/j.rdc.2014.07.002
6. Merriman TR. An update on the genetic architecture of hyperuricemia and gout. Arthritis Res Ther. 2015;17:98. doi:10.1186/s13075-015-0609-2
7. Kawamura Y, Nakaoka H, Nakayama A, et al. Genome-wide association study revealed novel loci which aggravate asymptomatic hyperuricaemia into gout. Ann Rheum Dis. 2019;78(10):1430–1437. doi:10.1136/annrheumdis-2019-215521
8. Saigal R, Agrawal A. Pathogenesis and clinical management of gouty arthritis. J Assoc Physicians India. 2015;63(12):56–63.
9. Cleophas MC, Crisan TO, Joosten LA. Factors modulating the inflammatory response in acute gouty arthritis. Curr Opin Rheumatol. 2017;29(2):163–170. doi:10.1097/BOR.0000000000000366
10. Li C, Hsieh MC, Chang SJ. Metabolic syndrome, diabetes, and hyperuricemia. Curr Opin Rheumatol. 2013;25(2):210–216. doi:10.1097/BOR.0b013e32835d951e
11. Techatraisak K, Kongkaew T. The association of hyperuricemia and metabolic syndrome in Thai postmenopausal women. Climacteric. 2017;20(6):552–557. doi:10.1080/13697137.2017.1369513
12. Vaya A, Rivera L, Hernandez-Mijares A, et al. Association of metabolic syndrome and its components with hyperuricemia in a Mediterranean population. Clin Hemorheol Microcirc. 2015;60(3):327–334. doi:10.3233/CH-141887
13. Cheserek MJ, Shi Y, Le G. Association of hyperuricemia with metabolic syndrome among university workers: sex and occupational differences. Afr Health Sci. 2018;18(4):842–851. doi:10.4314/ahs.v18i4.2
14. Bonakdaran S, Kharaqani B. Association of serum uric acid and metabolic syndrome in type 2 diabetes. Curr Diabetes Rev. 2014;10(2):113–117. doi:10.2174/1573399810666140228160938
15. Mallat SG, Al KS, Tanios BY, et al. Hyperuricemia, hypertension, and chronic kidney disease: an emerging association. Curr Hypertens Rep. 2016;18(10):74. doi:10.1007/s11906-016-0684-z
16. Oh TR, Choi HS, Kim S, et al. Hyperuricemia has increased the risk of progression of chronic kidney disease: propensity score matching analysis from the KNOW-CKD study. Sci Rep. 2019;9(1):6681. doi:10.1038/s41598-019-43241-3
17. Xu X, Hu J, Song N, et al. Hyperuricemia increases the risk of acute kidney injury: a systematic review and meta-analysis. BMC Nephrol. 2017;18(1):27. doi:10.1186/s12882-016-0433-1
18. Li Q, Li X, Kwong JS, et al. Diagnosis and treatment for hyperuricaemia and gout: a protocol for a systematic review of clinical practice guidelines and consensus statements. BMJ Open. 2017;7(6):e14928. doi:10.1136/bmjopen-2016-014928
19. Singh G, Lingala B, Mithal A. Gout and hyperuricaemia in the USA: prevalence and trends. Rheumatology (Oxford). 2019;58(12):2177–2180. doi:10.1093/rheumatology/kez196
20. Liu R, Han C, Wu D, et al. Prevalence of hyperuricemia and gout in Mainland China from 2000 to 2014: a systematic review and meta-analysis. Biomed Res Int. 2015;2015:762820. doi:10.1155/2015/762820
21. Rafiullah M, Siddiqui K, Al-Rubeaan K. Association between serum uric acid levels and metabolic markers in patients with type 2 diabetes from a community with high diabetes prevalence. Int J Clin Pract. 2019;e13466.
22. Hou YL, Yang XL, Wang CX, et al. Hypertriglyceridemia and hyperuricemia: a retrospective study of urban residents. Lipids Health Dis. 2019;18(1):81. doi:10.1186/s12944-019-1031-6
23. Peng TC, Wang CC, Kao TW, et al. Relationship between hyperuricemia and lipid profiles in US adults. Biomed Res Int. 2015;2015:127596. doi:10.1155/2015/127596
24. ZHANG X, MENG Q, FENG J, et al. The prevalence of hyperuricemia and its correlates in Ganzi Tibetan Autonomous Prefecture, Sichuan Province, China. Lipids Health Dis. 2018;17(1):235. doi:10.1186/s12944-018-0882-6
25. Xu J, Peng H, Ma Q, et al. Associations of non-high density lipoprotein cholesterol and traditional blood lipid profiles with hyperuricemia among middle-aged and elderly Chinese people: a community-based cross-sectional study. Lipids Health Dis. 2014;13:117. doi:10.1186/1476-511X-13-117
26. Diseases METF. Chinese multidisciplinary expert consensus on the diagnosis and treatment of hyperuricemia and related diseases. Natl Med J China. 2017;130(20):2473–2488. doi:10.4103/0366-6999.216416
27. Adults JCFD. Guidelines on prevention and treatment of blood lipid abnormality in Chinese adults (Revised in 2016). Chin Circul J. 2016;31(220):937–953.
28. Chen S, Guo X, Dong S, et al. Association between the hypertriglyceridemic waist phenotype and hyperuricemia: a cross-sectional study. Clin Rheumatol. 2017;36(5):1111–1119. doi:10.1007/s10067-017-3559-z
29. Kuwabara M, Borghi C, Cicero A, et al. Elevated serum uric acid increases risks for developing high LDL cholesterol and hypertriglyceridemia: a five-year cohort study in Japan. Int J Cardiol. 2018;261:183–188. doi:10.1016/j.ijcard.2018.03.045
30. Zak A, Zeman M, Tvrzicka E, et al. Fatty acid composition and parameters of VLDL and LDL in persons with dyslipidemia. Cas Lek Cesk. 2000;139(1):18–23.
31. Cibickova L, Langova K, Vaverkova H, et al. Correlation of uric acid levels and parameters of metabolic syndrome. Physiol Res. 2017;66(3):481–487. doi:10.33549/physiolres.933410
32. Balasubramanian T. Uric acid or 1-methyl uric acid in the urinary bladder increases serum glucose, insulin, true triglyceride, and total cholesterol levels in Wistar rats. ScientificWorldJournal. 2003;3:930–936. doi:10.1100/tsw.2003.90
33. Cui J, Sun J, Wang W, et al. The association of triglycerides and total cholesterol concentrations with newly diagnosed diabetes in adults in China. Oncotarget. 2017;8(61):103477–103485. doi:10.18632/oncotarget.v8i61
34. Cui J, Sun J, Wang W, et al. Triglycerides and total cholesterol concentrations in association with IFG/IGT in Chinese adults in Qingdao, China. BMC Public Health. 2018;18(1):444. doi:10.1186/s12889-018-5286-z
35. Lanaspa MA, Sanchez-Lozada LG, Choi YJ, et al. Uric acid induces hepatic steatosis by generation of mitochondrial oxidative stress: potential role in fructose-dependent and -independent fatty liver. J Biol Chem. 2012;287(48):40732–40744. doi:10.1074/jbc.M112.399899
36. Simmons GJ, Pruitt WM, Pruitt K. Diverse roles of SIRT1 in cancer biology and lipid metabolism. Int J Mol Sci. 2015;16(1):950–965. doi:10.3390/ijms16010950
37. Ding RB, Bao J, Deng CX. Emerging roles of SIRT1 in fatty liver diseases. Int J Biol Sci. 2017;13(7):852–867. doi:10.7150/ijbs.19370
38. Wang J, Zhu XX, Liu L, et al. SIRT1 prevents hyperuricemia via the PGC-1alpha/PPARgamma-ABCG2 pathway. Endocrine. 2016;53(2):443–452. doi:10.1007/s12020-016-0896-7
39. Xu L, Zhang HJ, Yue HY, et al. Low-current & high-frequency electrical stunning increased oxidative stress, lipid peroxidation, and gene transcription of the mitogen-activated protein kinase/nuclear factor-erythroid 2-related factor 2/antioxidant responsive element (MAPK/Nrf2/ARE) signaling pathway in breast muscle of broilers. Food Chem. 2018;242:491–496. doi:10.1016/j.foodchem.2017.09.079
40. Qiao Q, Pang Z, Gao W, et al. A large-scale diabetes prevention program in real-life settings in Qingdao of China (2006-2012). Prim Care Diabetes. 2010;4(2):99–103. doi:10.1016/j.pcd.2010.04.003
41. Hak AE, Choi HK. Menopause, postmenopausal hormone use and serum uric acid levels in US women–the Third National Health and Nutrition Examination Survey. Arthritis Res Ther. 2008;10(5):R116. doi:10.1186/ar2519
42. Guan S, Tang Z, Fang X, et al. Prevalence of hyperuricemia among Beijing post-menopausal women in 10 years. Arch Gerontol Geriatr. 2016;64:162–166. doi:10.1016/j.archger.2016.02.002
 © 2020 The Author(s). This work is published and licensed by Dove Medical Press Limited. The full terms of this license are available at https://www.dovepress.com/terms.php and incorporate the Creative Commons Attribution - Non Commercial (unported, v3.0) License.
By accessing the work you hereby accept the Terms. Non-commercial uses of the work are permitted without any further permission from Dove Medical Press Limited, provided the work is properly attributed. For permission for commercial use of this work, please see paragraphs 4.2 and 5 of our Terms.
© 2020 The Author(s). This work is published and licensed by Dove Medical Press Limited. The full terms of this license are available at https://www.dovepress.com/terms.php and incorporate the Creative Commons Attribution - Non Commercial (unported, v3.0) License.
By accessing the work you hereby accept the Terms. Non-commercial uses of the work are permitted without any further permission from Dove Medical Press Limited, provided the work is properly attributed. For permission for commercial use of this work, please see paragraphs 4.2 and 5 of our Terms.