")
Back to Journals » International Journal of General Medicine » Volume 14
Triglyceride–Glucose Index as a Novel Biomarker in the Occurrence of Kidney Stones: A Cross-Sectional Population-Based Study
Authors Jiang H, Li L, Liu J, Xu B, Chen S, Zhu W, Chen M
Received 23 August 2021
Accepted for publication 20 September 2021
Published 29 September 2021 Volume 2021:14 Pages 6233—6244
DOI https://doi.org/10.2147/IJGM.S334821
Checked for plagiarism Yes
Review by Single anonymous peer review
Peer reviewer comments 2
Editor who approved publication: Dr Scott Fraser
Hua Jiang,1,2 Lili Li,3 Jing Liu,1 Bin Xu,1 Shuqiu Chen,1 Weidong Zhu,1 Ming Chen1
1Department of Urology, Affiliated Zhongda Hospital of Southeast University, Nanjing, 210009, People’s Republic of China; 2Department of Medical College, Southeast University, Nanjing, 210009, People’s Republic of China; 3Department of Periodontology, The Affiliated Stomatological Hospital of Nanjing Medical University, Nanjing, 210009, People’s Republic of China
Correspondence: Ming Chen; Shuqiu Chen
Department of Urology, Affiliated Zhongda Hospital of Southeast University, No. 87 Dingjiaqiao, Hunan Road, Gulou District, Nanjing, 210009, People’s Republic of China
Tel/Fax +86-13913009977
; Tel/Fax +86-15951815171
Email [email protected]; [email protected]
Background: Triglyceride–glucose (TyG) index has been considered as the reliable marker of insulin resistance (IR), which is one risk factor of kidney stone. This study aimed to evaluate the TyG index in the occurrence of kidney stones among the United States (US) population.
Methods: Participants who received assessment were retrieved from the National Health and Nutrition Examination Survey (NHANES) between 2007 and 2018. The logistic regression analysis was conducted to assess the relationship between the TyG index and kidney stones occurrence. A 1:1 matched-pair analysis was established to optimize the bias in kidney stones by propensity score matching (PSM). The dose–response curve was performed to verify the association between the TyG index and risk of kidney stones.
Results: Of the 14,158 eligible enrolled participants, 1346 (9.5%) self-reported a history of kidney stones. All participants were divided into two groups (high TyG index group and low TyG index group) based on the median TyG index. The dose–response curve exhibited a positive non-linear correlation between the TyG index and kidney stones risk. High TyG index was related to increased kidney stones occurrence in participants, with adjusted odds ratios (AOR) of 1.14 (95% confidence intervals (CI): 1.01– 1.30, P = 0.038) compared with the low TyG index subgroup before PSM. After PSM, the risk of kidney stones was 19% higher in the high TyG group compared with the low TyG group (AOR = 1.19, 95% CI: 1.02– 1.38, P = 0.026), and the dose–response curve still showed a positive association between TyG index and kidney stone risk.
Conclusion: The TyG index was independently associated with kidney stones and would be a novel biomarker in predicting occurrence for clinical decision.
Keywords: kidney stone, triglyceride–glucose index, insulin resistance, cross-sectional, National Health and Nutrition Examination Survey
Introduction
Kidney stones are the current most urinary stones in patients globally,1 with high prevalence and a worldwide increase over the past few decades. The prevalence of kidney stones in the USA had a nearly threefold relative increase over a 30-year period, with National Health and Nutrition Examination Survey (NHANES) data reflecting from 3.2% in 1976–1980 to 8.8% in 2007–2010.2 Moreover, the estimated prevalence is 7–13% in North America, 4% in South America, 5–10% in Europe and 1–19% in Asia.2 The recurrences are also common in a symptomatic kidney stone patient after the initial stone episode within the first 5 years,3 while the recurrence rate is up to 50% during the whole lifetime in both genders.4
Accounting for the increasing prevalence and high recurrence, kidney stone disease brings a tremendous economic burden for health systems, especially in a working-age population.5 As considered the most expensive urological disease, kidney stone disease has cost more than 10 billion dollars annually in health care system.6 Therefore, it is necessary to pay great attention to preventing the occurrence of kidney stones. Numerous systemic factors have been reported to be associated with an increased risk of kidney stones, suggesting that genetic, environmental, and nutritional factors play an important role in stone formation.7 In particular, kidney stones may be affected by modifiable factors, like dietary and lifestyle factors. Obesity, metabolic syndrome, and diabetes are identified as independent factors that contribute to increasing the stone risk.8 One of the underlying pathophysiologies of stone formation for these patients is thought to be insulin resistance (IR).9
The gold standard to assess IR is the hyperinsulinaemic-euglycaemic glucose clamp test.10 However, it is difficult to be popularized in clinical settings due to the time-consuming, complex and expensive characteristics. Recently several previous studies have proposed the triglyceride–glucose (TyG) index, calculated from fasting levels of triglycerides (TG) and glucose, as a simple, reliable and reproducible predictive indicator marker for the assessment of IR.11 Therefore, in this study, we aimed to evaluate the value of the TyG index in the occurrence of kidney stones among the United States (US) population.
Materials and Methods
Study Population
The baseline clinical data evaluated in this study were retrieved from NHANES from 2007 to 2018. As a cross-sectional survey, NHANES is conducted every other year in the US population by the Centers for Disease Control and Prevention (CDC). Study protocols in NHANES were reviewed and approved by the Institutional Review Board of the National Center for Health Statistics (NCHS), and consent from participants was signed during the survey. This study used previously collected deidentified data, which was deemed exempt from review by the Ethics Committee of the Affiliated Zhongda Hospital of Southeast University.
Our work assessed six consecutive 2-year survey cycles (2007–2008, 2009–2010, 2011–2012, 2013–2014, 2015–2016, 2017–2018), including the questionnaires of kidney stones. All the participants received the KIQ026 survey (Have you ever had kidney stones) for the assessment. The exclusion criteria were as follows: 1) unknown stone (n=25,163); 2) unknown triglyceride, high-density lipoprotein cholesterol (HDL-C) and low-density lipoprotein cholesterol (LDL-C) (n=19,950); 3) unknown blood glucose (n=54); 4) unknown body mass index (BMI) (n=181); 5) unknown uric acid (n=4); 6) unknown insulin or urine creatinine (n=332) (Figure 1).
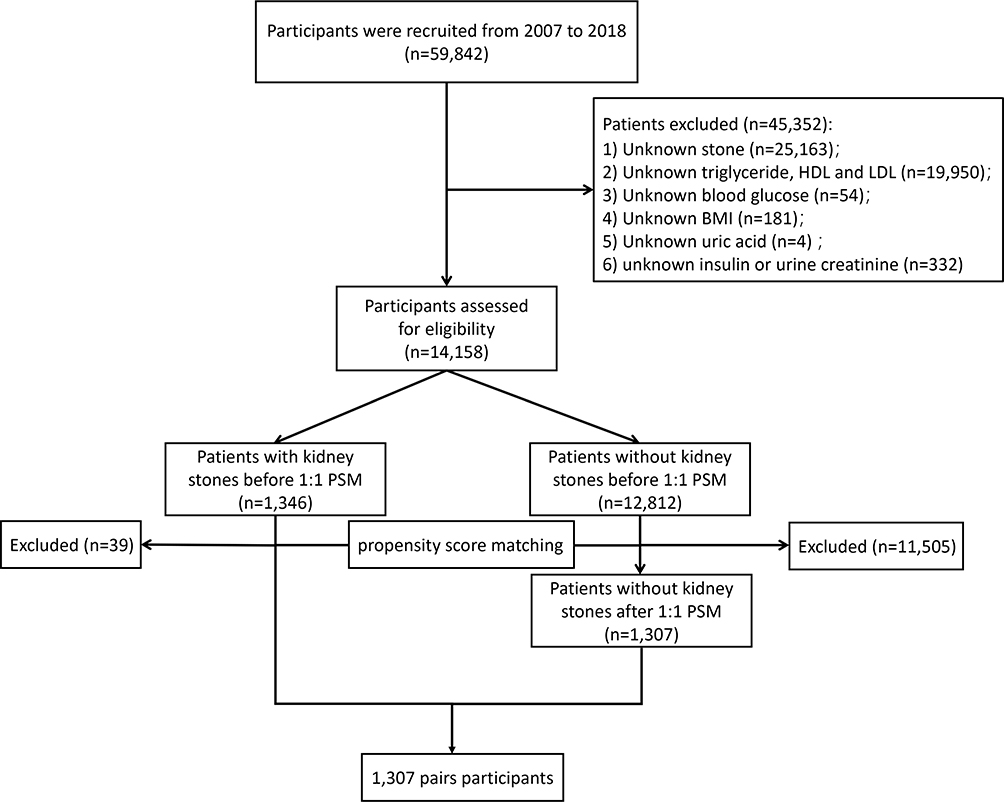 |
Figure 1 Schematic flowchart of exclusion criteria in our study. |
Data Collection and Definitions
The evaluation of kidney stones was conducted by the KIQ026 survey, which asked the participants whether ever had kidney stones or not. Participants who answered “No” to the “Have you ever had kidney stones?” were considered to have no history of kidney stones. Blood samples were collected for further detection. Clinical variables in this study included gender (male and female), age (20–39, 40–59 and 60+), race (non-Hispanic white, non-Hispanic black, Mexican American, other Hispanic and other), education (less than high school, high school or equivalent, college or above and other), marital status (married and unmarried/other), BMI, hypertension, diabetes, recreational activities (vigorous and moderate), kidney stones, urine creatinine, blood urea nitrogen, creatinine, uric acid, fasting glucose, total cholesterol, TG, HDL-C and LDL-C. The TyG index was determined by ln [(TG level mg/L × fasting glucose level mg/dL)/2], and the homeostasis model assessment for IR (HOMA-IR) was calculated as (fasting insulin [μIU/mL] × fasting glucose [mmol/L])/22.5. With a median of quartiles as 8.49, the TyG index was classified into low and high groups.
Statistical Analysis
All the continuous variables were recorded by mean ± standard deviation (SD) and the classified variables were presented by proportion. Chi-square analysis was applied in the assessment of clinical variables in this study. Logistic regression was conducted to calculate the adjusted odds ratios (AOR) with a 95% confidence interval (CI) for TyG-related kidney stones risk. Univariate and multivariate models were established and included different variables. The basic multivariate model consisted of TyG, age and gender. In the core multivariate model, the characteristics of TyG, age, gender, race, education levels, marital status, and BMI. Additionally, clinical variables of diabetes, hypertension, vigorous recreational activities, moderate recreational activities, urine creatinine, blood urea nitrogen, creatinine, and uric acid were adjusted in the extended multivariate model based on the core model. The 1:1 propensity score matching (PSM) was performed to normalize potential baseline confounders due to the imbalance existed in kidney stones occurrence. A restricted cubic spline was subsequently conducted to determine the dose–response relationship between the TyG index and kidney stones occurrence. Statistical analyses were conducted by Statistical Package for the Social Sciences software (version 24.0) with P-value <0.05 as statistically significant. The PSM and restricted cubic spline were established through R (version 3.5.1).
Results
A number of 14,158 eligible participants retrieved from NHANES from 2007 to 2018 were included in our study. For the eligible participants, there were 1346 (9.5%) reported have kidney stones. The baseline characteristics are represented in Table 1. Of the total participants, the majority were female (7357, 52.0%), 60+ years (4806, 33.9%), non-Hispanic white (5833, 41.2%), college or above education (7440, 52.5%), married (7358, 52.0%), without hypertension (9010, 63.6%) and prediabetes (11,974, 84.6%). The average BMI was 29.10 ± 6.91 kg/m2 in our eligible participants. Participants with kidney stones had higher levels of HOMA-IR, blood urea nitrogen, creatinine, uric acid, fasting glucose, TG, LDL-C, TyG, and urine creatinine than those without kidney stones.
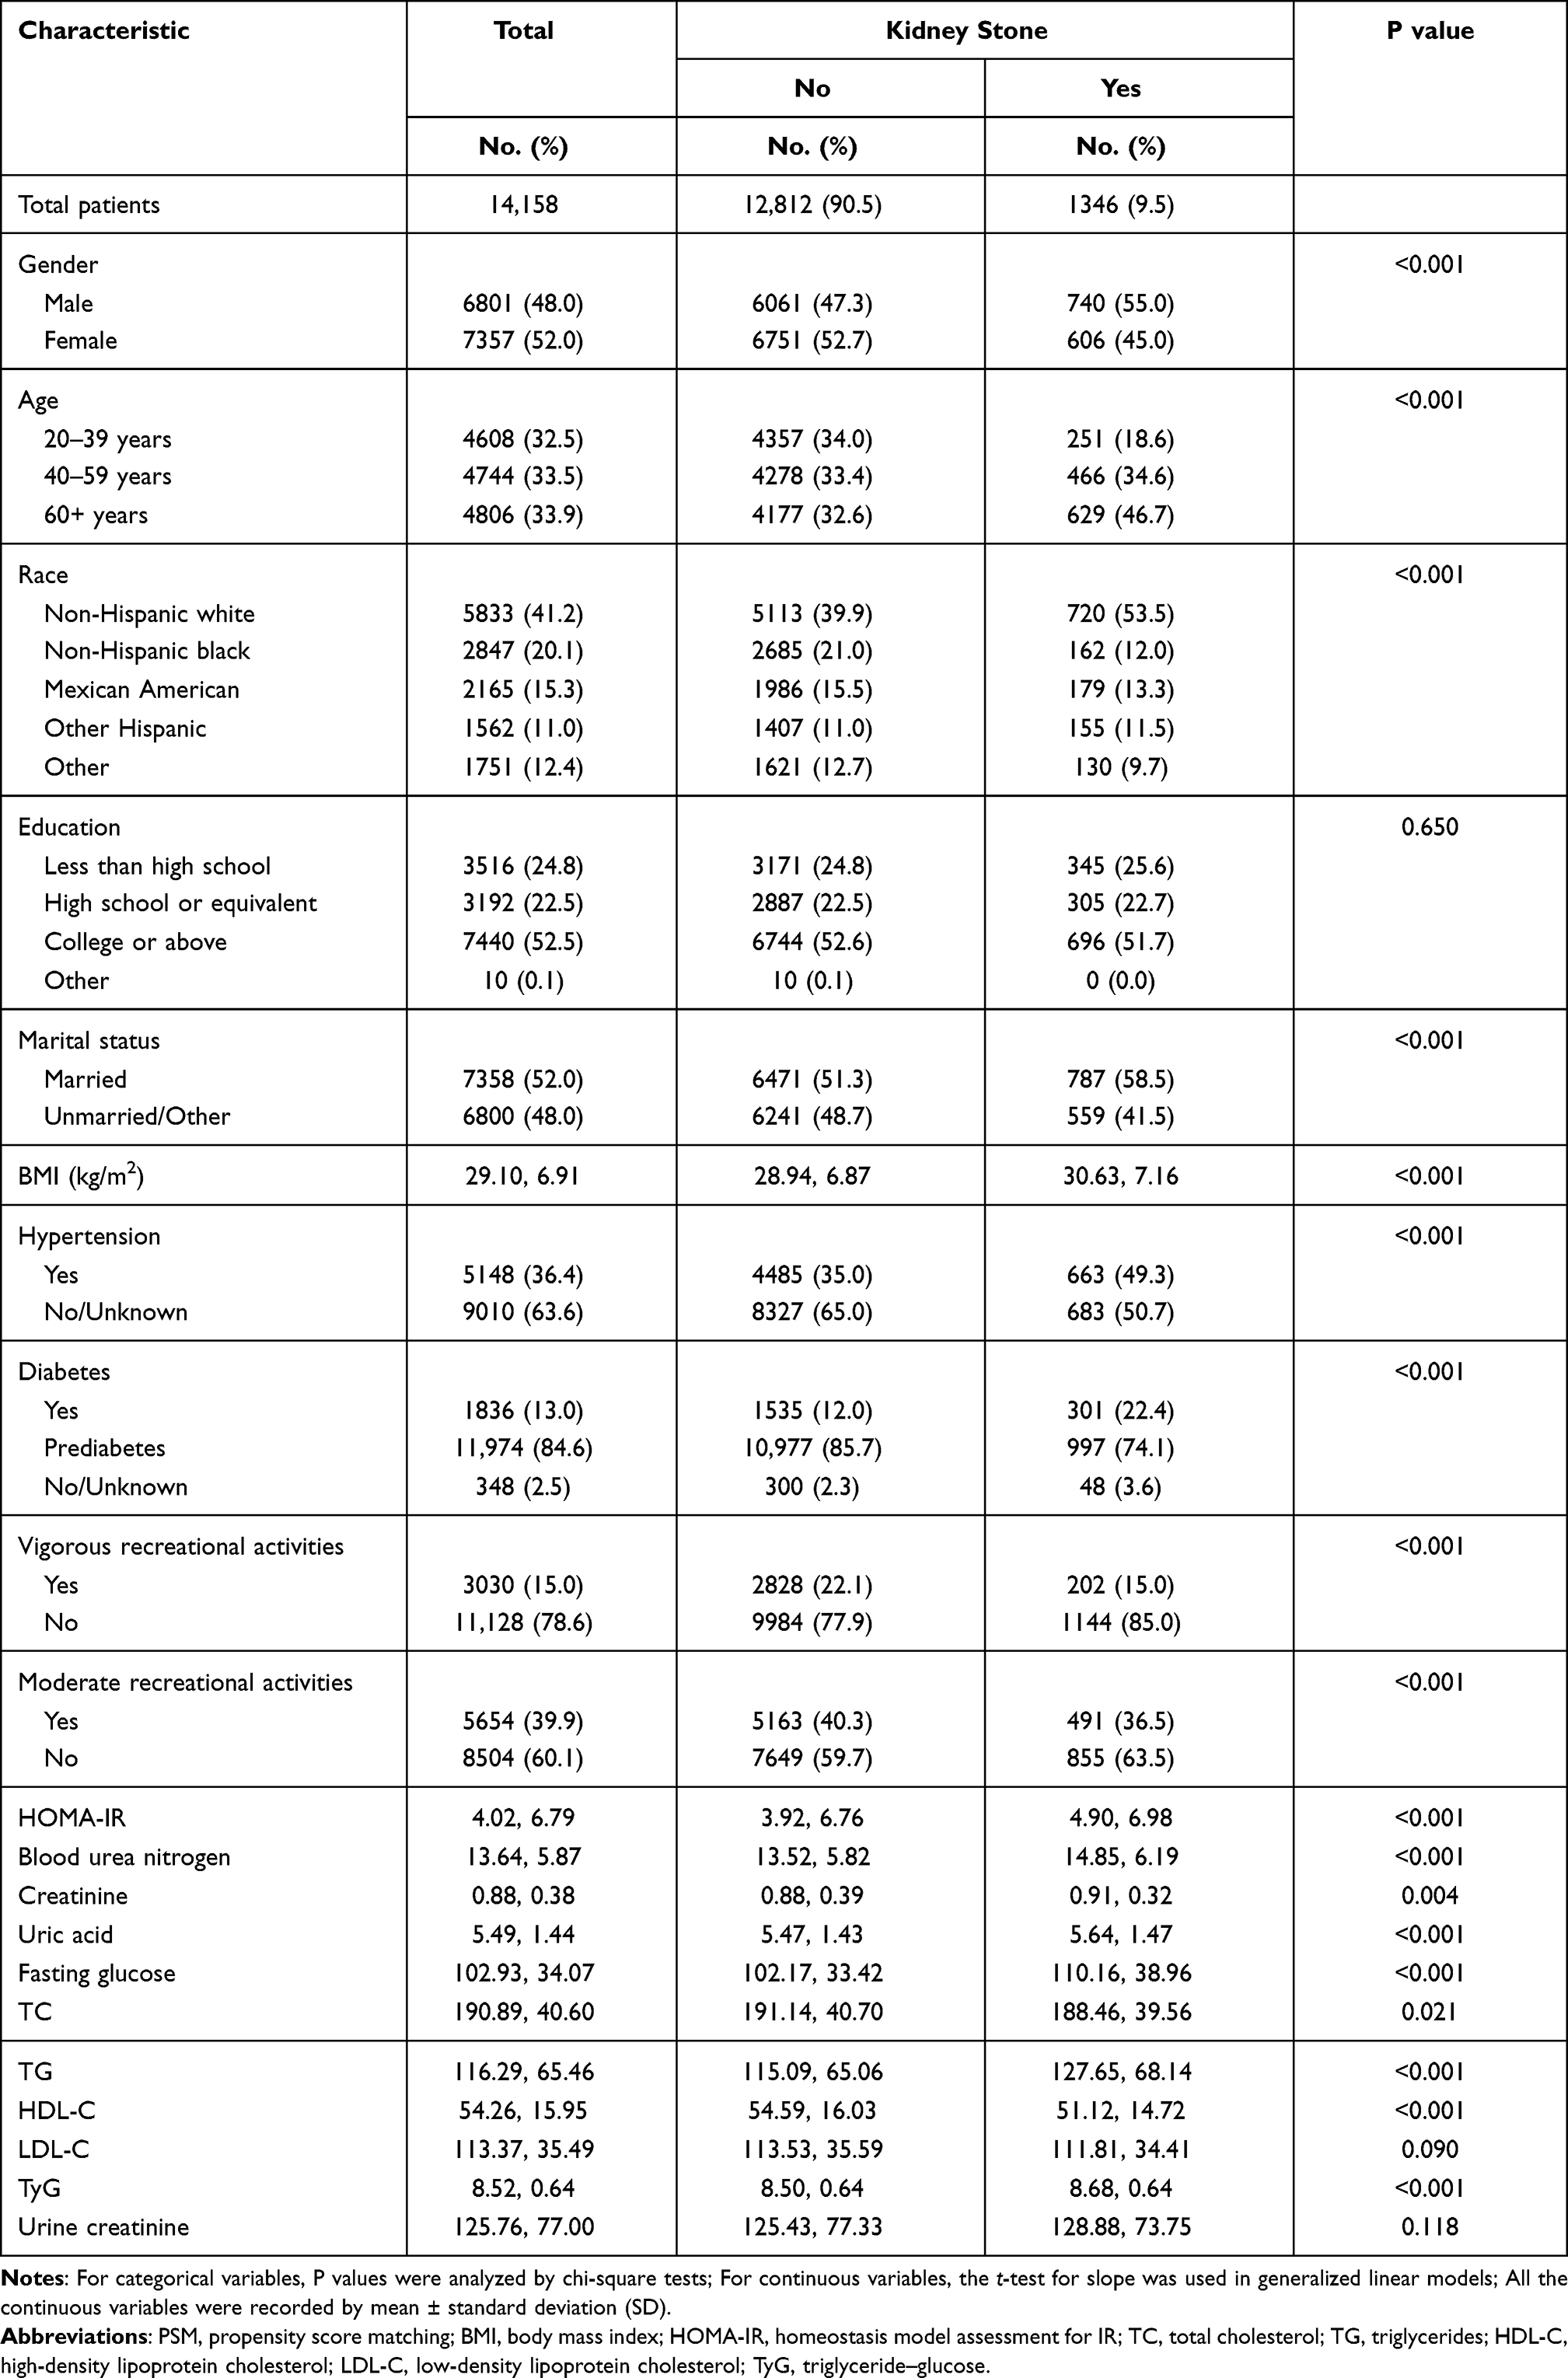 |
Table 1 Baseline Characteristics of 14,158 Participants in NHANES 2007–2018 According to Kidney Stone Status Before PSM |
All participants were divided into two groups (high TyG index group and low TyG index group) based on the median TyG index. The chi-square analysis results indicated that all included variables (except urinary creatinine) were related with the TyG index (All P < 0.001) and a higher proportion (11.6%) of kidney stones in the high TyG index group (Table 2). After included gender, age, race, education, marital status, BMI, hypertension, diabetes, urine creatinine, blood urea nitrogen, creatine, uric acid, vigorous and moderate recreational activities for adjustment, the dose–response curve exhibited the positive non-linear correlation between the TyG index and kidney stones risk (Figure 2).
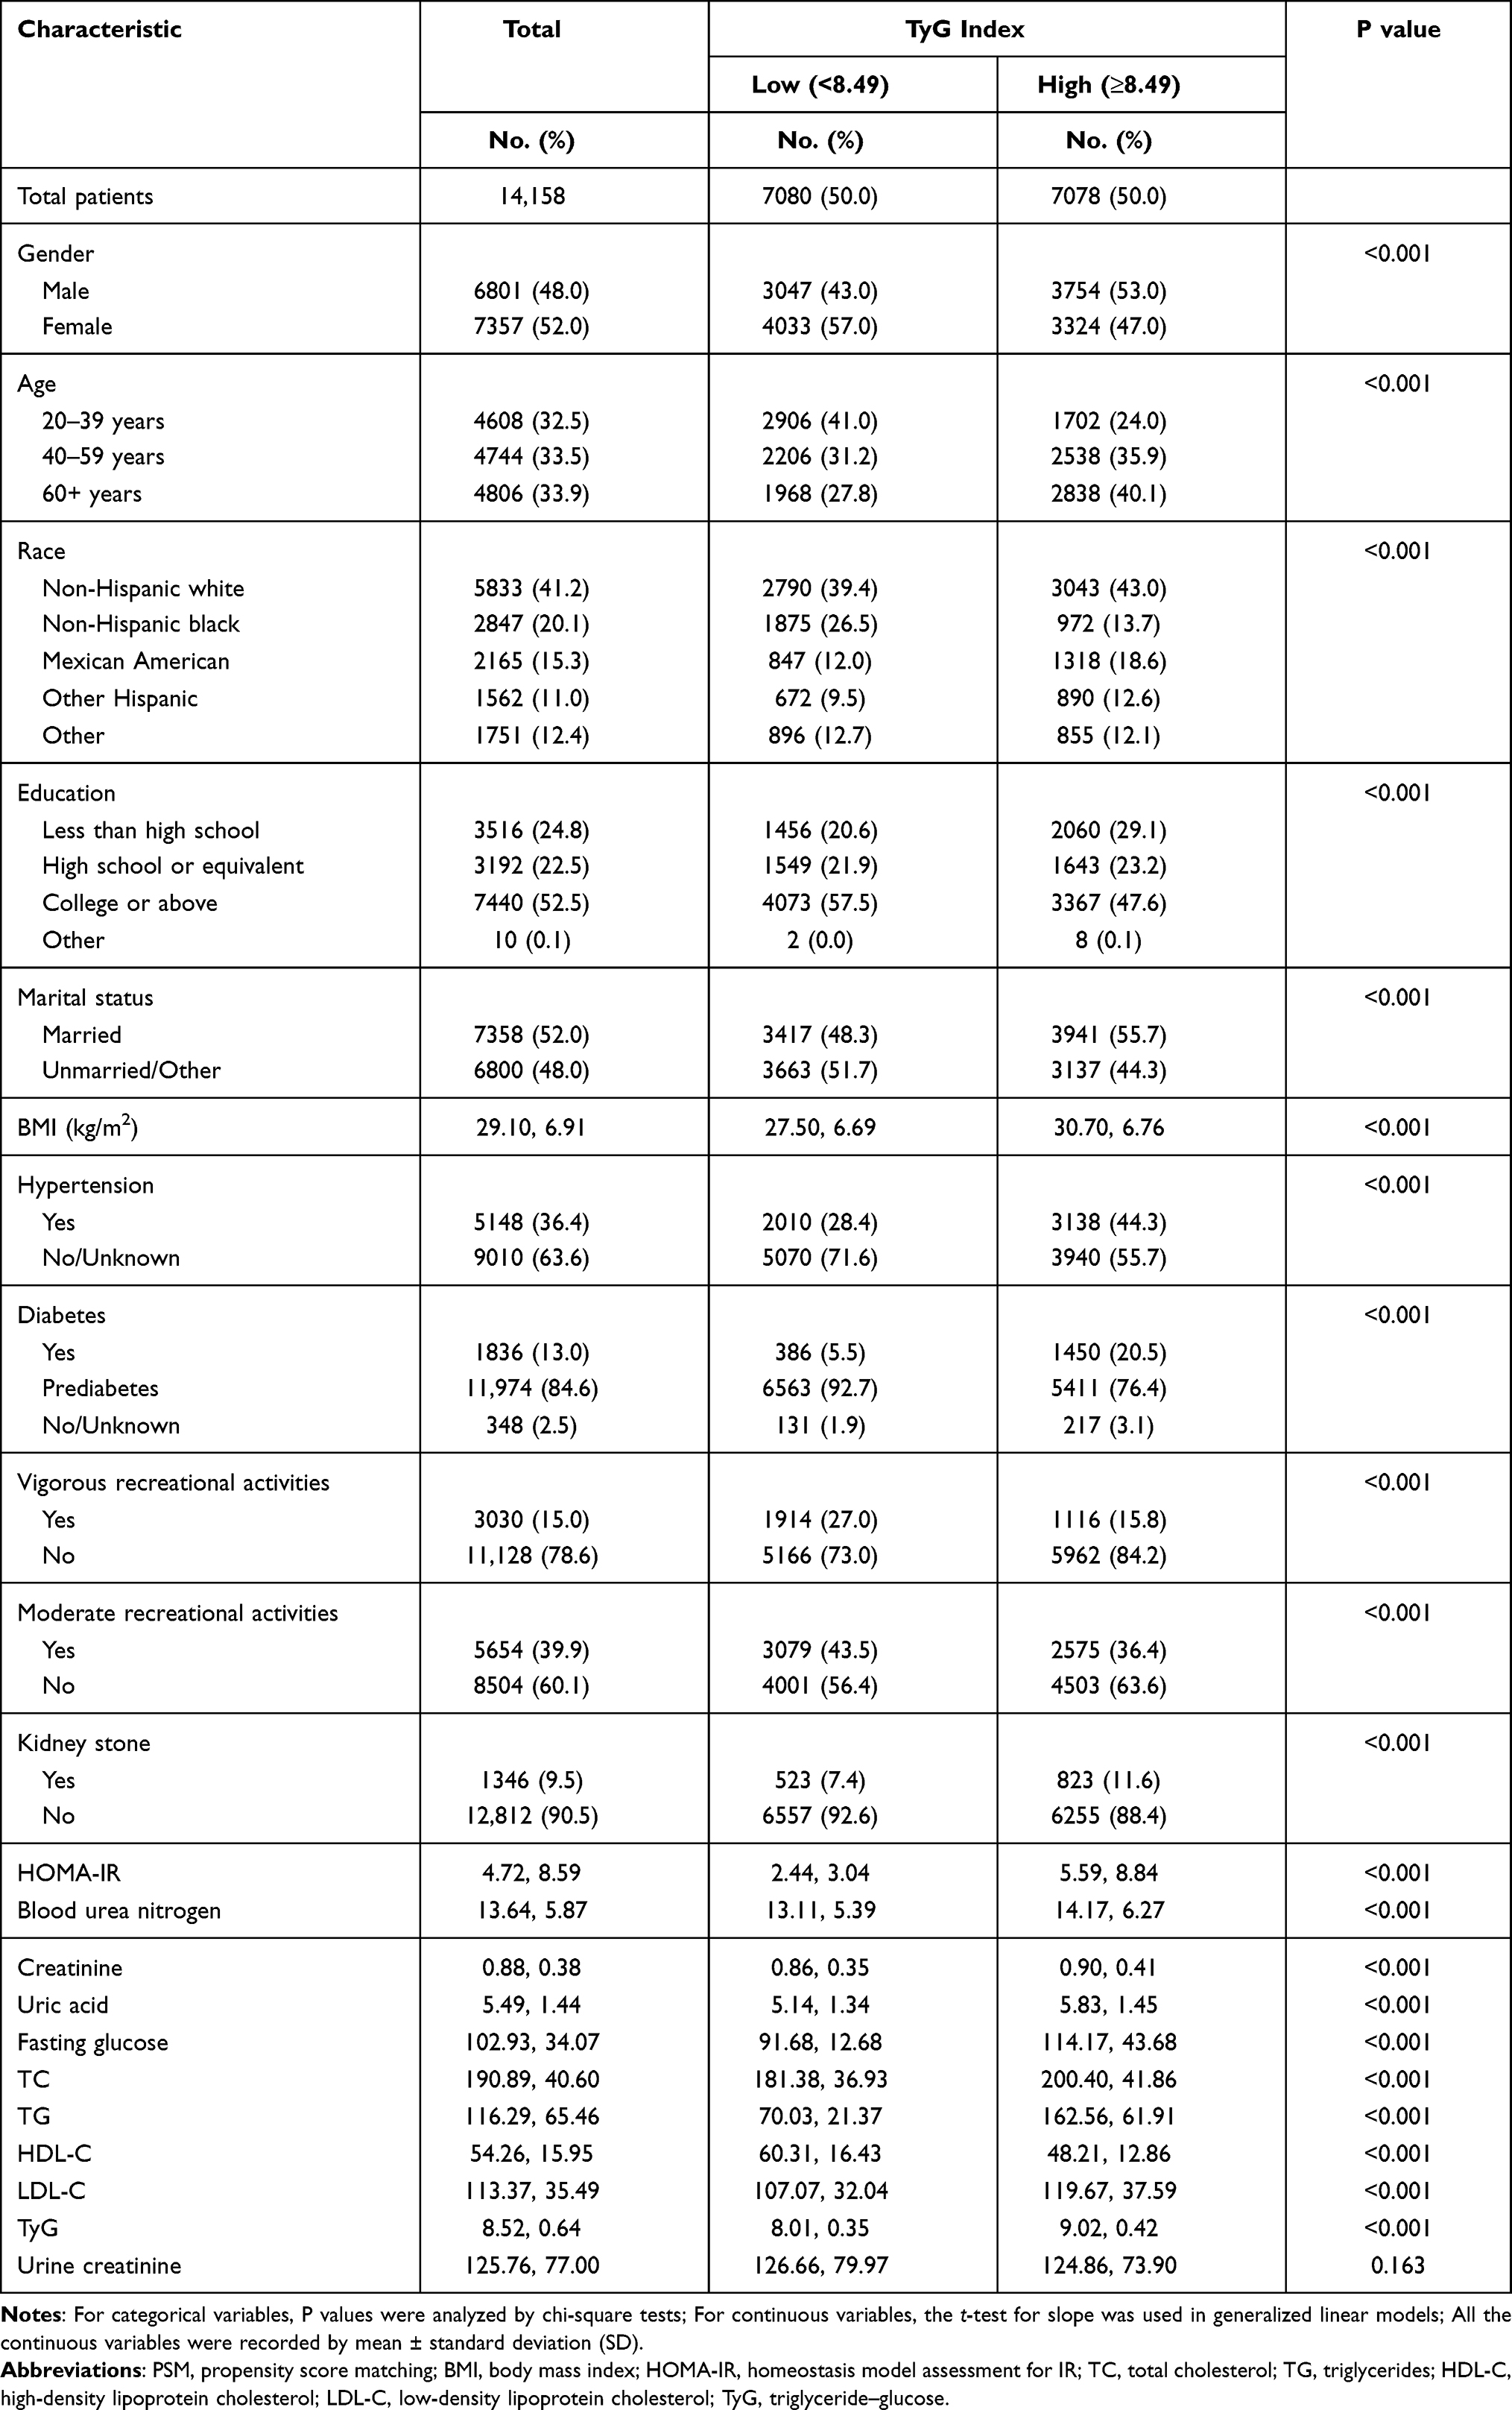 |
Table 2 Baseline Characteristics of 14,158 Participants in NHANES 2007–2018 According to TyG Status Before PSM |
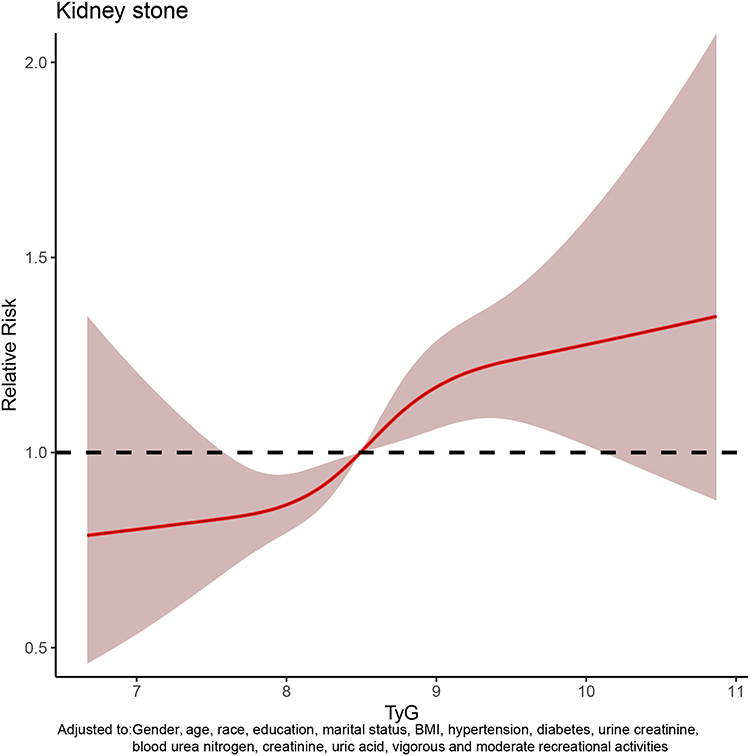 |
Figure 2 The dose–response analysis between triglyceride–glucose (TyG) index and kidney stones occurrence before propensity score matching (PSM). |
Univariate and multivariate logistic regression were used to analyze the ability of TyG index and HOMA-IR to predict the risk of kidney stones. The results indicated higher TyG index was positively related with kidney stones risk in the univariate model (high vs low: AOR = 1.65, 95% CI = 1.47–1.85, P < 0.001), basic model (high vs low: aOR = 1.43, 95% CI = 1.27–1.61, P < 0.001), core model (high vs low: AOR = 1.21, 95% CI = 1.07–1.36, P = 0.003) and extended model (high vs low: AOR = 1.14, 95% CI = 1.01–1.30, P = 0.038) (Table 3). However, HOMA-IR was not statistically associated with the risk of kidney stones in the extended model.
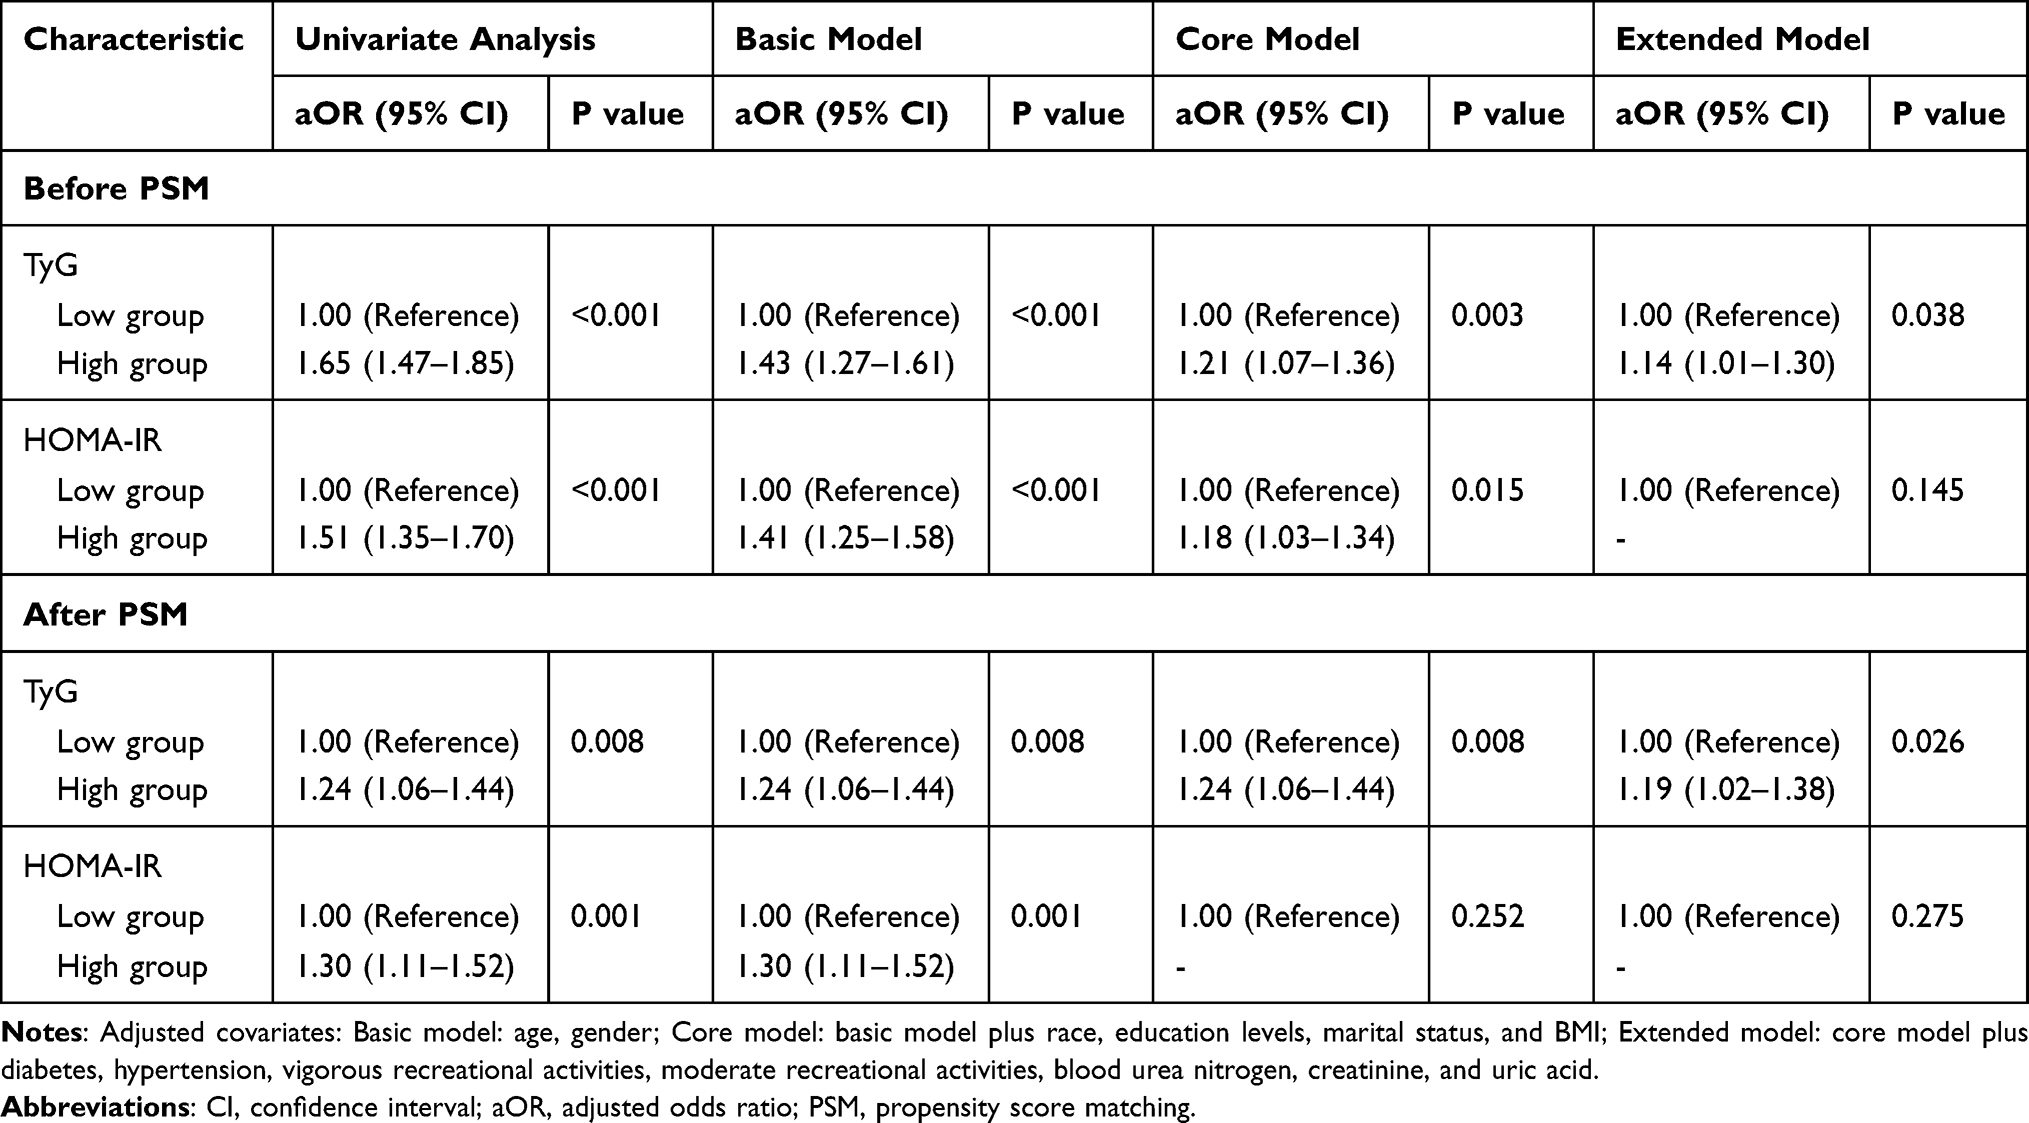 |
Table 3 Adjusted Odds Ratios for Associations Between the TyG and the Risk of Kidney Stone in NHANES 2007–2018 |
According to the significant difference in the occurrence of kidney stones (9.5% vs 90.5%), a 1:1 matched cohort analysis was conducted to minimize the potential bias through PSM (Figure 3). We confirmed 2614 participants in the matched cohort through PSM. The chi-square analysis results evidenced that significant differences remained in most variables in the high TyG index group and low TyG index group (Table 4). Similarly, multivariate logistic regression analysis revealed that the risk of kidney stones was 19% higher in the high TyG group compared with the low TyG group (AOR = 1.19, 95% CI: 1.02–1.38, P = 0.026) in the extended model (Table 3), and the dose–response curve still showed a positive association between TyG index and kidney stone risk (Figure 4).
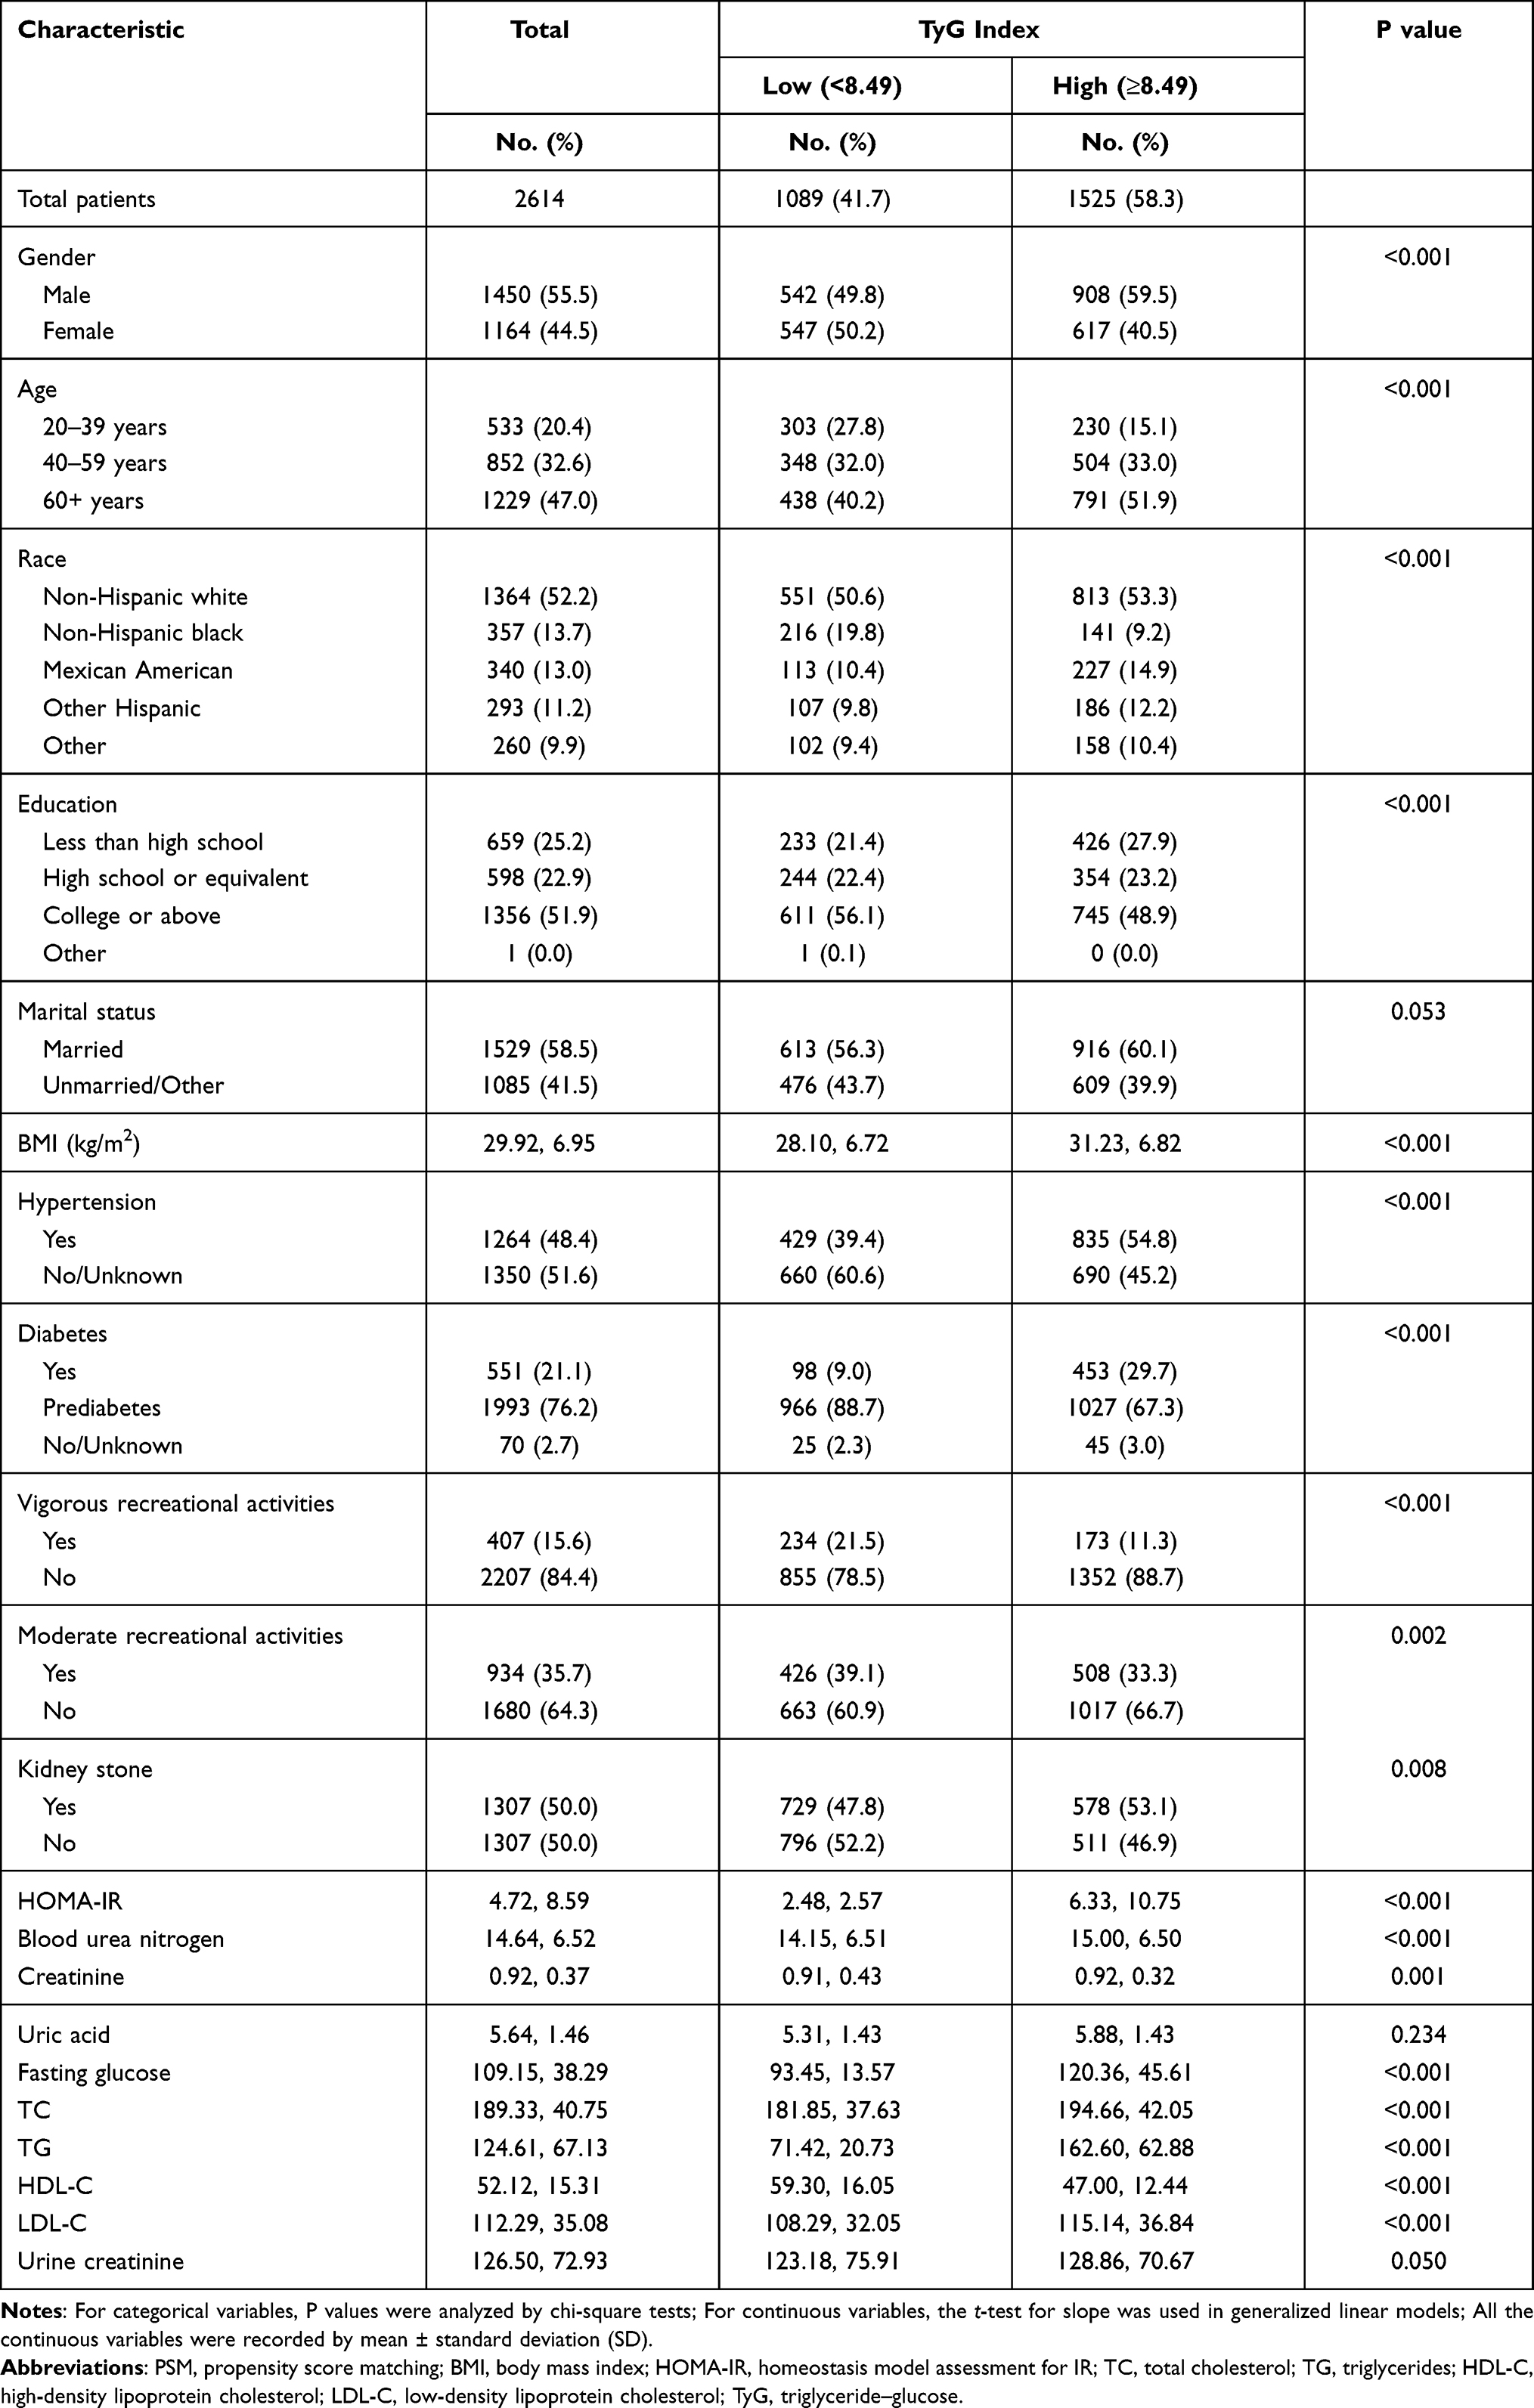 |
Table 4 Baseline Characteristics of 2614 Participants in NHANES 2007–2018 After PSM |
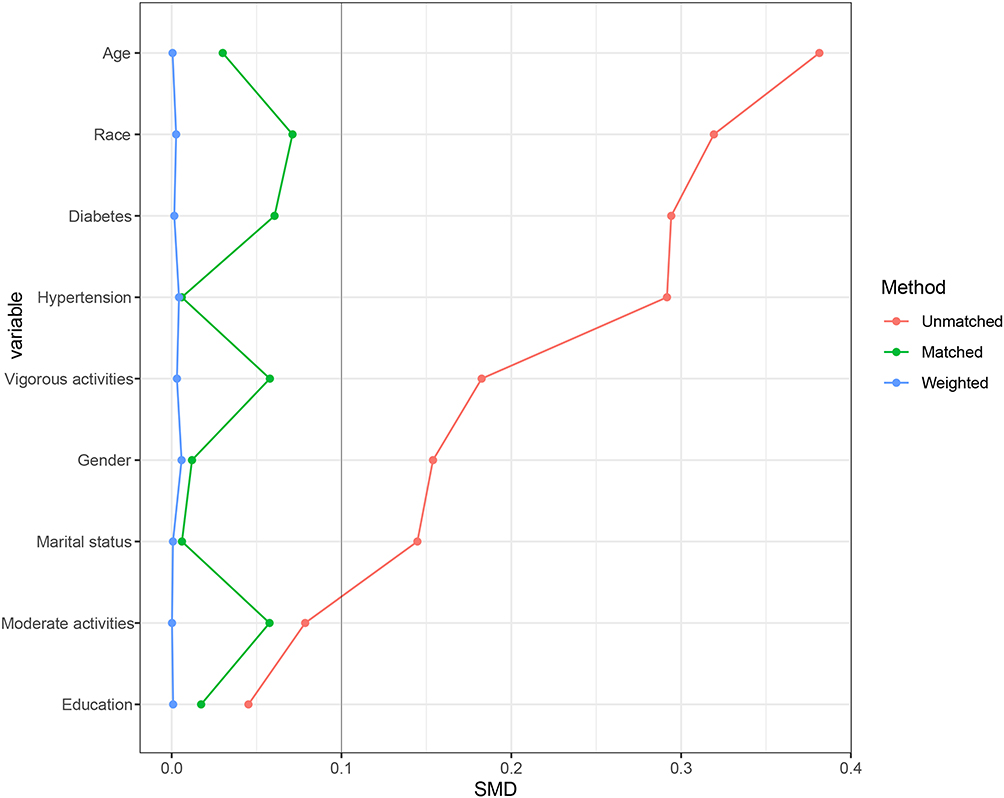 |
Figure 3 The standardized mean difference (SMD) results of different variables after PSM. |
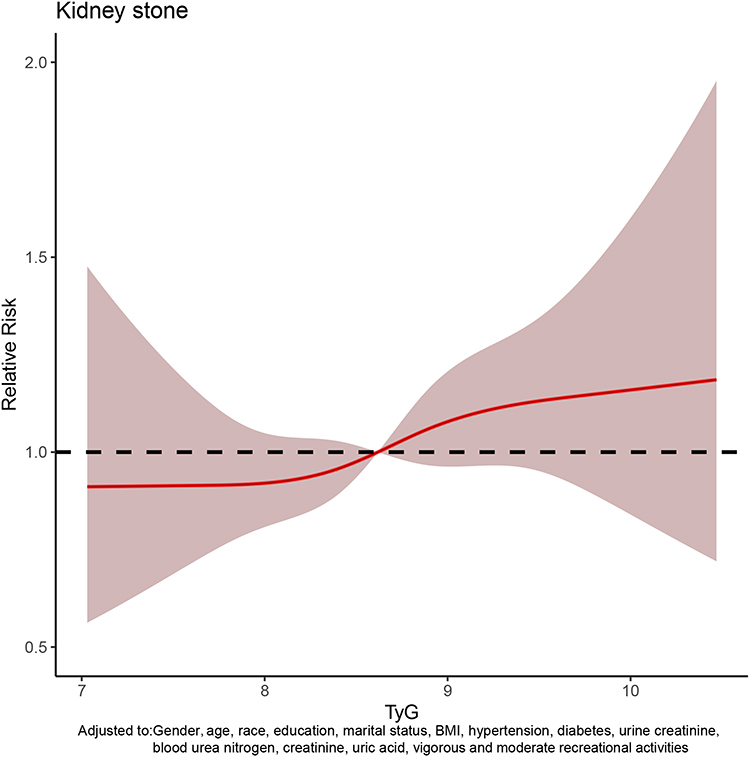 |
Figure 4 The dose–response analysis between triglyceride–glucose (TyG) index and kidney stones occurrence after PSM. |
Discussion
Kidney stones as the common occurring disease pose a significant health burden in public.5 This work introduced the relationship between the TyG index and kidney stones occurrence in this cross-sectional population-based study. The high TyG index was examined to be positively associated with the kidney stones occurrence in the eligible participants. Meanwhile, the positive dose–response relationship was also proved in the 1:1 matched cohort after PSM. All the statistical results provided the favorable evidences in confirmation of the positive association existed in the TyG index and kidney stones.
Recent reports had revealed the IR as the risk factor contributing to kidney stones occurrence.12,13 Together with individual habits, genetic factors and environmental conditions, metabolic imbalance was considered as the major risk factor for kidney stones. In practice, IR would reduce urinary pH and further damage the ability of generating renal ammonium in response to an acid load.12 Kim et al14 conducted a retrospective study based on 278,628 adults for the evaluation of glycemic status and IR in nephrolithiasis. The results indicated that IR was positively related with elevated risk of nephrolithiasis, which in consistent with our fundings. Previous research evidences from Weinberg et al15 also confirmed the potential relationship between IR and kidney stones. It was supposed that uric acid excretion functions as the mechanism that may illustrate the stone formation.16 All the results supported that IR was the risk factor for kidney stones and would contribute to the occurrence prediction.
The TyG index, a novel indicator determined by TG and fasting glucose, had been recently accepted as an intuitive and reliable predictor of IR, assisting in clinical decision.17–19 Different from HOMA-IR, the TyG index was universally adaptable in all patients due to the calculation without quantification of insulin.20,21 It was well distinguished that an increased TyG index would contributing to diagnosing T2DM and predicting related adverse outcomes.22,23 Kidney as a metabolic organ is easy to be damaged by glucose metabolism disorders and diabetic nephropathy has been considered as a huge burden in population. Whether the TyG index would contribute to predicting renal diseases remains unclear. In a study of 11,712 participants, Okamura et al24 investigated the predicting performance of the TyG index in chronic kidney disease (CKD) risks. And it was reported that the TyG index predicts significant risks for CKD in population with a hazard ratio (HR) of 1.32 for men, and 1.50 for women. The results promoted us to explore the application of the TyG index in renal diseases, especially the ones related with IR. Furthermore, our study found that the TyG index was a better predictor of kidney stone risk than HOMA-IR.
In this study, we estimated the relationship between the TyG index and kidney stones through various analyses. Meanwhile, we established the dose–response relationships before and after the PSM for the evaluation of the TyG index predicting performance in stone occurrence. To our knowledge, this work was the first attempt to assess the function of the TyG index in kidney stones occurrence. The aORs (95% CI) of high TyG group were 2.32 (2.06–2.66) and 2.37 (2.14–2.66) in extended model before/after PSM among the 14,490 eligible participants. Our results revealed that TyG index could function as the predictor of kidney stones occurrence with an excellent performance. And this work would expand the application of the TyG index in renal diseases prediction and contribute to individualized therapy and clinical decision.
Nevertheless, this study has limitations as follows. Firstly, this survey as a retrospective study, could not avoid the happen of bias, such as recording, inquiring, etc. Secondly, the data retrieved from NHANES only involved the population from America which was unable to represent other regions including Asia, Europe, etc. Thirdly, the detailed clinical variables were not disclosed in the database including the personal drug history and kidney stones types, which remaining further exploration. Therefore, the prospective international multicenter studies desired to establish for the evaluation of our results. Despite these limitations, there are strengths of the study including proposing a novel index for kidney stones occurrences and revealing the relationship between the TyG index and kidney stones, which assisting the accurate clinical previsions and treatments.
Conclusion
This study reported high TyG index was examined to be positively associated with the kidney stones occurrence, and TyG index would be a novel biomarker in predicting occurrence for individualized therapy and clinical decision.
Data Sharing Statement
The datasets used and analysed during the current study are available from the corresponding author Ming Chen on reasonable request.
Ethics Approval and Consent to Participate
This study used previously collected deidentified data, which was deemed exempt from review by the Ethics Committee of the Affiliated Zhongda Hospital of Southeast University. The authors are accountable for all aspects of the work in ensuring that questions related to the accuracy or integrity of any part of the work are appropriately investigated and resolved.
Acknowledgments
The authors thank Weipu Mao for statistical analysis support and other members of the urology department for helpful discussions.
Author Contributions
All authors made a significant contribution to the work reported, whether that is in the conception, study design, execution, acquisition of data, analysis and interpretation, or in all these areas; took part in drafting, revising or critically reviewing the article; gave final approval of the version to be published; have agreed on the journal to which the article has been submitted; and agree to be accountable for all aspects of the work.
Funding
This study was supported by the National Natural Science Foundation of China (82070773), Natural Science Foundation of Jiangsu Province (BK20201271), Jiangsu Province Medical Youth Talent (QNRC2016821), Jiangsu Provincial Key Research and Development Program (BE2019751), Innovative Team of Jiangsu Provincial (2017XKJQW07), and The National Key Research and Development Program of China (SQ2017YFSF090096).
Disclosure
The authors declare that there are no conflicts of interest in this work.
References
1. Pak CY. Kidney stones. Lancet. 1998;351(9118):1797–1801. doi:10.1016/S0140-6736(98)01295-1
2. Thongprayoon C, Krambeck AE, Rule AD. Determining the true burden of kidney stone disease. Nat Rev Nephrol. 2020;16(12):736–746. doi:10.1038/s41581-020-0320-7
3. Rule AD, Lieske JC, Pais VM. Management of kidney stones in 2020. JAMA. 2020;323(19):1961–1962. doi:10.1001/jama.2020.0662
4. Bihl G, Meyers A. Recurrent renal stone disease-advances in pathogenesis and clinical management. Lancet. 2001;358(9282):651–656. doi:10.1016/S0140-6736(01)05782-8
5. Scales CD, Smith AC, Hanley JM, Saigal CS. Prevalence of kidney stones in the United States. Eur Urol. 2012;62(1):160–165. doi:10.1016/j.eururo.2012.03.052
6. Zisman AL. Effectiveness of treatment modalities on kidney stone recurrence. Clin J Am Soc Nephrol. 2017;12(10):1699–1708. doi:10.2215/CJN.11201016
7. Mao W, Zhang H, Xu Z, et al. Relationship between urine specific gravity and the prevalence rate of kidney stone. Transl Androl Urol. 2021;10(1):184–194. doi:10.21037/tau-20-929
8. Mao W, Wu J, Zhang Z, Xu Z, Xu B, Chen M. Neutrophil-lymphocyte ratio acts as a novel diagnostic biomarker for kidney stone prevalence and number of stones passed. Transl Androl Urol. 2021;10(1):77–86. doi:10.21037/tau-20-890
9. Carbone A, Al Salhi Y, Tasca A, et al. Obesity and kidney stone disease: a systematic review. Minerva urologica e nefrologica = Italian J Urol Nephrol. 2018;70(4):393–400.
10. Heise T, Zijlstra E, Nosek L, Heckermann S, Plum-Mörschel L, Forst T. Euglycaemic glucose clamp: what it can and cannot do, and how to do it. Diabetes Obes Metab. 2016;18(10):962–972. doi:10.1111/dom.12703
11. Hong S, Han K, Park CY. The insulin resistance by triglyceride glucose index and risk for dementia: population-based study. Alzheimers Res Ther. 2021;13(1):9. doi:10.1186/s13195-020-00758-4
12. Spatola L, Ferraro PM, Gambaro G, Badalamenti S, Dauriz M. Metabolic syndrome and uric acid nephrolithiasis: insulin resistance in focus. Metabolism. 2018;83:225–233. doi:10.1016/j.metabol.2018.02.008
13. Ando R, Suzuki S, Nagaya T, et al. Impact of insulin resistance, insulin and adiponectin on kidney stones in the Japanese population. Int J Urol. 2011;18(2):131–138. doi:10.1111/j.1442-2042.2010.02690.x
14. Kim S, Chang Y, Jung HS, et al. Glycemic status, insulin resistance, and the risk of nephrolithiasis: a cohort study. Am J Kidney Dis. 2020;76(5):658–668.e1. doi:10.1053/j.ajkd.2020.03.013
15. Weinberg AE, Patel CJ, Chertow GM, Leppert JT. Diabetic severity and risk of kidney stone disease. Eur Urol. 2014;65(1):242–247. doi:10.1016/j.eururo.2013.03.026
16. Zhang D, Li S, Zhang Z, et al. Urinary stone composition analysis and clinical characterization of 1520 patients in central China. Sci Rep. 2021;11(1):6467. doi:10.1038/s41598-021-85723-3
17. Wang L, Cong HL, Zhang JX, et al. Triglyceride-glucose index predicts adverse cardiovascular events in patients with diabetes and acute coronary syndrome. Cardiovasc Diabetol. 2020;19(1):80. doi:10.1186/s12933-020-01054-z
18. Alizargar J, Bai CH, Hsieh NC, Wu SV. Use of the triglyceride-glucose index (TyG) in cardiovascular disease patients. Cardiovasc Diabetol. 2020;19(1):8. doi:10.1186/s12933-019-0982-2
19. Dikaiakou E, Vlachopapadopoulou EA, Paschou SA, et al. Triglycerides-glucose (TyG) index is a sensitive marker of insulin resistance in Greek children and adolescents. Endocrine. 2020;70(1):58–64. doi:10.1007/s12020-020-02374-6
20. Wu TD, Fawzy A, Brigham E, et al. Association of triglyceride-glucose index and lung health: a population-based study. Chest. 2021;160(3):1026–1034. doi:10.1016/j.chest.2021.03.056
21. Wang S, Shi J, Peng Y, et al. Stronger association of triglyceride glucose index than the HOMA-IR with arterial stiffness in patients with type 2 diabetes: a real-world single-centre study. Cardiovasc Diabetol. 2021;20(1):82. doi:10.1186/s12933-021-01274-x
22. Su WY, Chen SC, Huang YT, et al. Comparison of the effects of fasting glucose, hemoglobin A(1c), and triglyceride-glucose index on cardiovascular events in type 2 diabetes mellitus. Nutrients. 2019;11(11):2838. doi:10.3390/nu11112838
23. Ma X, Dong L, Shao Q, et al. Triglyceride glucose index for predicting cardiovascular outcomes after percutaneous coronary intervention in patients with type 2 diabetes mellitus and acute coronary syndrome. Cardiovasc Diabetol. 2020;19(1):31. doi:10.1186/s12933-020-01006-7
24. Okamura T, Hashimoto Y, Hamaguchi M, Obora A, Kojima T, Fukui M. Triglyceride-glucose index is a predictor of incident chronic kidney disease: a population-based longitudinal study. Clin Exp Nephrol. 2019;23(7):948–955. doi:10.1007/s10157-019-01729-2
 © 2021 The Author(s). This work is published and licensed by Dove Medical Press Limited. The full terms of this license are available at https://www.dovepress.com/terms.php and incorporate the Creative Commons Attribution - Non Commercial (unported, v3.0) License.
By accessing the work you hereby accept the Terms. Non-commercial uses of the work are permitted without any further permission from Dove Medical Press Limited, provided the work is properly attributed. For permission for commercial use of this work, please see paragraphs 4.2 and 5 of our Terms.
© 2021 The Author(s). This work is published and licensed by Dove Medical Press Limited. The full terms of this license are available at https://www.dovepress.com/terms.php and incorporate the Creative Commons Attribution - Non Commercial (unported, v3.0) License.
By accessing the work you hereby accept the Terms. Non-commercial uses of the work are permitted without any further permission from Dove Medical Press Limited, provided the work is properly attributed. For permission for commercial use of this work, please see paragraphs 4.2 and 5 of our Terms.