")
Back to Journals » OncoTargets and Therapy » Volume 11
Triclosan treatment decreased the antitumor effect of sorafenib on hepatocellular carcinoma cells
Authors Wu M , Zhao G , Zhuang X, Zhang T, Zhang C, Zhang W, Zhang Z
Received 13 February 2018
Accepted for publication 19 March 2018
Published 18 May 2018 Volume 2018:11 Pages 2945—2954
DOI https://doi.org/10.2147/OTT.S165436
Checked for plagiarism Yes
Review by Single anonymous peer review
Peer reviewer comments 2
Editor who approved publication: Dr Samir Farghaly
Man Wu,1,2 Guanren Zhao,2 Xiaomei Zhuang,1 Tianhong Zhang,1 Ce Zhang,2 Wenpeng Zhang,1 Zhenqing Zhang1
1State Key Laboratory of Toxicology and Medical Countermeasures, Beijing Institute of Pharmacology and Toxicology, Beijing, China; 2Department of Pharmacy, The 309th Hospital of PLA, Beijing, China
Background: Triclosan is a widely applied antimicrobial agent which affects the endocrine system and homeostasis; it may also promote the cirrhosis and hepatocellular carcinoma (HCC) growth in a mice model. The exact roles of triclosan in regulating human hepatocellular carcinoma development and treatment remain unknown.
Methods: MHCC97-H, a highly aggressive HCC cell line, was treated with indicated concentration of triclosan or sorafenib. The expression of drug-resistance genes was examined by qPCR. The clearance or metabolism of sorafenib was determined by liquid chromatograph-mass spectrometer/mass spectrometer (LC-MS/MS). MTT assay was used to examine the MHCC97-H cell proliferation. Nude mice were used to exam the anti-tumor effect of sorafenib on subcutaneous and intrahepatic growth of MHCC97-H cells.
Results: In the present study, triclosan could induce the expression of drug-resistance genes in MHCC97-H cells (a highly aggressive HCC cell line), accelerate the clearance of sorafenib, and attenuate the anti-proliferation effect of this molecular targeted agent in MHCC97-H cells. Triclosan decreased the antitumor effect of sorafenib on subcutaneous and intrahepatic growth of MHCC97-H in nude mice.
Conclusion: By discovering the fact that triclosan treatment enhances sorafenib resistance in HCC cells, this work suggests exposure of triclosan is detrimental to HCC patients during chemotherapy.
Keywords: HCC, triclosan, sorafenib resistance, drug clearance
Introduction
Hepatocellular carcinoma (HCC) is one of the most common human malignancies in China that partially attributes to the large hepatitis virus (hepatitis B virus or hepatitis C virus) carriers population.1,2 Because of the limitations of current clinical diagnosis options, most patients were found to have advanced HCC even at their initial diagnosis, which is no longer suitable for liver transplant or surgical operation.3,4 Advanced HCC patients could not be clinically benefited from systemic chemotherapies and molecular targeting therapies, for example, the first-line agent sorafenib and the second-line agent Regorafenib.5,6 About 30%–40% of patients are initially insensitive to sorafenib, whereas some patients with good initial responses become resistant to sorafenib as the therapy progressed.7 Until now, the mechanism of sorafenib resistance remains unclear.
Triclosan (TCS, 5-chloro-2-(2,4-dichlorophenoxy) phenol) is an antimicrobial agent widely used in general consumer products for personal care and household cleaning.8 Initially, TCS was considered as well tolerated and safe. However, TCS was recently found to affect endocrine and impair muscle contraction.9 In 2014, Yueh et al reported that TCS could promote the progress of cirrhosis and HCC in mice model.10 However, the exact role of TCS in HCC regulation or treatment is still largely unknown. In present work, TCS is showed to induce the expression of drug-resistance genes and promote the clearance of sorafenib in MHCC97-H cells. It is also found that TCS decreased the antitumor effect of sorafenib on subcutaneous and intrahepatic MHCC97-H tumor models. Based on the finding that TCS treatment induces sorafenib resistance in HCC model, this study may help to explain why exposure of TCS is detrimental for HCC patients.
Materials and methods
Cell culture and agents
MHCC97-H cells were purchased from Type Culture Collection of the Chinese Academy of Sciences (Shanghai, China), a Chinese government organization containing typical biological samples, and cultured in DMEM (Thermo Fisher Scientific, Waltham, MA, USA) with 10% fetal bovine serum (Thermo Fisher Scientific) at 5% CO2, 37°C condition.11,12 Five lines of patient-derived HCC cell lines were a gift from Dr Fan Feng in Research Center for Clinical and Translational Medicine, The 302nd Hospital of Chinese PLA, Beijing, China. The collection of patient-derived HCC cell lines was with the approval for experiments from No 302nd hospital, Chinese PLA. Sorafenib (Cat No S7397) and TCS (Cat No S4541) were purchased from Selleck Corporation (Houston, TX, USA). TCS and sorafenib were dissolved separately in DMSO (Sigma Aldrich Co., St. Louis, MO, USA) and diluted by DMEM or other solution. Final concentration of DMSO in cell culture experiments was <1‰.
Examination panel of drug resistance-related genes
Drug resistance-related genes’ panel is mainly focused on drug metabolizing enzymes impacting drug efficacy and resistance (Table 1). Genes including 1) ATP-binding cassette transporters (ABCB1, ABCC1, ABCC2, ABCC3 or ABCG2); 2) cytochrome P450 (CYP; CYP1A2, CYP2B6, CYP2C11, CYP2C19, CYP2C22, CYP2C9, CYP2D6, CYP3A1, CYP3A4, CYP3A5, CYP4A11, CYP4B1); and 3) transferases (catechol-O-methyltransferase [COMT], dihydropyrimidine dehydrogenase [DPYD], thiopurine S-methyltransferase [TPMT], UDP glucuronosyltransferase family 1 member A1 [UGT1A1] or UDP glucuronosyltransferase family 2 member B7 [UGT2B7]); and 4) other drug resistance-related genes (5-hydroxytryptamine receptor 2A [HTR2A], apolipoprotein E [Apo E], aldehyde dehydrogenase 1 family [ALDH1A1], or adrenoceptor α2A [ADRA2A]), which would participate in drug resistance via mechanisms other than drug metabolism or clearance were chosen as control.
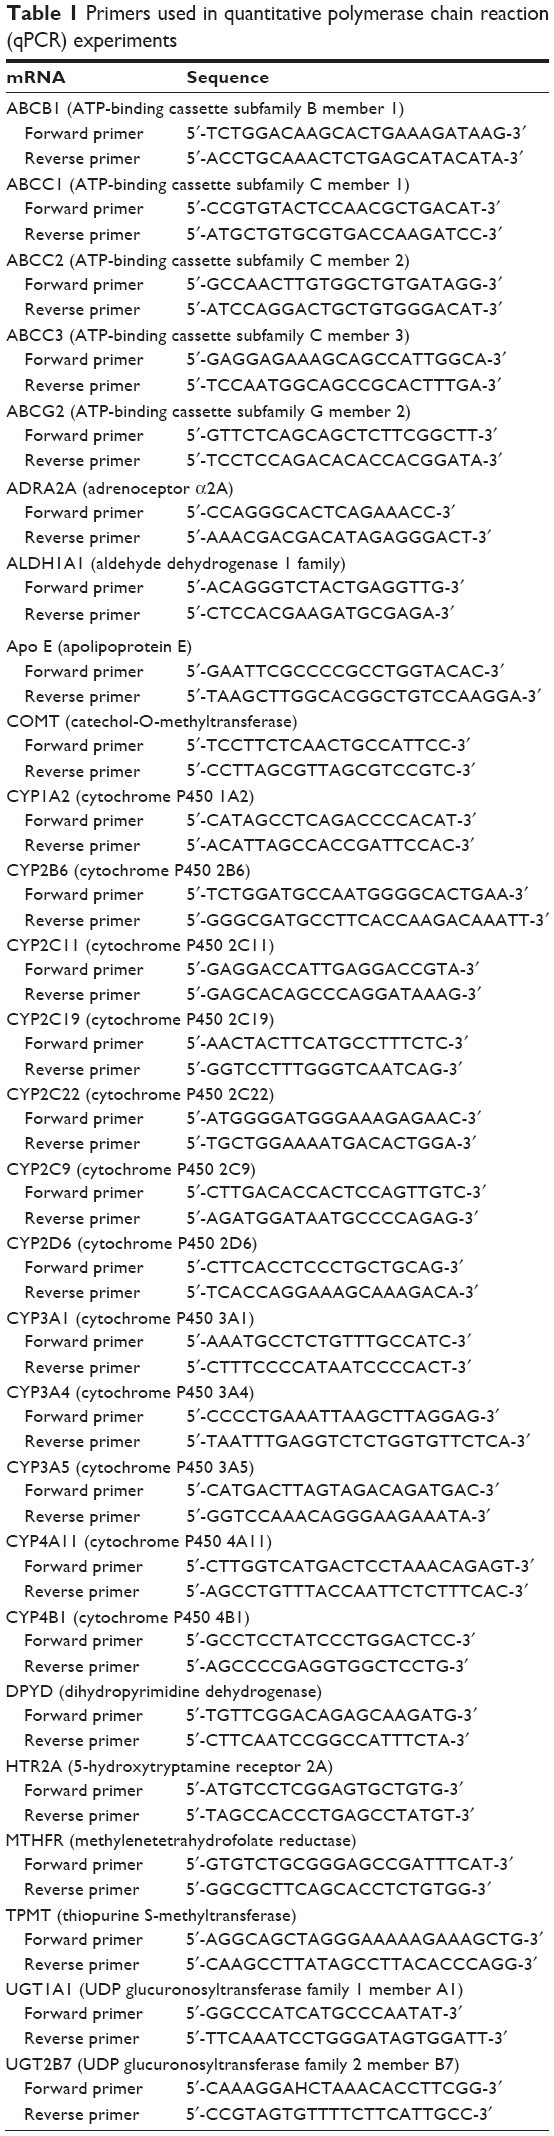 | Table 1 Primers used in quantitative polymerase chain reaction (qPCR) experiments |
Total RNA isolation and quantitative polymerase chain reaction (qPCR)
MHCC97-H cells were treated with indicated concentrations of TCS (0, 30, 100, 300, and 1,000 nmol/L) for 48 hours. Then, cells were harvested, and RNA extracting and qPCR experiments were performed following protocols described previously.13,14 The expression of drug resistance-related gene within MHCC97-H cells was examined by qPCR with primers listed in Table 1. The mRNA level of drug resistance-related genes from qPCR was analyzed by cluster analysis using SPSS software.
Growth inhibition assay of HCC cells
MHCC97-H cells, which were pretreated with solvent control or 300 nmol/L TCS (the maximum-effect concentration for TCS to induce the expression of drug resistance-related genes without cell toxicity), were cultured with sorafenib for specified concentrations and time points. The concentration of sorafenib varies from 0.01 to 10 μmol/L, and the treating time points range from 0 to 72 hours. The viability of HCC cells was examined by MTT, and the absorbance was measured using a multifunctional microplate reader at 490 nm. Inhibition rates were calculated as: inhibition rate = (O.D. 490control group − O.D. 490administration group)/(O.D. 490control group − O.D. 490blank) × 100%.15 Control group refers to cells treated with solvent control or at time 0-point, blank refers to the wells with no cells.
In vivo antitumor effects of sorafenib
All animal experiment protocols were approved by the Institutional Animal Care and Use Committee of the Beijing Institute of Pharmacology and Toxicology. All animal studies were carried out in accordance with the UK Animals (Scientific Procedures) Act 1986 and associated guidelines.
For subcutaneous tumor model, nude mice (severe combined immune deficiency [SCID]) 4–6 weeks of age were provided by the animal center of Beijing Institute of Pharmacology and Toxicology. MHCC97-H cells were injected into mice right flank (5 × 10⁶ cells per inoculation point) as described previously.16,17 Tumor size was monitored every 3 days by measuring length and width with a caliper, the tumor volumes were calculated as length × width × width/2.4 After 2–3 weeks’ growth, when tumors reached 1,000–1,200 mm3 volume, mice were randomly divided into four groups and treated as follows: 1) mice were used as control group; 2) mice were injected intravenously with 500 μg/kg TCS (per day); 3) mice were administered 3 mg/kg oral sorafenib (per 2 days); and 4) mice were injected intravenously with 500 μg/kg TCS (per day) and administered 3 mg/kg oral sorafenib (per 2 days) treatment. After 3 weeks treatment, all mice were sacrificed and the final volume of tumors was measured. Every group contains 10 animals, and similar results were obtained from three repeats.
For intrahepatic model, MHCC97-H cells were directly inoculated into the right lobe of mice liver (1 × 10⁵ cells per animal).20,21 After 21 days,20,21 nude mice were randomly divided to four groups: 1) mice were used as control group; 2) mice were injected intravenously with 500 μg/kg TCS (per day); 3) mice were administered 3 mg/kg oral sorafenib (per 2 days); and 4) mice were injected intravenously with 500 μg/kg TCS (per day) and administered 3 mg/kg oral sorafenib (per 2 days) treatment. After 3 weeks treatment, all mice were injected intravenously with 400 μCi of 18F radiolabeled fluorodeoxyglucose (18F-FDG) and were examined by a positron emission tomography/computed tomography (PET/CT) scanner (Philips Corp., Holland, the Netherlands) as described by Xu et al.21 An NaI (Tl) well counter (China Atom Corp., Beijing, China) was used to measure the radioactivity of organs (liver) to control (blood).20,21 Every group contains six animals, and similar results were obtained from three repeats.
Clearance of sorafenib
To examine whether TCS could accelerate the metabolism or clearance of sorafenib in HCC cells, the clearance curve of sorafenib in HCC cells or tumors was determined. For cell-based experiments, MHCC97-H cells (1 × 10⁸–2 × 10⁸) were cultured with sorafenib at IC50 concentration (1 μmol/L) for 12 hours. Then, cells were divided into two groups and treated with solvent control or with 300 nmol/L concentration of TCS, separately. Cells were harvested at indicated time points and were lysed by sonication. Sorafenib in cells were extracted by acetonitrile (ACN) and quantitated using liquid chromatography/mass spectrometry-mass spectrometry (LC-MS/MS) as described in Allard et al,18 He et al,19 and Feng et al.20
For subcutaneous tumor experiments, MHCC97-H cells were injected into nude mice to form subcutaneous tumors as mentioned above. Sorafenib (2 mg) was dissolved in a mixture of DMSO (10 μL), PEG400 (50 μL), and Tween 80 (30 μL). Then, sorafenib solution was carefully and slowly added with ddH2O to 1 mL total volume accompanied with ultrasonic or churning treatment. The final concentration of sorafenib in this solution is 2 mg/mL. Sorafenib containing solution (Sor-Sol) was injected into HCC subcutaneous tumors (20 μL per tumor). At indicated time points, tumor tissues were harvested, and the sorafenib was extracted by ACN. The amount of sorafenib was measured by LC-MS/MS.18–20
Statistical analysis
Statistical analysis was carried out using Bonferroni’s correction with or without two-way analysis of variance in SPSS statistical software (IBM Corporation, Armonk, NY, USA). The IC50 value of sorafenib on MHCC97-H cells or half-life (t1/2 value) of sorafenib in MHCC97-H was calculated by Origin software (Version No 6.1, OriginLab Corporation, Northampton, MA, USA). A P-value <0.05 was considered statistically significant.
Results
Triclosan enhances the expression of drug resistance-related genes in MHCC97-H cells
To figure out whether TCS promotes sorafenib resistance process, the expression of drug resistance-related genes in TCS-treated MHCC97-H cells, a representative aggressive HCC cell line, was measured by qPCR. As shown in Figure 1, 30 and 100 nmol/L of TCS could increase the expression of some CYPs or ATP-binding cassettes (ABCs; Cluster 1), and 300 nmol/L of TCS was the maximal effective concentration. TCS did not affect the expression of non-drug metabolism-related genes, such as ALDH1A1, Apo E, ADRA2A, DPYD, COMT, TPMT, HTRA, or methylenetetrahydrofolate reductase (MTHFR; Cluster 2). Moreover, as a result from cluster analysis, Figure 1 indicated the relations among these genes. CYPs or ABCs are listed in the same cluster, and there is no difference between the effect of TCS on CYPs, UDP glucuronosyltransferase family (UGTs), or ABCs. ALDH1A1, Apo E, ADRA2A, DPYD, COMT, TPMT, HTRA, or MTHFR was located in another cluster. Results from cluster analysis indicated that TCS mainly induced the expression of genes related to drug metabolism or clearance, and would induce UGT, CYPs, or ABCs by similar mechanisms in MHCC97-H cells.
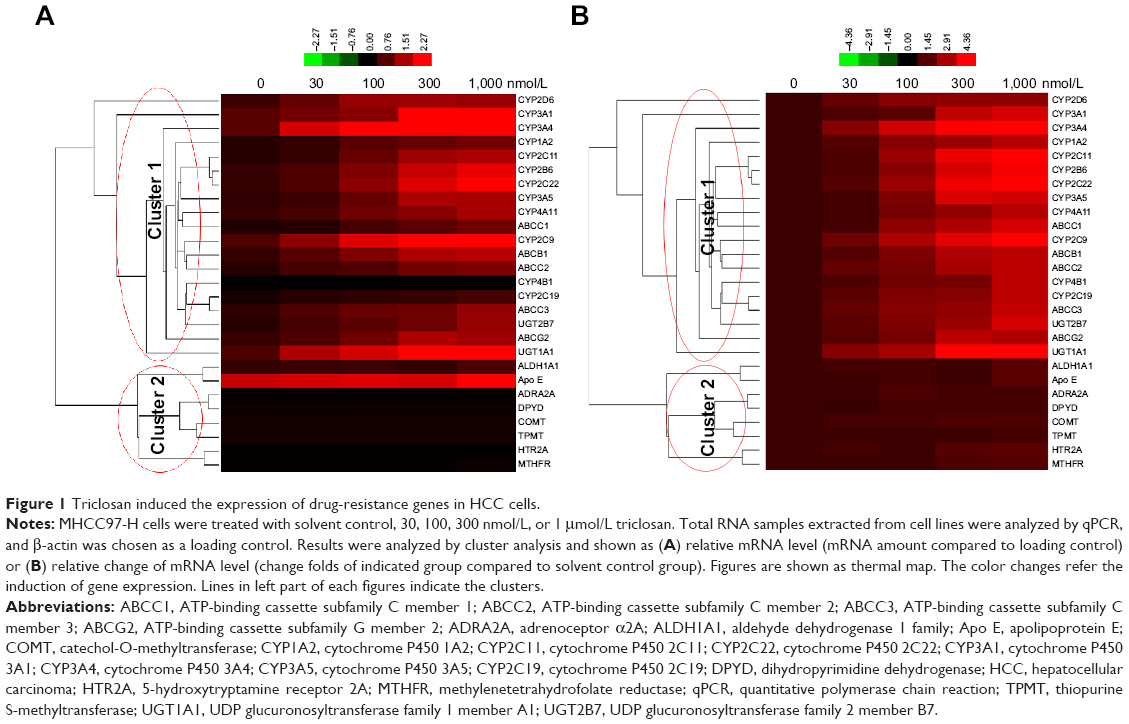 | Figure 1 Triclosan induced the expression of drug-resistance genes in HCC cells. |
The cell viability after TCS treatment is shown in Figure 2 as TCS did not display cytotoxicity on MHCC97-H cells in tested concentration range. Interestingly, the higher concentrations of TCS would promote the proliferation of HCC cells. Therefore, TCS enhanced the drug resistance-related genes expression in MHCC97-H cells. For the following experiments, we chose the maximum-effect concentration (300 nmol/L) without cytotoxicity as a standard concentration for TCS treatment.
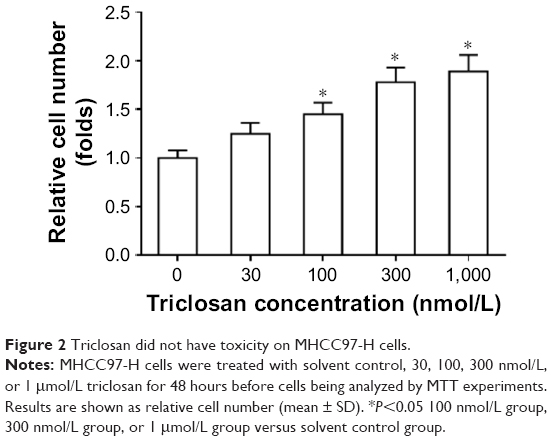 | Figure 2 Triclosan did not have toxicity on MHCC97-H cells. |
Triclosan promotes the clearance of sorafenib in MHCC97-H cells
MHCC97-H cells were treated with 1 μmol/L sorafenib for 12 hours before being washed and incubated in solvent control or 300 nmol/L TCS for another 12 hours. As shown in Figure 3A, sorafenib was cleared within 24 hours in cultured MHCC97-H cells, and the half-life (t1/2 value) is 9.70 ± 0.42 hours. TCS treatment promoted the clearance of sorafenib in MHCC97-H cells as the half-life (t1/2 value) is reduced to 5.43 ± 0.28 hours.
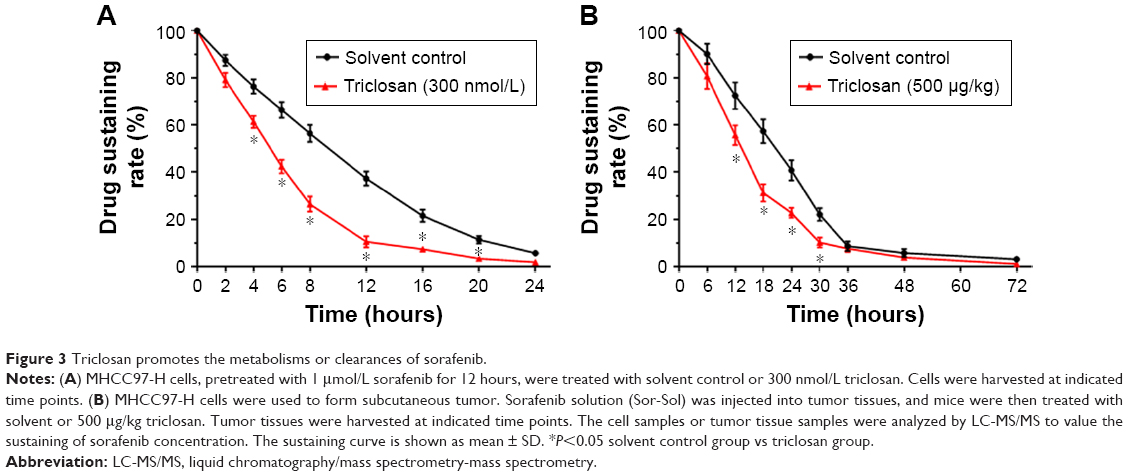 | Figure 3 Triclosan promotes the metabolisms or clearances of sorafenib. |
Moreover, to test the effect of TCS on sorafenib clearance in vivo, MHCC97-H subcutaneous tumor-bearing mice were administrated with sorafenib solution formulation (Sor-Sol) and then treated with solvent control or 500 μg/kg TCS. Tumor tissues were harvested, and the remaining sorafenib in tumors was examined. As shown in Figure 3B, sorafenib was completely cleared in tumor tissues at 48 hours with a half-life (t1/2 value) of 20.56 ± 0.57 hours. Treatment with 500 μg/kg TCS promoted the clearance of sorafenib in HCC tumors and decreased the half-life (t1/2 value) of sorafenib to 12.39 ± 0.77 hours.
Triclosan enhances sorafenib resistance in HCC
The interaction of TCS and sorafenib in cell or cancer models was examined. As shown in Figure 4, despite sorafenib inhibited MHCC97-H cells proliferation in in vitro model, treatment with 300 nmol/L TCS attenuates the antitumor effect of sorafenib, as the IC50 values of sorafenib on MHCC97-H cells elevated from 1.03 ± 0.07 to 9.64 ± 0.79 μmol/L. Next, to further confirm the effect of TCS on sorafenib’s antitumor effect, patient-derived cell lines were used. As shown in Figure 5, treatment with TCS significantly decreased the antitumor activity of sorafenib on patient-derived cell lines. The IC50 values of sorafenib were increased.
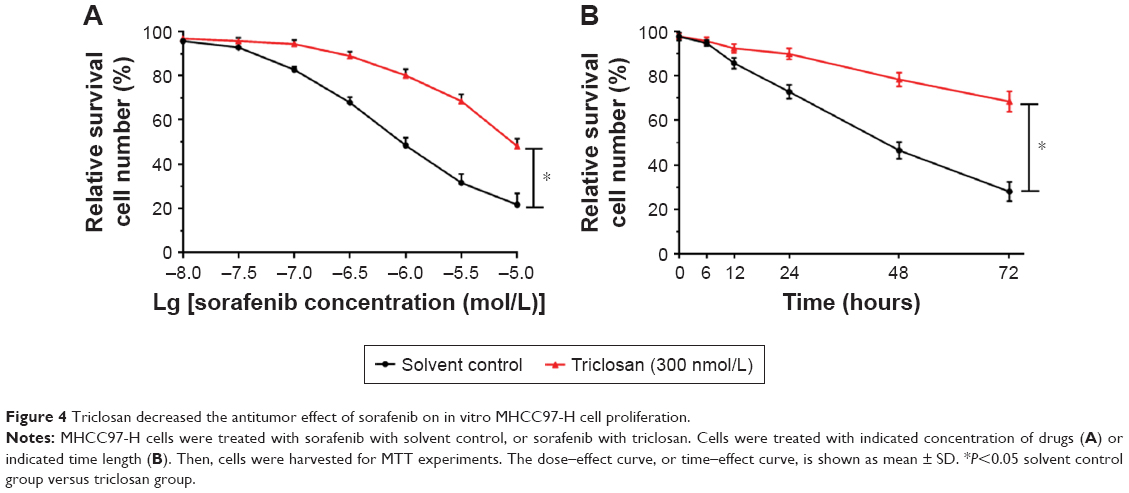 | Figure 4 Triclosan decreased the antitumor effect of sorafenib on in vitro MHCC97-H cell proliferation. |
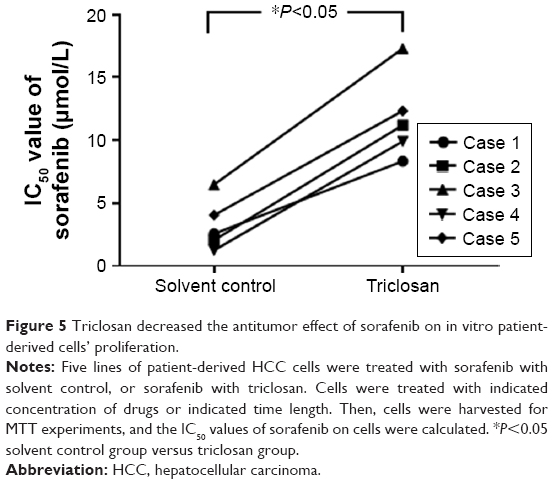 | Figure 5 Triclosan decreased the antitumor effect of sorafenib on in vitro patient-derived cells’ proliferation. |
For in vivo subcutaneous tumors models, the tumor volumes and tumor weights of subcutaneous tumors were evaluated. As shown in Figure 6, treatment with TCS promoted tumor growth, indicating that TCS may act as a tumor promoter, which is consistent with the previous studies.10 Sorafenib, an antitumor drug, significantly inhibited tumor growth compared with control, as predicted. Sorafenib coupled with TCS showed less tumor suppressing effect compared with sorafenib alone, indicating that TCS reduced the antitumor effect of sorafenib.
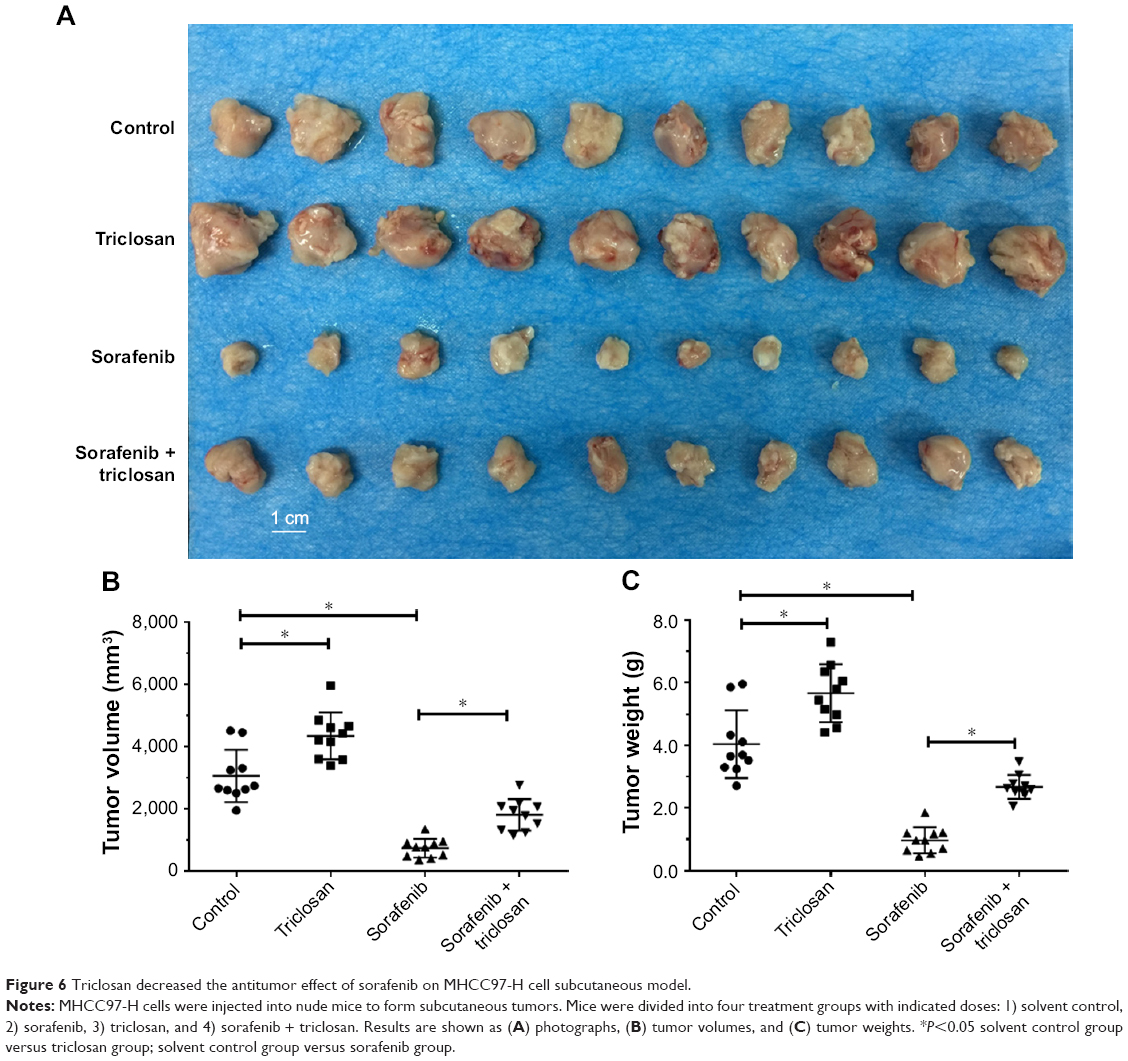 | Figure 6 Triclosan decreased the antitumor effect of sorafenib on MHCC97-H cell subcutaneous model. |
Next, the intrahepatic MHCC97-H tumor model was established, and TCS, sorafenib, or combined treatments were performed. As shown in Figure 7A, the intrahepatic growth of HCC cells in mice liver was identified by PET/CT screening. As expected, TCS enhanced the PET imaging in liver location compared with solvent control, whereas sorafenib treatment decreased the PET imaging in liver location of mice. TCS attenuated the antitumor effect of sorafenib on intrahepatic growth of HCC cells. The PET imaging was further confirmed by liver-to-blood radioactivation examination (Figure 7A). Also, animals were sacrificed, and livers were collected to identify the nodules formed by HCC cells in liver organs. As shown in Figure 7B, TCS promoted the growth of HCC cells in mice livers, and the nodules formed by HCC cells were larger than those in the control group. Sorafenib treatment significantly attenuated the intrahepatic growth of HCC cells in mice’s liver, and the nodules formed by HCC cells were shrinking compared with those in the control group. TCS attenuated the antitumor effect of sorafenib on intrahepatic growth of HCC cells. Liver organ images were also supported by the PET imaging of separated liver organs (Figure 7B). Taken together, both in vitro and in vivo data indicated that TCS enhanced the sorafenib resistance in HCC tumor models.
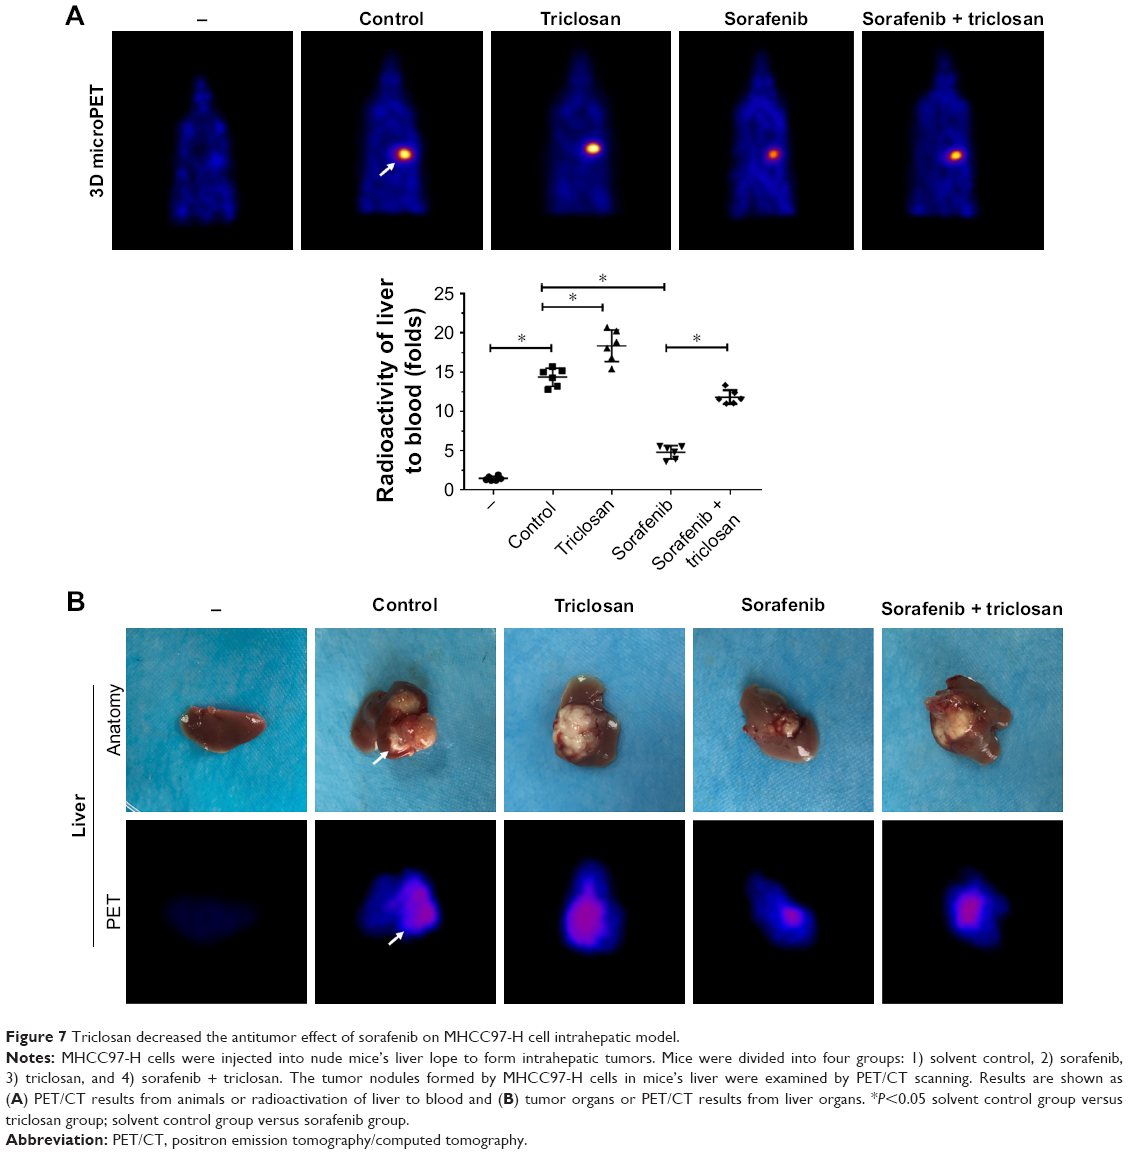 | Figure 7 Triclosan decreased the antitumor effect of sorafenib on MHCC97-H cell intrahepatic model. |
Discussion
Although molecular targeting agent sorafenib was considered as a new hope for patients with advanced HCC, the overall prognosis and survival are still far from satisfaction.21–23 Due to the genetic heterogeneity of HCC, some patients are intrinsically resistant to sorafenib, whereas for some other patients, acquired resistance to sorafenib often occur during treatment.24 Zhu et al, systemically summarized the potential mechanisms of sorafenib resistance in their recent review.7 However, the environmental inducer of sorafenib resistance remains practically unknown. In the present work, we showed that TCS induced the expression of several drug resistance-related genes in mice, promoted the clearance of sorafenib in both HCC cells and tumors, and enhanced the sorafenib resistance in MHCC97-H cells.
The exposure of environmental chemicals, for example, environmental poison or environmental endocrine-disrupting chemicals, remains a public health problem.25 Certain chemicals can disrupt endocrine system and homeostasis.25 TCS can be absorbed through human skin and oral mucosa and have been found persist in various human tissues and fluids.26 Previously, TCS was considered as an endocrine disruptor, which promoted the progress of some endocrine-related human cancers, for example, breast cancer, similar to bisphenol A (BPA).27–30 Yueh et al showed that TCS promotes the progress of cirrhosis and HCC in mice model.10 However, the exact role of TCS in human HCC was unknown. This work reported the roles of TCS in inducing sorafenib resistance for the first time. Drug resistance-related gene clusters chosen in this work include CYP 450, ATP-binding cassette, and other transferases. These genes mediate the clearance of chemical drugs, indicating TCS may induce the expression of drug resistance-related genes to accelerate sorafenib clearance. Interestingly, our results also showed that TCS did not affect the expression of ALDH1A1, Apo E, ADRA2A, DPYD, COMT, TPMT, HTRA, or MTHFR, which all participate in drug resistance, but not by promoting drug metabolism or clearance.31–40 These results confirmed the specificity of TCS function.
Moreover, nuclear receptors, for example, peroxisome proliferators-activated receptor (PPAR), pregnane X receptor (PXR), or constitutive androstane receptor (CAR), mediate the transcription of drug-resistance genes upon agonist activation.40–46 Yueh et al indicated that TCS may be an agonist of PPAR, PXR, or CAR.10 Therefore, it is valuable to reveal whether TCS interacts with nuclear receptors in the follow-up investigations.
Conclusion
Our study revealed TCS promotes the clearance of sorafenib and induces sorafenib resistance in HCC cell line and in vivo tumor models, suggesting that exposure of TCS is extremely harmful for HCC patients undergoing sorafenib chemotherapy.
Acknowledgments
We thank Dr Fan Feng from the Research Center for Clinical and Translational Medicine, The 302nd Hospital of Chinese PLA, Beijing 100039, China for providing cell lines and supporting the PET/CT screening experiments. This work was supported by grants from the National Natural Science Foundation of China (numbers 81503141 and 81373472) and the Major Project on Drug Research and Development for the 13th Five-Year Plan of China (number 2018ZX09711003).
Author contributions
All authors made substantial contributions to the design and conception; acquisition, analysis, or interpretation of data, took part in either drafting or revising the manuscript, gave final approval of the version to be published, and agreed to be accountable for all aspects of the work in ensuring that questions related to the accuracy or integrity of any part of the work are appropriately investigated and resolved.
Disclosure
The authors report no conflicts of interest in this work.
References
Bruix J, Qin S, Merle P, et al; RESORCE Investigators. Regorafenib for patients with hepatocellular carcinoma who progressed on sorafenib treatment (RESORCE): a randomised, double-blind, placebo-controlled, phase 3 trial. Lancet. 2017;389(10064):56–66. | ||
Wang FS, Fan JG, Zhang Z, Gao B, Wang HY. The global burden of liver disease: the major impact of China. Hepatology. 2014;60(6):2099–2108. | ||
Kulik L, Heimbach JK, Zaiem F, et al. Therapies for patients with hepatocellular carcinoma awaiting liver transplantation: a systematic review and meta-analysis. Hepatology. 2018;67(1):381–400. | ||
Jia H, Yang Q, Wang T, et al. Rhamnetin induces sensitization of hepatocellular carcinoma cells to a small molecular kinase inhibitor or chemotherapeutic agents. Biochim Biophys Acta. 2016;1860(7):1417–1430. | ||
Kissel M, Berndt S, Fiebig L, et al. Antitumor effects of regorafenib and sorafenib in preclinical models of hepatocellular carcinoma. Oncotarget. 2017;8(63):107096–107108. | ||
Gyawali B, Prasad V. Me too-drugs with limited benefits – the tale of regorafenib for HCC. Nat Rev Clin Oncol. 2018;15(1):62. | ||
Zhu YJ, Zheng B, Wang HY, Chen L. New knowledge of the mechanisms of sorafenib resistance in liver cancer. Acta Pharmacol Sin. 2017;38(5):614–622. | ||
Goodman M, Naiman DQ, LaKind JS. Systematic review of the literature on triclosan and health outcomes in humans. Crit Rev Toxicol. 2017;25:1–51. | ||
Weatherly LM, Gosse JA. Triclosan exposure, transformation, and human health effects. J Toxicol Environ Health B Crit Rev. 2017;20(8):447–469. | ||
Yueh MF, Taniguchi K, Chen S, et al. The commonly used antimicrobial additive triclosan is a liver tumor promoter. Proc Natl Acad Sci U S A. 2014;111(48):17200–17205. | ||
Chen Y, Feng F, Gao X, et al. MiRNA153 reduces effects of chemotherapeutic agents or small molecular kinase inhibitor in HCC cells. Curr Cancer Drug Targets. 2015;15(3):176–187. | ||
Hou J, Hong Z, Feng F, et al. A novel chemotherapeutic sensitivity-testing system based on collagen gel droplet embedded 3D-culture methods for hepatocellular carcinoma. BMC Cancer. 2017;17(1):729. | ||
Ji Q, Xu X, Li L, et al. miR-216a inhibits osteosarcoma cell proliferation, invasion and metastasis by targeting CDK14. Cell Death Dis. 2017;8(10):e3103. | ||
Liang Y, Xu X, Wang T, et al. The EGFR/miR-338-3p/EYA2 axis controls breast tumor growth and lung metastasis. Cell Death Dis. 2017;8(7):e2928. | ||
Zhao J, Bai Z, Feng F, et al. Cross-talk between EPAS-1/HIF-2α and PXR signaling pathway regulates multi-drug resistance of stomach cancer cell. Int J Biochem Cell Biol. 2016;72:73–88. | ||
Liu R, Zhao D, Zhang X, et al. A20 enhances the radiosensitivity of hepatocellular carcinoma cells to 60Co-γ ionizing radiation. Oncotarget. 2017;8(54):93103–93116. | ||
An L, Li DD, Chu HX, et al. Terfenadine combined with epirubicin impedes the chemo-resistant human non-small cell lung cancer both in vitro and in vivo through EMT and Notch reversal. Pharmacol Res. 2017;124:105–115. | ||
Allard M, Khoudour N, Rousseau B, et al. Simultaneous analysis of regorafenib and sorafenib and three of their metabolites in human plasma using LC-MS/MS. J Pharm Biomed Anal. 2017;142:42–48. | ||
He Y, Zhou L, Gao S, et al. Development and validation of a sensitive LC-MS/MS method for simultaneous determination of eight tyrosine kinase inhibitors and its application in mice pharmacokinetic studies. J Pharm Biomed Anal. 2018;148:65–72. | ||
Feng F, Jiang Q, Cao S, et al. Pregnane X receptor mediates Sorafenib resistance in advanced hepatocellular carcinoma. Biochim Biophys Acta. 2018;1862:1017–1030. | ||
Xu X, Fan Z, Liang C, et al. A signature motif in LIM proteins mediates binding to checkpoint proteins and increases tumour radiosensitivity. Nat Commun. 2017;8:14059. | ||
Casadei Gardini A, Faloppi L, De Matteis S, et al. Metformin and insulin impact on clinical outcome in patients with advanced hepatocellular carcinoma receiving sorafenib: validation study and biological rationale. Eur J Cancer. 2017;86:106–114. | ||
Gomaa A, Waked I. Management of advanced hepatocellular carcinoma: review of current and potential therapies. Hepatoma Res. 2017;3:112–122. | ||
Kim DW, Talati C, Kim R. Hepatocellular carcinoma (HCC): beyond sorafenib-chemotherapy. J Gastrointest Oncol. 2017;8(2):256–265. | ||
Wu J, Li A, Yang J, Lu Y, Li J. Efficacy and safety of TACE in combination with sorafenib for the treatment of TACE-refractory advanced hepatocellular carcinoma in Chinese patients: a retrospective study. Onco Targets Ther. 2017;10:2761–2768. | ||
Rattan S, Zhou C, Chiang C, Mahalingam S, Brehm E, Flaws JA. Exposure to endocrine disruptors during adulthood: consequences for female fertility. J Endocrinol. 2017;233(3):R109–R129. | ||
Ma H, Yao Y, Wang C, et al. Transcription factor activity of estrogen receptor α activation upon nonylphenol or bisphenol A treatment enhances the in vitro proliferation, invasion, and migration of neuroblastoma cells. Onco Targets Ther. 2016;9:3451–3463. | ||
Bilsland E, van Vliet L, Williams K, et al. Plasmodium dihydrofolate reductase is a second enzyme target for the antimalarial action of triclosan. Sci Rep. 2018;8(1):1038. | ||
Lee GA, Choi KC, Hwang KA. Treatment with phytoestrogens reversed triclosan and bisphenol A-induced anti-apoptosis in breast cancer cells. Biomol Ther (Seoul). 2018 [Epub ahead of print]. | ||
Lee GA, Hwang KA, Choi KC. Inhibitory effects of 3,3′-diindolylmethane on epithelial-mesenchymal transition induced by endocrine disrupting chemicals in cellular and xenograft mouse models of breast cancer. Food Chem Toxicol. 2017;109(Pt 1):284–295. | ||
Park JW, Jung KH, Lee JH, Moon SH, Cho YS, Lee KH. Inhibition of aldehyde dehydrogenase 1 enhances the cytotoxic effect of retinaldehyde on A549 cancer cells. Oncotarget. 2017;8:99382–99393. | ||
Xiao Y, Li P, Cheng Y, Zhang Q, Wang F. Effect of α-linolenic acid-modified low molecular weight chondroitin sulfate on atherosclerosis in apoE-deficient mice. Biochim Biophys Acta. 2016;1860:2589–2597. | ||
Martin RD, Sun Y, Bourque K, et al. Receptor- and cellular compartment-specific activation of the cAMP/PKA pathway by α1-adrenergic and ETA endothelin receptors. Cell Signal. 2018;44:43–50. | ||
Merlin J, Sato M, Nowell C, et al. The PPARγ agonist rosiglitazone promotes the induction of brite adipocytes, increasing β-adrenoceptor-mediated mitochondrial function and glucose uptake. Cell Signal. 2018;42:54–66. | ||
Zhu WP, Liu ZY, Zhao YM, et al. Dihydropyrimidine dehydrogenase predicts survival and response to interferon-α in hepatocellular carcinoma. Cell Death Dis. 2018;9:69. | ||
Bolger GB. The RNA-binding protein SERBP1 interacts selectively with the signaling protein RACK1. Cell Signal. 2017;35:256–263. | ||
Guo S, Carter RL, Grisanti LA, Koch WJ, Tilley DG. Impact of paroxetine on proximal β-adrenergic receptor signaling. Cell Signal. 2017;38:127–133. | ||
Patil NA, Basu B, Deobagkar DD, Apte SK, Deobagkar DN. Putative DNA modification methylase DR_C0020 of Deinococcus radiodurans is an atypical SAM dependent C-5 cytosine DNA methylase. Biochim Biophys Acta. 2017;1861:593–602. | ||
Ding G, Wang Y, Chen Y, et al. Methylenetetrahydrofolate reductase tagging polymorphisms are associated with risk of esophagogastric junction adenocarcinoma: a case-control study involving 2,740 Chinese Han subjects. Oncotarget. 2017;8:111482–111494. | ||
Lee GA, Choi KC, Hwang KA. Kaempferol, a phytoestrogen, suppressed triclosan-induced epithelial-mesenchymal transition and metastatic-related behaviors of MCF-7 breast cancer cells. Environ Toxicol Pharmacol. 2017;49:48–57. | ||
Ni J, Zhou LL, Ding L, et al. PPARγ agonist efatutazone and gefitinib synergistically inhibit the proliferation of EGFR-TKI-resistant lung adenocarcinoma cells via the PPARγ/PTEN/Akt pathway. Exp Cell Res. 2017;361(2):246–256. | ||
Kim SW, Hasanuzzaman MD, Cho M, et al. Role of 14-3-3 sigma in over-expression of P-gp by rifampin and paclitaxel stimulation through interaction with PXR. Cell Signal. 2017;31:124–134. | ||
Brewer CT, Chen T. PXR variants: the impact on drug metabolism and therapeutic responses. Acta Pharm Sin B. 2016;6(5):441–449. | ||
Jusu S, Presley JF, Kremer R. Phosphorylation of human retinoid X receptor α at serine 260 impairs its subcellular localization, receptor interaction, nuclear mobility, and 1α,25-Dihydroxyvitamin D3-dependent DNA binding in Ras-transformed keratinocytes. J Biol Chem. 2017;292(4):1490–1509. | ||
Lundon DJ, Boland A, Prencipe M, et al. The prognostic utility of the transcription factor SRF in docetaxel-resistant prostate cancer: in-vitro discovery and in-vivo validation. BMC Cancer. 2017;17(1):163. | ||
Liu CL, Lim YP, Hu ML. Fucoxanthin attenuates rifampin-induced cytochrome P450 3A4 (CYP3A4) and multiple drug resistance 1 (MDR1) gene expression through pregnane X receptor (PXR)-mediated pathways in human hepatoma HepG2 and colon adenocarcinoma LS174T cells. Mar Drugs. 2012;10(1):242–257. |
 © 2018 The Author(s). This work is published and licensed by Dove Medical Press Limited. The full terms of this license are available at https://www.dovepress.com/terms.php and incorporate the Creative Commons Attribution - Non Commercial (unported, v3.0) License.
By accessing the work you hereby accept the Terms. Non-commercial uses of the work are permitted without any further permission from Dove Medical Press Limited, provided the work is properly attributed. For permission for commercial use of this work, please see paragraphs 4.2 and 5 of our Terms.
© 2018 The Author(s). This work is published and licensed by Dove Medical Press Limited. The full terms of this license are available at https://www.dovepress.com/terms.php and incorporate the Creative Commons Attribution - Non Commercial (unported, v3.0) License.
By accessing the work you hereby accept the Terms. Non-commercial uses of the work are permitted without any further permission from Dove Medical Press Limited, provided the work is properly attributed. For permission for commercial use of this work, please see paragraphs 4.2 and 5 of our Terms.