")
Back to Journals » Clinical Epidemiology » Volume 14
Trends in the Annual Consultation Incidence and Prevalence of Low Back Pain and Osteoarthritis in England from 2000 to 2019: Comparative Estimates from Two Clinical Practice Databases
Authors Yu D , Missen M, Jordan KP, Edwards JJ, Bailey J, Wilkie R , Fitzpatrick J, Ali N, Niblett P, Peat G
Received 22 September 2021
Accepted for publication 6 January 2022
Published 17 February 2022 Volume 2022:14 Pages 179—189
DOI https://doi.org/10.2147/CLEP.S337323
Checked for plagiarism Yes
Review by Single anonymous peer review
Peer reviewer comments 4
Editor who approved publication: Professor Irene Petersen
Dahai Yu,1 Matthew Missen,1 Kelvin P Jordan,1 John J Edwards,1 James Bailey,1 Ross Wilkie,1 Justine Fitzpatrick,2 Nuzhat Ali,2 Paul Niblett,2 George Peat1
1Primary Care Centre versus Arthritis, School of Medicine, Keele University, Keele, Staffordshire, UK; 2Office for Health Improvement and Disparities, Department of Health and Social Care, London, UK
Correspondence: Dahai Yu, Email [email protected]
Purpose: To compare estimates of annual person-consulting incidence and prevalence of low back pain (LBP) and osteoarthritis for two national English electronic health record databases (Clinical Practice Research Datalink (CPRD) Aurum and CPRD GOLD).
Patients and Methods: Retrospective, population-based, longitudinal cohort study. LBP and osteoarthritis cases were defined using established codelists in people aged ≥ 15 and ≥ 45 years, respectively. Incident cases were new recorded cases in a given calendar year with no relevant consultation in the previous 3 years (denominator = exact person-time in the same calendar year for the at-risk population). Prevalent cases were individuals with ≥ 1 consultation for the condition of interest recorded in a given calendar year, irrespective of prior consultations for the same condition (denominator = all patients with complete registration history in the previous 3 years). We estimated age-sex standardised incidence and annual (12-month period) prevalence for both conditions in 2000– 2019, overall, and by sex, age group, and region.
Results: Standardised incidence and prevalence of LBP from Aurum were lower than those from GOLD until 2014, after which estimates were similar. Both databases showed recent declines in incidence and prevalence of LBP: declines began earlier in GOLD (after 2012– 2014) than Aurum (after 2014– 2015). Standardised incidence (after 2011) and prevalence of osteoarthritis (after 2003) were higher in Aurum than GOLD and showed different trends: incidence and prevalence were stable or increasing in Aurum, decreasing in GOLD. Stratified estimates in CPRD Aurum suggested consistently higher occurrence among women, older age groups, and those living in the north of England.
Conclusion: Comparative analyses of two English databases produced conflicting estimates and trends for two common musculoskeletal conditions. Aurum estimates appeared more consistent with external sources and may be useful for monitoring population musculoskeletal health and healthcare demand, but they remain sensitive to analytic decisions and data quality.
Keywords: musculoskeletal, electronic health records, epidemiologic methods, osteoarthritis, low back pain, primary care
Plain Language Summary
Primary care electronic health record databases could be useful for monitoring the rate of common, painful musculoskeletal conditions in the population. However, counting cases is not straightforward, and different databases have their own merits and can give differing results. This matters if the estimates are to be relied upon by policymakers and planners.
We analysed data from two large, national databases covering general practices in England. CPRD GOLD, which collates data from practices utilising Vision® software, has been used for research for over 30 years (www.cprd.com). However, the number of practices from England contributing to GOLD has reduced in recent years as practices change software. CPRD Aurum is a newer database, growing in size, which collates data from practices using EMIS Web® software. We looked at the rate of people consulting for low back pain and osteoarthritis in each year between 2000 and 2019. We found that the two databases gave conflicting estimates. Aurum estimates after 2004 appeared more consistent with other independent sources. After discounting population ageing, the underlying rate of low back pain has not changed much, whereas osteoarthritis has shown a steady increase. Consulting for either condition 1) tends to increase as we get older, 2) is higher in women than in men, and 3) is higher in the north of the country compared to the south.
These data, when carefully handled and interpreted, could be a valuable addition to national surveys for understanding musculoskeletal health and care in the population.
Introduction
Musculoskeletal disorders (MSD) are the main drivers of non-communicable disease disability burden in most countries and regions worldwide.1 In England, they account for an estimated 21% of total years lived with disability (YLD),2 6.2 million working days lost,3 12–14% of all primary care consultations in people aged 15 years and over,4,5 and the third largest programme budget for NHS healthcare expenditure.6 The need for better information for chronic disease surveillance of MSD has been highlighted by the Chief Medical Officer7 and in successive Global Burden of Disease reports for England.8,9
Public Health England’s 5-year strategy for musculoskeletal health (2019–2024) includes a commitment to
high quality, accessible data and intelligence tools to support surveillance and reduce unwarranted variation of musculoskeletal conditions across the population pathway.10
Aside from Global Burden of Disease-modelled estimates, national and subnational population profiles in England currently rely on a relatively narrow range of indicators derived from national population surveys such as Health Survey for England and the General Practice Patient Survey.11 Primary care electronic health record (EHR) databases are underutilized but potentially important sources of data given their continuous nature, their size and population coverage, and the fact that the primary healthcare setting is where most cases of common, disabling MSDs present and are managed. These sources are already used for tracking annual estimates of the prevalence of osteoporosis and rheumatoid arthritis; conditions for which recording in UK general practice have been incentivised through the General Medical Contract. Low back pain, osteoarthritis, and other regional pain syndromes are the major contributors to population disability, but there are significant challenges in obtaining useful and robust estimates from primary care EHR databases for these conditions: their classification is typically less standardised; a multitude of symptom and diagnostic problem codes may be used by practitioners; completeness of recording has not been incentivised; only a proportion of sufferers may present to primary healthcare in a given period. Nor can these factors be assumed to be constant between subpopulations or over time. In previous studies, we found evidence of strong period effects and increasing under-recording of osteoarthritis diagnostic coding in a UK database.12,13 Despite these challenges, the rate at which new cases present to primary care, and the proportion of the population who consult for these MSDs represent potentially important indicators of demand for healthcare as well as measures of musculoskeletal health in the population that warrant investigation as part of a wider suite of population health indicators.
The present study focussed on low back pain and osteoarthritis, which account for over half of all YLDs attributed to MSDs. We identified only four previously published studies of low back consultation prevalence6,14–16 and eight reporting consultation incidence or prevalence estimates for osteoarthritis12,14–20 derived from English primary care electronic health record data (Supplementary Data Tables S1–S4). National estimates for low back pain are either lacking or need updating, whereas for osteoarthritis, the most recent studies have reported an unexpected decline in annual incidence rates up to 2017. These studies have been based on the national Clinical Practice Research Datalink (CPRD GOLD) database, which has historically drawn data from general practices using the Vision® software system.21 Use of this system in English general practices, however, has been declining over time, resulting in CPRD GOLD coverage increasingly focussed on practices in Greater Manchester, Birmingham, London, and the south of England,22 and only 50 contributing practices in England as of April 2021.23 In response, CPRD launched the Aurum database in October 201724 which extracts data from general practices using the EMIS Web® software system, now used by over half of English general practices.
In this study, we compare national estimates and trends obtained from CPRD Aurum and CPRD GOLD for the annual person-consulting incidence and prevalence of low back pain and osteoarthritis for England over the 20-year period spanning 2000–2019 as there was strong period effect before 2000 in CPRD GOLD identified in our previous study.16 Then, using data from the larger CPRD Aurum database, we provide new estimates of the above, stratified by age, sex, and region.
Patients and Methods
Study Design
A retrospective, population-based, longitudinal cohort study was implemented to estimate both annual incidence and prevalence between 2000 and 2019 using English primary care electronic health record databases.
Data Sources and Study Population
CPRD GOLD and Aurum are complementary databases including anonymised data from patient electronic health records in primary care on demographics, diagnoses, symptoms, prescriptions, referrals, immunizations, lifestyle factors, tests and results. Patient-level data linkages to national secondary care databases, disease registries, death registrations and deprivation measures are available for both. Practices contributing to GOLD undertook training in morbidity coding and needed to reach an up-to-standard recording mark. Up-to-standard dates were not yet available within Aurum at the time of our study.25 Both CPRD GOLD and Aurum are available to researchers worldwide although at a cost. To access the CPRD database, researchers should follow the process from CPRD (https://www.cprd.com/research-applications).
As of April 2021, CPRD GOLD included data on 20 million patients from 964 practices across the UK, of whom 3.1 million were active and current contributors (5% of the UK population).23 As of February 2021, CPRD Aurum included data on 39.7 million patients from 1489 practices, of whom 13.3 million were alive and current contributors (20% of the population of England).26 In the current study, we included CPRD Aurum practices known to have switched from using Vision® software, ie, we permitted overlapping patient and practice membership between GOLD and Aurum analyses. For example, based on the ‘VisionToEmisMigrators’ file, 14.1% of Aurum practices contributing data to low back pain prevalence estimates also contributed data to estimates in GOLD.
Case Definitions
In UK primary care, symptom and diagnosis problems have historically been recorded using Read codes. SNOMED codes began to replace Read codes from April 2018. Practices using EMIS Web® can also use local EMIS codes. High levels of validity across a range of diagnostic coding have been previously reported within CPRD27 and further supporting evidence of diagnostic validity within Aurum is emerging.28,29
Using established Read codelists (codelists available from www.keele.ac.uk/mrr), and with reference existing clinical practice guidelines and previous consensus exercises,30,31 we defined cases of non-specific low back pain as having at least one clinical event with a recorded diagnosis of low back pain in persons aged 15 years and over within a given calendar year. Osteoarthritis cases had at least one clinical event with a recorded diagnosis of osteoarthritis (N05.”Osteoarthritis and allied disorders”) in persons aged 45 years and over within a given calendar year. A single record of a relevant code within the primary care EHR within a calendar year of interest, and other similar definitions, have been used in previous studies6,12,14–20,32–41 and have generally higher sensitivity but lower specificity than more restrictive algorithms requiring multiple records.42
Defining the At-Risk Population
To determine annual prevalence, our denominator population was all patients with complete registration history for the previous three calendar years. For the calculation of annual incidence, they also had to have no coded record of the condition of interest (low back pain, osteoarthritis) in those 3 years. The numerator population was all patients within the denominator population who had a coded record of the condition of interest during the year examined. Estimates are sensitive to the “look back period” and method chosen to exclude prevalent cases.12 From previous analyses, a three-year “look back period” to exclude prevalent cases appears to be optimal for several common musculoskeletal disorders and across multiple years.12 (Illustrative examples of the selection of numerator and denominator for incidence of low back pain incidence and prevalence are provided in Supplementary Data Figures S1 and S2).
Statistical Analysis
Annual person-consultation incidence and prevalence, expressed per 1000 person-years, were produced for the period 2000–2019 in CPRD Aurum and separately in CPRD GOLD. Incidence and prevalence were calculated as the number of cases with one or more relevant recorded clinical events in the calendar year divided by the total person-time of follow-up in the at-risk population for that calendar year. Person-time was censored by the earliest of the following outcomes: relevant consultation, death, transfer/de-registration from contributing practice, or 31 December. Age-sex-standardized incidence and prevalence were estimated using the mid-2019 England population (ONS code: E92000001) as the standard with 95% confidence intervals estimated by Poisson regression. To explore changes over time in the overall trends of incidence and prevalence in CPRD GOLD and Aurum, we performed joinpoint analyses using the Joinpoint regression program (version 4.9.0.0, Statistical Research and Applications Branch, National Cancer Institute, 2021). Annual percentage changes in standardised incidence and prevalence were estimated in each period segment defined by the joinpoints. The number of joinpoints (0–-3) selected for each model was based on optimal value of the Bayesian Information Criterion.
Sensitivity Analyses
To explore the possibility of simplified prevalence estimation, we repeated prevalence estimates but removing the requirement for 3 years of prior complete registration for both numerator and denominator.
Ethical Approval
The study was approved by the Independent Scientific Advisory Committee for CPRD research (protocol reference: 20_054R). No further ethical permissions were required for the analyses of these anonymized patient-level data.
Patient and Public Involvement
There was no patient or public involvement in the study.
Results
Comparison of Overall Estimates from CPRD Aurum and CPRD GOLD Databases
The size of the available at-risk population within Aurum grew steadily between 2000 and 2019 to reach over 10 times the size of GOLD in 2019 (eg, for low back pain prevalence estimation, the denominator was 7,274,733 in Aurum vs 704,293 in GOLD). The size of the at-risk population in GOLD for our estimates peaked in 2008–2010 (eg, 2,619,616 in 2010 for low back pain prevalence estimation; see Supplementary Data Tables S5–S8).
Low Back Pain
Age-sex standardised estimates from Aurum of annual consultation incidence and prevalence for low back pain and osteoarthritis rose sharply in 2000–2004. The following comparisons of Aurum and GOLD estimates therefore focus on the period 2005–2019. During this period, the annual incidence of low back pain in Aurum increased to 2014 before returning to 2005 levels (32.18 (32.12 to 32.23) (2005), 36.15 (36.09 to 36.20) (2014), 30.79 (30.74 to 30.84) (2019) per 1000 adults aged 15 years and over). (Figure 1; Table 1; Supplementary Data Tables S5 and S6; Supplementary Data Figure S17) Annual prevalence estimates for low back pain showed a similar pattern in Aurum as seen for incidence (43.33 (43.27 to 43.39) (2005), 51.26 (51.19 to 51.32) (2014), 42.04 (41.98 to 42.10) (2019) per 1000). Incidence estimates from GOLD were initially much higher than Aurum, before falling to converge with those from Aurum (42.73 (42.67 to 42.79) (2005), 40.18 (40.12 to 40.23) (2014), 30.32 (30.27 to 30.37) (2019). Prevalence estimates in GOLD also began higher than in Aurum (56.35 (56.29 to 56.42) (2005)) but dropped sharply from 2012 and were then similar although slightly lower than estimates in Aurum (37.97 (37.92 to 38.03) (2019)).
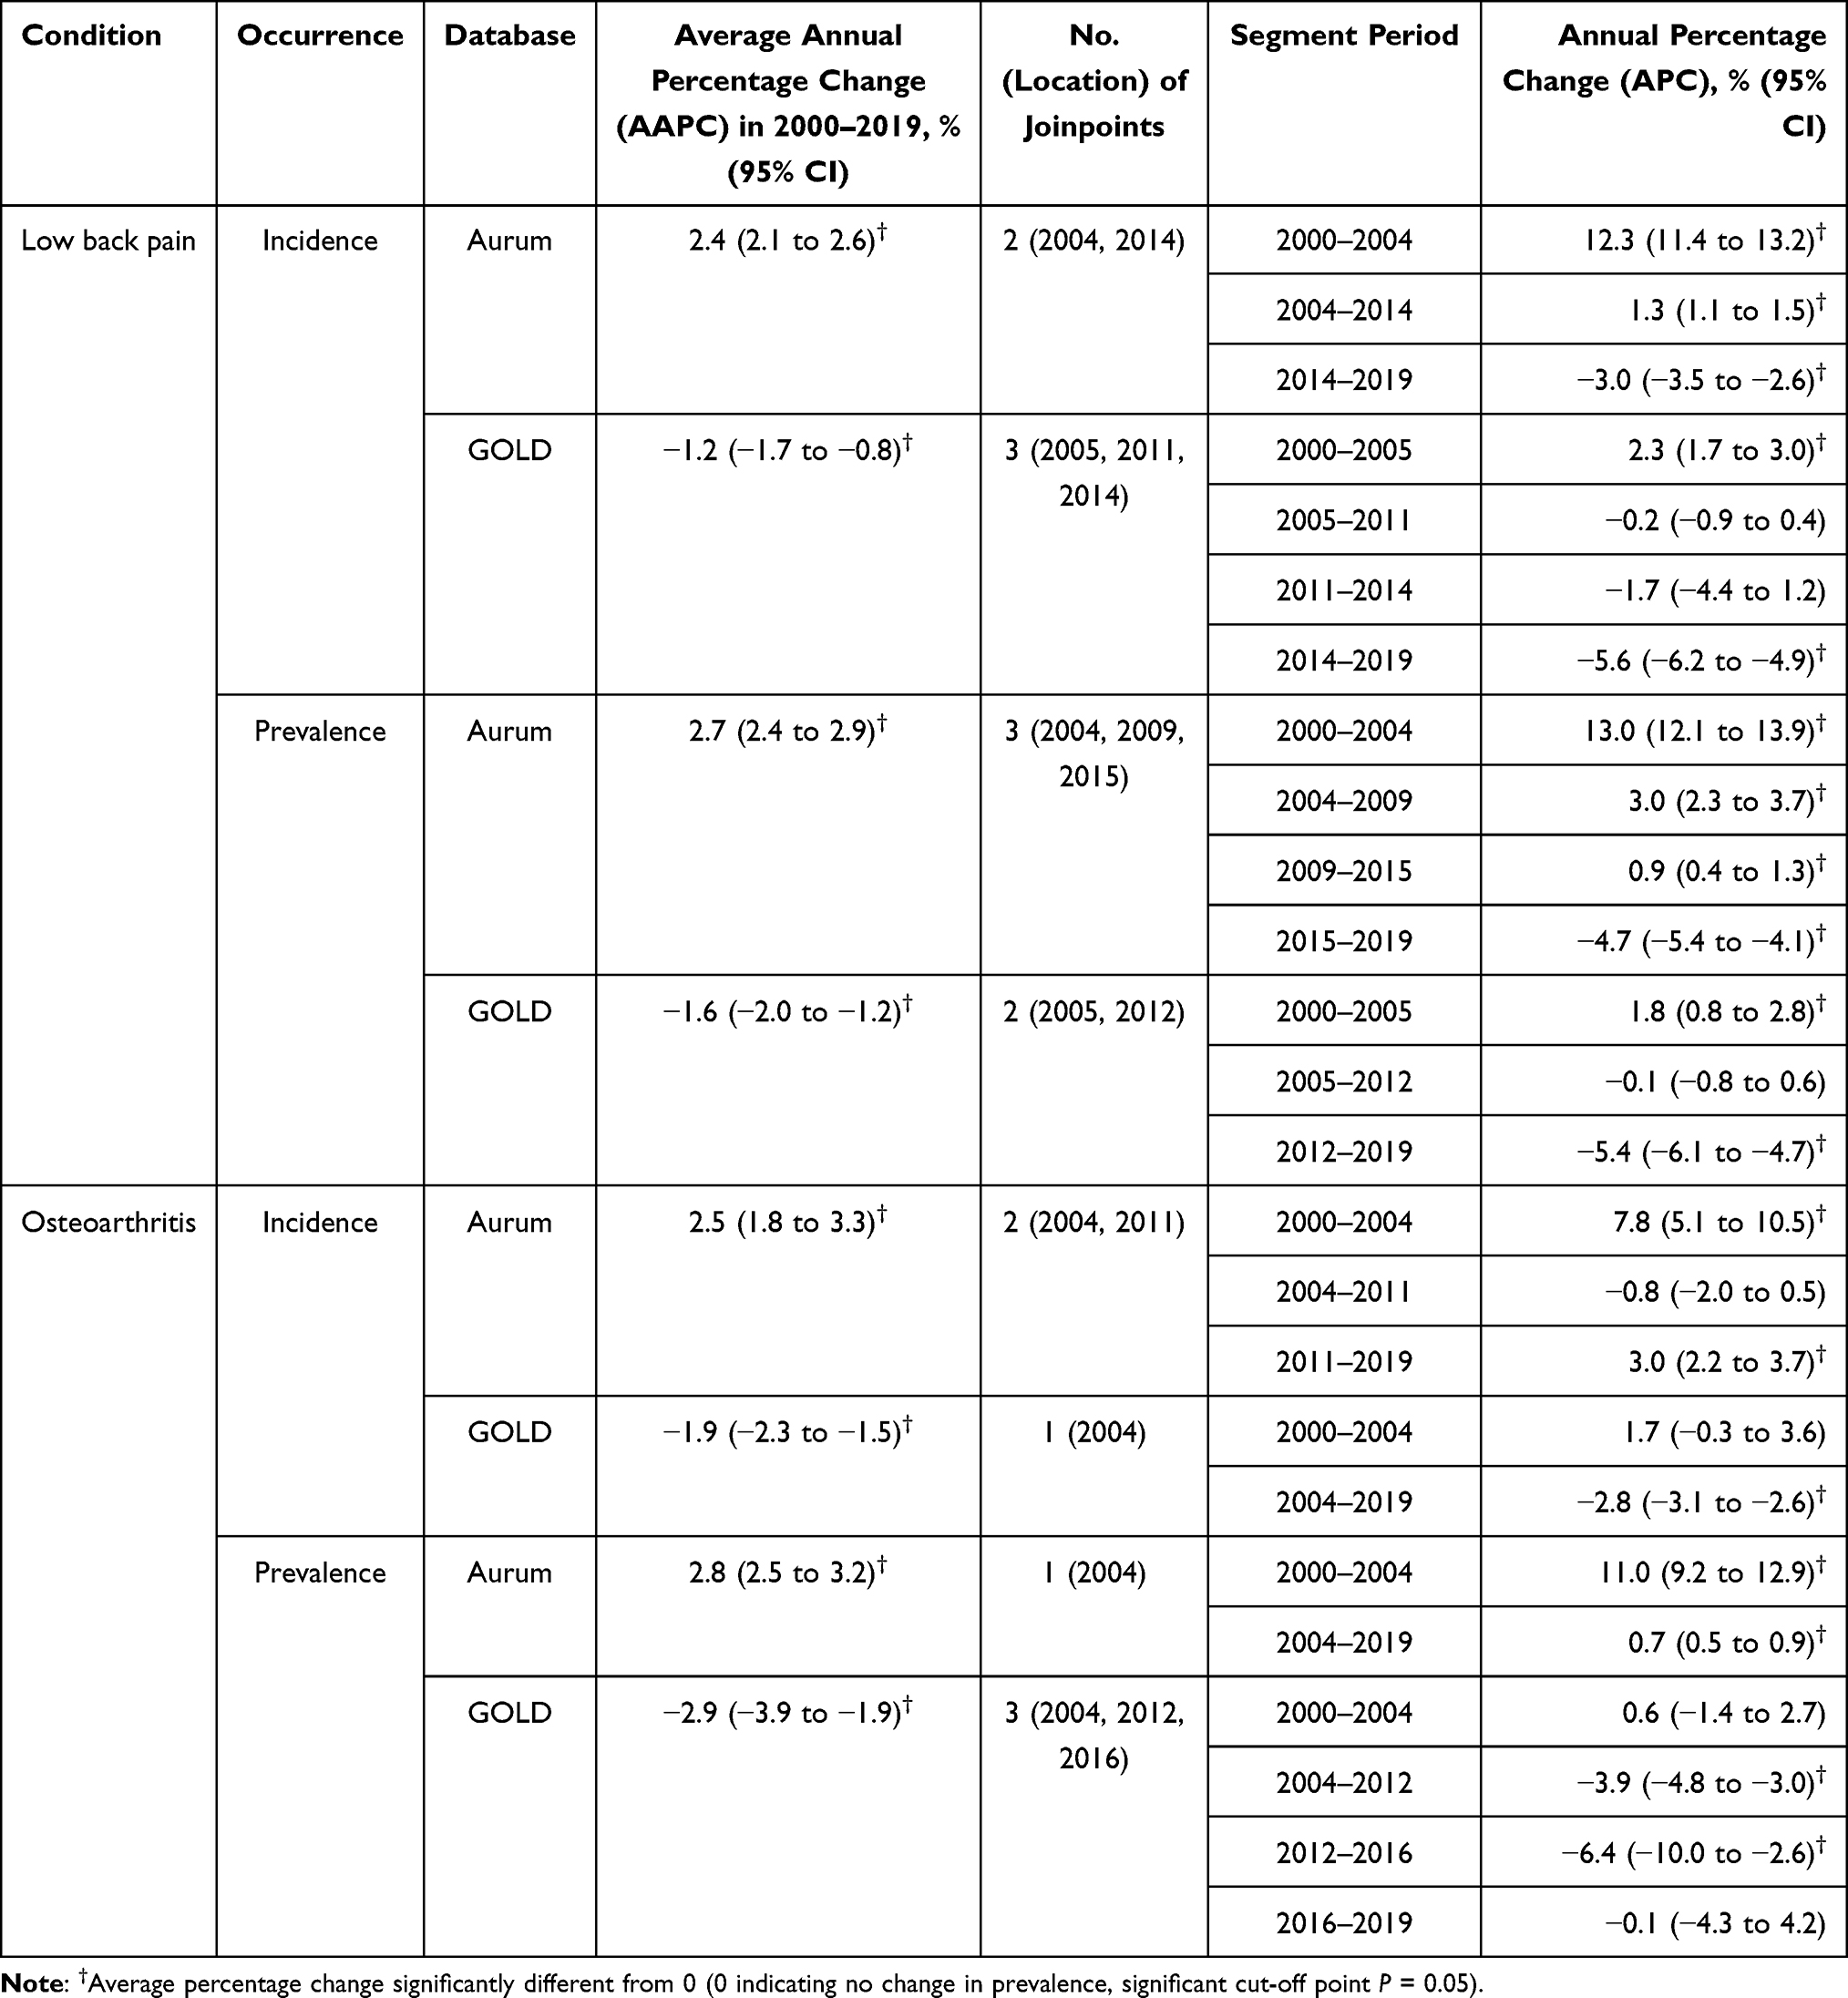 |
Table 1 Joinpoint Regression Analysis of Average Percentage Change of Standardised Annual Person-Consulting Incidence and Prevalence of Low Back Pain and Osteoarthritis from CPRD Aurum and GOLD: England, 2000–2019 |
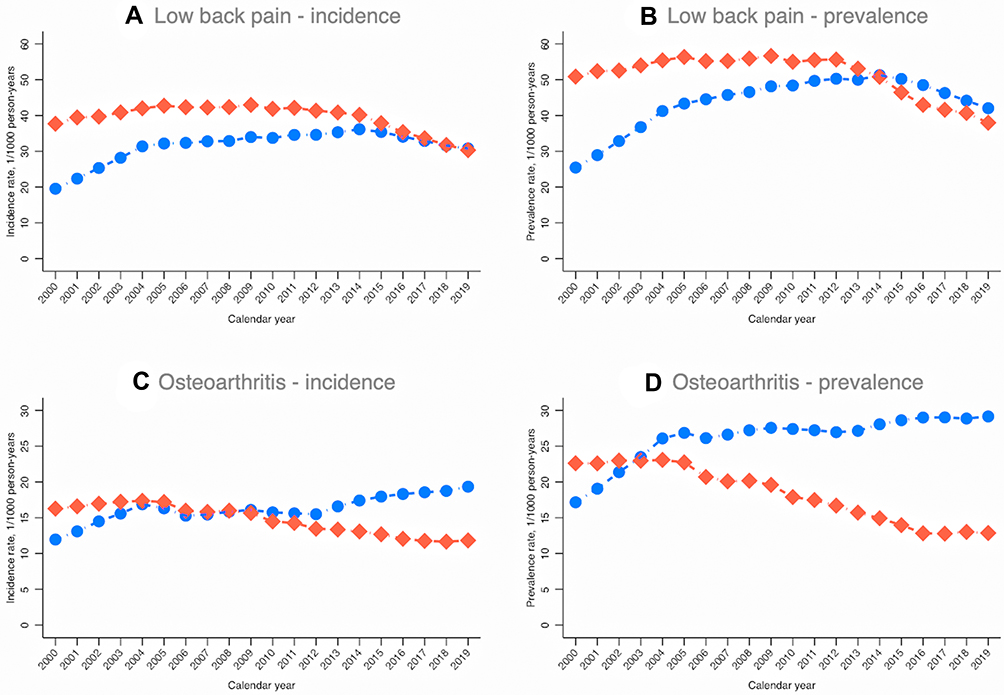 |
Figure 1 Age-sex-standardised annual person-consulting rates from CPRD Aurum and GOLD: England, 2000–2019 (A) low back pain incidence, (B) low back pain prevalence, (C) osteoarthritis incidence, (D) osteoarthritis prevalence. Blue dot lines CPRD Aurum; red diamond lines CPRD GOLD. All rates standardised by age and sex to mid-2019 English population 15+ and 45 + years (ONS code: E92000001) for low back pain and osteoarthritis, respectively. |
Osteoarthritis
For osteoarthritis, age-sex standardised annual incidence estimates from Aurum and GOLD were similar in 2005 (16.32 (16.28 to 16.36) vs 17.20 (17.16 to 17.25) respectively). Incidence rates in Aurum increased from 2011, to reach 19.34 (19.30 to 19.39) per 1000 person-years among adults aged 45 years and over in 2019. By contrast, incidence estimates fell in GOLD from 2011 to 11.82 (11.78 to 11.85) per 1000 person-years in 2019 (Figure 1; Table 1; Supplementary Data Tables S7 and S8; Supplementary Data Figure 17). A similar pattern was seen for annual consultation prevalence of osteoarthritis. In Aurum, the annual consultation prevalence of osteoarthritis increased from 26.86 (26.80 to 26.92) per 1000 person-years in 2005 to 29.15 (29.10 to 29.21) per 1000 person-years in 2019, whereas in GOLD, estimates decreased from 23.08 (23.03 to 23.13) per 1000 person-years in 2004 to 16.70 (16.65 to 16.74) per 1000 person-years in 2012, dropped further to 12.82 (12.78 to 12.86) per 1000 person-years in 2016 and then remained relatively stable to 2019.
Stratified and Subnational Estimates from Aurum
Low Back Pain
Annual consultation incidence and prevalence of low back pain were consistently higher in women than in men (Figure 2) and increased with age peaking at 75–84 years (Supplementary Data Figures S3 and S4).
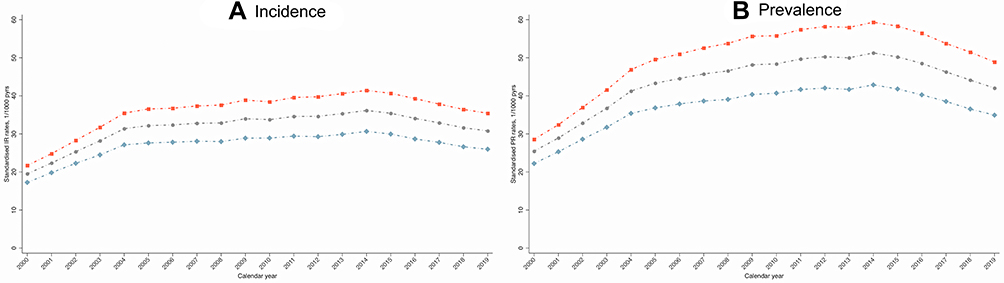 |
Figure 2 Overall and sex-specific age-standardised annual person-consulting low back pain (A) incidence and (B) prevalence from CPRD Aurum: England, 2000–2019. Grey dot, red square and blue diamond indicates standardised rates for all, women and men, respectively. Standard population = mid-2019 English population aged 15+ years (ONS code: E92000001). |
There were regional disparities, with low back pain incidence and prevalence consistently higher in northern than southern regions of England (Supplementary Data Figures S5 and S6).
Osteoarthritis
As with low back pain, annual consultation incidence and prevalence of diagnosed OA were consistently higher in women than in men (Figure 3) and increased with age, peaking at 75–84 years (Supplementary Data Figures S7 and S8).
 |
Figure 3 Overall and sex-specific age-standardised annual person-consulting osteoarthritis (A) incidence and (B) prevalence from CPRD Aurum: England, 2000–2019. Grey dot, red square and blue diamond indicates standardised rates for all, women and men, respectively. Standard population = mid-2019 English population aged 45+ years (ONS code: E92000001). |
Consultation incidence and prevalence of osteoarthritis were consistently higher in northern regions of England than in the south (Supplementary Data Figures S9 and S10).
Sensitivity Analyses
Relaxing the requirement for 3 years of prior registration for prevalence estimation resulted in slightly lower prevalence estimates but the same underlying trends (Supplementary Data Tables S9 and S10; Figures S11–S16).
Discussion
Summary of Main Findings
Despite applying a consistent approach to case definitions and methods of analysis, we observed important differences in estimates of the annual consultation incidence and prevalence of low back pain and osteoarthritis between 2005 and 2019 obtained from two English national databases – CPRD Aurum and GOLD databases. While estimates from Aurum suggested little or no overall change in the age-sex-standardised consultation incidence and prevalence of low back pain in 2019 compared to 2005, and modest increases in osteoarthritis over this period, estimates from GOLD suggested substantial decreases.
Comparison with Previous Findings
Our findings extend those obtained in a comparative analysis of UK primary care databases over a decade ago that showed that different databases yielded a (sometime wide) range of estimates of the annual consultation prevalence and incidence of common musculoskeletal pain conditions.17 We show that they can also produce conflicting trends over time. This phenomenon does not apply to all conditions and outcomes. For example, a recent study by Gulliford et al43 found very similar rates of antibiotic prescribing from CPRD GOLD and Aurum, albeit limited to a single year of interest. The precise reasons for the differences in trends seen in the current study are unclear. They cannot be attributed to differences between GOLD and Aurum in their geographic coverage (differences exist within regions, data not shown) or to the introduction of the new SNOMED coding system that replaces Read codes (SNOMED began to be implemented in 2018 and would affect both Vision and EMIS systems). In previous studies, an unexpected decrease or lack of increase in annual osteoarthritis consultation incidence rates is reversed if a broader case definition is used, implying a shift in coding behaviour over time from diagnostic to symptom coding.19,20 However, it is not clear why this should affect GOLD more than Aurum. If practices with higher levels of non-incentivised problem/diagnostic coding were more likely to switch from Vision to EMIS (or other IT system), this may contribute to the observed trends in GOLD estimates, but we did not directly test this.
Irrespective of the underlying reasons, sharp increases or strong decreasing trends in prevalence of low back pain and osteoarthritis are not consistent with other population estimates. For example, GP Patient Survey estimates of the prevalence of self-reported long-term musculoskeletal problem in the adult population in England have been stable from 2014/2015 to 2018/2019.44 Global Burden of Disease modelled age-standardised prevalence estimates of low back pain and osteoarthritis of the hip and osteoarthritis of the knee have been either stable or increasing from 2000 to 2019.45 Annual estimates obtained from CPRD Aurum are more consistent with these other sources (with the exception of data from 2000–2004, prior to the introduction of Quality and Outcomes Framework (QOF)). Yet it must be recognised that the Aurum annual estimates reflect expressed demand within a given calendar year for primary healthcare that is accessible through general practice. For instance, the one-year period prevalence of low back pain in the adult population is likely to exceed 30%,46 with activity-limiting or chronic low back pain being expected to be approximately 12–18%.46,47 This contrasts with an estimated annual consultation prevalence of 4–5% from the current Aurum estimates, confirming that the majority of low back pain in the adult population in a given calendar year is not presented to general practice and recorded in the structured EHR.
After allowing for differences in the age of the target population, our estimate of the annual consultation incidence of osteoarthritis of 16–19 per 1000 person-years in adults aged 45 years and over from Aurum is broadly consistent with estimates of 6–10 per 1000 person-years in all ages obtained from previous analyses of CPRD and other local and national UK primary care EHR databases.12,19,20 Comparison of consultation prevalence estimates for osteoarthritis is more difficult due to the use of different period prevalences (5-year,18 7-year,16 ever19) and target populations (all ages,14,16,18 15+,17 20+,19 45+,16 65+15 years). Where direct comparison is possible, our current Aurum estimates appear to fall between those from previous local16 and national database studies.19 We found no previously published comparable consultation incidence estimates for LBP from UK EHR data sources. Several previous prevalence studies have used narrow case definitions (eg, intervertebral disk disorder) which cannot be directly compared. However, our current Aurum estimates for annual consultation prevalence of low back pain are lower than three previous UK studies using a similar definition.14,16,17 Together, these comparisons suggest that the annual consultation prevalence estimates from the current study are likely to be conservative, although there is no reason to believe that this should result in systematic bias in monitoring trends over time.
Strengths and Limitations
Occurrence estimates for chronic health condition obtained from dynamic EHR data are typically sensitive to the specific case definition adopted, the period and analytic approach used to distinguish incident from prevalent cases, the capture and linkage of hospital data and other data sources, changing population structure, and the particular characteristics and incentives for coding behaviour within a healthcare system or database.48 The codelists used in this study built on previous mapping and consensus involving general practitioners. The future use of routinely recorded data to monitor the rate of new and existing cases of musculoskeletal disorders presenting to general practice still requires care due to the large number of available codes and variations in coding behaviour. The encouragement of practitioners to use a smaller set of preferred codes and periodically reviewing and revising codelists used to define cases may help. We have justified the choice of look-back period by previous empirical work.20 Our study period preceded any COVID-19 impacts on musculoskeletal health and accessing primary healthcare. We focused our interpretation on estimates from after 2004, having observed sharp increases in 2000–2003. In a previous analysis of another national GP database - The Health Improvement Network (THIN) - Horsfall et al49 found that incidence estimates across a range of outcomes were highly sensitive to the application of different data quality filters, including acceptable computer usage levels. While the effects of this appeared to lessen after 2003, variations in data quality between practices and across time in a dynamic population may still be a source of bias. For example, acceptable computer usage was previously defined by primary care physician entries, but musculoskeletal consultations are likely to be increasingly with non-medical staff such as nurse practitioners and physiotherapists. The level of coding of this activity is less clear. Our analyses are based on the structured primary care EHR without access to unstructured (free text) data or linkage to hospital record data. The findings of this study are limited to UK primary care. This study has focussed on incidence and prevalence of musculoskeletal conditions. Other studies have shown closer agreement in estimates obtained from the two databases, for example in characteristics of patients recorded with chronic obstructive pulmonary disease50 and antibiotic prescribing rates.43 Further research is needed to assess comparability of incidence and prevalence of other health conditions between GOLD and Aurum, and findings from other types of research study.
Conclusion
Our study demonstrates some important differences between CPRD GOLD and Aurum databases in estimates of the consultation incidence and prevalence of common, disabling musculoskeletal pain conditions. Estimates from Aurum appeared to be more consistent with external sources. As indicators for monitoring musculoskeletal health in populations, they are likely to be a valuable addition to existing population estimates obtained from periodic national self-report surveys, but sensitive to analytic decisions and data quality.
Data Sharing Statement
Data may be obtained from a third party and are not publicly available. The data were obtained from the Clinical Practice Research Datalink (CPRD). CPRD data governance does not allow us to distribute patient data to other parties. Researchers may apply for data access at http://www.CPRD.com/research-applications. Our approved study protocol is available on request, and codelists are freely available at https://www.keele.ac.uk/mrr/codelists/.
Acknowledgments
This study is based on data from the Clinical Practice Research Datalink obtained under licence from the UK Medicines and Healthcare Products Regulatory Agency. The data are provided by patients and collected by the NHS as part of their care and support. The interpretation and conclusions contained in this study are those of the authors alone.
This work was supported by funding from Public Health England. KPJ is also supported by matched funding awarded to the NIHR Applied Research Collaboration (West Midlands).
Disclosure
The authors have no conflicts of interest to declare.
References
1. Blyth FM, Briggs AM, Schneider CH, Hoy DG, March LM. The global burden of musculoskeletal pain-where to from here? Am J Public Health. 2019;109:35–40. doi:10.2105/AJPH.2018.304747
2. Institute for Health Metrics and Evaluation. GBD compare data visualization. Seattle, WA: IHME, University of Washington; 2020. Available from http://vizhub.healthdata.org/gbd-compare.
3. Health & Safety Executive. LFS - Labour Force Survey - Self-reported work-related ill health and workplace injuries: index of LFS tables. Updated 11/20. Available from: https://www.hse.gov.uk/statistics/lfs/index.htm.
4. NHS England. 2013–14 CCG programme budgeting benchmarking tool; 2015.
5. Arthritis Research UK National Primary Care Centre. Musculoskeletal Matters. Bulletin 1: what do general practitioners see? October 2009. Available from: https://www.keele.ac.uk/media/keeleuniversity/ri/primarycare/MusculoskeletalMatters_Issue1_Final.pdf.
6. Jordan KP, Kadam UT, Hayward R, et al. Annual consultation prevalence of regional musculoskeletal problems in primary care: an observational study. BMC Musculoskelet Disord. 2010;11:144. doi:10.1186/1471-2474-11-144
7. Chief Medical Officer. Annual report: volume one, 2011 ‘On the state of the public’s health’. 2012. Available from: https://www.gov.uk/government/publications/cmo-annual-report-2011-volume-one.
8. Newton JN, Briggs AD, Murray CJ, et al. Changes in health in England, with analysis by English regions and areas of deprivation, 1990–2013: a systematic analysis for the Global Burden of Disease Study 2013. Lancet. 2015;386(10010):2257–2274. doi:10.1016/S0140-6736(15)00195-6
9. Steel N, Ford JA, Newton JN, et al. Changes in health in the countries of the UK and 150 English Local Authority areas 1990–2016: a systematic analysis for the Global Burden of Disease Study 2016. Lancet. 2018;392(10158):1647–1661. doi:10.1016/S0140-6736(18)32207-4
10. Musculoskeletal Health: a 5 year strategic framework for prevention across the lifecourse. Available from: https://assets.publishing.service.gov.uk/government/uploads/system/uploads/attachment_data/file/810348/Musculoskeletal_Health_5_year_strategy.pdf.
11. Public Health England. Public health profiles: musculoskeletal conditions. Musculoskeletal Conditions – PHE; 2021.
12. Yu D, Jordan KP, Bedson J, et al. Population trends in the incidence and initial management of osteoarthritis: age-period-cohort analysis of the Clinical Practice Research Datalink, 1992–2013. Rheumatology. 2017;56(11):1902–1917. doi:10.1093/rheumatology/kex270
13. Yu D, Jordan KP, Peat G. Underrecording of osteoarthritis in United Kingdom primary care electronic health record data. Clin Epidemiol. 2018;10:1195–1201. doi:10.2147/CLEP.S160059
14. Fleming DM, Cross KW, Barley MA. Recent changes in the prevalence of diseases presenting for health care. Br J Gen Pract. 2005;55:589–595. PMID: 16105366.
15. Hughes H, Jordan KP, Rajaratnam G, Fawcett S, Croft P. Recent changes in general practice morbidity in older people. Age Ageing. 2008;37:572–575. PMID: 18487261. doi:10.1093/ageing/afn111
16. Jordan KP, Jöud A, Bergknut C, et al. International comparisons of the prevalence of health care for musculoskeletal disorders using population-based health care data from England and Sweden. Ann Rheum Dis. 2014;73(1):212–218. doi:10.1136/annrheumdis-2012-202634
17. Jordan K, Clarke AM, Symmons DP, et al. Measuring disease prevalence: a comparison of musculoskeletal disease using four general practice consultation databases. Br J Gen Pract. 2007;57:7–14. PMID: 17244418.
18. Kuan V, Denaxas S, Gonzalez-Izquierdo A, et al. A chronological map of 308 physical and mental health conditions from 4 million individuals in the English National Health Service. Lancet Digital Health. 2019;1:e63–e77. doi:10.1016/S2589-7500(19)30012-3
19. Swain S, Sarmanova A, Mallen C, et al. Trends in incidence and prevalence of osteoarthritis in the United Kingdom: findings from the Clinical Practice Research Datalink (CPRD). Osteoarthritis Cartilage. 2020;28(6):792–801. doi:10.1016/j.joca.2020.03.004
20. Yu D, Peat G, Bedson J, Jordan KP. Annual consultation incidence of osteoarthritis estimated from population-based health care data in England. Rheumatology. 2015;54:2051–2060. doi:10.1093/rheumatology/kev231
21. Herrett E, Gallagher AM, Bhaskaran K, et al. Data resource profile: Clinical Practice Research Datalink (CPRD). Int J Epidemiol. 2015;44(3):827–836. doi:10.1093/ije/dyv098
22. Kontopantelis E, Stevens RJ, Helms PJ, Edwards D, Doran T, Ashcroft DM. Spatial distribution of clinical computer systems in primary care in England in 2016 and implications for primary care electronic medical record databases: a cross-sectional population study. BMJ Open. 2018;8(2):e020738. doi:10.1136/bmjopen-2017-020738
23. MHRA CPRD. Release notes: CPRD GOLD April 2021. CPRD GOLD April 2021 dataset | CPRD; 2021. doi:10.48329/adkk-m317.
24. Wolf A, Dedman D, Campbell J, et al. Data resource profile: Clinical Practice Research Datalink (CPRD) aurum. Int J Epidemiol. 2019;48(6):1740. doi:10.1093/ije/dyz034
25. MHRA CPRD. CPRD Aurum Frequently Asked Questions (FAQ). Version 2.2, 2021. CPRD Aurum FAQs; 2021.
26. MHRA CPRD. Release notes: CPRD Aurum April 2021. CPRD Aurum April 2021 dataset | CPRD; 2021. doi:10.48329/8pm6-4q84.
27. Herrett E, Thomas SL, Schoonen WM, Smeeth L, Hall AJ. Validation and validity of diagnoses in the General Practice Research Database: a systematic review. Br J Clin Pharmacol. 2010;69:4–14. doi:10.1111/j.1365-2125.2009.03537.x
28. Jick SS, Wilcox Hagberg K, Persson R, et al. Quality and completeness of diagnoses recorded in the new CPRD Aurum Database: evaluation of pulmonary embolism. Pharmacoepidemiol Drug Saf. 2020;29(9):1134–1140. doi:10.1002/pds.4996
29. Persson R, Vasilakis-Scaramozza C, Wilcox Hagberg K, et al. CPRD Aurum database: assessment of data quality and completeness of three important comorbidities. Pharmacoepidemiol Drug Saf. 2020;29(11):1456–1464. doi:10.1002/pds.5135
30. National Institute of Clinical Excellence. NICE Guideline [NG59] Low back pain and sciatica in over 16s: assessment and management; 2016. Available from: https://www.nice.org.uk/guidance/ng59.
31. Dionne CE, Dunn KM, Croft PR, et al. A consensus approach toward the standardization of back pain definitions for use in prevalence studies. Spine. 2008;33:95–103. doi:10.1097/BRS.0b013e31815e7f94
32. Kopec JA, Rahman MM, Sayre EC, et al. Trends in physician-diagnosed osteoarthritis incidence in an administrative database in British Columbia, Canada, 1996–1997 through 2003–2004. Arthritis Rheum. 2008;59:929–934. doi:10.1002/art.23827
33. Rahman MM, Cibere J, Goldsmith CH, Anis AH, Kopec JA. Osteoarthritis incidence and trends in administrative health records from British Columbia, Canada. J Rheumatol. 2014;41:1147–1154. doi:10.3899/jrheum.131011
34. Widdifield J, Labrecque J, Lix L, et al. Systematic review and critical appraisal of validation studies to identify rheumatic diseases in health administrative databases. Arthritis Care Res. 2013;65:1490–1503. doi:10.3899/jrheum.131011
35. Turkiewicz A, Petersson IF, Björk J, et al. Current and future impact of osteoarthritis on health care: a population-based study with projections to year 2032. Osteoarthritis Cartilage. 2014;22:1826–1832. doi:10.1016/j.joca.2014.07.015
36. Sun J, Gooch K, Svenson LW, Bell NR, Frank C. Estimating osteoarthritis incidence from population-based administrative health care databases. Ann Epidemiol. 2007;17:51–56. doi:10.1016/j.annepidem.2006.06.003
37. Kopec JA, Rahman MM, Berthelot JM, et al. Descriptive epidemiology of osteoarthritis in British Columbia, Canada. J Rheumatol. 2007;34:386–393. PMID: 17183616.
38. van der Waal JM, Bot SD, Terwee CB, et al. The incidences of and consultation rate for lower extremity complaints in general practice. Ann Rheum Dis. 2006;65:809–815. doi:10.1136/ard.2005.036988
39. Schers H, Bor H, van den Hoogen H, van Weel C. What went and what came? Morbidity trends in general practice from the Netherlands. Eur J Gen Pract. 2008;14:13–24. doi:10.1080/13814780802436051
40. van den Dungen C, Hoeymans N, Boshuizen HC, et al. The influence of population characteristics on variation in general practice based morbidity estimations. BMC Public Health. 2011;11:887. doi:10.1186/1471-2458-11-887
41. Prieto-Alhambra D, Judge A, Javaid MK, et al. Incidence and risk factors for clinically diagnosed knee, hip and hand osteoarthritis: influences of age, gender and osteoarthritis affecting other joints. Ann Rheum Dis. 2014;73:1659–1664. doi:10.1136/annrheumdis-2013-203355
42. Shrestha S, Dave AJ, Losina E, Katz JN. Diagnostic accuracy of administrative data algorithms in the diagnosis of osteoarthritis: a systematic review. BMC Med Inform Decis Mak. 2016;16:82. doi:10.1186/s12911-016-0319-y
43. Gulliford MC, Sun X, Anjuman T, Yelland E, Murray-Thomas T. Comparison of antibiotic prescribing records in two UK primary care electronic health record systems: cohort study using CPRD GOLD and CPRD Aurum databases. BMJ Open. 2020;10(6):e038767. doi:10.1136/bmjopen-2020-038767
44. Public Health England. Public health profiles; 2021. Available from: https://fingertips.phe.org.uk.
45. Institute for Health Metrics and Evaluation. Epi Visualization. Seattle, WA: IHME, University of Washington; 2020. Available from: http://vizhub.healthdata.org/epi.
46. Hoy D, Bain C, Williams G, et al. A systematic review of global prevalence of low back pain. Arthritis Rheum. 2012;64:2028–2037. doi:10.1002/art.34347
47. Public Health England. Chronic pain in adults 2017. Health Survey for England; December 2020. Available from: https://www.gov.uk/government/publications/chronic-pain-in-adults-2017.
48. Rassen JA, Bartels DB, Schneeweiss S, Patrick AR, Murk W. Measuring prevalence and incidence of chronic conditions in claims and electronic health record databases. Clin Epidemiol. 2018;11:1–15. doi:10.2147/CLEP.S181242
49. Horsfall L, Walters K, Petersen I. Identifying periods of acceptable computer usage in primary care research databases. Pharmacoepidemiol Drug Saf. 2013;22:64–69. doi:10.1002/pds.3368
50. Requena G, Wolf A, Williams R, et al. Feasibility of using Clinical Practice Research Datalink data to identify patients with chronic obstructive pulmonary disease to enrol into real-world trials. Pharmacoepidemiol Drug Saf. 2021;30(4):472–481. doi:10.1002/pds.5188
 © 2022 The Author(s). This work is published and licensed by Dove Medical Press Limited. The full terms of this license are available at https://www.dovepress.com/terms.php and incorporate the Creative Commons Attribution - Non Commercial (unported, v3.0) License.
By accessing the work you hereby accept the Terms. Non-commercial uses of the work are permitted without any further permission from Dove Medical Press Limited, provided the work is properly attributed. For permission for commercial use of this work, please see paragraphs 4.2 and 5 of our Terms.
© 2022 The Author(s). This work is published and licensed by Dove Medical Press Limited. The full terms of this license are available at https://www.dovepress.com/terms.php and incorporate the Creative Commons Attribution - Non Commercial (unported, v3.0) License.
By accessing the work you hereby accept the Terms. Non-commercial uses of the work are permitted without any further permission from Dove Medical Press Limited, provided the work is properly attributed. For permission for commercial use of this work, please see paragraphs 4.2 and 5 of our Terms.