")
Back to Journals » Diabetes, Metabolic Syndrome and Obesity » Volume 9
Trends in medication use in patients with type 2 diabetes mellitus: a long-term view of real-world treatment between 2000 and 2015
Authors Higgins V , Piercy J, Roughley A, Milligan G, Leith A, Siddall J, Benford M
Received 18 August 2016
Accepted for publication 9 September 2016
Published 1 November 2016 Volume 2016:9 Pages 371—380
DOI https://doi.org/10.2147/DMSO.S120101
Checked for plagiarism Yes
Review by Single anonymous peer review
Peer reviewer comments 2
Editor who approved publication: Professor Ming-Hui Zou
Victoria Higgins, James Piercy, Adam Roughley, Gary Milligan, Andrea Leith, James Siddall, Mike Benford
Adelphi Real World, Macclesfield, UK
Background: Despite the availability of a variety of treatments, many patients with type 2 diabetes mellitus (T2DM) are not achieving glucose control. We analyzed successive waves of the Adelphi Real World Diabetes Disease Specific Programmes (DSPs) to assess treatment patterns reported by primary care physicians (PCPs) and specialists and the effect of treatment on levels of glucose control.
Methods: Data were collected between 2000 and 2015 in the US and EU5 (France, Germany, Italy, Spain, and the UK). Physicians completed patient record forms for the next 10 patients consulting with T2DM. Key aspects captured were change over time in therapy usage, time to insulin introduction, and glycated hemoglobin (HbA1c) levels.
Results: Over 12 DSP waves, 3,555 specialists and 5,109 PCPs completed questionnaires for 70,657 patients. Treatment patterns changed considerably over time as new agents were introduced. The number of agents prescribed per patient increased over time, as did HbA1c levels at which physicians stated they would introduce insulin. The greatest improvements in HbA1c levels occurred during 2000–2008, with little improvement since 2008.
Conclusion: In this real-world setting, the proportion of patients with T2DM achieving good glucose control has not increased greatly since 2008. A better understanding of how to individualize treatment pathways may be required to improve control in these patients.
Keywords: insulinization, real world, type 2 diabetes, treatment trends
Introduction
The array of treatment options available to patients with type 2 diabetes mellitus (T2DM) has increased markedly in recent years, as reflected in recent treatment guidelines.1 Current recommendations involve commencing metformin monotherapy if dietary and lifestyle modifications are not sufficient, with the addition of other agents if the patient’s glycated hemoglobin (HbA1c) target is not met after 3 months. Available agents include sulfonylureas (SUs), thiazolidinediones (TZDs), dipeptidyl peptidase-4 (DPP-4) inhibitors, sodium–glucose cotransporter 2 (SGLT-2) inhibitors, glucagon-like peptide 1 receptor agonists (GLP-1 RAs), and insulin. Triple therapy may be needed if the HbA1c target is not reached on dual therapy, with the addition of insulins if required.1 Glucose control or homeostasis is the focus of treatment for patients with T2DM. Current guidelines from the American Diabetes Association (ADA) and the European Association for the Study of Diabetes (EASD) recommend a personalized approach to glycemic control rather than a universal goal for all patients; an HbA1c level of 7% is often used as a cutoff point.1,2 Despite comprehensive treatment guidelines and the availability of a range of therapeutic options, many patients continue to have poorly controlled diabetes. In the US, 48% of people with diabetes in the National Health and Nutrition Examination Surveys (NHANES) had an uncontrolled HbA1c >7% between 2007 and 2010,3 with 13% of patients having an HbA1c >9%.4 In an audit of over 2 million patients with diabetes in England and Wales, 35% of patients with T2DM had HbA1c >7.5%.5 These data suggest that, despite the availability of a range of therapeutic options and guidelines, patients may be treated inadequately or are not taking control of their condition effectively, for example, via lack of lifestyle improvements or non-adherence to medication regimens.
Using data from successive waves of the Adelphi Real World Diabetes Disease Specific Programme (DSP), the aim of these analyses was to assess treatment patterns reported by primary care physicians (PCPs) and specialists involved in the management of patients with T2DM and the subsequent impact on levels of glycemic control. Key aspects of these analyses were to assess changing T2DM therapy usage since the launch of newer drug classes; review the role of polypharmacy; identify the trigger point at which physicians introduce insulin therapy in patients with T2DM; review any changes in time to insulin introduction; and analyze if any identified changes in treatment have ultimately affected HbA1c levels over an extended period in this patient population.
Methods
Data were drawn from successive waves of the Diabetes DSP conducted between 2000 and 2015 in the US and EU5 (France, Germany, Italy, Spain, and the UK). These were prospective, cross-sectional surveys of physicians and their patients presenting in a real-world clinical setting. Although not longitudinal in nature, each wave provides an independent snapshot of cross-sectional data, which can be used to explore patterns over time. DSPs are large, multinational surveys conducted in clinical practice that describe current disease management, disease-burden impact, and associated treatment effects (clinical and physician-perceived). The survey methodology is designed to facilitate collection of up-to-date data from the following three key sources of information: physician face-to-face interviews, physician-reported workload questionnaires, and patient record forms. A complete description of the methods of the survey has been previously published.6
Using a check box, patients provided informed consent for use of their anonymized and aggregated data for research and publication in scientific journals. Data were collected in such a way that patients and physicians could not be identified directly; all data were aggregated and de-identified before receipt, and as a result, data collection was undertaken in line with European Pharmaceutical Marketing Research Association guidelines and as such it does not require ethics committee approval. Each survey was performed in full accordance with relevant legislation at the time of data collection, including the US Health Insurance Portability and Accountability Act 1996,7 the European Pharmaceutical Marketing Research Association guidelines,8 and Health Information Technology for Economic and Clinical Health Act legislation.9
Participating physicians and patients
For each DSP wave, physicians were eligible to participate in this research if they were personally responsible for treatment decisions and management of patients with T2DM. Inclusion criteria for patients were aged ≥18 years, a physician-confirmed diagnosis of T2DM, receiving antidiabetic non-insulin therapy (with or without insulin regimens), and consulting the physician on the day of assessment. Each wave of data collection was independent of the others, ensuring the same physicians and patients were not included year on year.
Eligible physicians completed a face-to-face interview. Of particular importance to our study objective was the question included from 2004 onward that specifically asked physicians what HbA1c level would prompt initiation of insulin therapy.
Physicians then completed a workload page for the next 5 working days. This provides a holistic view of T2DM management including prescribed and nonprescribed approaches. Irrespective of which patients were recruited for the survey, physicians recorded the total number of patients with T2DM consulting per day who were being managed with the following treatment approaches: 1) diet and exercise only; 2) non-insulin drug treatment only; 3) non-insulin drug treatment plus insulin; and 4) insulin only.
Physicians were then instructed to complete a patient record form for the next 10 consecutive consulting patients with a physician-confirmed diagnosis of T2DM and receiving prescribed antidiabetic therapy (with or without insulin), regardless of the reason for the consultation. The physician-reported forms reflected physicians’ knowledge about their treatment decisions and assessment of health status in patients seeking routine care, including information on patients’ demographics, clinical assessments, clinical outcomes, diabetes medication use, and history. The physician-reported forms also collected information on the time to insulin initiation. Market updates from year to year necessitated minor amendments to some questions (refer Table S1 for specific questions administered in each wave).
It should be noted that as each survey was designed to facilitate understanding of real-world clinical practice, physicians could only report on data they had to hand at the time of the consultation. Therefore, this represents the evidence they had when making any clinical treatment and other management decisions at that consultation. No tests, treatments, or investigations were performed as part of this survey.
Statistical analyses
Patient characteristics were analyzed descriptively for the total study sample. Categorical variables were described by proportion of respondents, excluding any missing values. Continuous numerical variables were described by their mean.
As the time from diagnosis of T2DM to the survey date was different in each patient within each wave, the time to initiation of insulin was compared against the year the patient was diagnosed, rather than the survey year in which the patient was included. For example, a patient recruited in 2015 diagnosed with T2DM 5 years earlier was considered the same as a patient recruited in 2011 diagnosed for 1 year, as their diabetes management would have started in the same year.
Survival analysis was used to analyze the time from diagnosis to the first insulin regimen. This method was chosen as patients who had not received any insulin regimen by the time of the survey could be included; therefore, a patient’s time from diagnosis to the point of data collection was used even if a patient had not yet received insulin, as they could potentially receive insulin at some point in the future.
Kaplan–Meier failure curves were plotted by time of diagnosis, where “failure” in this analytical setting infers the initiation of insulin. A log-rank test was used to assess significant differences in the time taken for patients to receive insulin.
Results
Patients and physicians
A total of 3,555 specialists and 5,109 PCPs participated in the 12 DSP waves conducted between 2000 and 2015. A total of 88,681 patients with T2DM were counted via the 5-day workload page, providing the holistic prescribed and non-prescribed antidiabetic cohort; 70,657 patients with T2DM were recruited via the physician-reported questionnaires providing the prescribed antidiabetic therapy (non-insulin therapy with or without insulin) cohort (Figure 1).
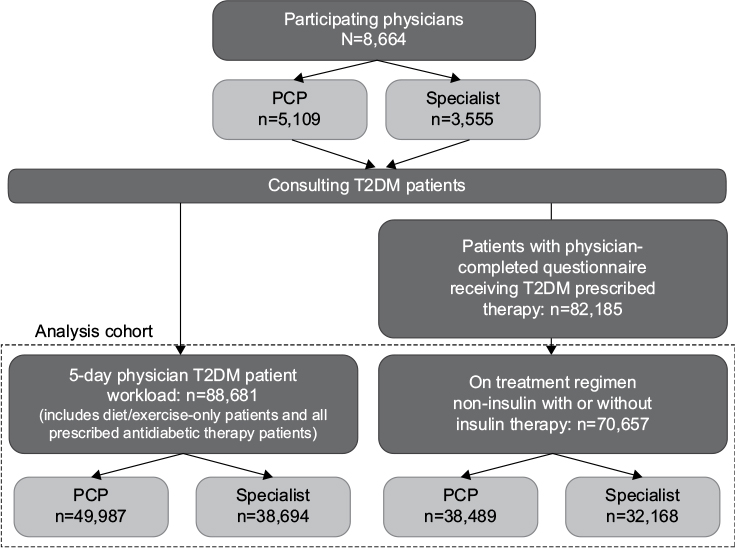 | Figure 1 Analyses cohort diagram. Note: Specialist here refers to a diabetes specialist (diabetologist, endocrinologist). Abbreviations: PCP, primary care physician; T2DM, type 2 diabetes mellitus. |
Baseline characteristics of patients treated by PCPs and specialists were generally consistent over time (Table 1). No changes were apparent in mean age at diagnosis, current age, and body mass index. However, a slight increase was observed in the mean number of antidiabetic agents prescribed. This was more pronounced among specialists, who prescribed an average of 1.6 agents per patient in 2000, increasing to 2.1 per patient in 2015. This increase was greatest between 2000 and 2006, with the mean number of antidiabetic drugs remaining relatively static since 2006.
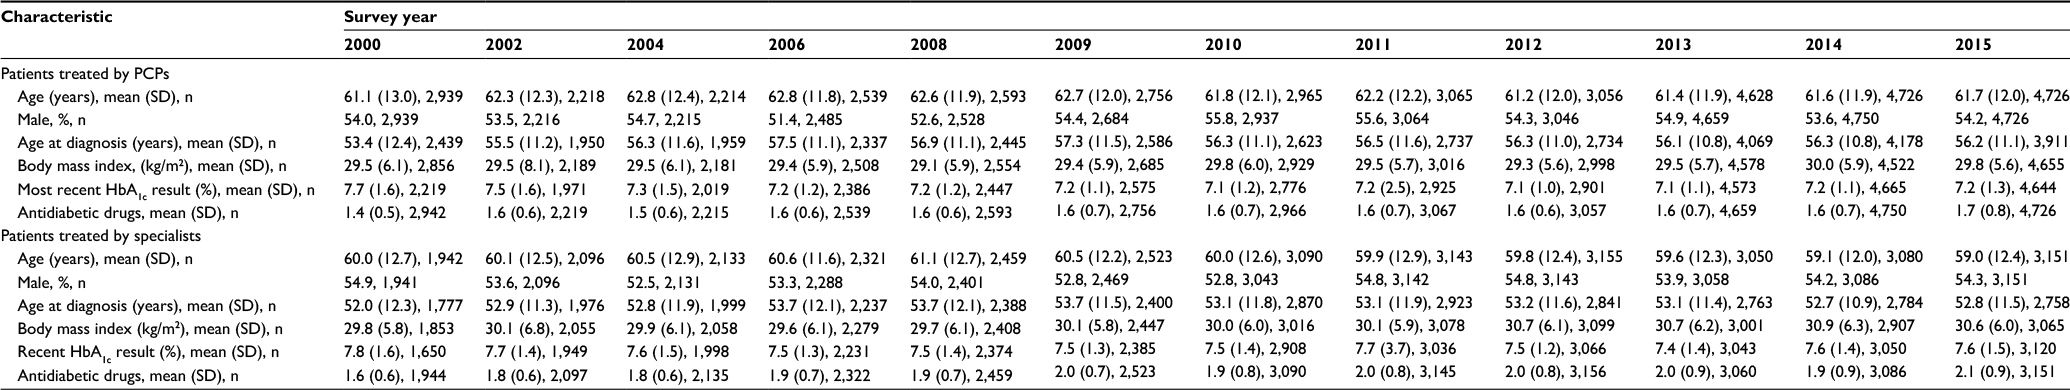 | Table 1 Demographics and clinical characteristics by survey year of patients with T2DM treated by PCPs and specialists Abbreviations: T2DM, type 2 diabetes mellitus; PCPs, primary care physicians; SD, standard deviation; HbA1c, glycated hemoglobin. |
Therapy patterns over time
In order to obtain an overview of treatment received by patients with diabetes, PCPs and specialists were asked to record what therapies their patients were receiving: diet and exercise only; non-insulin drug treatment only; non-insulin drugs plus insulin; and insulin only. As shown in Figure S1, the majority of patients were prescribed non-insulin agents only. Insulin-only regimens and diet and exercise only played a minor role, being used in <20% and <10% of patients, respectively, with these proportions remaining relatively unchanged over time. Both PCPs and specialists have consistently reported prescribing a higher proportion of both non-insulin-only regimens and – especially among specialists – non-insulin plus insulin regimens, and this generally remained static between 2004 and 2015. Owing to these therapy dynamics, subsequent analyses excluded patients on insulin-only regimens and diet and exercise only.
The range of individual regimens used for the treatment of patients with T2DM has changed greatly since 2000, as demonstrated by the introduction of new agents from 2006 onward (Figure 2). Metformin monotherapy was most commonly prescribed by PCPs, increasing to a peak of 44% of patients in 2012 before dropping to 36% in 2015. The use of non-insulin-only combinations containing the new drug classes is derived from the addition of metformin plus DPP-4 inhibitor usage to all other non-insulin regimens containing single or combined use of DPP-4 inhibitors, SGLT-2 inhibitors, and GLP-1 RAs. Non-insulin-only combination use of these newer drug classes increased among PCPs from 4% of patients in 2008 to 33% in 2015, in particular, metformin plus DPP-4 inhibitors predominantly in free form but also included fixed-dose combinations. This pattern was observed to a greater extent among specialists, where the use of the newer non-insulin-only classes, alone or in combination, increased from 1% of patients in 2006 to 43% in 2015. Specialist use of regimens containing non-insulin drugs plus insulin increased over the time period, being prescribed for 16% of patients in 2000 and 29% of patients in 2015, whereas PCP use of these regimens remained relatively static.
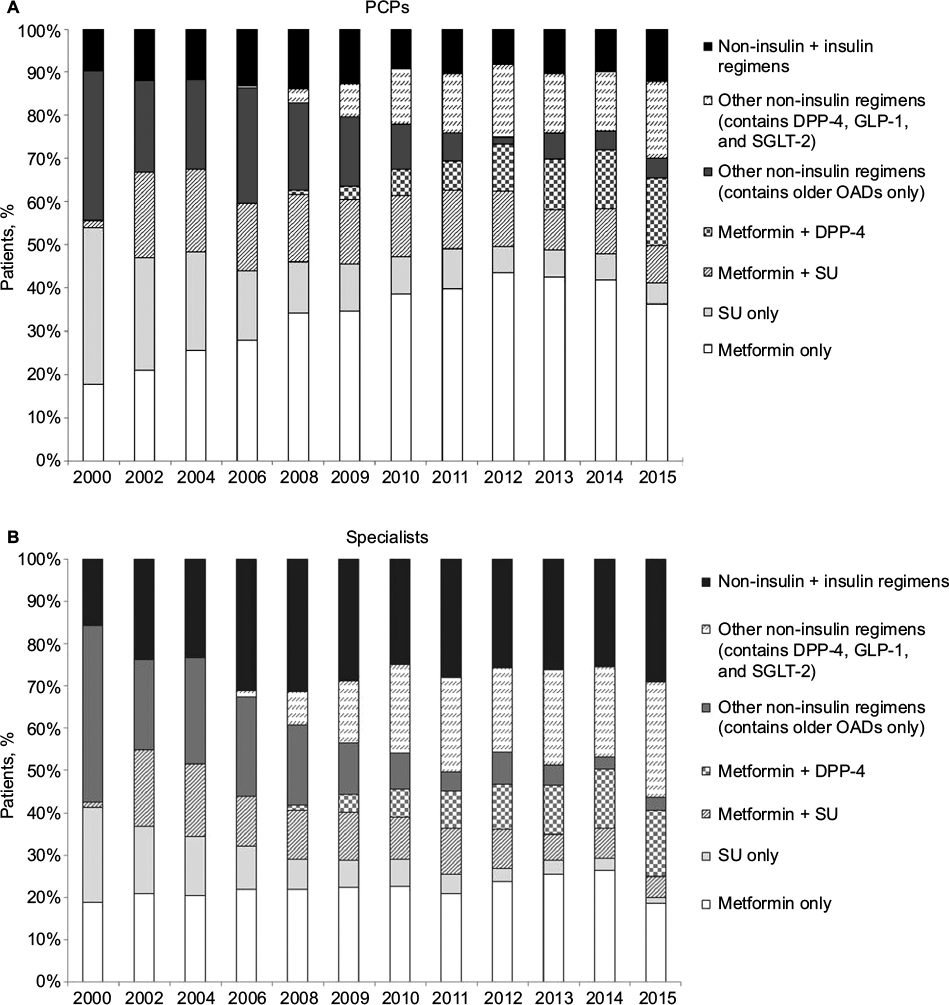 | Figure 2 Combination regimens used for the treatment of patients with T2DM between 2000 and 2015 for (A) PCPs and (B) specialists. Notes: All patients were receiving ≥1 non-insulin antidiabetic treatment and could also have been receiving insulin, but insulin-only patients were excluded. Older OADs category includes prandial glucose regulators, alpha-glucosidase inhibitors, TZDs, and combinations with metformin and SU. All other OADs are included in the “other non-insulin regimens” (including DPP-4 inhibitors, GLP-1 receptor agonists, and SGLT-2 inhibitors). Data collected in Diabetes Disease Specific Programme 2000–2015, physician-completed patient record form. Base: all patients receiving a non-insulin ± insulin regimen from surveys conducted in 2000 (n=4,886), 2002 (n=4,316), 2004 (n=4,350), 2006 (n=4,861), 2008 (n=5,052), 2009 (n=5,279), 2010 (n=6,055), 2011 (n=6,212), 2012 (n=6,213), 2013 (n=7,719), 2014 (n=7,836), 2015 (n=7,877). Abbreviations: T2DM, type 2 diabetes mellitus; PCP, primary care physician; OADs, oral antidiabetic drugs; TZDs, thiazolidinediones; SU, sulfonylurea; DPP-4, dipeptidyl peptidase 4 inhibitor; GLP-1, glucagon-like peptide 1; SGLT-2, sodium–glucose cotransporter 2 inhibitor. |
Insulin initiation: perception versus reality
The proportion of physicians stating they would introduce insulin at HbA1c <8% decreased from 24% of PCPs and 34% of specialists in 2004 to 7% for both PCPs and specialists in 2015 (Figure S2). A corresponding increase in the proportion of physicians waiting until HbA1c was ≥9% was observed over this time period, from 36% of PCPs and 24% of specialists in 2004 to 42% of PCPs and 39% of specialists in 2015.
In line with physicians’ perceptions of insulin being initiated at higher HbA1c levels, mean actual HbA1c level at the time of insulin initiation increased over the study period, as shown in Figure S3, with the most pronounced increase being observed between 2011 and 2014 for PCPs (2011: 8.7%; 2014: 9%) and between 2011 and 2015 for specialists (2011: 8.8%; 2015: 9.7%).
Time to insulin initiation
Figure 3 shows time to insulin initiation, with patients receiving insulin significantly sooner after diagnosis in more recent years (P<0.001; log-rank test). An overall trend toward a shorter time to insulin initiation was observed; this was most pronounced among specialists. For example, a specialist-treated patient diagnosed before 1999 had an 8% likelihood of receiving insulin within the first 5 years after diagnosis compared with 17% for a patient diagnosed between 2004 and 2007 and 19% for a patient diagnosed between 2008 and 2011.
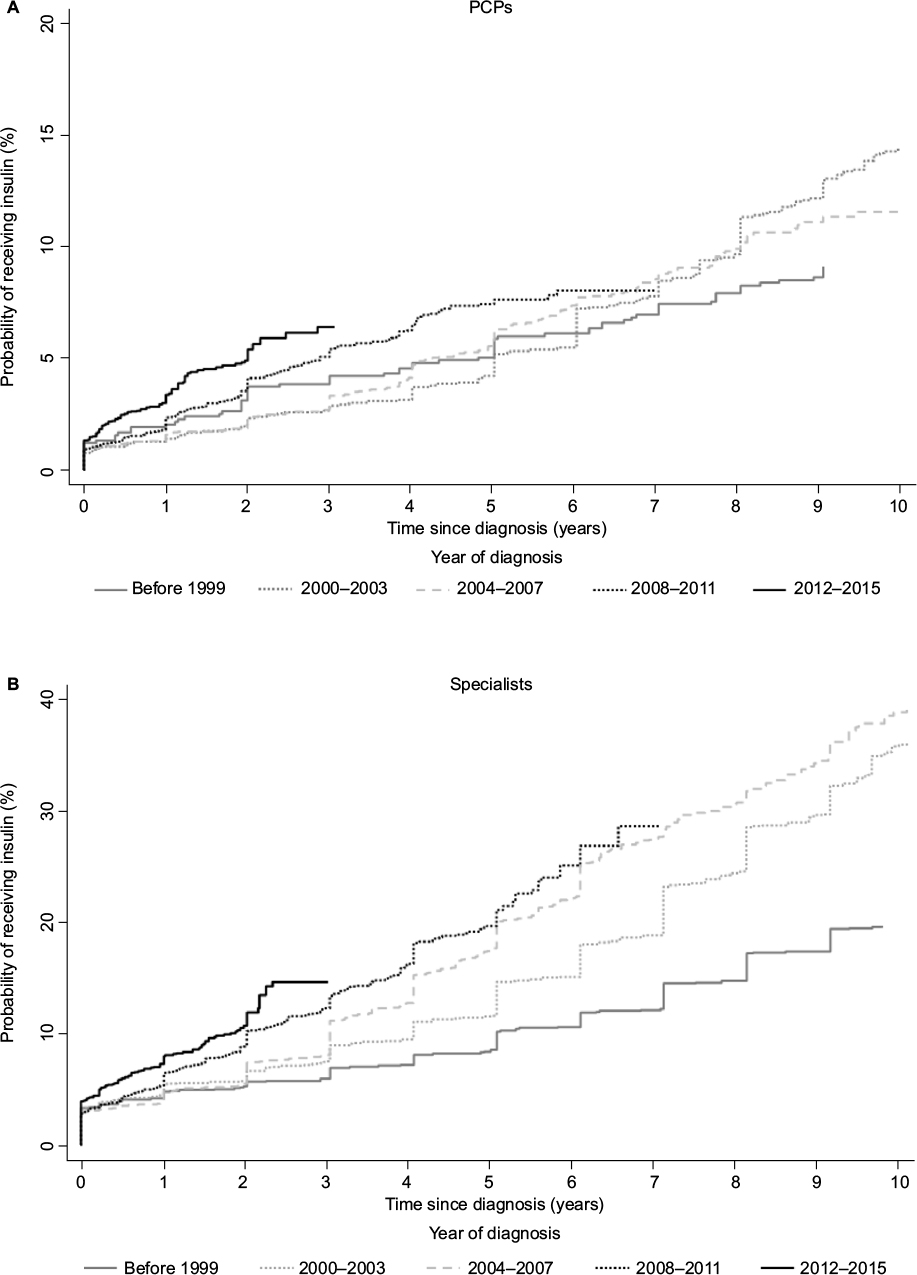 | Figure 3 Time to initiation of insulin in patients with T2DM for (A) PCPs and (B) specialists. Notes: All patients were receiving ≥1 non-insulin antidiabetic treatment and could also have been receiving insulin, but insulin-only patients were excluded. As time to diagnosis of T2DM to the survey date was different in each patient within each wave, time to initiation of insulin was compared for the year the patient was diagnosed, rather than the survey year in which the patient was included. Data collected in Diabetes Disease Specific Programme 2011–2015, physician-completed patient record form. Base: year of diagnosis: pre-1999 (n=2,032), 2000–2003 (n=2,695), 2004–2007 (n=4,959), 2008–2011 (n=10,264), 2012–2015 (n=7,456). Abbreviations: T2DM, type 2 diabetes mellitus; PCPs, primary care physicians. |
Glucose control as measured by most recent HbA1c
The proportion of patients with HbA1c <7%, the goal recommended by many guidelines, is shown in Figure 4. In 2015, 50% of PCP-treated patients were likely to have controlled diabetes compared with 36% of specialist-treated patients. As expected, specialists treated a higher proportion of patients with HbA1c >9% compared with PCPs. Although improvements were seen in both groups of patients between 2000 and 2015, the majority of this progress was achieved between 2000 and 2008; glucose control has improved little since then.
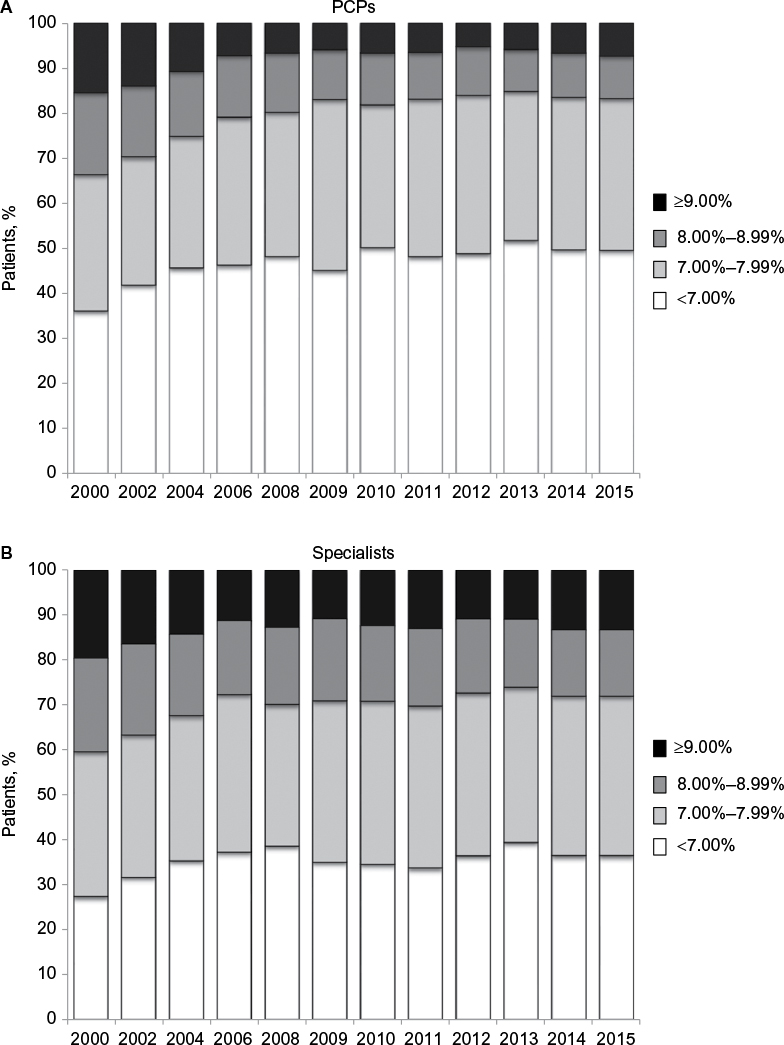 | Figure 4 HbA1c levels in patients with T2DM treated by (A) PCPs and (B) specialists. Notes: All patients were receiving ≥1 non-insulin antidiabetic treatment and could also have been receiving insulin, but excluded insulin-only patients. Data collected in Diabetes Disease Specific Programme 2000–2015, physician-completed patient record form. Base: all patients with stated most recent HbA1c from surveys conducted in 2000 (n=3,869), 2002 (n=3,920), 2004 (n=4,017), 2006 (n=4,617), 2008 (n=4,821), 2009 (n=4,960), 2010 (n=5,817), 2011 (n=5,961), 2012 (n=5,967), 2013 (n=7,616), 2014 (n=7,715), 2015 (n=7,764). Abbreviations: HbA1c, glycated hemoglobin; T2DM, type 2 diabetes mellitus; PCPs, primary care physicians. |
Discussion
Real-world data spanning prolonged time intervals provide an opportunity to gain insights into treatment patterns and how they change over time. The diabetes suite of DSP analyses has assessed clinical trends and treatment patterns almost annually since 2000, providing a real-world view of the changing T2DM environment over this period.
The present analysis of treatment patterns in patients with T2DM over the period between 2000 and 2015 began with a holistic overview of four main treatment classes: diet and exercise only; non-insulin drug treatment only; insulin only; and insulin plus a non-insulin drug. The most apparent changes over time were an increase in the use of insulin plus an oral non-insulin (oral antidiabetic agent with or without GLP-1 RA) and a reduction in the use of oral antidiabetic non-insulin agents alone. This is in line with treatment guidelines, which provide clear recommendations on when insulin should be added to oral non-insulin therapy,1,2 and agrees with the notion that physicians do not appear to feel constrained by payer or formulary influences when prescribing antidiabetic therapies.10 Examination of drug treatment patterns over this time period revealed that specialist use of non-insulin plus insulin regimens doubled between 2000 and 2006, whereas PCP use increased only slightly. Since 2006, there have been large increases in the use of the DPP-4 inhibitors, GLP-1 RAs, and SGLT-2 inhibitors by PCPs and specialists. This coincided with a decline in the use of regimens containing older agents such as SUs, TZDs, prandial glucose regulators, and alpha-glucosidase inhibitors. The use of TZDs may have been affected by the introduction in 2007 of a black box warning for rosiglitazone;11 this may have resulted in an increase in the use of insulin in 2008. In their study of prescribing in the UK primary care population, Sharma et al12 reported an increase in metformin from 55% of treated patients in 2000 to 84% in 2013, while prescription of SUs decreased from 65% to 41%, results that are in agreement with the findings of this analysis.
Our analysis also showed that the mean number of antidiabetic drugs per patient increased slightly between 2000 and 2008, a trend that was more noticeable in patients treated by specialists. Interestingly, the mean number of antidiabetic drugs has remained static since 2006 among PCPs and increased only slightly among specialists, suggesting that PCPs are more likely to switch therapy, while specialists add agents in an effort to achieve glycemic control. Among patients treated by specialists, fewer received metformin monotherapy and more received insulin therapy compared with patients treated by PCPs; this is consistent with more advanced disease at the time of referral to the specialist. Although we observed increased use of newer agents, use of metformin monotherapy remained relatively static, suggesting no move toward introduction of multiple therapies earlier in the treatment path.
Between 2010 and 2015, an increase was observed in the HbA1c level at which physicians stated they would initiate insulin. In-line with these perception data, the HbA1c level at which insulin was actually initiated also increased. Current ADA/EASD guidelines recommend introducing insulin to the regimen for HbA1c levels ≥10%–12%;1 therefore, our findings are suggestive of adherence to guideline recommendations.
Despite insulin now being initiated at higher HbA1c levels than in earlier years, the actual time to insulin initiation decreased over the study period, suggesting that insulin-naive patients are reaching these higher HbA1c levels sooner. Coupled with our data also showing that patient age at diagnosis has not changed over the survey time period, this would suggest that more patients are reaching the point of needing insulin treatment sooner in their disease progression.
A key finding of our research was that, despite the increased range of antidiabetic agents now available, HbA1c levels did not appear to be substantially better in 2015 than in 2000 in specialist-treated patients, although a small reduction was observed in patients treated by PCPs. This is likely to be a consequence of referral bias, with specialists seeing patients with more advanced, complex disease after failure of more straightforward therapy. In-line with our own findings, the prevalence of patients achieving HbA1c <7% reported in the US NHANES study increased from 43% in the 1988–1994 report to 57% in NHANES 2003–2007 report as a result of the availability of newer agents, before falling to 53% in 2007–2010.3 Further research is needed to establish why the development of new and effective antidiabetic agents has not led to better glucose control; however, as the mean change in HbA1c achieved is <1% for many of the glucose-lowering agents and >1% for only the SUs, GLPs, and insulins,13 the challenge faced by clinicians is considerable.
Some limitations of this analysis should be considered. Different waves of the Diabetes DSP surveys are based on questionnaires and interviews that changed over time depending on market changes, needs, and prescribing environments. This evolution of the DSP facilitates the collection of more timely and relevant data, which can be used to monitor trends in a changing landscape. For example, introduction in recent surveys of a key question such as “At what HbA1c level would you initiate insulin?” enhances disease management understanding in today’s market where newer agents offer pre-insulin options that did not previously exist. Information regarding the time from diagnosis to insulin initiation was recorded differently in the various surveys. Questions administered in 2011 and 2012 captured this information via a direct question to the physician in each patient form. Data collected during 2013–2015 derived this information via treatment history information, although it must be borne in mind that it is possible that there may be missing information as physicians might not have had access to the complete patient record from diagnosis, particularly if patients changed their physician (or insurer). Patients included in the surveys may not reflect the general diabetes population, as patients in these analyses are consulting their physician and represent those who are likely to consult more frequently.
Despite these limitations, real-world studies play an important part in highlighting areas of concern that are not addressed in clinical trials. Patients included in clinical trials represent a small proportion of the consulting population as a result of age restrictions and failure to meet stringent eligibility criteria.14 Patients treated in the real-world setting may be less likely to be adherent to medication than those included in clinical trials.15 As a result, data from real-world studies can complement clinical trials and provide insight into the efficacy of interventions in patients commonly seen in clinical practice.
Conclusion
Treatment choices after metformin monotherapy have increased markedly for patients with T2DM, as specialists in particular take advantage of the range of antidiabetic agents and insulins now available. The proportion of patients achieving good glucose control (HbA1c <7%) increased most between 2000 and 2008. However, despite the availability of the newer agents and earlier introduction of insulin regimens, no improvement in the proportion of patients achieving HbA1c <7% has been observed since that time. It would seem that further clarification is required to establish which T2DM treatment pathways should be utilized in individual patient types to achieve improved and sustained glycemic control.
Acknowledgment
The authors would like to thank Deirdre Carman for editorial assistance in the preparation of this manuscript. Adelphi Real World designed the data collection tools, run the fieldwork and own the data.
Disclosure
The authors received no sponsorship or any outside funding or involvement in setting the research objectives, for this analysis and publication. The authors are employed by Adelphi Real World. The authors report no other conflicts of interest in this work.
References
Inzucchi SE, Bergenstal RM, Buse JB, et al. Management of hyperglycaemia in type 2 diabetes, 2015: a patient-centred approach. Update to a position statement of the American Diabetes Association and the European Association for the Study of Diabetes. Diabetologia. 2015;58:429–442. | ||
National Institute for Health and Care Excellence Guidance [webpage on the Internet]. Type 2 diabetes: the management of type 2 diabetes. Available from: https://www.nice.org.uk/guidance/ng28. Accessed August 18, 2016. | ||
Stark Casagrande S, Fradkin JE, Saydah SH, Rust KF, Cowie CC. The prevalence of meeting A1C, blood pressure, and LDL goals among people with diabetes, 1988–2010. Diabetes Care. 2013;36:2271–2279. | ||
Ali MK, McKeever Bullard K, Imperatore G, Barker L, Gregg EW; Centers for Disease Control and Prevention (CDC). Characteristics associated with poor glycemic control among adults with self-reported diagnosed diabetes – National Health and Nutrition Examination Survey, United States, 2007–2010. MMWR Morb Mortal Wkly Rep. 2012;61(suppl):32–37. | ||
Health and Social Care Information Centre. National Diabetes Audit 2012–2013. Report 1: Care Processes and Treatment Targets; 2014. Available from: http://www.hscic.gov.uk/catalogue/PUB14970/nati-diab-audi-12-13-care-proc-rep.pdf. Accessed August 18, 2016. | ||
Anderson P, Benford M, Harris N, Karavali M, Piercy J. Real-world physician and patient behaviour across countries: disease-specific programmes – a means to understand. Curr Med Res Opin. 2008;24:3063–3072. | ||
US Department of Health and Human Services. Summary of the HIPAA Privacy Rule; 2003. Available from: http://www.hhs.gov/sites/default/files/privacysummary.pdf. Accessed August 18, 2016. | ||
EphMRA Code of Conduct [webpage on the Internet]. Updated January 2016. Available from: http://www.ephmra.org/code-of-conduct/2/A-Purpose-Scope-and-Sources. Accessed August 18, 2016. | ||
Health Information Technology. Health Information Technology Act. Available from: https://www.healthit.gov/sites/default/files/hitech_act_excerpt_from_arra_with_index.pdf. Accessed August 18, 2016. | ||
Silvey M, Higgins V, Leith A, Benford M, Graham A, Piercy J. International differences in the role of payer and administrative controls in prescribing decisions in type 2 diabetes mellitus (T2DM). Value Health. 2016;19:A209. | ||
U.S. Food & Drug Administration [webpage on the Internet]. FDA Adds Boxed Warning for Heart-related Risks to Anti-Diabetes Drug Avandia Agency says drug to remain on market, while safety assessment continues; 2007. Available from: http://www.fda.gov/NewsEvents/Newsroom/PressAnnouncements/2007/ucm109026.htm. Accessed September 13, 2016. | ||
Sharma M, Nazareth I, Petersen I. Trends in incidence, prevalence and prescribing in type 2 diabetes mellitus between 2000 and 2013 in primary care: a retrospective cohort study. BMJ Open. 2016;6(1):e010210. [Erratum in: BMJ Open. 2016;6:e010210corr1]. | ||
Liu SC, Tu YK, Chien MN, Chien KL. Effect of antidiabetic agents added to metformin on glycaemic control, hypoglycaemia and weight change in patients with type 2 diabetes: a network meta-analysis. Diabetes Obes Metab. 2012;14(9):810–820. | ||
Saunders C, Byrne CD, Guthrie B, et al; Scottish Diabetes Research Network Epidemiology Group. External validity of randomized controlled trials of glycaemic control and vascular disease: how representative are participants? Diabet Med. 2013;30(3):300–308. | ||
Hubbard TE, Paradis R. Real-World Evidence: A New Era for Health Care Innovation. The Network for Excellence in Health Innovation; 2015. Available from: http://www.nehi.net/writable/publication_files/file/rwe_issue_brief_final.pdf. Accessed August 18, 2016. |
 © 2016 The Author(s). This work is published and licensed by Dove Medical Press Limited. The full terms of this license are available at https://www.dovepress.com/terms.php and incorporate the Creative Commons Attribution - Non Commercial (unported, v3.0) License.
By accessing the work you hereby accept the Terms. Non-commercial uses of the work are permitted without any further permission from Dove Medical Press Limited, provided the work is properly attributed. For permission for commercial use of this work, please see paragraphs 4.2 and 5 of our Terms.
© 2016 The Author(s). This work is published and licensed by Dove Medical Press Limited. The full terms of this license are available at https://www.dovepress.com/terms.php and incorporate the Creative Commons Attribution - Non Commercial (unported, v3.0) License.
By accessing the work you hereby accept the Terms. Non-commercial uses of the work are permitted without any further permission from Dove Medical Press Limited, provided the work is properly attributed. For permission for commercial use of this work, please see paragraphs 4.2 and 5 of our Terms.