")
Back to Journals » Cancer Management and Research » Volume 10
Trends in incidence and mortality of female breast cancer during transition in Central China
Authors Cheng Y, Yan Y, Gong J, Yang N, Nie S
Received 13 August 2018
Accepted for publication 10 October 2018
Published 23 November 2018 Volume 2018:10 Pages 6247—6255
DOI https://doi.org/10.2147/CMAR.S182510
Checked for plagiarism Yes
Review by Single anonymous peer review
Peer reviewer comments 2
Editor who approved publication: Professor Harikrishna Nakshatri
Yao Cheng,1 Yaqiong Yan,2 Jie Gong,2,* Niannian Yang,2,* Shaofa Nie1,*
1Department of Epidemiology and Biostatistics, Ministry of Education Key Lab of Environment and Health, School of Public Health, Tongji Medical College, Huazhong University of Science and Technology, Wuhan, China; 2Department of Chronic Disease Prevention and Control, Wuhan Centers for Disease Prevention and Control, Wuhan, China
*These authors contributed equally to this work
Purpose: Following the implementation of breast cancer (BC) control strategies for years in Central China, the outcome needs to be evaluated and further strategies based on long-term surveillance should be formulated. Therefore, we examined the trends of BC incidence and mortality during 1990–2014 and projected them to 2024 in Wuhan, Central China.
Patients and methods: The incidence and mortality data of BC were extracted from the Wuhan Cancer Registry. The average annual percentage changes (AAPCs) of the age-standardized incidence rate (ASIR) and age-standardized mortality rate (ASMR) were analyzed using Joinpoint regression. The Nordpred R-package was used to project BC incidence and mortality between 2015 and 2024. The age–period–cohort analysis was applied to evaluate the age, period, and cohort effects on the trends of BC incidence and mortality.
Results: Overall, the ASIR increased markedly from 20.01 to 44.26 per 100,000 (AAPC=3.3%, 95% CI: 1.7%, 5.0%) during 1990–2014, and it was projected to keep increasing in the next decade (AAPC=3.0%, 95% CI: 2.0%, 4.1%). The ASMR of BC leveled off during the study period (AAPC=0.4%, 95% CI: −0.2%, 0.9%). The BC mortality of the older group (aged 50–79 years) showed significant upward trends in both observed and projected periods. Strong age, period, and cohort effects were observed in BC incidence, and BC mortality was significantly driven by age and cohort effects.
Conclusion: The ASIR in Wuhan was approaching those areas with the highest BC risk in China, and the evident increase in BC incidence suggested that prior strategies for BC control should be adopted. In particular, further strategies for reducing BC mortality in older age groups should be reinforced in Wuhan, Central China.
Keywords: breast cancer, incidence, mortality, trend, rate projection
Introduction
Breast cancer (BC), a common life-threatening malignancy, has become the leading cause of cancer-related death in women worldwide.1 Globally, BC accounts for approximately 1.67 million new cases and 0.5 million deaths in 2012.2 The estimated 268,600 new cases and 69,500 deaths occurred in China in 2015.3 Although the BC incidence and mortality in China are lower than those in most socioeconomically well-developed countries, these rates have kept increasing during past decades, and the mortality-to-incidence ratio is higher in China.4
Together with the implementation of the Cancer Prevention and Control Program (2004–2010),5 cancer management has become a vital component of the health system in China. A previous study revealed that East China has the highest BC incidence rate, followed by Central China, and then West China.3 However, regional BC control is hampered by limited epidemiological evidence due to insufficient long-term surveillance data.6 Huang et al reported a remarkable increase in BC incidence and a slight increase in BC mortality during 1973–2012 in urban Shanghai, a developed city in East China.7 Given the regional discrepancy due to variations in access to cancer care, early detection policies and treatment, and heterogeneous distribution of risk factors, this long-term study cannot be generalized to all cities in China.8
Wuhan is the largest city in Central China and represents a medium-level economy in China. Meanwhile, Wuhan is a fast-developing city expected to develop into an international metropolis by 2049.9 This pattern of fast development mirrors that of many cities across the world. A notable increase in BC incidence was observed in Asian countries such as Japan, Thailand, and Singapore during fast socioeconomic development.10 In this regard, a heavy BC burden could emerge that accompanies the rapid socioeconomic development in Wuhan. Therefore, a comprehensive evaluation and projections of the trends of BC incidence and mortality during the past decades are urgently needed to identify possible strategies for further BC control.
Studies are needed to better understand the effects of previous BC control policies that will help to develop clear and targeted health-planning strategies. The aims of this study were to examine the trends of BC incidence and mortality during the observed period (1990–2014) and to predict the rates in the next decade (2015–2024), as well as to evaluate the age, period, and cohort effects on trends of BC incidence and mortality in Wuhan, Central China.
Patients and methods
Study sites and population
Wuhan, the capital city of Hubei Province in China, has a total population of 10.8 million (97% Han Chinese) and covers an area of 8,594 km2. It owns 13 districts, including 7 urban districts and 6 rural districts. Wuhan is located at 29.58°–31.22° north latitude and 113.41°–115.05° east longitude, making it the “heart” of China. Moreover, Wuhan is one of the biggest transportation hubs for land, water, and air transport in China. The surveillance data of this study covered an average 2.1 million female permanent residents who were registered as official residents of the seven urban districts in Wuhan from January 1, 1990, to December 31, 2014. This article was approved by the Ethics Committee of Wuhan Center for Disease Prevention and Control (WHCDCIRB-K-2014002). This study used population-based surveillance data without any individual patient identifiers.
Incidence and mortality data
The BC incidence and mortality data were obtained from the Cancer Registry established in the 1980s affiliated with the Wuhan Centers for Disease Prevention and Control – one of the oldest cancer registries in China. The incidence and mortality cases during the 25-year period were defined according to the Ninth Revision of the International Classification of Diseases (ICD-9) before 2003 (code 174), and those after 2003 were defined by the ICD-10 coded as C50 and C500–C509. The incidence data have been published by Cancer Incidence in Five Continents (CI5-VIII),11 and the quality of mortality data was also highly reliable as it was strictly checked and verified at all levels of departments. The registry system and data collection procedure have been previously described in detail.12 There were 19,146 new cases and 4,707 mortality cases of BC covering the entire permanent urban population in this study.
Statistical analysis
The Cancer Registry of Wuhan conducts a full-range cancer surveillance among the entire permanent resident population in this area. BC incidence and mortality data were extracted and categorized into 18 age groups of 5-year intervals (0–4, 5–9, 10–14, 15–19, 20–24, 25–29, 30–34, 35–39, 40–44, 45–49, 50–54, 55–59, 60–64, 65–69, 70–74, 75–79, 80–84, and ≥85 years). The age-standardized incidence rate (ASIR) and age-standardized mortality rate (ASMR) were calculated by direct standardization using the world standard population released by the WHO.13 Trends in BC incidence and mortality were assessed using Joinpoint regression analysis (Joinpoint Regression Program version 4.0.4, released May 2013; Statistical Research and Applications Branch, Surveillance Research Program of the US National Cancer Institute), which was proposed by Kim et al and has been widely used by other researchers.14,15 The average annual percentage change (AAPC) with corresponding 95% CI was estimated in this study.
We used the Nordpred R-package developed by the cancer registry of Norway to predict age-specific BC incidence and mortality rates in 5-year interval periods (2015–2019 and 2020–2024), based on the previous five periods. This model is known for its ability to project how current trends are going to develop in the future.16 Details of the analysis method have been published previously.17 Briefly, Nordpred uses a power link function and Poisson age–period–cohort models to improve projection accuracy of cancer incidence and mortality rates. The model was written as follows:
|
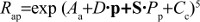
Rap is defined as the incidence or mortality rate in each age group (a) and in each period (p), respectively. Aa is defined as the parameter attributable to the age group (a). D is defined as the common drift parameter accounting for the linear component of the trend. Pp refers to the nonlinear period component of the period (p). Cc refers to the nonlinear cohort component of the cohort (c). Departure from a linear trend was tested by checking the significance of S in the model. If S was significant, the recent trend (2005–2009 to 2010–2014) would be used to predict the drift component. Otherwise, an average trend from all of the five periods (1990–1994 to 2010–2014) would be used. The lower age limit considered for analysis was based on a minimum of ten cases in the combined periods (25–29 years for incidence and 35–39 years for mortality).
The age–period–cohort model described the variance in BC incidence and mortality trends according to age, period, and cohort effects over each 5-year period, using an R-based web tool from the US National Cancer Institute developed by Rosenberg et al.18 Data were categorized into 5-year age groups and seven quinquennia for the period 1990–2024. The estimated annual percentage change (EAPC) and 95% CI of BC incidence and mortality rates were calculated. The incidence and mortality rate ratios and 95% CI of every period (or cohort) in comparison with the reference period (or cohort) were calculated, with adjustment for age and cohort (or period) effects. In this study, cohort effects on incidence rates were calculated in eleven age groups (from 30–34 to 80–84 years), whereas cohort effects on mortality rates were calculated in ten age groups (from 35–39 to 80–84 years). Younger or older age groups were not included owing to the small number of cases.
Results
The ASIR in Wuhan experienced a substantial increase from 20.01 per 100,000 in 1990 to 44.26 per 100,000 in 2014 (AAPC=3.3%; 95% CI: 1.7%, 5.0%; Figure 1). In addition, the projected 5-year ASIR increased by 3.0% (95% CI: 2.0%, 4.1%) in 1990–2024 (Figure 2). The ASMR was 7.51 per 100,000 women in 2014 and plateaued during the observed and projected periods (AAPC=0.4%; 95% CI: −0.2%, 0.9% and AAPC=0.1%, 95% CI: −0.3%, 0.6%, respectively).
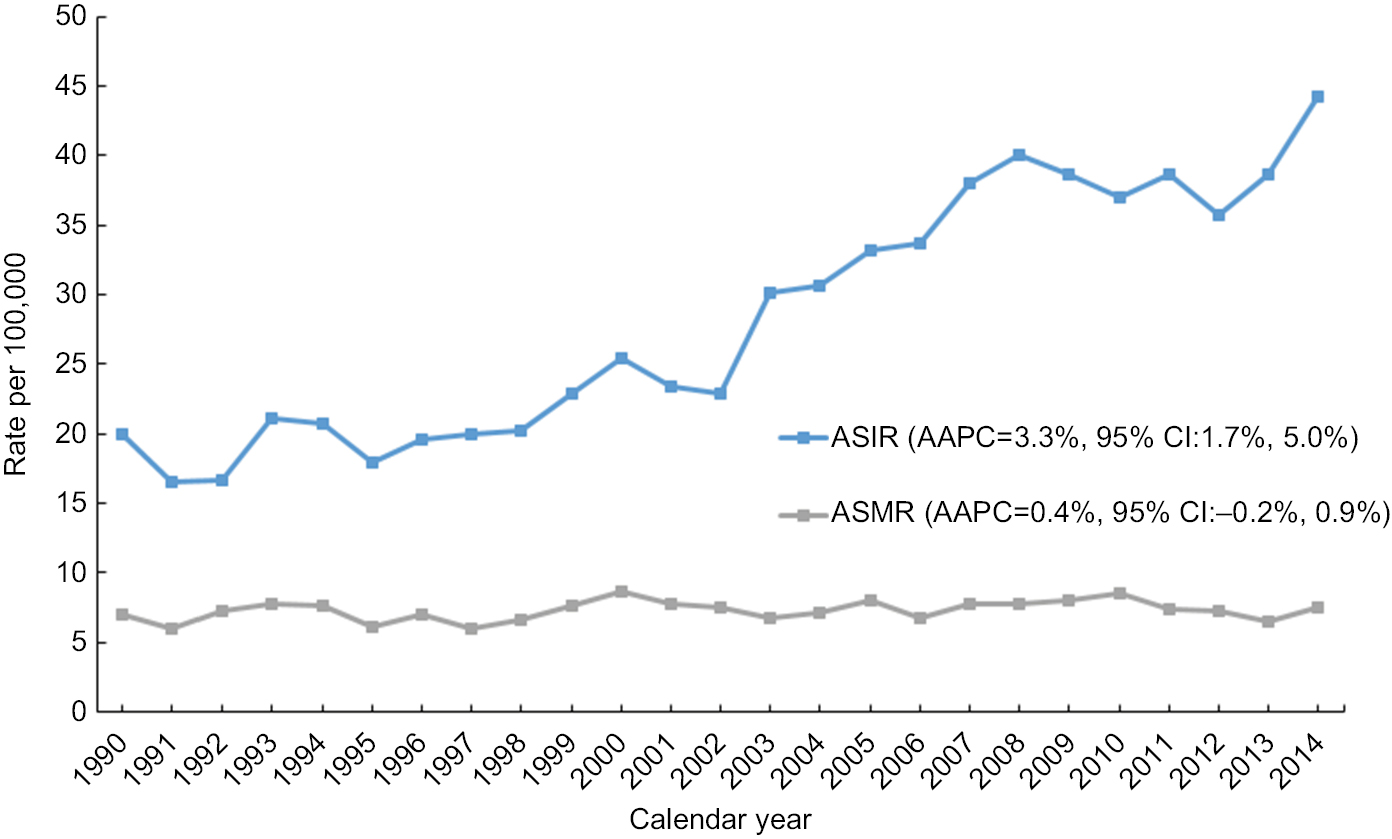 | Figure 1 Time trends in ASIR and AMSR of breast cancer in Wuhan, 1990–2014. Abbreviations: AAPC, average annual percentage change; ASIR, age-standardized incidence rate; ASMR, age-standardized mortality rate. |
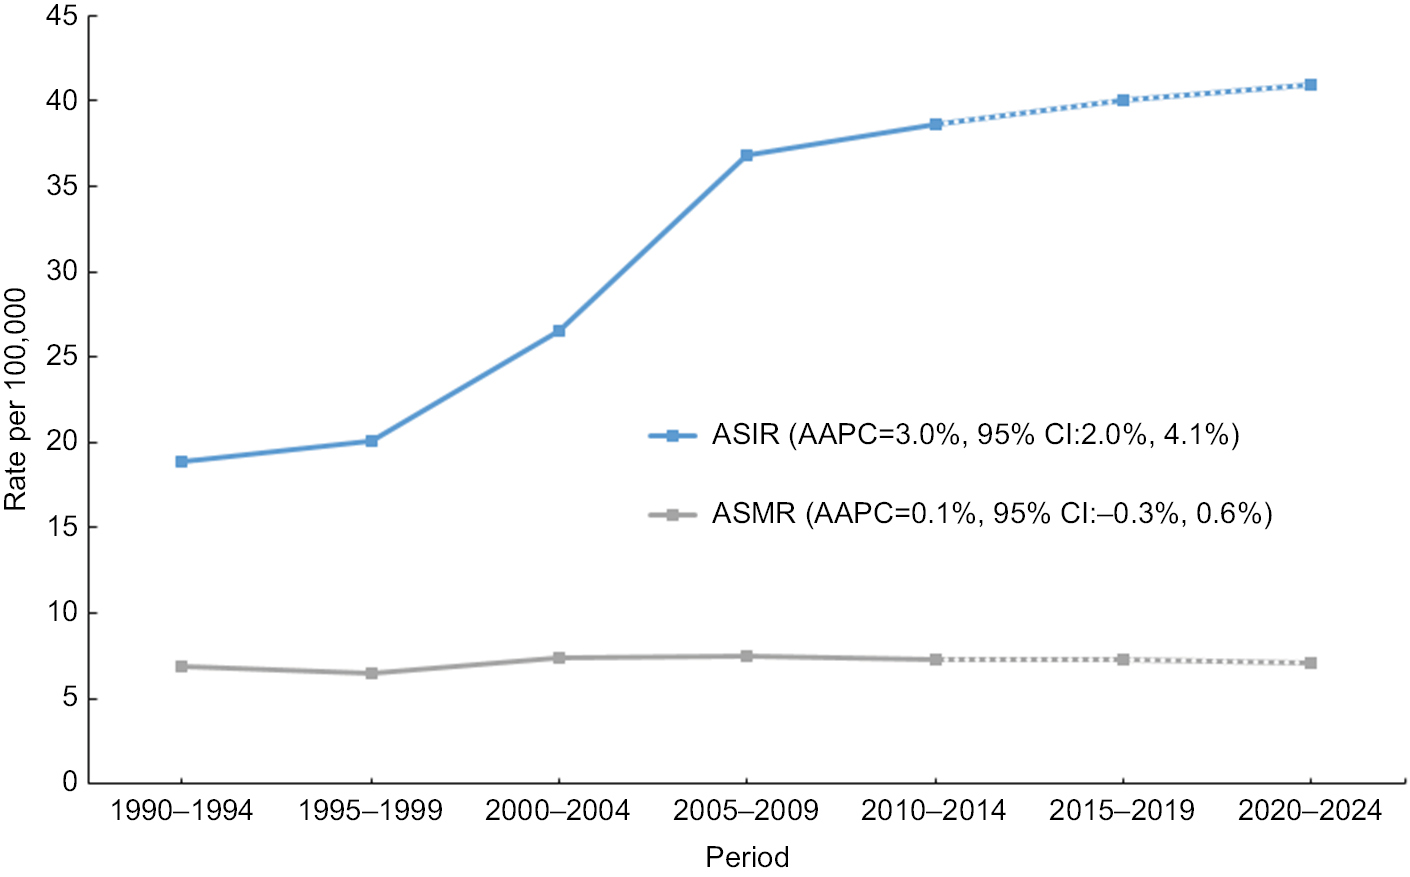 | Figure 2 Time trends in 5-year ASIR and ASMR of breast cancer in Wuhan, 1990–2024. Note: Dotted line represents projected period. Abbreviations: AAPC, average annual percentage change; ASIR, age-standardized incidence rate; ASMR, age-standardized mortality rate. |
The age distributions of BC incidence and mortality cases are provided in Table 1. In the latest period of 2010–2014, most BC incidence and mortality cases were among women older than 50 years (66.79% and 82.16%, respectively). The number of patients with BC aged 55–59 years comprised the highest proportion of both incidence (17.59%) and mortality (18.68%).
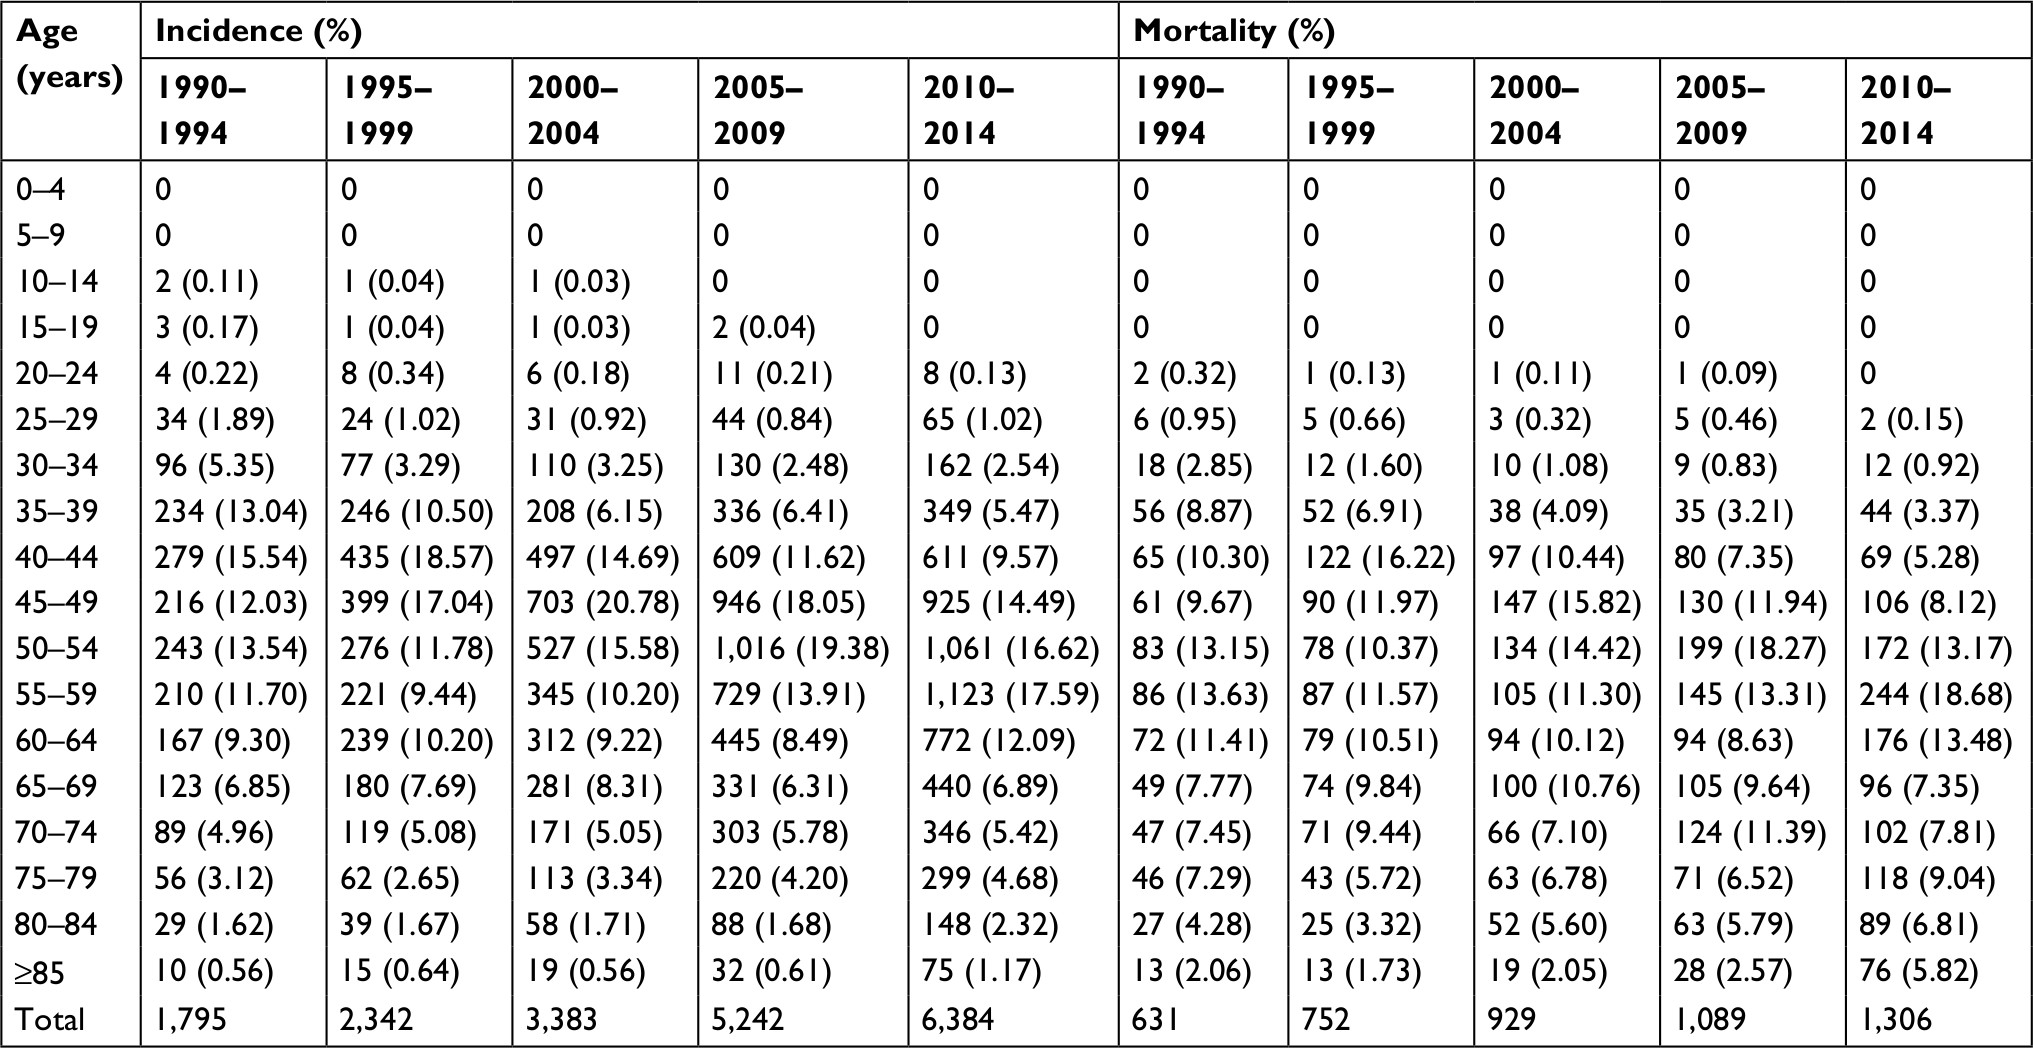 | Table 1 Age distribution (proportion) of breast cancer cases in Wuhan, 1990–2014 |
Table 2 shows the age-specific incidence and mortality rates of patients with BC between 1990 and 2024. The age group 55–59 years had the highest incidence, with 119.16 per 100,000, in the latest observed period 2010–2014. The age peak of BC incidence shifted from the age group 50–54 years in 1990–1994 to 60–64 years in the projected period 2020–2024. The age-specific rates of BC mortality increased with the growing age, and women aged 80–84 years had the highest mortality of all age groups.
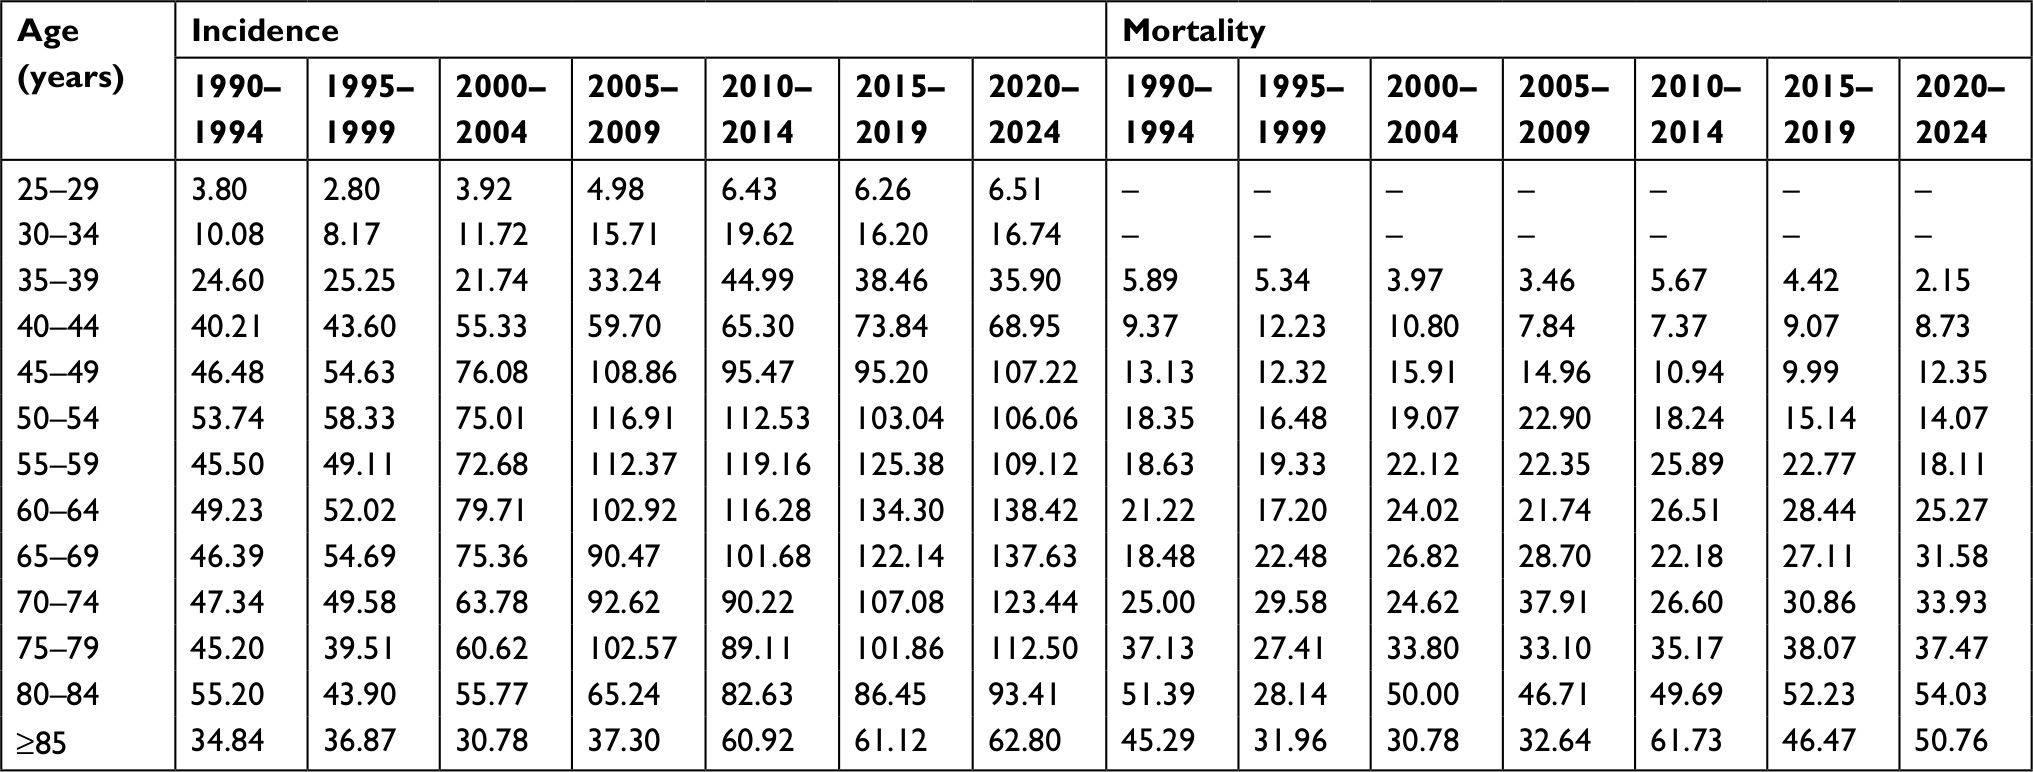 | Table 2 Age-specific incidence and mortality rates (per 100,000 women) of breast cancer in Wuhan by 5-year periods during 1990–2024 |
The EAPC in BC incidence and mortality rates for the selected 5-year age groups during 1990–2024 are provided in Table 3. The EAPC of age-specific BC incidence showed significant upward trends, ranging from 2.69% (0.61%, 4.81%) to 5.09% (4.57%, 5.62%) in the observed period. The BC mortality rate of the age group 40–44 years showed a significant downward trend during the observed period (EAPC=−2.08%, 95% CI: −3.18%, −0.97%). However, the trends in BC mortality of older age groups (50–54, 55–59, 60–64, and 70–74 years) increased significantly during 1990–2014. In 1990–2024, BC mortality in younger age groups (<55 years) showed significant downward trends, whereas that of older age groups (55–79 years) continued to increase.
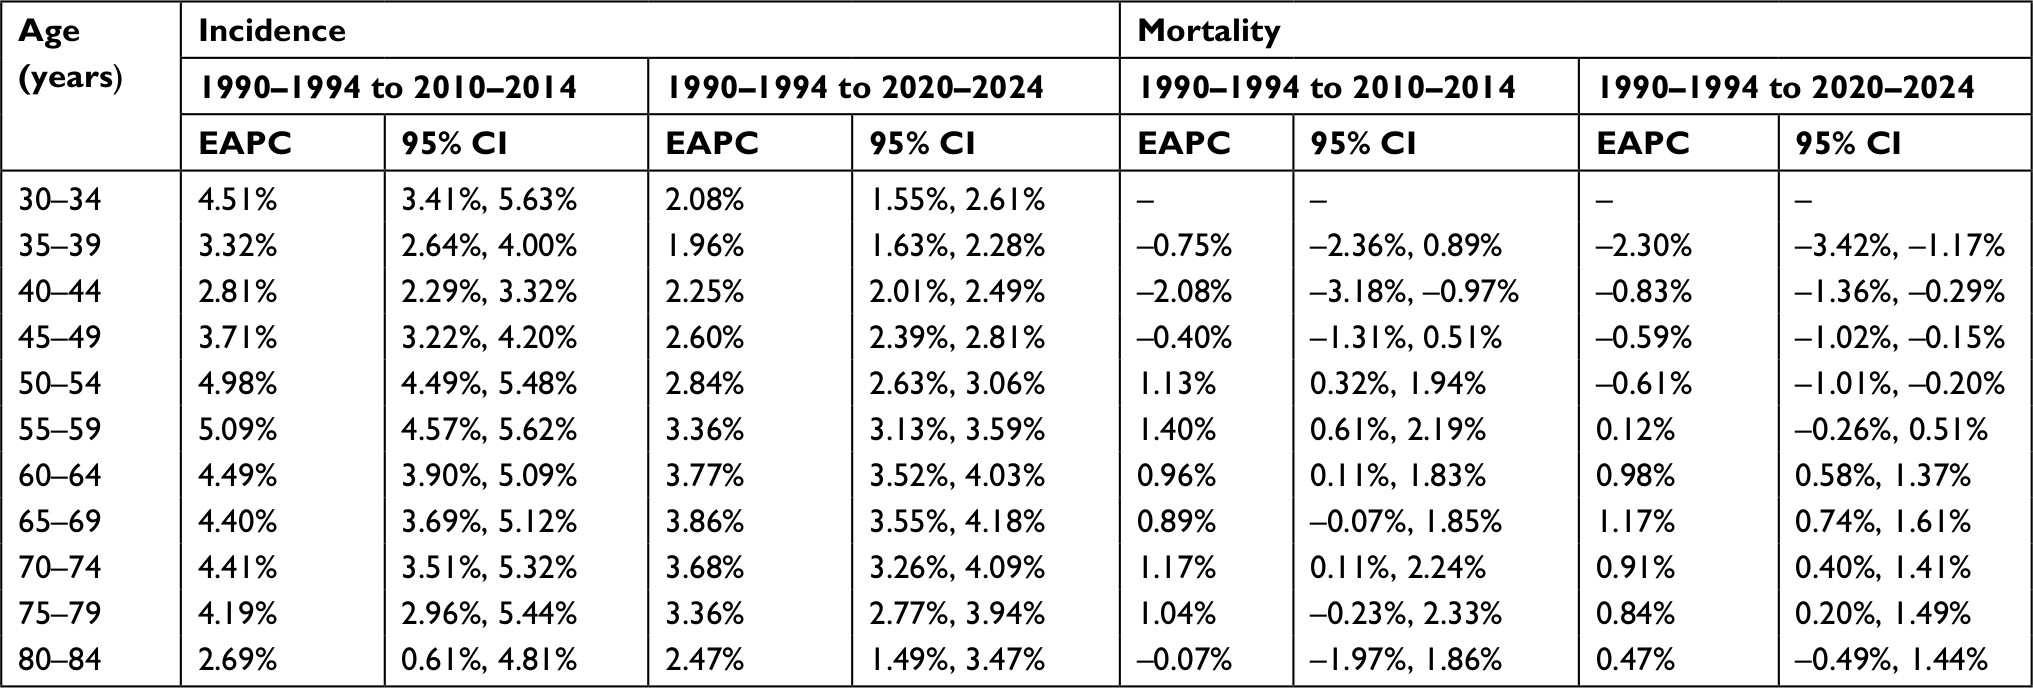 | Table 3 Estimated age-specific annual percentage change in breast cancer incidence and mortality rates in Wuhan, 1990–2024 Abbreviation: EAPC, estimated annual percentage change. |
Figure 3 depicts the longitudinal age curves of BC incidence and mortality, adjusted for period and cohort deviations. The curve shows that the risk of BC incidence and mortality increased with age. Figure 4 shows the period rate ratios of incidence and mortality of each period, in reference to the period 2005–2009. The period effect was statistically significant for BC incidence trends. BC incidence risk accelerated throughout the study period. The period-driven incidence accelerated during 1995–1999 to 2005–2009, then decelerated after the period 2005–2009. In addition, the period effect showed no significant impact on BC mortality trend. Figure 5 shows the cohort rate ratios of BC incidence and mortality in each cohort relative to the reference cohort of the 1950s. The cohort effect was significant for BC incidence and mortality. Incidence risk accelerated less rapidly prior to the 1965s, then soared after 1970. The mortality risk fluctuated in the study cohort, but an apparent breaking point occurred in 1955. Results of Wald’s goodness-of-fit test for the age–period–cohort models are presented in Table 4.
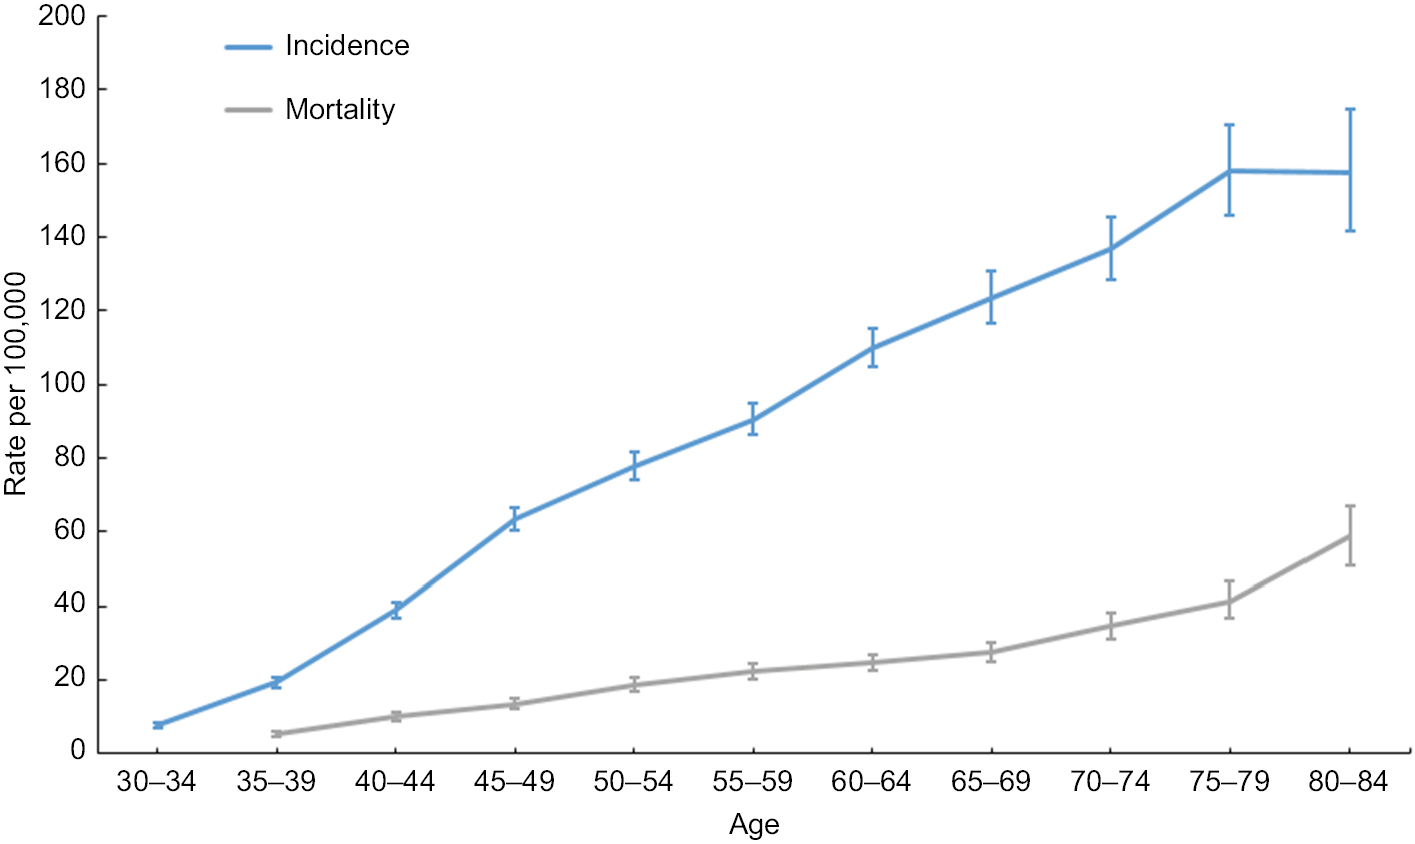 | Figure 3 Longitudinal age curves and 95% CI of breast cancer incidence and mortality. |
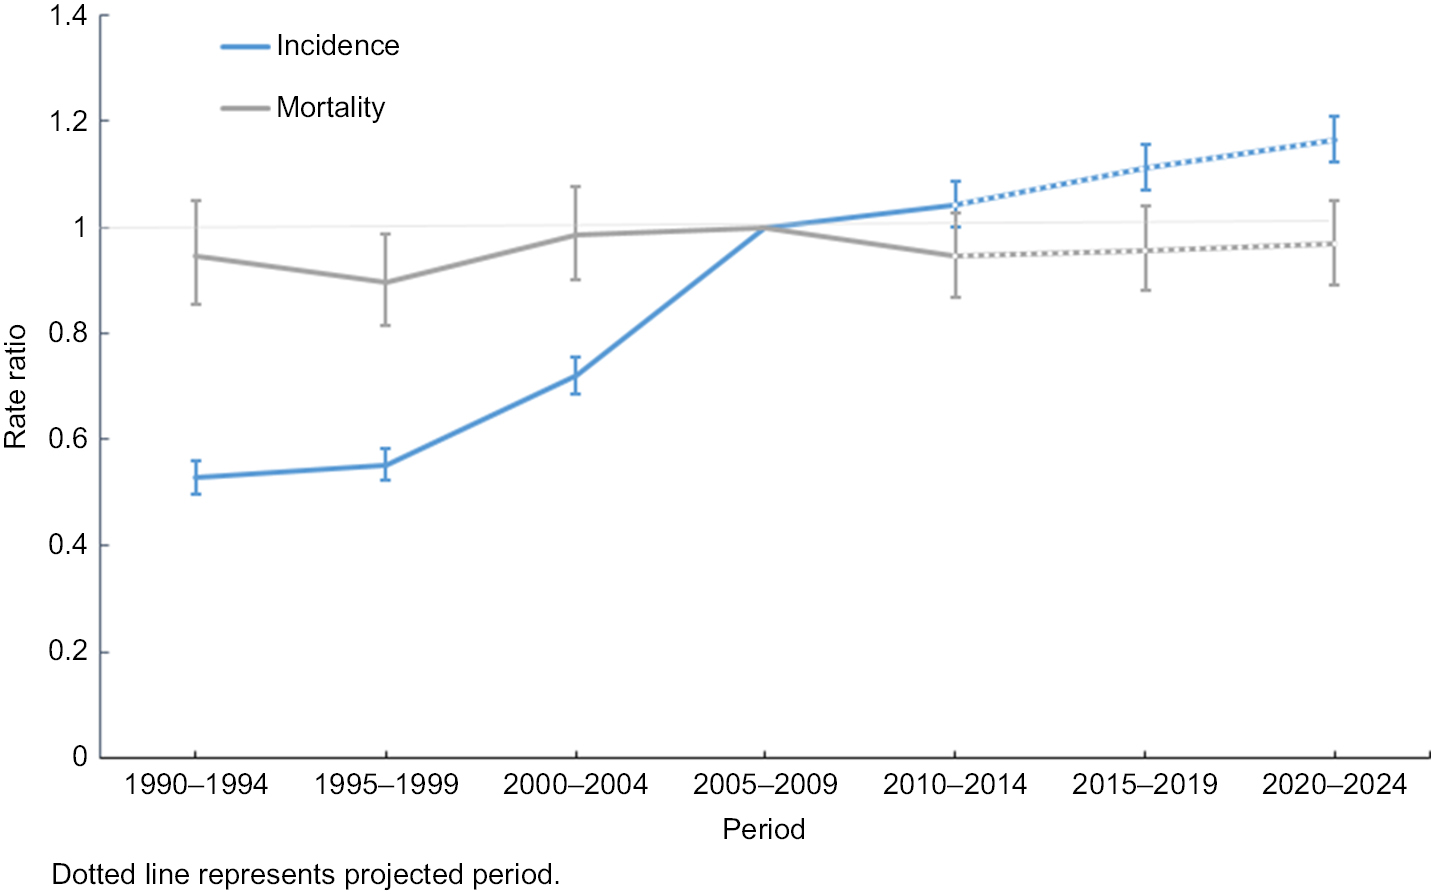 | Figure 4 Period rate ratios and 95% CI of breast cancer incidence and mortality in each period, in reference to the period 2005–2009. |
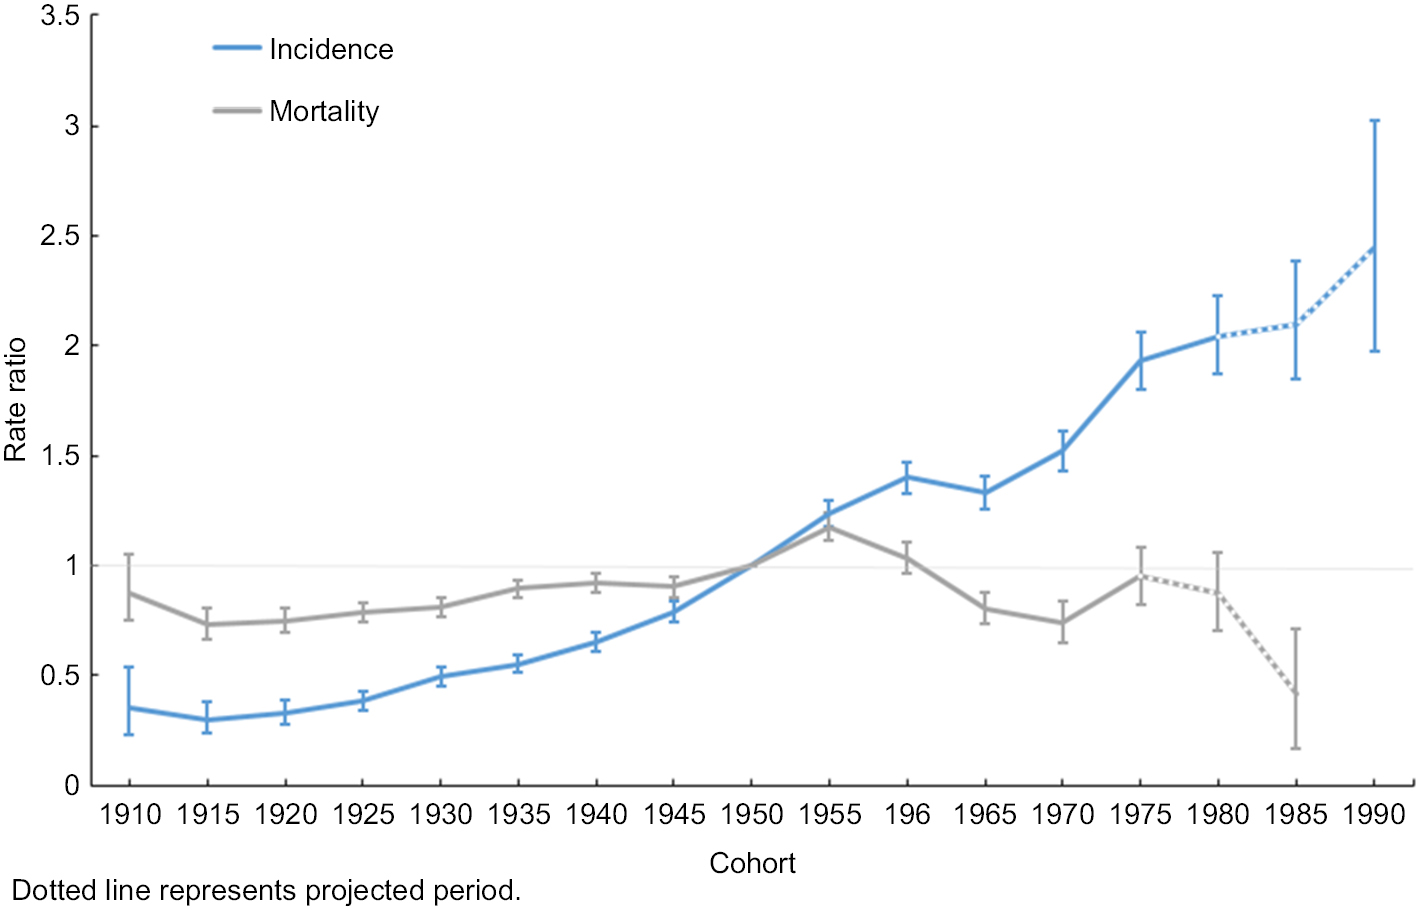 | Figure 5 Cohort rate ratios and 95% CI of breast cancer incidence and mortality in each cohort, in reference to the 1950s cohort. |
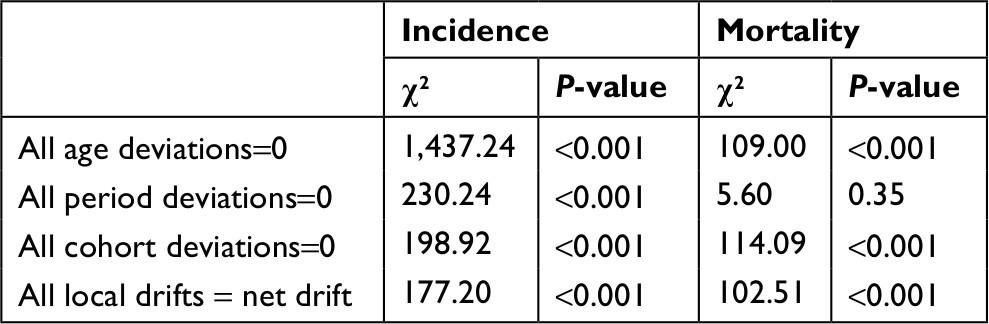 | Table 4 Statistical parameters for overall changes in breast cancer incidence and mortality rates in age–period–cohort models |
Discussion
This study provided a unique parallel analysis of long-term trends in BC incidence and mortality in Wuhan, Central China. First, we revealed that the overall ASIR and ASMR of BC in Wuhan were 44.26 and 7.51 per 100,000, respectively, in 2014. The ASIR in Wuhan is approaching the rates in other developed areas of China with the highest BC risk, such as urban Shanghai (44.4 per 100,000 according to the latest report in 2012)7 and urban Guangdong (42.7 per 100,000 according to the latest report in 2012),19 which is even higher than that of urban Beijing, the capital city of China (33.4 per 100,000 according to the latest report in 2014).20 Our findings predict that the BC incidence will continue to rise in the next decade. This serves as a reminder that BC incidence in rapidly developing regions should be carefully monitored, and measures should be adopted to control BC.
We found that Wuhan had a relatively high AAPC of 3.3% annually, consistent with that of other Asian populations, such as in southern Thailand;21 however, the AAPC in Wuhan is much higher than that of Shanghai (1.7%).22 Compared with Western countries, AAPC in Wuhan is nearly equal to that in the USA in the early 1980s23 and to that in Poland during 1990–1996. Nonetheless, decreasing trends were observed in later periods.24 Following the establishment of the national guidelines for BC diagnosis and treatment in 2007,25 annual mammography screening for women aged 40–49 years and every 1–2 years for women aged 50–69 years is recommended for BC control in Wuhan. By 2012, 16.4% of women aged 40–69 years in urban areas of China had been screened.26 This BC control policy might have partly contributed to the increased ASIR after the introduction of the national guidelines, compared with earlier years.
The age peak of BC incidence was 45–54 years during 1990–2004, which is in line with that of Shanghai and Beijing.27 It is surprising that the age peak of BC was projected to be 60–64 years in 2020–2024, which would be a large shift toward older age, close to the current level in the USA.8 This increasing age incidence peak indicates that some risk factors might change from one generation to the next, which could affect the age-specific BC incidence. This result highlights that the effects of the adoption of a Westernized lifestyle among Wuhan residents might contribute to the synchronization of the incidence peaks in both populations for the age group 60–64 years. However, it should be noted that the upsurge of BC incidence observed in Wuhan was much steeper, endured longer, and showed increasing trends in every 5-year age group.
Separate APC analyses for incidence showed that age, period, and cohort effects were significantly related to incidence trends. The accelerating increase of BC incidence driven by period effects in 1995–1999 to 2005–2009 might be partly explained by the fast urbanization and economic development in the seven urban districts of Wuhan during this period.28 Since 2010, the urbanization rate was more than 95% and the pace was slowing down to a large extent.
Strong cohort effects were observed in BC incidence, confirming the findings of studies in Asian29 and Western countries.30 Because organized population-based BC screening in urban Wuhan only covers low-income residents,31 the cohort-driven incidence might be partly attributable to improvements in the sensitivity of screening technology, improved self-participation in regular screening, and increased life expectancy of older generations.26 During the socioeconomic transition of the 25-year period, Chinese women have gone through different patterns of lifestyle. This might also be attributable to the adoption of a Westernized lifestyle and higher rates of obesity; physical inactivity; improved intake of red and processed meat; smoking; drinking; use of oral contraceptives; postmenopausal estrogen replacement therapy; menstrual and reproductive factors such as extended menstruation, late age at first live birth, and reduced breastfeeding rates, which were well-documented risk factors.32–38 Furthermore, after the birth cohort of the 1970s, the upward trend of BC incidence began to accelerate, probably owing to the decreased fertility rate after implementation of the one-child policy in mainland China during the 1970s.26
BC mortality showed a relatively stable trend with an insignificant AAPC of 0.4% annually during the study period. However, declining trends in BC mortality have been detected in other regions in recent years, such as in Hong Kong39 and most European countries.40 Partly owing to the low participation rate in screening and the upsurge of BC incidence, BC mortality trends in Wuhan plateaued after implementation of the national guidelines in 2007. In our study, it is noteworthy that young women (aged <50 years) showed decreasing trends in the observed and projected periods. This might be explained to some extent by improved early detection combined with effective treatment. Most women aged <50 years who work in urban areas have employer-provided benefits, such as medical subsidies and free breast ultrasound screening included in a physical examination conducted once or twice a year. It has been previously suggested that ultrasound is superior to mammography for Chinese women in terms of BC prevention and control.41 Similarly, BC mortality in the USA and UK has decreased at younger ages owing to improvement in modifiable risk factors, and more effective treatment in younger population, which might also explain the decrease in BC mortality in Wuhan.42 The 5-year age-specific BC mortality rate in older age groups (50–54, 55–59, 60–64, and 70–74 years) in Wuhan showed significantly increasing trends, and the rate of women aged 55–79 years is projected to increase in 1990–2024.
BC mortality trends were mainly promoted by age and cohort effects. A downward inflection point in mortality rate was detected in the 1955s birth cohort; this might be a result of the introduction of BC ultrasound screening in the 2005, which has been adopted by the younger population (aged <50 years), as mentioned earlier. In addition, this could be because women of later generations are generally more educated and might therefore have better awareness about early detection and timely treatment of BC.
To the best of our knowledge, there is no study on long-term trends in BC incidence and mortality rates in Central China, and the incidence rate in Wuhan is approaching those developed areas with the highest BC risk in China. However, this study has some limitations. First, this study was based on retrospective cancer surveillance data. Therefore, missing and false reports might undermine the precision of the findings. Second, we only considered the trend in incidence and mortality rates of BC, and excluded specific risk factors, such as economic development, life stress, and lifestyle changes. Thus, specific potential risk factors that contribute to BC incidence and mortality in Central China require further study. Third, BC data lacked information on disease stage and grade, and it is recommended that they be collected in subsequent cancer surveillance. Finally this study only included permanent residents in urban areas because cancer surveillance in rural Wuhan was only begun in the past decade; therefore, the generalization of our results to rural areas and migrants may be limited.
Conclusion
In our study, a long-term upsurge in BC incidence in Wuhan was observed, and this is projected to increase during the next decade. This result calls for effective actions to prevent the rapid increase of BC incidence that accompanies rapid development in the future. Meanwhile, the increase in BC mortality, especially for older women, suggested that further strategies to reduce BC mortality in older age groups should be reinforced in Wuhan, Central China.
Acknowledgments
The authors thank the Wuhan CDC for providing the data for this study. The authors also thank the efforts of all levels of medical and health institutions and all staff members involved in the system installation, case collection, library, review, and checks.
Author contributions
YC conceived the study, analyzed the data, and wrote the manuscript. YQY reviewed and edited the manuscript. JG, NNY, and SFN conceived the study, validated the data, interpreted the results, and supervised the study. All authors contributed to data analysis, drafting and revising the article, gave final approval of the version to be published, and agree to be accountable for all aspects of the work.
Disclosure
The authors report no conflicts of interest in this work.
References
Torre LA, Bray F, Siegel RL, Ferlay J, Lortet-Tieulent J, Jemal A. Global cancer statistics, 2012. CA Cancer J Clin. 2015;65(2):87–108. | ||
Ferlay J, Soerjomataram I, Dikshit R, et al. Cancer incidence and mortality worldwide: sources, methods and major patterns in GLOBOCAN 2012. Int J Cancer. 2015;136(5):E359–E386. | ||
Chen W, Zheng R, Baade PD, et al. Cancer statistics in China, 2015. CA Cancer J Clin. 2016;66(2):115–132. | ||
Sung H, Rosenberg PS, Chen WQ, et al. Female breast cancer incidence among Asian and Western populations: more similar than expected. J Natl Cancer Inst. 2015;107(7):djv107. | ||
Hm Y. The understanding of program for National Cancer Prevention and Control in 2004-2010. Zhonghua Er Ke Za Zhi. 2003;41(12):909–910. Chinese. | ||
Hong W, Dong E. The past, present and future of breast cancer research in China. Cancer Lett. 2014;351(1):1–5. | ||
Huang Z, Wen W, Zheng Y, et al. Breast cancer incidence and mortality: trends over 40 years among women in Shanghai, China. Ann Oncol. 2016;27(6):1129–1134. | ||
Chen C, Sun S, Yuan JP, et al. Characteristics of breast cancer in Central China, literature review and comparison with USA. Breast. 2016;30:208–213. | ||
Zheng DG, Sun J. Great Wuhan development strategy towards 2049 on the basis of competiveness and sustainable development. Urban Planning Forum. 2014 (02):40–50. | ||
Fan L, Goss PE, Strasser-Weippl K. Current status and future projections of breast cancer in Asia. Breast Care. 2015;10(6):372–378. | ||
International Agency for Research on Cancer. Cancer incidence in five continents. Available from: http://ci5.iarc.fr/Default.aspx. Accessed September 20, 2017. | ||
Pinto AC, Canário R, Fidalgo P. Breast cancer control in China: challenges and opportunities of the use of population-based routine data studies. J Thorac Dis. 2014;6(9):1167–1169. | ||
National Cancer Institute, Surveillance, Epidemiology, and End Results Program. World (WHO 2000–2025) Standard. Available from: https://seer.cancer.gov/stdpopulations/world.who.html. Accessed September 20, 2017. | ||
Kim HJ, Fay MP, Feuer EJ, et al. Permutation tests for joinpoint regression with applications to cancer rates. Stats Med. 2000;19(3):335–351. | ||
López-Campos JL, Ruiz-Ramos M, Soriano JB. Mortality trends in chronic obstructive pulmonary disease in Europe, 1994–2010: a joinpoint regression analysis. Lancet Respir Med. 2014;2(1):54–62. | ||
Mistry M, Parkin DM, Ahmad AS, Sasieni P. Cancer incidence in the United Kingdom: projections to the year 2030. Br J Cancer. 2011;105(11):1795–1803. | ||
Møller B, Fekjaer H, Hakulinen T, et al. Prediction of cancer incidence in the Nordic countries up to the year 2020. Eur J Cancer Prev. 2002;11 Suppl 1(3):S1. | ||
Rosenberg PS, Check DP, Anderson WF. A web tool for age-period-cohort analysis of cancer incidence and mortality rates. Cancer Epidemiol Biomarkers Prev. 2014;23(11):2296–2302. | ||
Meng R, Wei K, Xia L, et al. Cancer incidence and mortality in Guangdong province, 2012. Chin J Cancer Res. 2016;28(3):311–320. | ||
Liu S, Yang L, Yuan Y, et al. Cancer incidence in Beijing, 2014. Chin J Cancer Res. 2018;30(1):13–20. | ||
Virani S, Sriplung H, Rozek LS, Meza R. Escalating burden of breast cancer in southern Thailand: analysis of 1990-2010 incidence and prediction of future trends. Cancer Epidemiol. 2014;38(3):235–243. | ||
Wang F, Tse LA, Chan WC, et al. Disparities of time trends and birth cohort effects on invasive breast cancer incidence in Shanghai and Hong Kong pre- and post-menopausal women. BMC Cancer. 2017; 17(1):362. | ||
Toriola AT, Colditz GA. Trends in breast cancer incidence and mortality in the United States: implications for prevention. Breast Cancer Res Treat. 2013;138(3):665–673. | ||
Banas T, Juszczyk G, Pitynski K, Nieweglowska D, Ludwin A, Czerw A. Incidence and mortality rates in breast, corpus uteri, and ovarian cancers in Poland (1980–2013): an analysis of population-based data in relation to socioeconomic changes. Onco Targets Ther. 2016;9:5521–5530. | ||
Committee of Breast Cancer Society, China Anti-Cancer Association. China Anti-Cancer Association guidelines for breast cancer diagnosis and treatment (2007 edition). China Oncol. 2009;19(6):410–428. Chinese. | ||
Fan L, Strasser-Weippl K, Li JJ, et al. Breast cancer in China. Lancet Oncol. 2014;15(7):e279–e289. | ||
Fan L, Zheng Y, Yu KD, et al. Breast cancer in a transitional society over 18 years: trends and present status in Shanghai, China. Breast Cancer Res Treat. 2009;117(2):409–416. | ||
Bureau of Statistics of Hubei Province. Wuhan Statistical Yearbook. Available from: http://www.stats-hb.gov.cn/info/iList.jsp?cat_id=10450. (Chinese). Accessed September 20, 2017. | ||
Minami Y, Tsubono Y, Nishino Y, Ohuchi N, Shibuya D, Hisamichi S. The increase of female breast cancer incidence in Japan: emergence of birth cohort effect. Int J Cancer. 2004;108(6):901–906. | ||
Shen YC, Chang CJ, Hsu C, Cheng CC, Chiu CF, Cheng AL. Significant difference in the trends of female breast cancer incidence between Taiwanese and Caucasian Americans: implications from age-period-cohort analysis. Cancer Epidemiol Biomarkers Prev. 2005;14(8):1986–1990. | ||
Lu Y, Li Y, Li J. Breast and cervical cancer screening of low-income women in Wuchang. Matern Child Healthc China. 2013 (20):3247–3249. | ||
Suzuki S, Kojima M, Tokudome S, et al. Obesity/weight gain and breast cancer risk: findings from the Japan collaborative cohort study for the evaluation of cancer risk. J Epidemiol. 2013;23(2):139–145. | ||
Nomura SJ, Dash C, Rosenberg L, Yu J, Palmer JR, Adams-Campbell LL. Adherence to diet, physical activity and body weight recommendations and breast cancer incidence in the Black Women’s Health Study. Int J Cancer. 2016;139(12):2738–2752. | ||
Gaudet MM, Gapstur SM, Sun J, Diver WR, Hannan LM, Thun MJ. Active smoking and breast cancer risk: original cohort data and meta-analysis. J Natl Cancer Inst. 2013;105(8):515–525. | ||
Soerjomataram I, de Vries E, Engholm G, et al. Impact of a smoking and alcohol intervention programme on lung and breast cancer incidence in Denmark: an example of dynamic modelling with Prevent. Eur J Cancer. 2010;46(14):2617–2624. | ||
Kahlenborn C, Modugno F, Severs WB. Oral contraceptives and breast cancer. Mayo Clin Proc. 2008;83(7):849–850. | ||
Kirsh V, Kreiger N. Estrogen and estrogen-progestin replacement therapy and risk of postmenopausal breast cancer in Canada. Cancer Causes Control. 2002;13(6):583–590. | ||
Li H, Sun X, Miller E, et al. BMI, reproductive factors, and breast cancer molecular subtypes: a case-control study and meta-analysis. J Epidemiol. 2017;27(4):143–151. | ||
Kvåle R, Myklebust TÅ, Engholm G, Heinävaara S, Wist E, Møller B. Prostate and breast cancer in four Nordic countries: a comparison of incidence and mortality trends across countries and age groups 1975-2013. Int J Cancer. 2017;141(11):2228–2242. | ||
Carioli G, Malvezzi M, Rodriguez T, Bertuccio P, Negri E, La Vecchia C. Trends and predictions to 2020 in breast cancer mortality in Europe. Breast. 2017;36:89–95. | ||
Shen S, Zhou Y, Xu Y, et al. A multi-centre randomised trial comparing ultrasound vs mammography for screening breast cancer in high-risk Chinese women. Br J Cancer. 2015;112(6):998–1004. | ||
Peto R, Boreham J, Clarke M, Davies C, Beral V. UK and USA breast cancer deaths down 25% in year 2000 at ages 20–69 years. Lancet. 2000;355(9217):1822–1822. |
 © 2018 The Author(s). This work is published and licensed by Dove Medical Press Limited. The full terms of this license are available at https://www.dovepress.com/terms.php and incorporate the Creative Commons Attribution - Non Commercial (unported, v3.0) License.
By accessing the work you hereby accept the Terms. Non-commercial uses of the work are permitted without any further permission from Dove Medical Press Limited, provided the work is properly attributed. For permission for commercial use of this work, please see paragraphs 4.2 and 5 of our Terms.
© 2018 The Author(s). This work is published and licensed by Dove Medical Press Limited. The full terms of this license are available at https://www.dovepress.com/terms.php and incorporate the Creative Commons Attribution - Non Commercial (unported, v3.0) License.
By accessing the work you hereby accept the Terms. Non-commercial uses of the work are permitted without any further permission from Dove Medical Press Limited, provided the work is properly attributed. For permission for commercial use of this work, please see paragraphs 4.2 and 5 of our Terms.