")
Back to Journals » Cancer Management and Research » Volume 10
Trend in relative survival in squamous cervical cancer by decade from 1983 to 2012: a period analysis
Authors Wu J , Sun H, Wang S, Yan Y, Sun F, Li Y, Yang G, Ma H
Received 6 March 2018
Accepted for publication 27 May 2018
Published 3 September 2018 Volume 2018:10 Pages 3177—3191
DOI https://doi.org/10.2147/CMAR.S167442
Checked for plagiarism Yes
Review by Single anonymous peer review
Peer reviewer comments 3
Editor who approved publication: Dr Antonella D'Anneo
Jinna Wu,* Huanhuan Sun,* Shuncong Wang, Yan Yan, Fengze Sun, Yushi Li, Guangwei Yang, Haiqing Ma
Department of Oncology, The Fifth Affiliated Hospital of Sun Yat-sen University, Zhuhai, Guangdong 519000, People’s Republic of China
*These authors contributed equally to this work
Objective: Squamous cervical cancer (SCC), the predominant histological type, represents approximately 75–80% of all cervical cancers. Although the overall incidence of cervical cancer has declined worldwide, the data describing the changes in the incidence and long-term survival in SCC remain limited.
Methods: The data were extracted from Surveillance, Epidemiology, and End Results (SEER) registries for an evaluation of the changes in the incidence and survival associated with SCC during 1983–2012. In addition, the patients with SCC were stratified by age, race, and socioeconomic status (SES). Stata 12.0 software was used to perform the Cox regression and Spearman’s rank correlation analyses.
Results: The overall incidence of SCC constantly declined from 7.3 to 5.6 to 4.3 per 100,000 people; the peak age of incidence was 55–69 years in the first decade, while the 40–54 age group served as another incidence peak in the last 2 decades. Median survival increased from 189 months to 231 months in the first 2 decades and was not reached in the third decade. The 10-year relative survival rates (RSRs) changed from 63.2% to 66.5% to 62.1% across the 3 decades. Additionally, the survival gaps narrowed from 13% to 8% between Whites and Blacks and from 5.4% to 3.5% between low- and medium-poverty groups in the 3 decades.
Conclusion: This study demonstrated a declining incidence over the 3 decades with an improvement in median survival. However, the relative survival associated with SCC did not improve in the last decade. Furthermore, the survival gaps between races and various SESs significantly narrowed over the 3 decades.
Keywords: squamous cervical cancer, incidence, relative survival, period analysis, tendency
Introduction
Cervical cancer is the most common gynecological tumor and the leading cause of cancer-related death with 275,000 deaths annually worldwide.1 According to the American Cancer Society, an estimated 12,820 new cases will be diagnosed and 4,210 women will die of cervical cancer in 2017.2 Squamous cervical cancer (SCC), the predominant histological type, represents approximately 75–80% of all cervical cancers.3 With widespread implementation of screening and early treatment of precancerous lesions, the overall incidence of cervical cancer has declined worldwide and a high survival rate is associated with early diagnosis.4,5 Although previous studies tended to evaluate the incidence of cervical cancer in those of different ages, race, or socioeconomic status (SES) or to focus on the outcome of racial disparities,6–10 data describing the changes in the long-term relative survival in SCC remain limited. Thus, this study aimed to examine population-level changes over time in incidence and 10-year relative survival for patients with SCC diagnosed during 1983–2012 and to evaluate the potential impacts of age, race, and SES on relative survival.
Methods
Data source
Data on SCC diagnosed in 1983–2012 were extracted from the Surveillance, Epidemiology and End Results (SEER) program of the National Cancer Institute. The SEER program collects and distributes high-quality, comprehensive cancer data from a number of population-based cancer registries. The SEER program registries routinely collect data on patient demographics, primary tumor site, tumor morphology and stage at diagnosis, first course of treatment, and follow-up for vital status (through linkage with the National Center for Health Statistics). Incidence data were collected from 9 original registries and relative survival data were obtained from 18 registries. Data from 9 SEER registries included Atlanta, Connecticut, Detroit, Hawaii, Iowa, New Mexico, San Francisco-Oakland, Seattle-Puget Sound, and Utah, and the 18 SEER registries included San Francisco-Oakland, Connecticut, Detroit (metropolitan), Hawaii, Iowa, New Mexico, Utah, Seattle (Puget Sound), Atlanta (metropolitan), San Jose-Monterey, Los Angeles, Alaska Natives, rural Georgia, greater California, Kentucky, Louisiana, New Jersey, and Greater Georgia.11
Classification of SCC patients over the 3 decades
All data were accessed from SEER*Stat version 8.3.2. Patients were evaluated using the third edition of the International Classification of Diseases for Oncology (site ICD-O-3 = cervix uteri, codes C53.0–C53.9, squamous carcinoma histology codes 8050–8089).7 The incidence and relative survival data were analyzed for the period from 1983 to 2012 after being divided into 3 decades. The cases reported through death certificates or diagnosed by autopsy were excluded. Additionally, patients with SCC were stratified by age, SES, and race (White, Black, and others).7 Age groups were categorized as 0–24, 25–39, 40–54, 55–69, and 70+ years, and area SES was defined by the county poverty rate, which was categorized into three levels using the same cut points used in the National Cancer Institute monograph: <10% (low-poverty areas), 10–19.99% (medium-poverty areas), and ≥20% (high-poverty areas).12,13
Statistical analyses
Incidence was expressed per 100,000 population and age-adjusted to 2000 US standard population. Cancer patient survival was typically defined as the time from diagnosis until death. Relative survival is a net survival measure representing cancer survival in the absence of other causes of death. Relative survival is defined as the ratio of the proportion of observed survivors in a cohort of cancer patients to the proportion of expected survivors in a comparable set of cancer-free individuals. Period analysis methodology was applied to calculate the relative survival rate (RSR), which measures mortality attributable, either directly or indirectly, to SCC. Survival difference was compared by Kaplan–Meier survival analysis, and the association of survival with age, race, and SES was assessed via Cox regression analysis and Spearman’s rank correlation analysis using the STATA software (version 12.0; Stata Corp, College Station, TX, USA). For Cox regression and Spearman’s rank correlation analysis, only White and Black cases were selected due to the racial heterogeneity of other races, and medium- and high-poverty groups were mixed into a medium-high-poverty group. All statistical tests were two-sided, and a p-value of <0.01 was considered statistically significant.
Ethical approval
This article does not contain any studies with human participants or animals performed by any of the authors. The SEER research data include the fields and variables that SEER has made available to the public with a signed SEER data-use agreement form. A signed SEER research data agreement form is required to access the SEER data.
Results
Trend in incidence of SCC during 1983–2012
Data of 21,933 patients with SCC diagnosed during 1983–2012 were extracted from the original 9 registry sites. The overall incidence of SCC gradually decreased from 7.3 to 5.6 to 4.1 per 100,000 people over the past 3 decades, and a similar tendency was seen in all age groups except for the 0–24 age group, where the incidence of SCC remained stable, with 0.2 per 100,000 people in the last 2 decades. Additionally, the number of patients with SCC continually decreased over time as the general population grew. However, the peak age for the incidence of SCC occurred in the 55–69 age group with 13.3 per 100,000 people in the first decades, while the 40–54 age group served as another incidence peak with 9.8 per 100,000 people and 7.3 per 100,000 people in the last 2 decades, respectively (Figure 1A and B, Table 1).
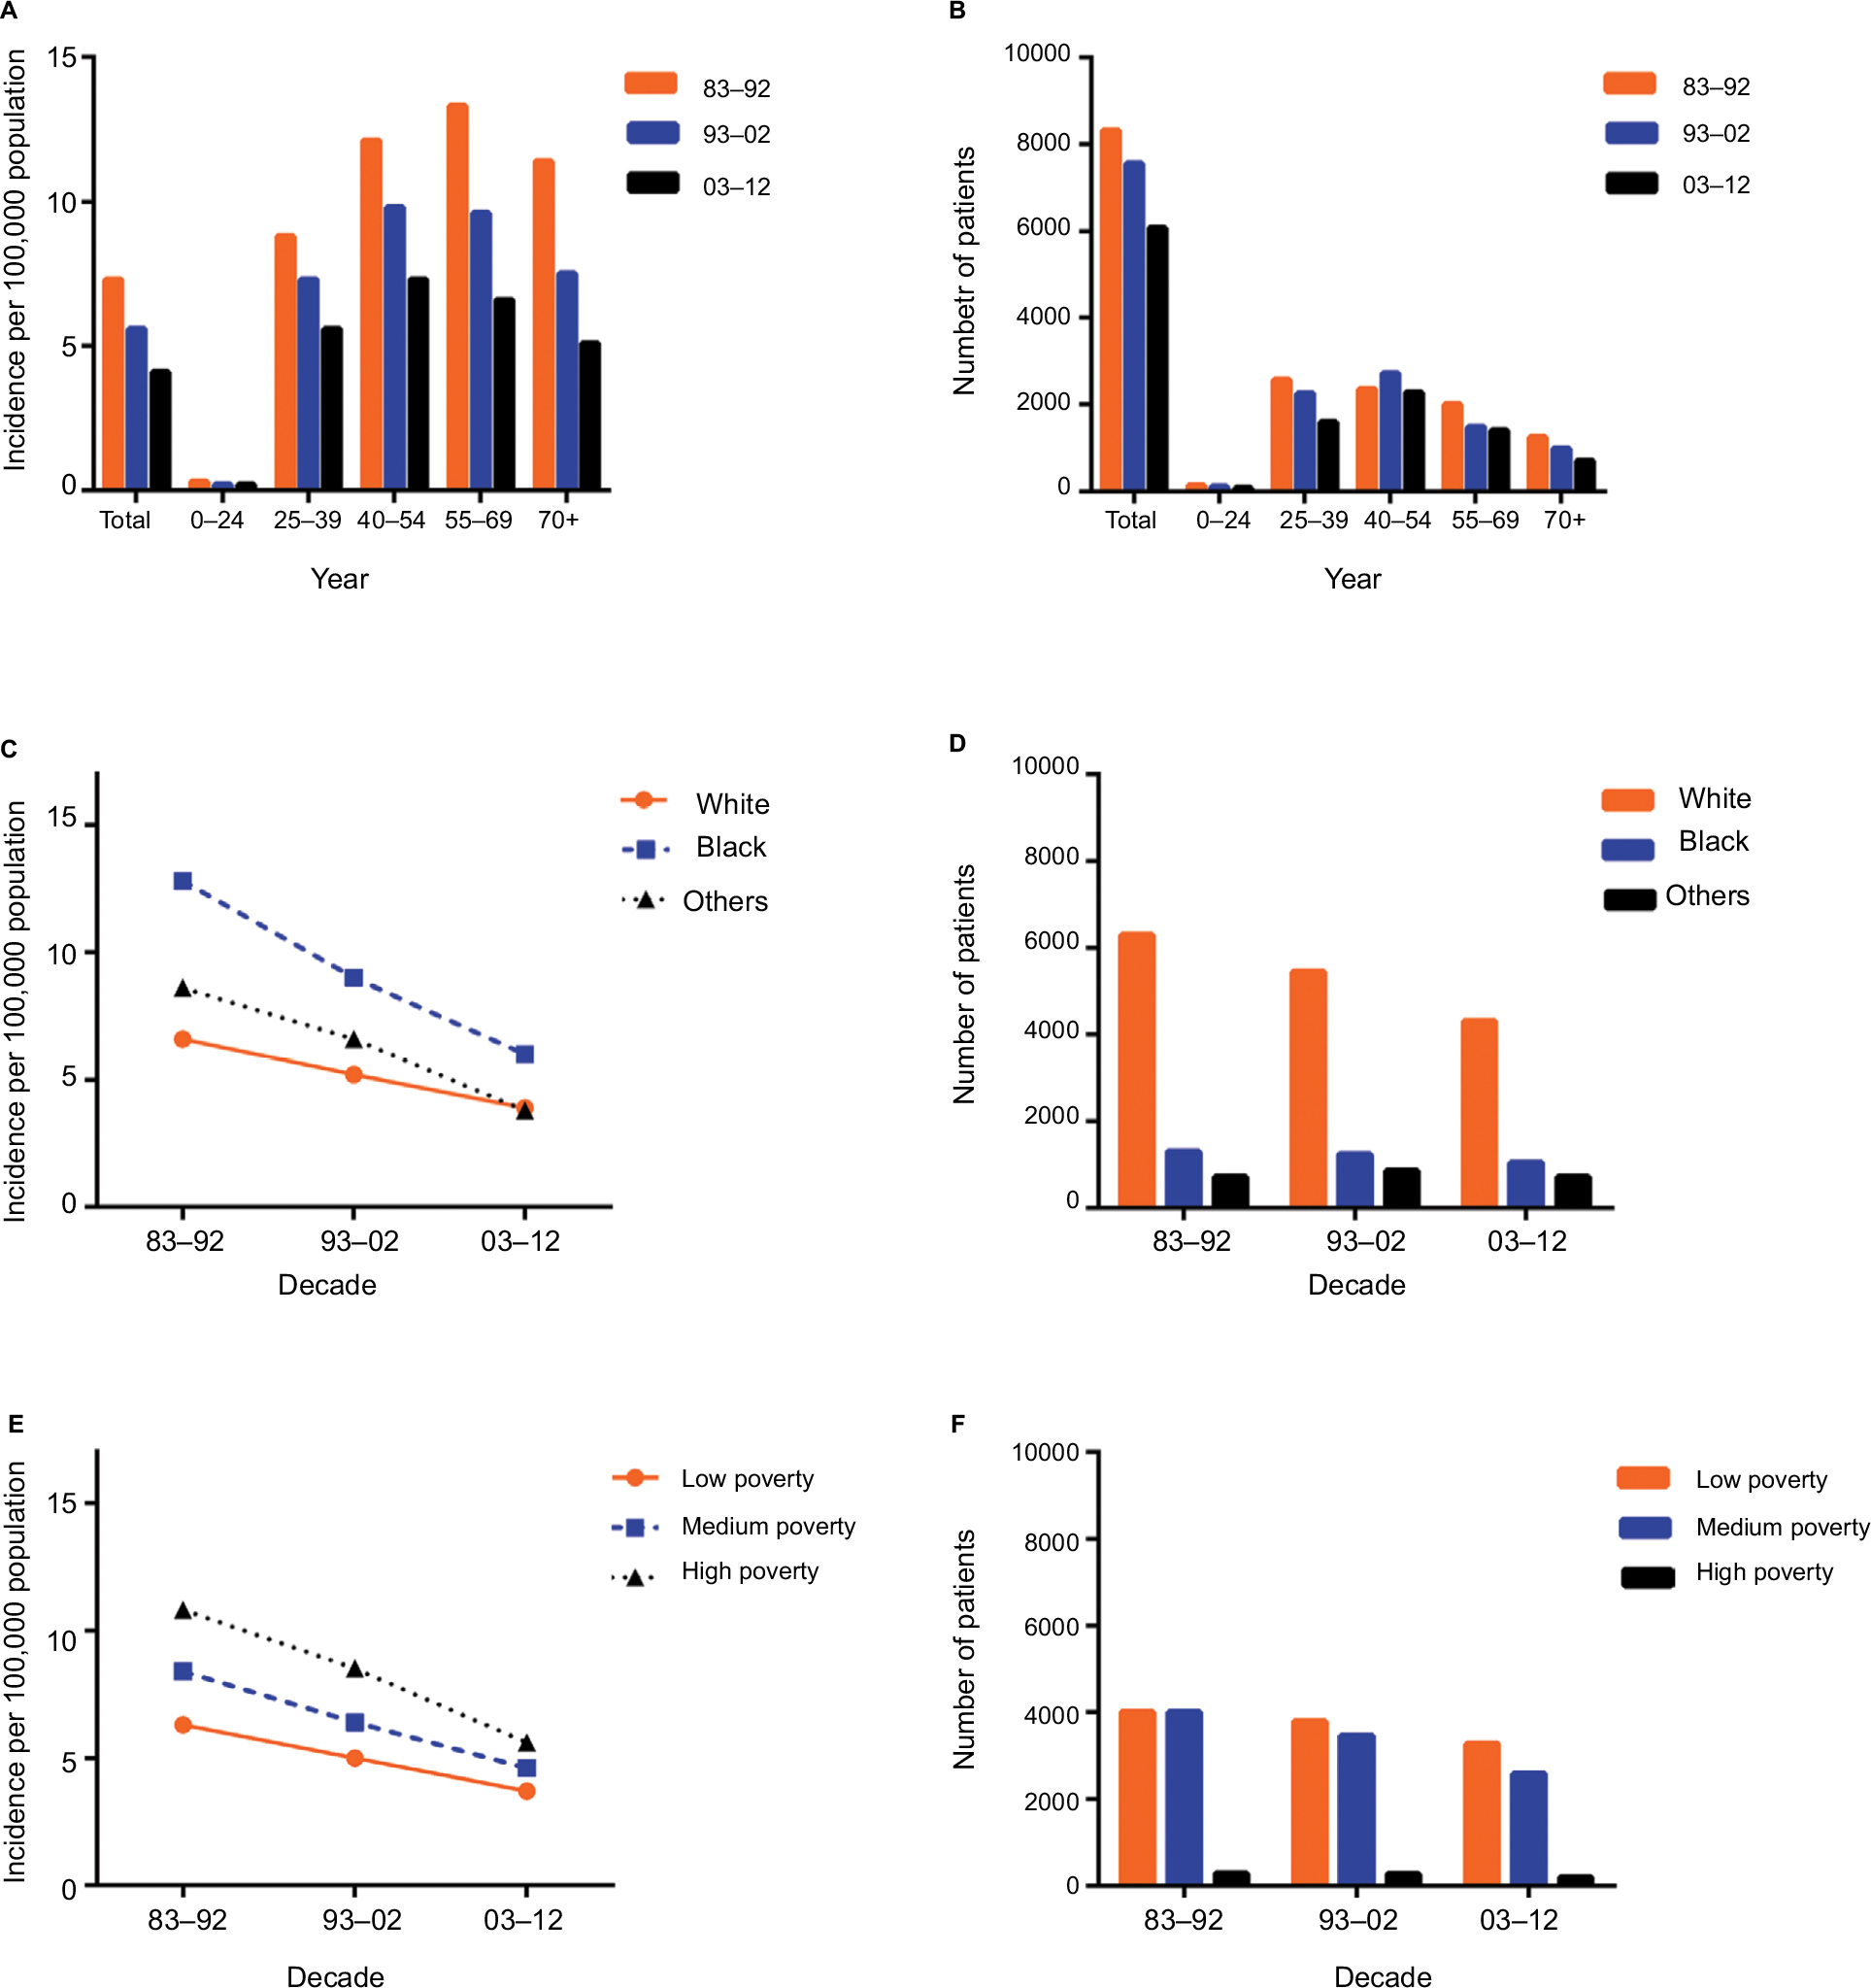 | Figure 1 Summary incidences of patients diagnosed with SCC between 1983 and 2012 at the original 9 SEER sites. Notes: Incidence (A) and number (B) of SCC cases are showed by age group (total and ages 0–24, 25–39, 40–54, 55–69, and 70+ years) and calendar period. Incidence (C, D, E, F) of SCC cases are grouped by race and SES, respectively. Abbreviations: SCC, squamous cervical cancer; SEER, Surveillance, Epidemiology, and End Results; SES, socioeconomic status. |
 | Table 1 The incidence of SCC according to age group and decade within race, and SES groups from 1983 to 2012 at the 9 original SEER sites. Note: Data are incidence per 100,000 people by year of diagnosis, with the number of patients in parentheses. Abbreviations: SCC, squamous cervical cancer; SEER, Surveillance, Epidemiology, and End Results; SES, socioeconomic status. |
Incidence of SCC varied across race and SES groups
Racially, Whites showed the lowest incidence in the first 2 decades (6.6 in 1983–1992 and 5.2 in 1993–2002). In the last decade, Whites and others shared similar SCC incidence with 3.8 per 100,000 people. Additionally, the highest incidence of SCC was found in Blacks at 12.8, 9.0, and 6.0 per 100,000 people in the 3 decades, respectively. However, the incidence difference between Whites and Blacks narrowed from 6.2% to 3.8% to 2.1% over the 3 decades due to a more rapidly declining SCC incidence in Blacks (Figure 1C and D). The SCC incidence across the three SES groups decreased over the 3 decades, with the lowest incidence in the low-poverty group (from 6.3 in 1983–1992 to 5.0 in 1993–2002 to 3.7 in 2003–2012). The high-poverty group showed the highest incidence from 10.8 in 1983–1992 to 8.5 in 1993–2002 to 5.6 in 2003–2012, and the medium-poverty group incidence was between the low- and high-poverty groups at 8.4, 6.4, and 4.6 in the 3 decades, respectively (Figure 1E and F, Table S1).
Relative survival changed during 1983–2012
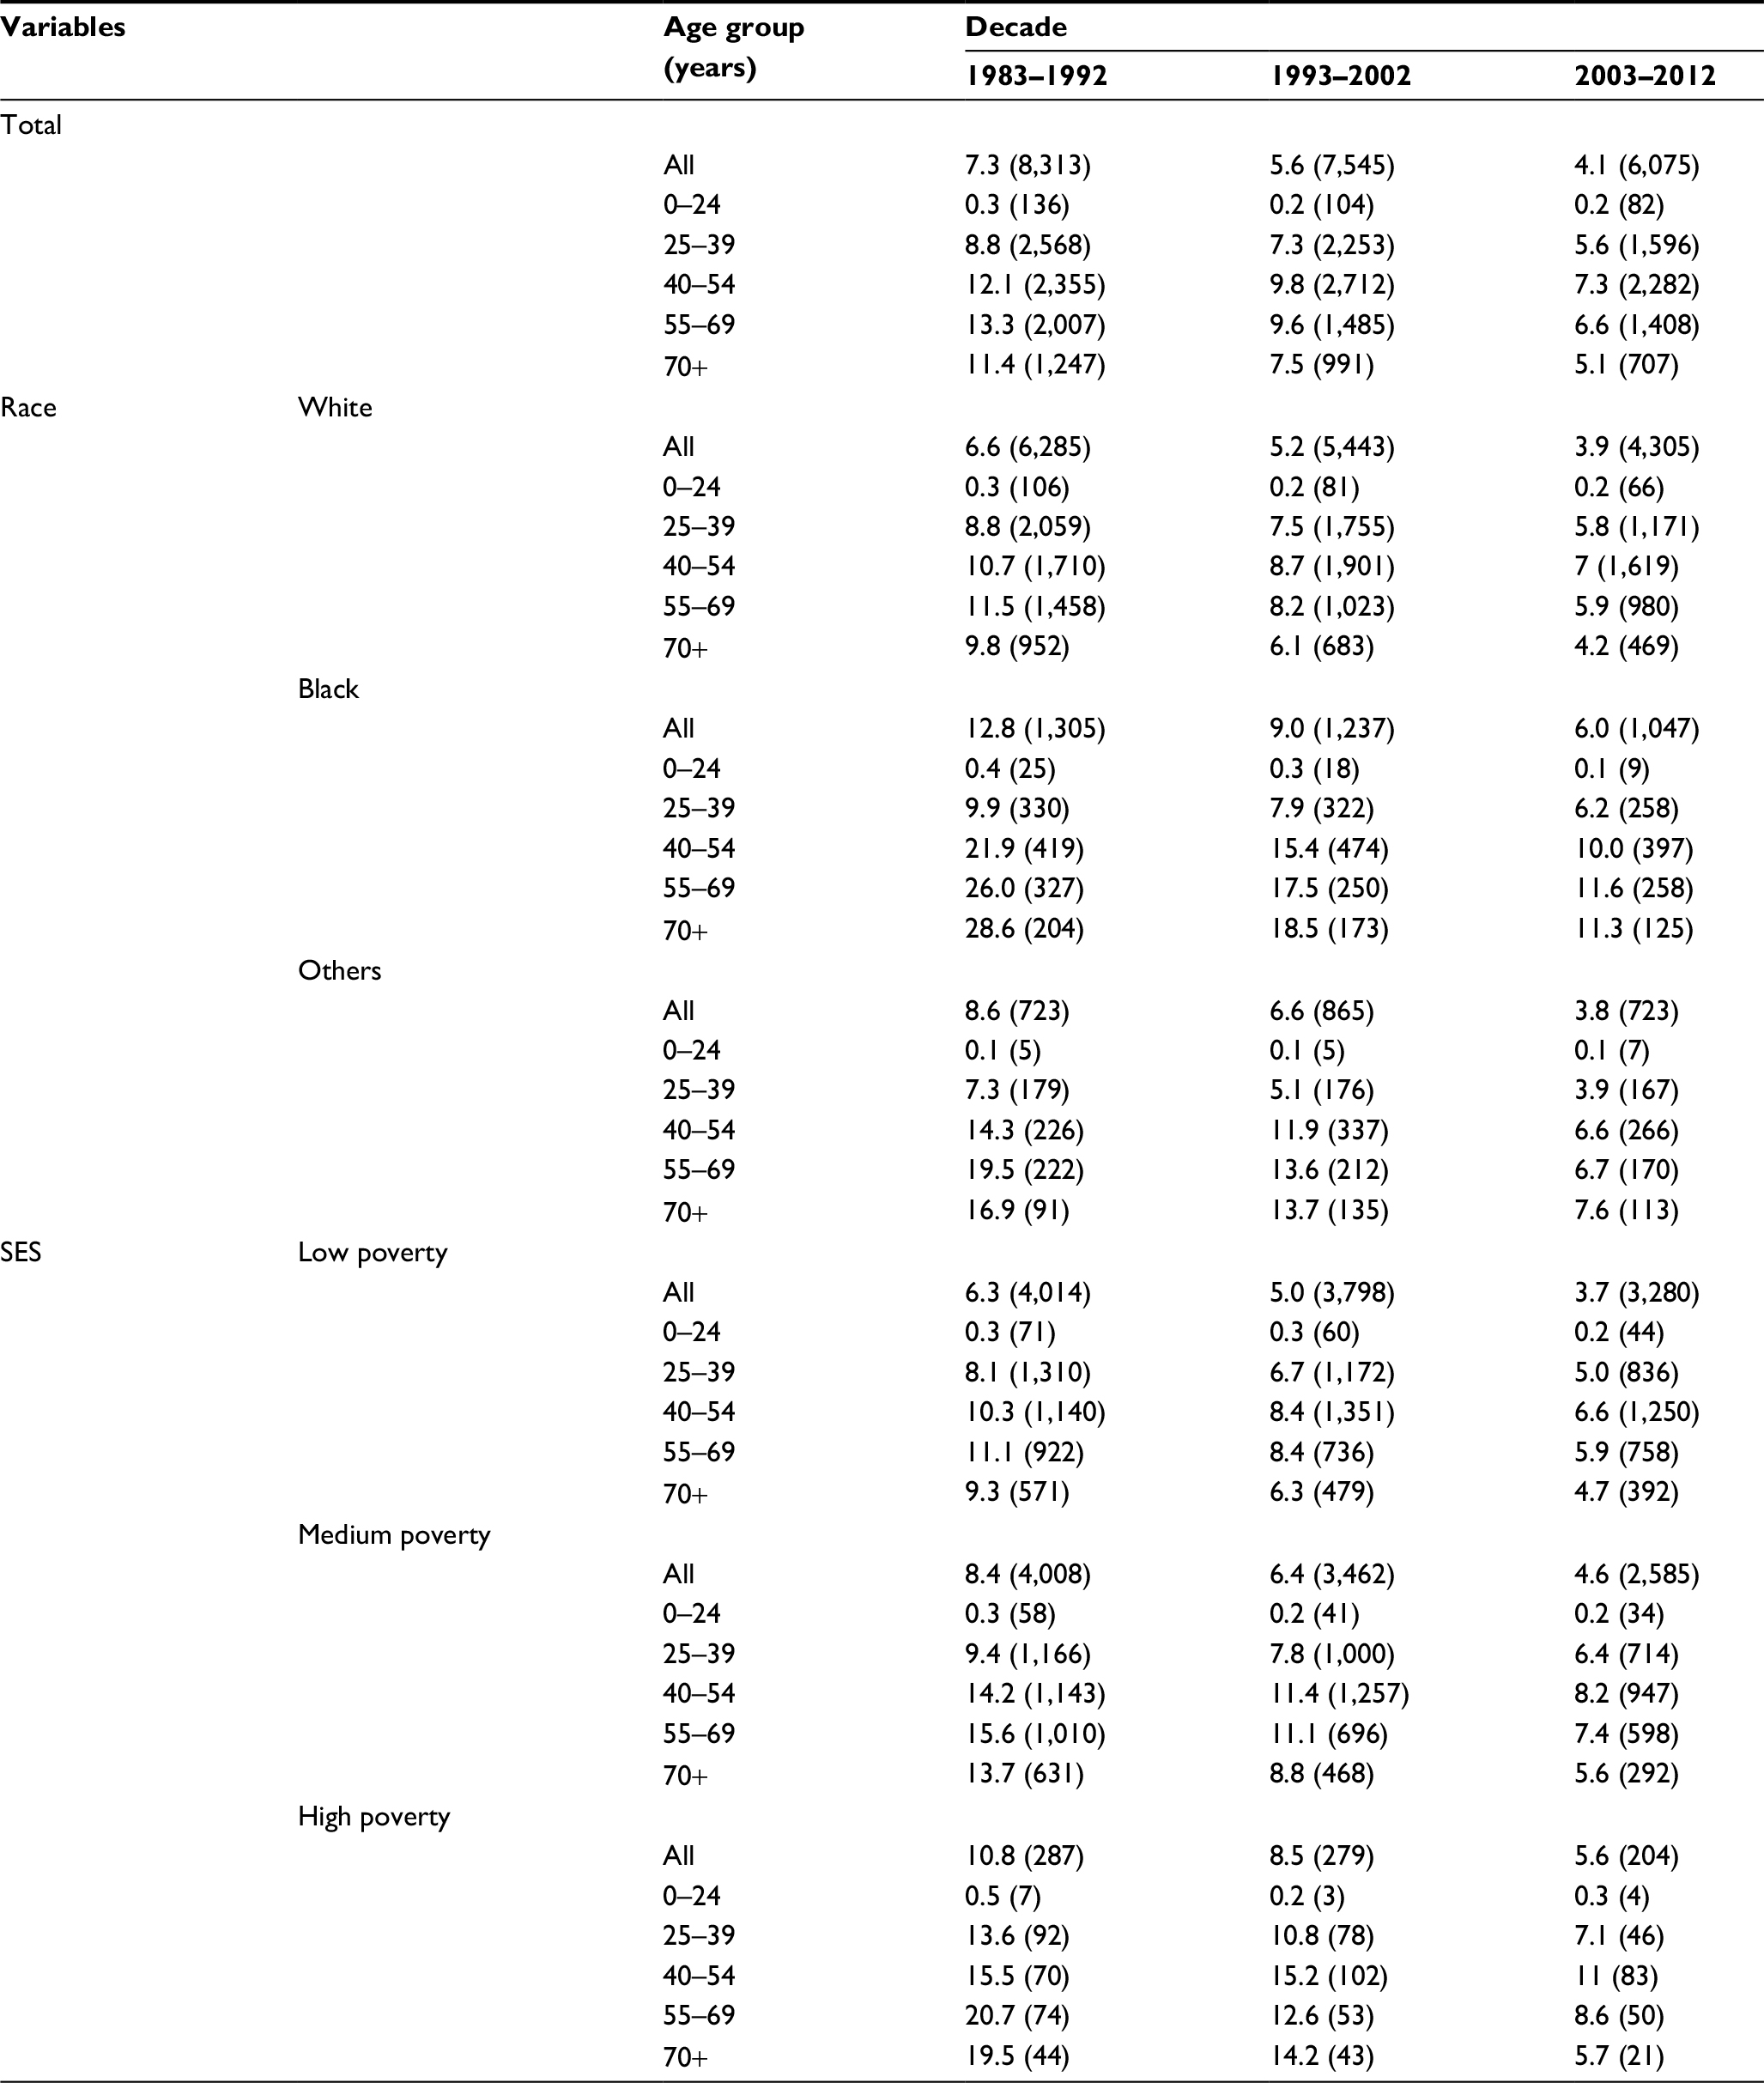
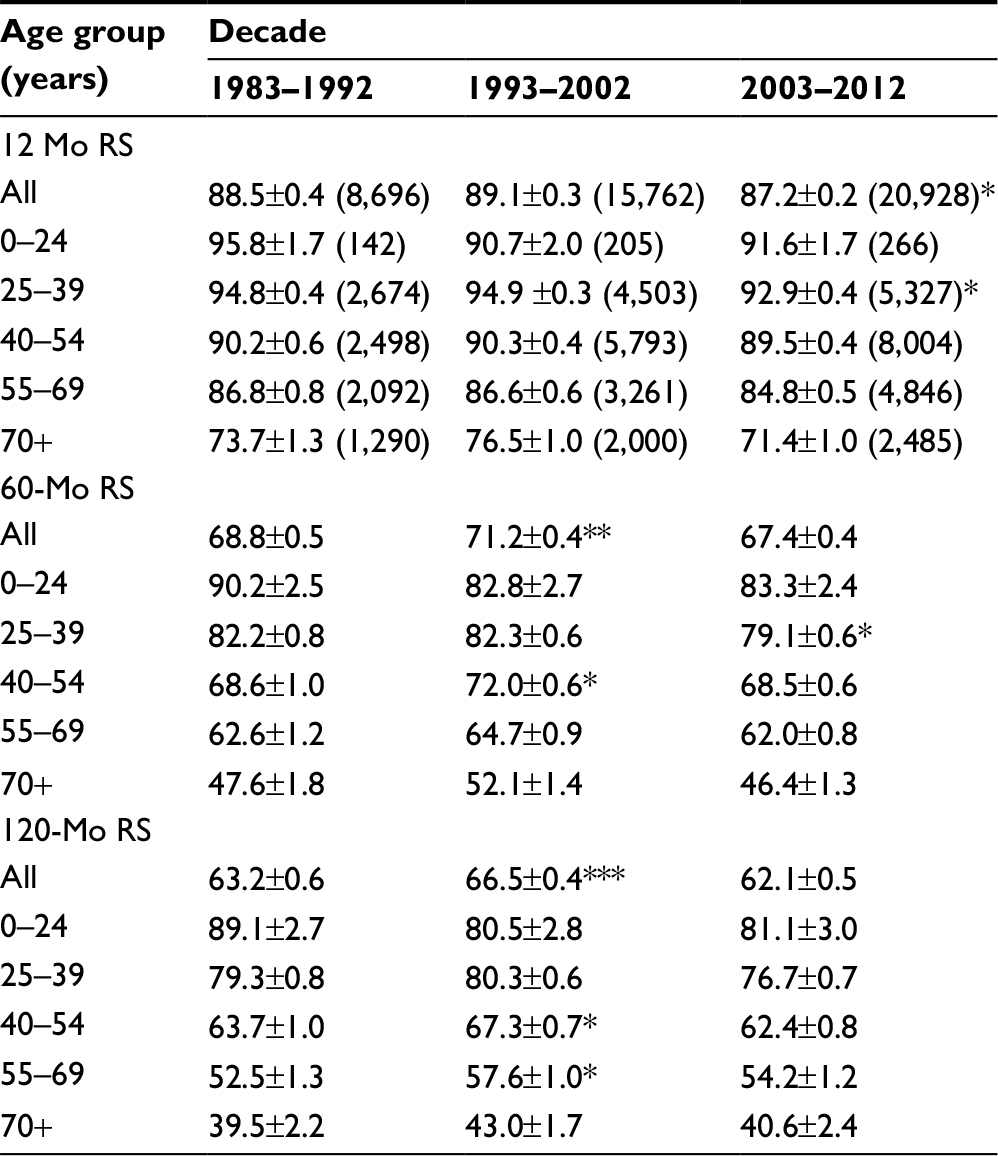
A total of 45,386 SCC cases were identified between 1983 and 2012 from 18 registry sites. The sample size of the 0–24 age group was only 613 during 1983–2012; hence, we did not include it in the study (Figure S1). The median survival of patients with SCC improved from 189 months to 231 months in the first 2 decades and was not reached in the third decade, with the 10-year relative survival rate (RSR) changing from 66.8% to 71.2% to 67.4% across the 3 decades, respectively. Unimproved survival trends in the last decade were also noted in all age groups (Table 2, Figure 2A). Additionally, Kaplan–Meier survival analyses showed survival changes in all age groups with P = 0.168 (Figure 2B).
 | Table 2 RSRs of SCC patients during the periods of 1983–1992, 1993–2002, and 2003–2012 at 18 SEER sites Note: Data are the mean ± SEM, with number of patients in parentheses. *p < 0.01, **p < 0.001, and ***p < 0.0001 for comparisons with the White group. Abbreviations: RSRs, relative survival rates; SCC, squamous cervical cancer; SEER, Surveillance, Epidemiology, and End Results; Mo, month; RS, relative survival; SEM, standard error of the mean. |
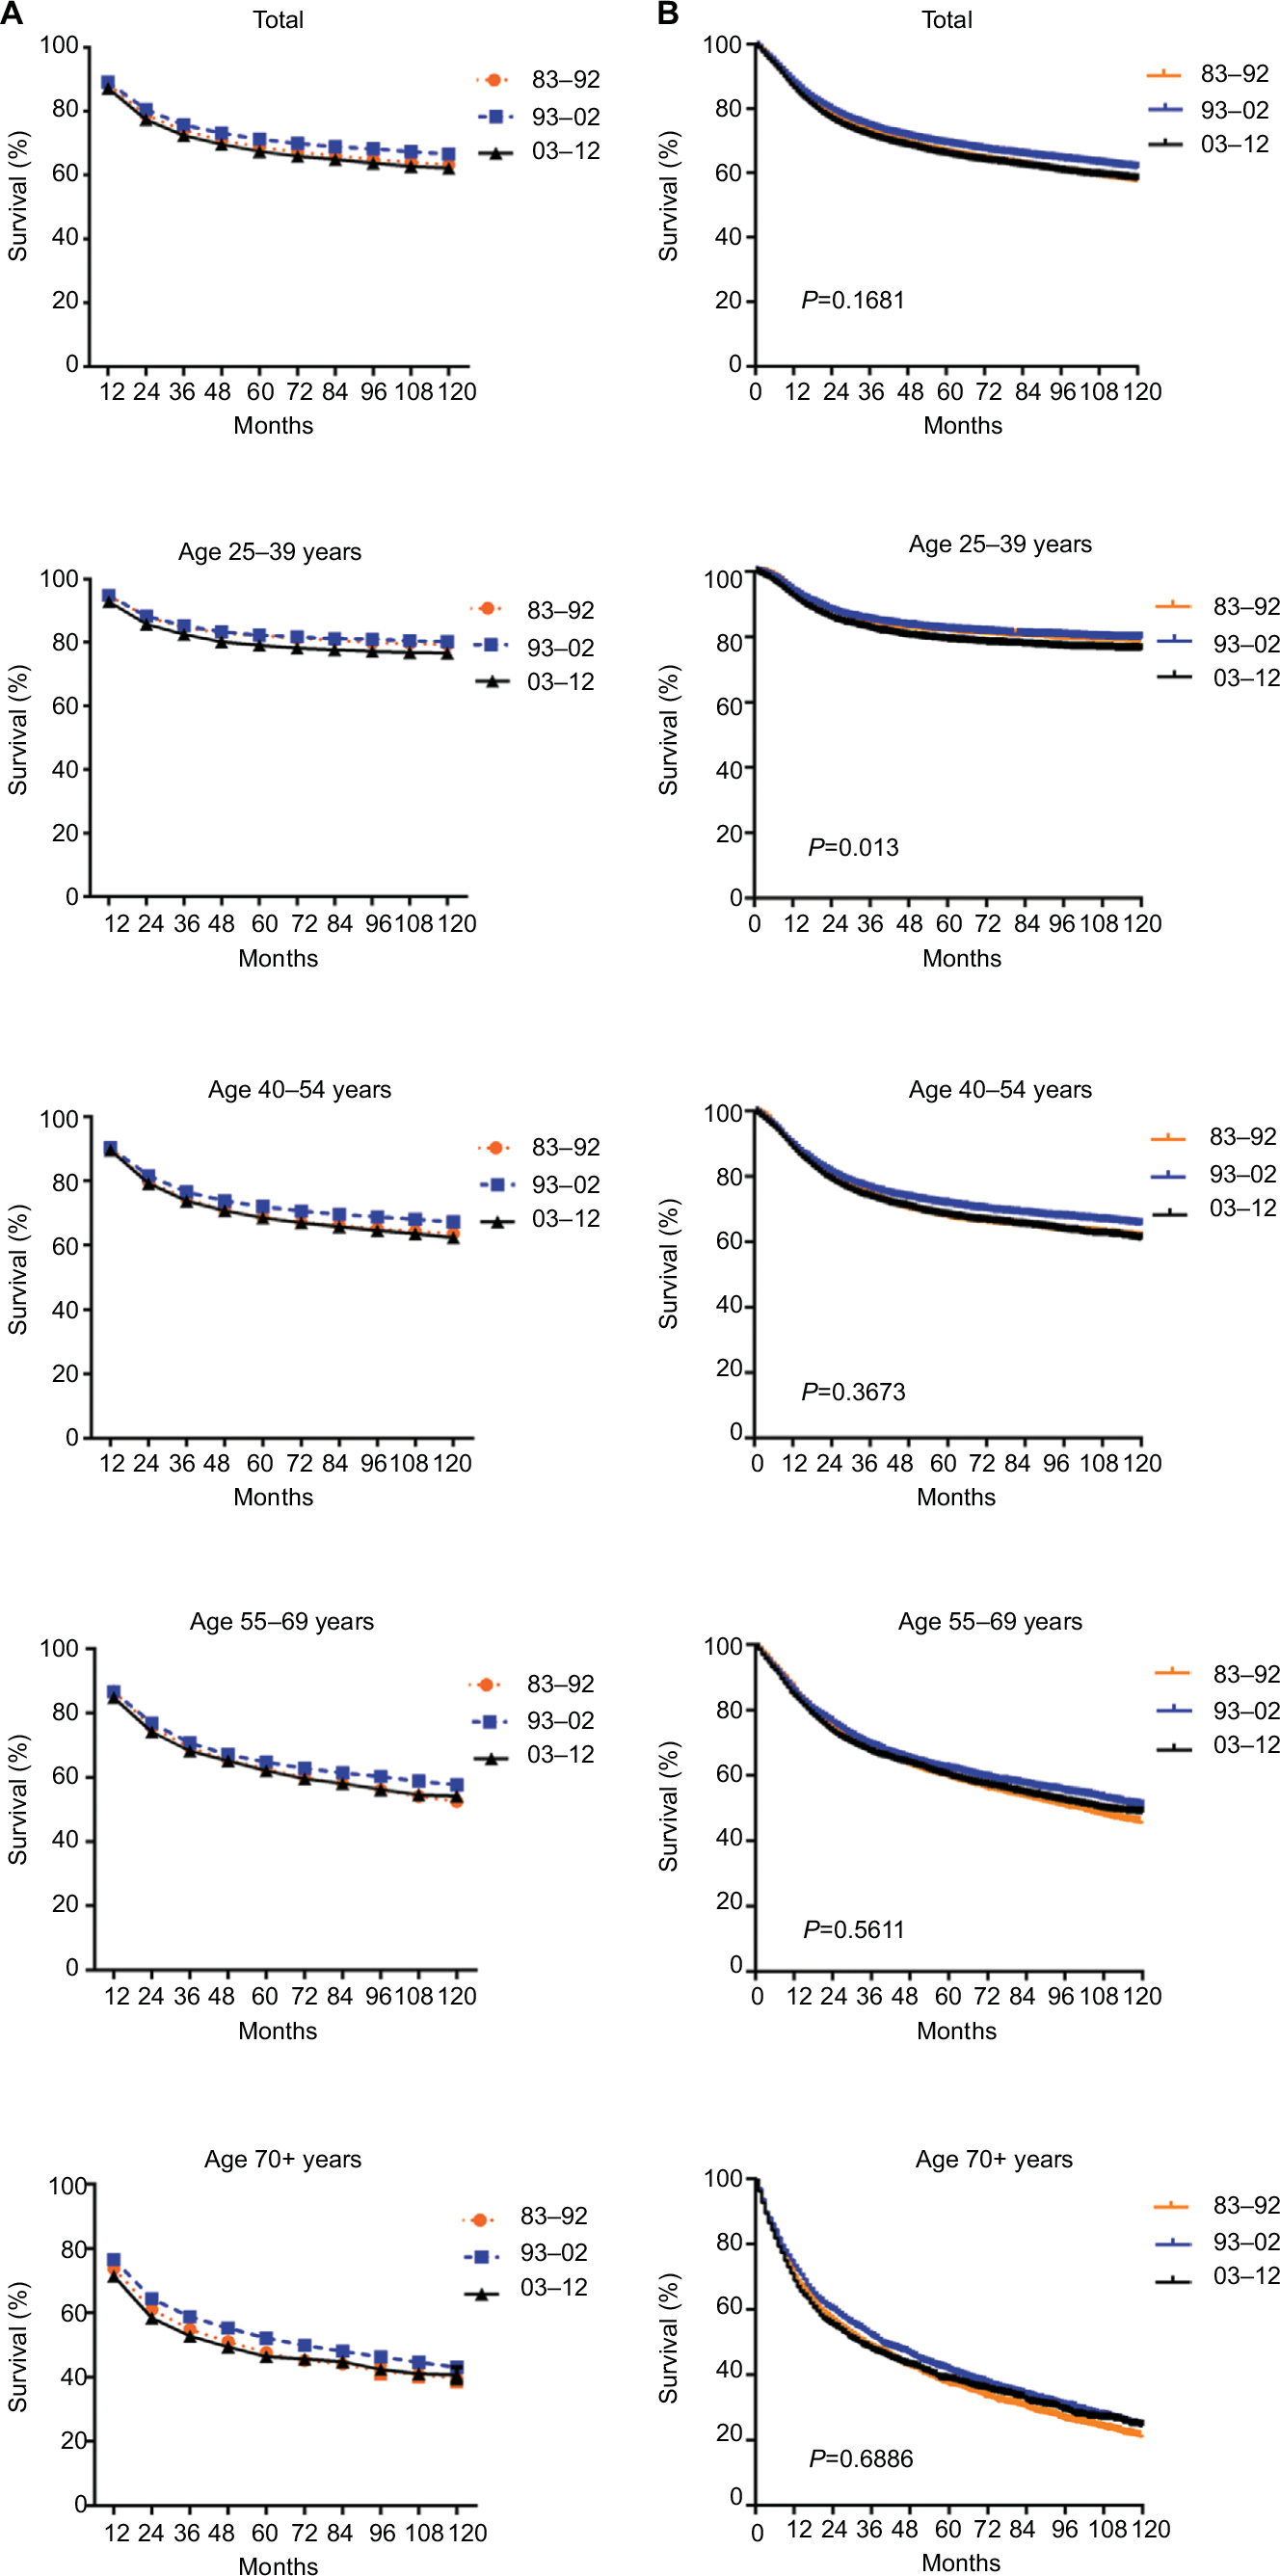 | Figure 2 Trends in 10-year RSRs (A) and Kaplan–Meier survival analyses (B) for the patients with SCC at 18 SEER sites during 1983–1992 (orange), 1993–2002 (blue), and 2003–2012 (black) according to age group (total and ages 25–39, 40–54, 55–69, and 70+ years) and calendar period. Abbreviations: RSRs, relative survival rates; SCC, squamous cervical cancer; SEER, Surveillance, Epidemiology, and End Results. |
Furthermore, Cox regression analyses during the 3 decades indicated that age, race, and SES were independent predictors of prognosis. Hazard ratios for age, race, and SES were larger than 1, suggesting that older age, Black race, and medium-high-poverty group were associated with inferior survival across the 3 decades. Additionally, when the overall patients were classified by the 3 decades, age, race, and SES were significantly associated with survival over the 3 decades (Table 3).
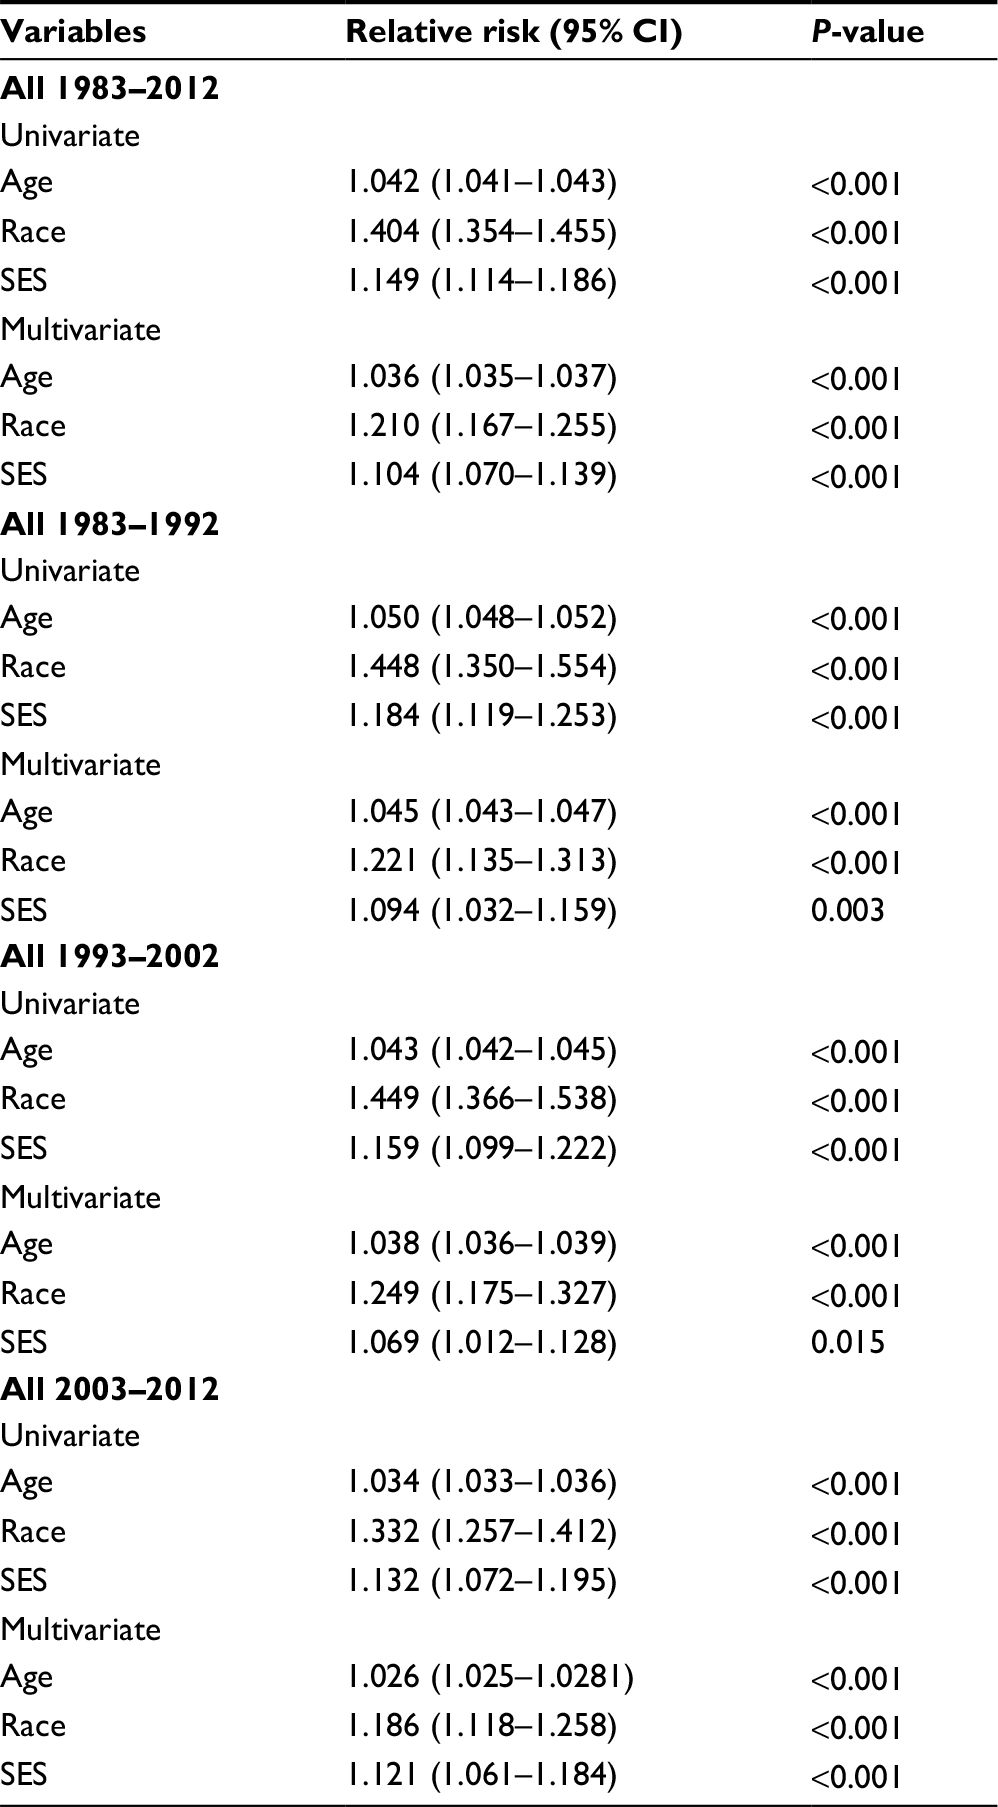 | Table 3 Summary data for Cox regression analysis of survival in patients with SCC from 1983 to 2012 at 18 SEER sites Abbreviations: SCC, squamous cervical cancer; SEER, Surveillance, Epidemiology, and End Results; 95% CI, 95% confidence interval; SES, socioeconomic status. |
SCC survival varied across races and SES groups
Whites had a significantly higher 5-year RSR compared to Blacks between 1983 and 1992 (70.5% vs 58.9%). The survival gap between Whites and Blacks narrowed in the second decade (72.4% vs 62.4%, P < 0.0001) and continued to narrow in the third decade. A similar narrowing over time was also found in the 10-year RSR (Figure 3A, Table S1).
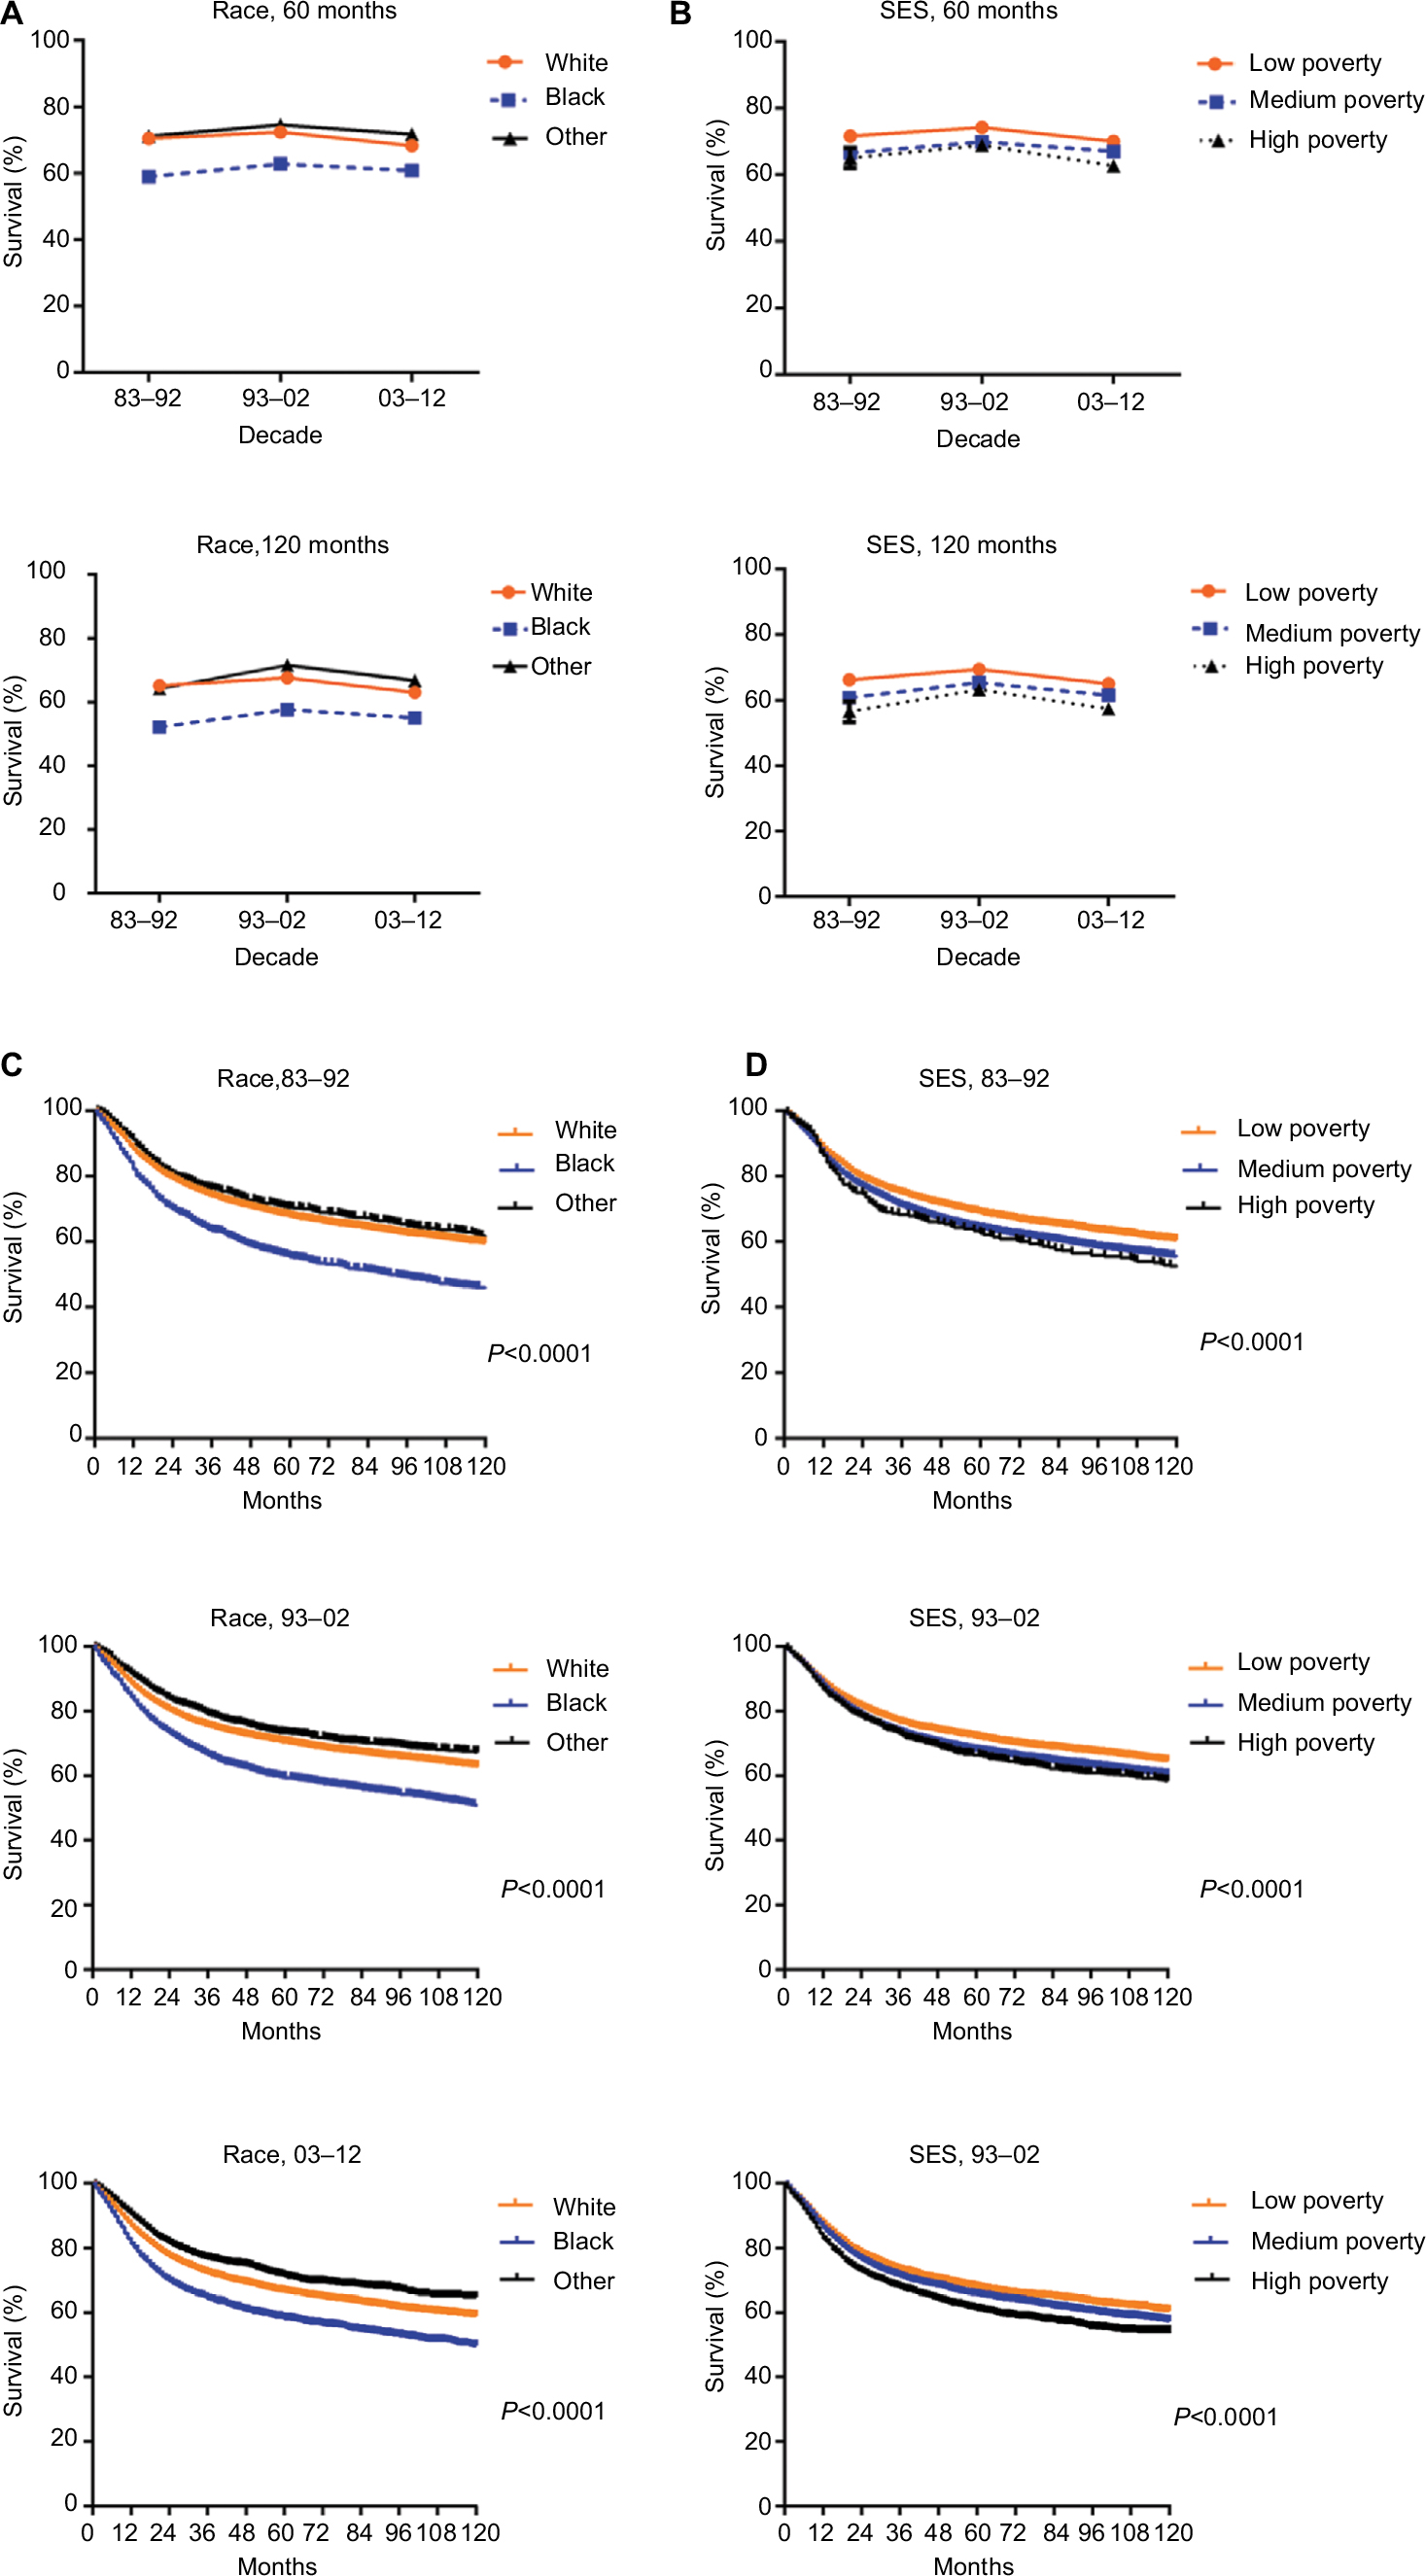 | Figure 3 The 5-year and 10-year RSRs according to race (A) and SES/county-level poverty rates (B), and Kaplan–Meier survival analyses according to race (C) including White (orange), Black (blue), and others (black), and SES/county-level poverty rates (D) in low-poverty (orange), medium-poverty (blue), and high-poverty (black) for patients with SCC at 18 SEER sites from 1983 to 2012. Abbreviations: RSRs, relative survival rates; SCC, squamous cervical cancer; SEER, Surveillance, Epidemiology, and End Results. |
When 5-year and 10-year RSRs were analyzed, the highest RSR was consistently observed in the low-poverty group, with the lowest in the high-poverty group (Figure 3B). The 5-year RSRs in the low-poverty, medium-poverty, and high-poverty groups in 1983–1992 were 71.6%, 66.5%, and 65%, respectively, with differences of 5.1% between the low- and medium-poverty groups and 1.5% between the medium- and high-poverty groups. The survival differences declined to 4.3% and 3% between the low- and medium-poverty groups, respectively, in the last 2 decades, but increased to 4.3% between the medium- and high-poverty groups in 2003–2012. A similar survival gap tendency among the three SES subgroups was also observed in the 10-year RSR (Table S2).
Notably, different SES distributions existed between Whites and Blacks. Unlike Blacks, the majority of Whites were classified in the low-poverty group (24.4% vs 57.9%), while the majority of Blacks were classified in the medium-poverty group (75.1% vs 38.0%; Figure S2, Table S3). Kaplan–Meier survival analysis showed that survival significantly differed in Whites and Blacks (P < 0.0001) but the gap in survival continually narrowed over the 3 decades. A similar tendency was also found in the Kaplan–Meier survival analysis of the three SES subgroups in the 3 decades (Figure 3C and D).
Discussion
Our findings suggested that the overall incidence of SCC has declined in 3 decades between 1983 and 2012, and the median survival improved from 189 months to 231 months in the first 2 decades and was not reached in the third decade. However, relative survival associated with SCC did not significantly improve in the last decade. Additionally, the survival gaps narrowed from 13% to 8% between Whites and Blacks and from 5.4% to 3.5% between low- and medium-poverty groups in the 3 decades.
We demonstrated that the overall SCC incidence declined from 7.3 to 5.6 to 4.1 per 100,000 people in the 3 decades, and a decreasing tendency was seen in each age group except for the 0–24 age group, where the incidence of SCC remained stable in the third decade. To the best of our knowledge, human papilloma virus (HPV) infection is the most important factor that results in SCC, especially HPV-16 and HPV-18.14 As people’s understanding of the etiology of SCC and improvements in lifestyle increased, the overall incidence of SCC substantially decreased. In particular, more women have benefited from the cervical cancer vaccine, which became available in 2006.
We observed that the median survival of patients with SCC increased from 189 months to 231 months in the first 2 decades and was not reached in the third decade. In addition, the relative survival was longer in 1993–2002 than in 1983–1992 and showed a survival advantage compared with that in 2003–2012. The shift in patient clinical characteristics may be responsible for the unimproved survival in the last decade. First, population aging was found in patients with SCC due to the growing proportion of elderly patients and decreasing proportion of younger patients across the 3 decades. Second, an increased life expectancy and wide access to modern imaging techniques in developed countries might be, at least partially, responsible for the observed increase in advanced-stage cancer patients with a worse prognosis. Third, despite improvements in screening and preventive modalities, many patients with SCC lacked enough knowledge of screening or regular screening. Moreover, more and more women were under severe social- and work-related stress and decreased physical activities. These risk factors might contribute to the unimproved treatment outcomes.
Racially, Blacks had a higher incidence of SCC compared with Whites and others, but the incidence gap between Blacks and Whites continued to narrow due to a rapidly declining incidence of SCC in Blacks over the 3 decades. Our data also showed higher 5-year and 10-year RSRs in Whites than in Blacks, with the gap constantly narrowing over time across the 3 decades. In terms of SES, the highest SCC incidence was shown in the high-poverty group, while the lowest was in the low-poverty group. Additionally, the low-poverty group showed higher survival than the medium- and high-poverty groups, but the survival gap between the low- and medium-poverty groups continued to narrow across the 3 decades. When stratified by SES, most Whites were defined as low poverty, while most Blacks were defined as medium poverty. The SES disparity between Whites and Blacks may explain the similar changes in the incidence and survival between them. With improvement in the health care system, Black patients with low finances may also have access to better medical consultation and the possibility of timely SCC treatment.
Cox regression analyses for 1983–2012 illustrated that age, race, and SES were the independent predictors of prognosis. When Cox analysis was performed for the 3 decades, SES and race were significantly associated with survival, which indicated that SES, which contributes to the social and economic standing of an individual, has become increasingly critical for disease prognosis with timely and effective treatment resources. Additionally, racial composition plays an important role in the prognosis.15
Notably, we analyzed the incidence, relative survival, and their tendencies across the 3 decades from the SEER database, but this study was limited by the observation that the data reflected the specific SEER registries, which were not applied in other regions. Furthermore, the study may be affected by sources of bias or error, such as under-registration, misclassification of cases, and variation of SES within and over counties.16
Conclusion
This study showed an improvement in the incidence and median survival associated with SCC over the 3 decades. However, relative survival did not significantly improve in the last decade, indicating a pressing need for the development of accurate diagnostics and novel and effective treatments. Furthermore, the incidence and survival gap between races and various SESs continued to narrow over time, indicating that an increasing improvement in the health care system was of importance to eliminate the disparities between races and SES groups, as confirmed in the study.
Acknowledgments
This research was funded by the National Natural Science Foundation of China (81500030) and the Natural Science Foundation of Guangdong Province (2016A030313272, 2016A030313277, and 2017A030313573).
Disclosure
The authors report no conflicts of interest in this work.
References
Jemal A, Bray F, Center MM, Ferlay J, Ward E, Forman D. Global cancer statistics. CA Cancer J Clin. 2011;61(2):69–90. | ||
Siegel RL, Miller KD, Jemal A. Cancer statistics, 2017. CA Cancer J Clin. 2017;67(1):7–30. | ||
Vizcaino AP, Moreno V, Bosch FX, et al. International trends in incidence of cervical cancer: II. Squamous-cell carcinoma. Int J Cancer. 2000;86(3):429–435. | ||
Scarinci IC, Garcia FA, Kobetz E, et al. Cervical cancer prevention: new tools and old barriers. Cancer. 2010;116(11):2531–2542. | ||
Jemal A, Murray T, Ward E, et al. Cancer statistics, 2005. CA Cancer J Clin. 2005;55(1):10–30. | ||
Rositch AF, Nowak RG, Gravitt PE. Increased age and race-specific incidence of cervical cancer after correction for hysterectomy prevalence in the United States from 2000 to 2009. Cancer. 2014;120(13):2032–2038. | ||
Simard EP, Naishadham D, Saslow D, Jemal A. Age-specific trends in black-white disparities in cervical cancer incidence in the United States: 1975–2009. Gynecol Oncol. 2012;127(3):611–615. | ||
Singh GK, Miller BA, Hankey BF, Edwards BK. Persistent area socioeconomic disparities in U.S. incidence of cervical cancer, mortality, stage, and survival, 1975–2000. Cancer. 2004;101(5):1051–1057. | ||
Clegg LX, Reichman ME, Miller BA, et al. Impact of socioeconomic status on cancer incidence and stage at diagnosis: selected findings from the surveillance, epidemiology, and end results: National Longitudinal Mortality Study. Cancer Causes Control. 2009;20(4):417–435. | ||
Rauh-Hain JA, Clemmer JT, Bradford LS, et al. Racial disparities in cervical cancer survival over time. Cancer. 2013;119(20):3644–3652. | ||
Surveillance, Epidemiology, and End Results (SEER) Program Research Data (1973–2009), National Cancer Institute, DCCPS, Surveillance Research Program, Surveillance Systems Branch, released April 2012, based on the November 2011 submission. Available from: https://seer.cancer.gov/registries/terms.html. Accessed August 09, 2018. | ||
Sun H, Ma H, Hong G, Sun H, Wang J. Survival improvement in patients with pancreatic cancer by decade: a period analysis of the SEER database, 1981–2010. Sci Rep. 2014;4:6747. | ||
Singh GK, Miller BA, Hankey BF, Edwards BK. Area Socioeconomic Variations in US Cancer Incidence, Mortality, Stage, Treatment, and Survival, 1975–1999. Bethesda: National Cancer Institute; 2003. Report No.: NIH Publication No.03-5417. Available from: https://seer.cancer.gov/archive/publications/ses/ses_monograph.pdf. Accessed August 17, 2018. | ||
Hammer A, Rositch A, Qeadan F, Gravitt PE, Blaakaer J. Age-specific prevalence of HPV16/18 genotypes in cervical cancer: a systematic review and meta-analysis. Int J Cancer. 2016;138(12):2795–2803. | ||
Adams SA, Fleming A, Brandt HM, et al. Racial disparities in cervical cancer mortality in an African American and European American cohort in South Carolina. J S C Med Assoc. 2009;105(7):237–244. | ||
Krieger N, Chen JT, Waterman PD, Soobader MJ, Subramanian SV, Carson R. Geocoding and monitoring of US socioeconomic inequalities in mortality and cancer incidence: does the choice of area-based measure and geographic level matter? The Public Health Disparities Geocoding Project. Am J Epidemiol. 2002;156(5):471–482. |
Supplementary materials
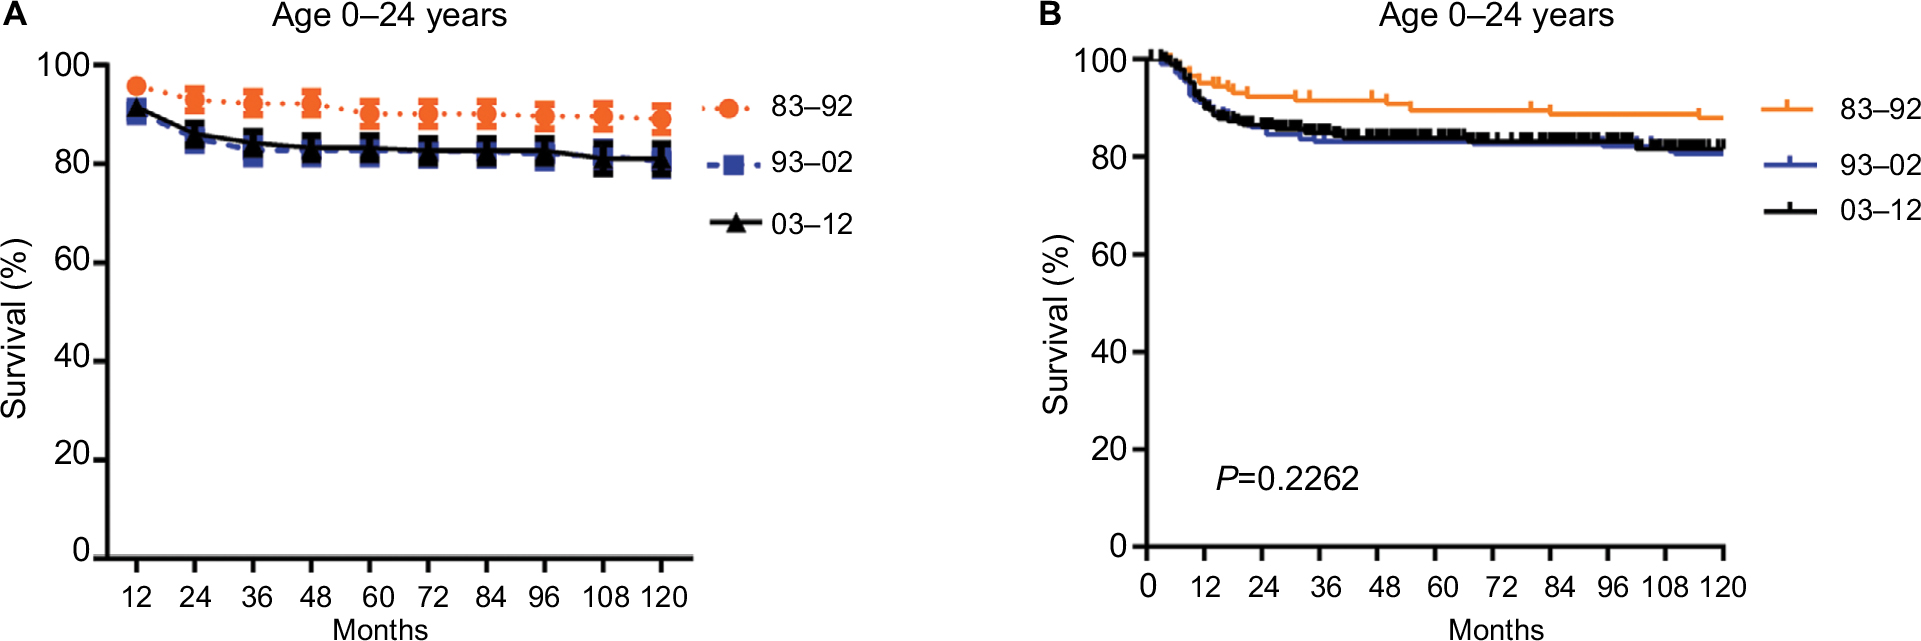 | Figure S1 Trends in ten-year relative survival rates (A) and Kaplan-Meier survival analyses (B) for patients with SCC at 18 SEER sites in 1983–1992 (orange), 1993–2002 (blue) and 2003–2012 (black) respectively according to age group 0–24 and calendar period. |
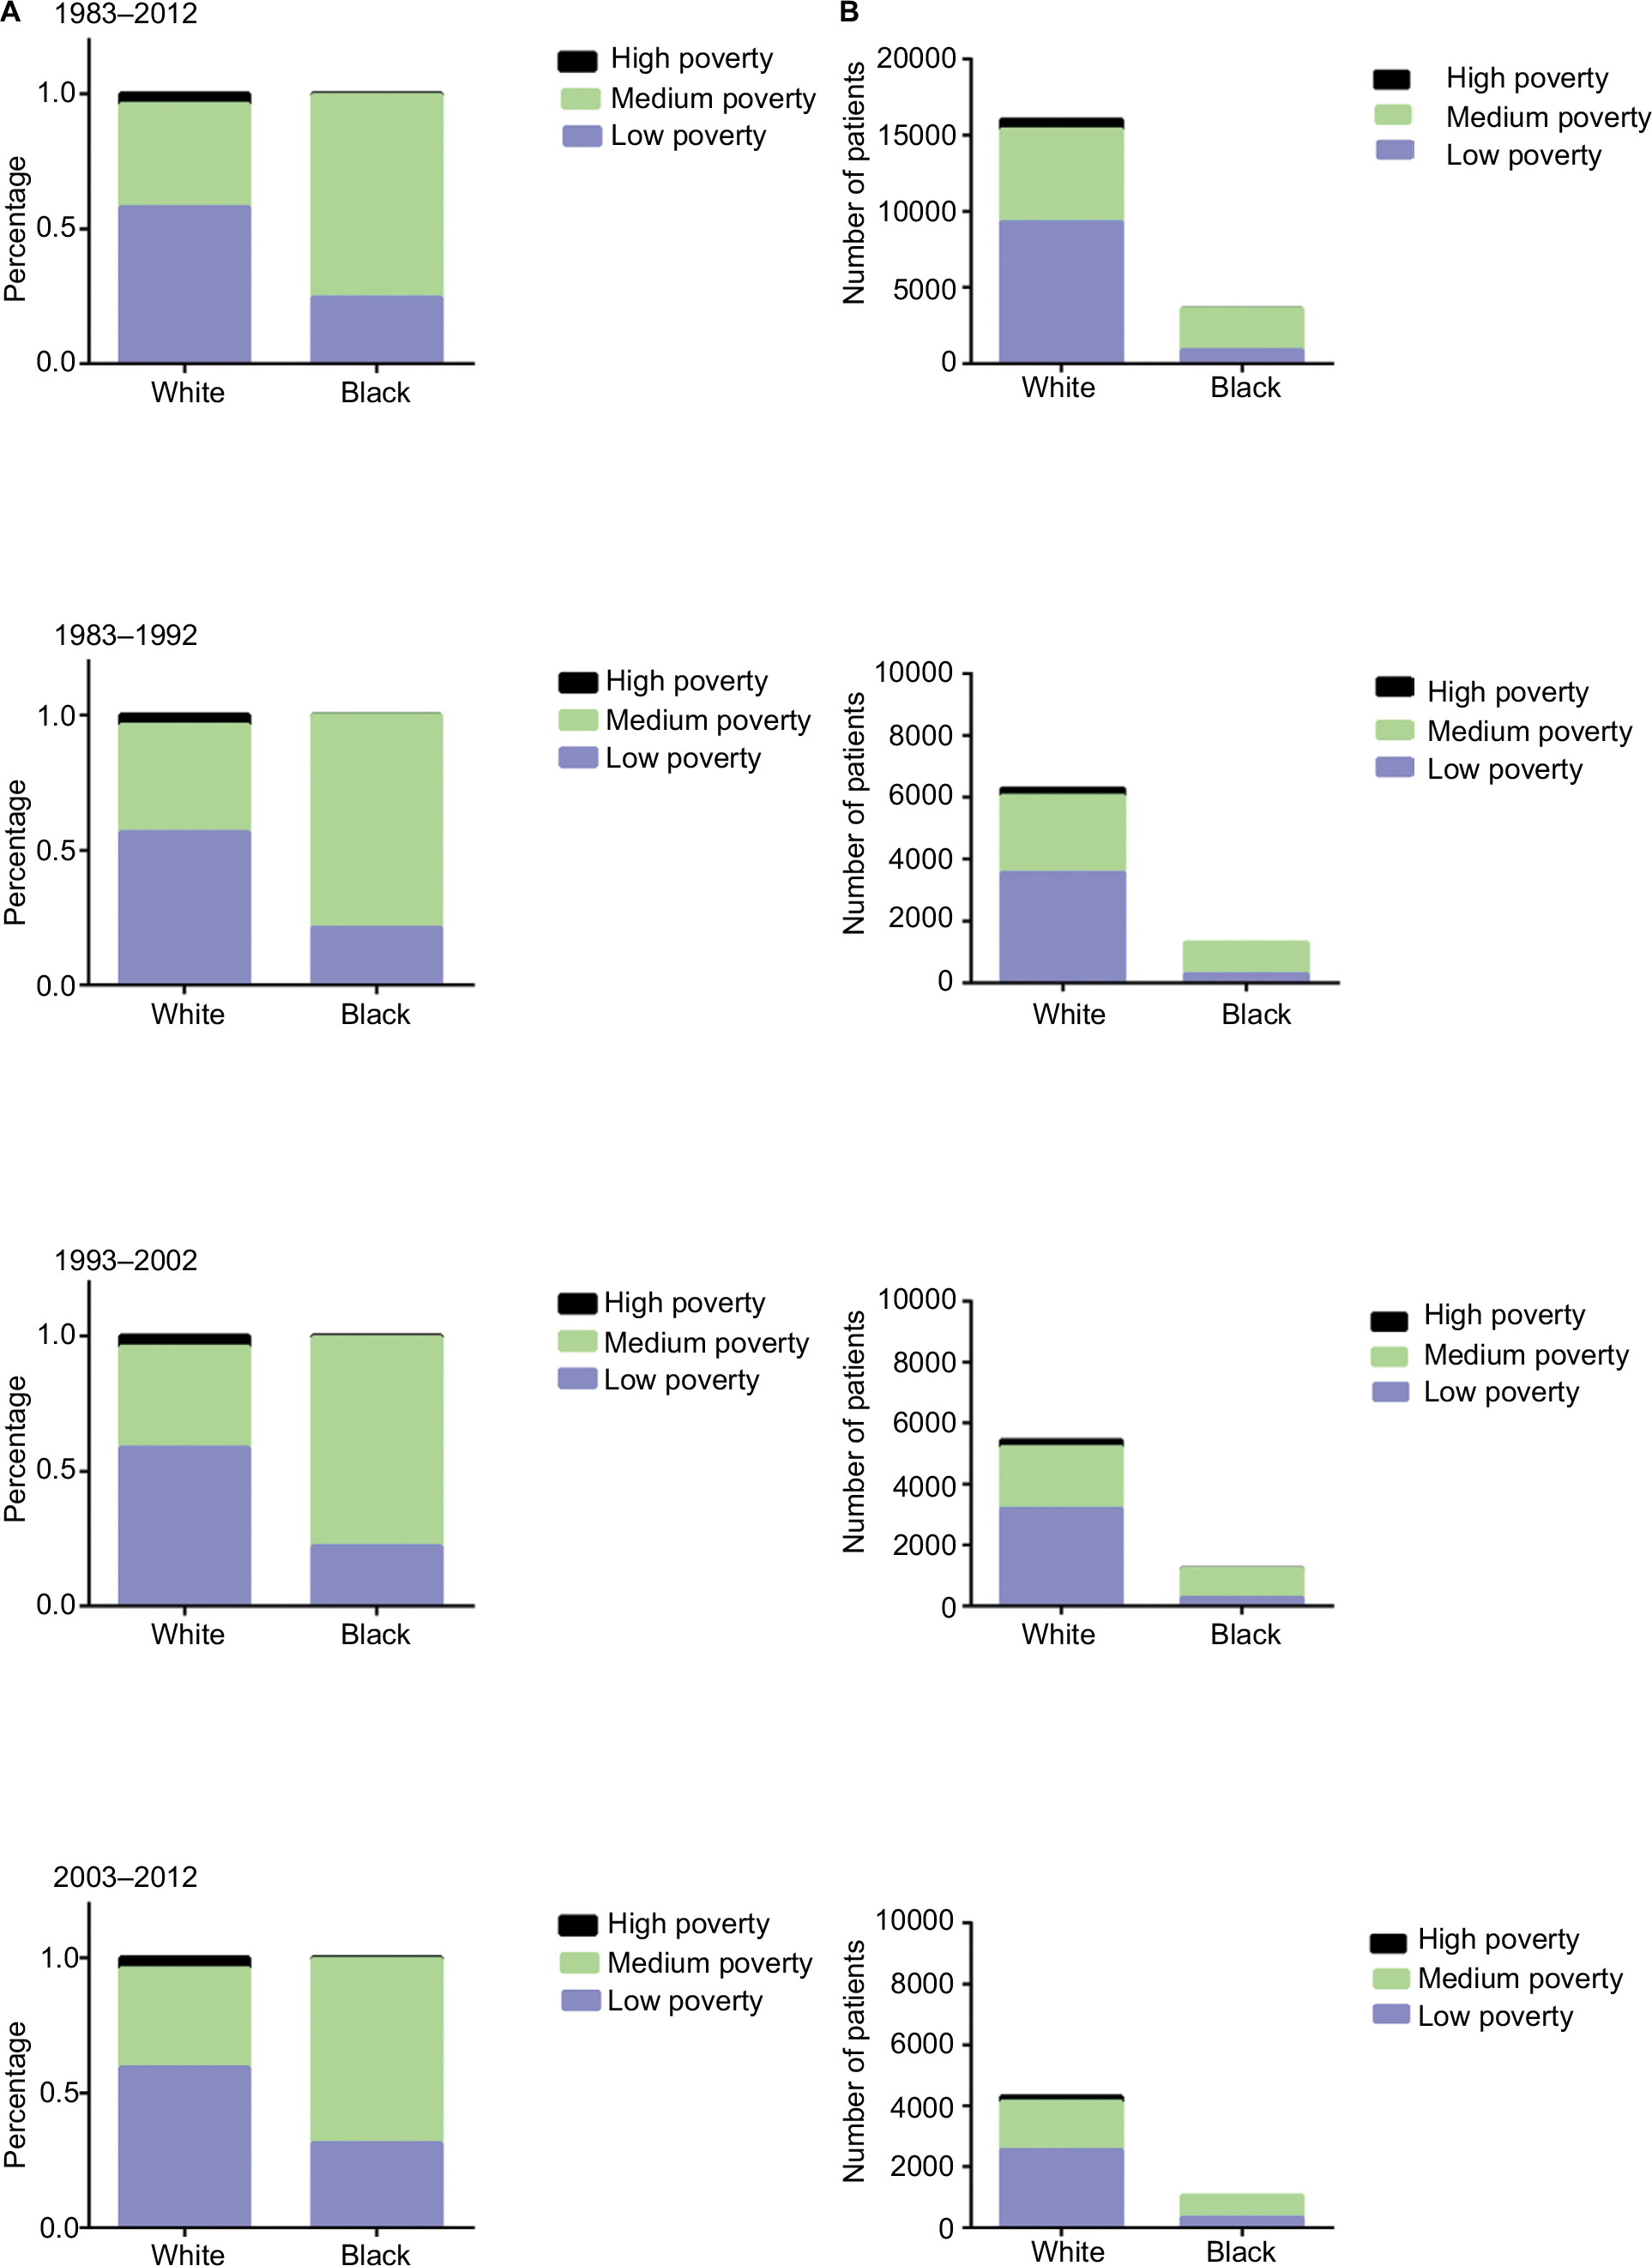 | Figure S2 Distribution of socioeconomic status by race for patients with SCC at 18 SEER sites between 1983 and 2012. Percentage (A) and number (B) of patients with SCC in low-poverty, medium-poverty, and high-poverty groups. Abbreviations: SCC, squamous cervical cancer; SEER, Surveillance, Epidemiology, and End Results. |
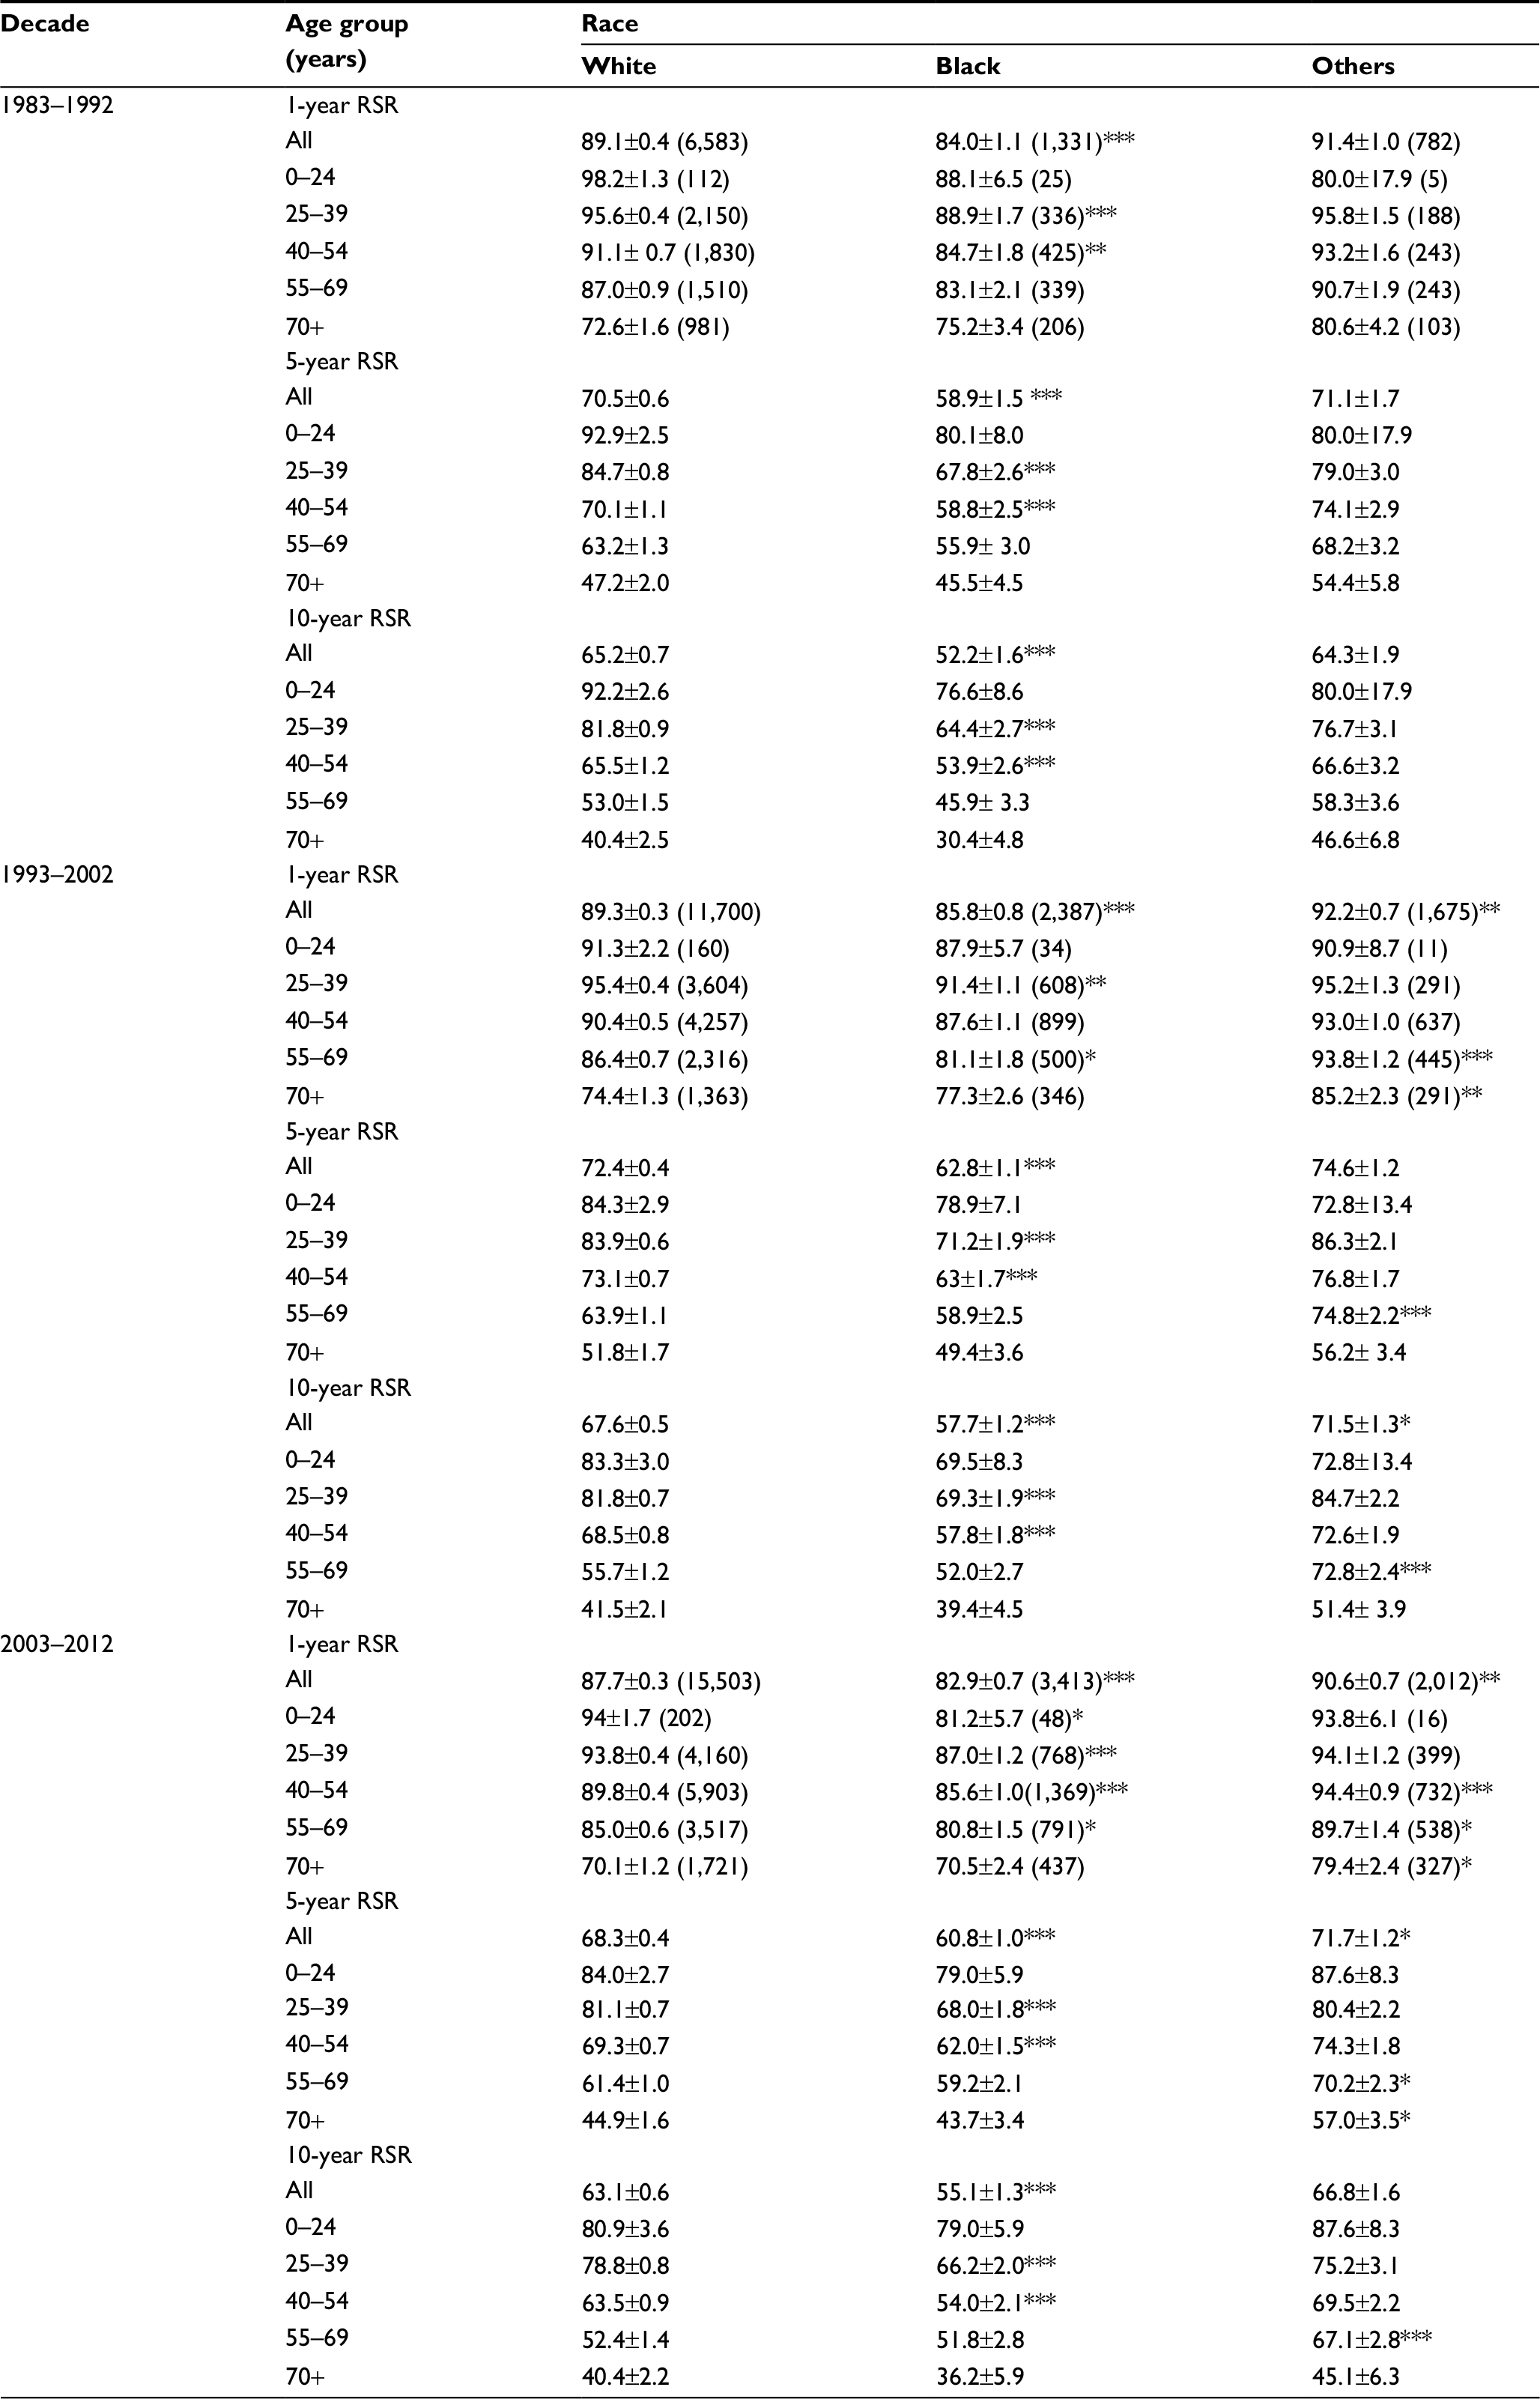 | Table S1 The 1-year, 5-year, and 10-year RSRs of SCC patients according to race, age group, and calendar period from 1983 to 2012 at 18 SEER sites Notes: Data are mean ± SEM, with number of patients in parentheses. *p < 0.01, **p < 0.001, and ***p < 0.0001 for comparisons with the White group. Abbreviations: RSRs, relative survival rates; SCC, squamous cervical cancer; SEER, Surveillance, Epidemiology, and End Results; SEM, standard error of the mean. |
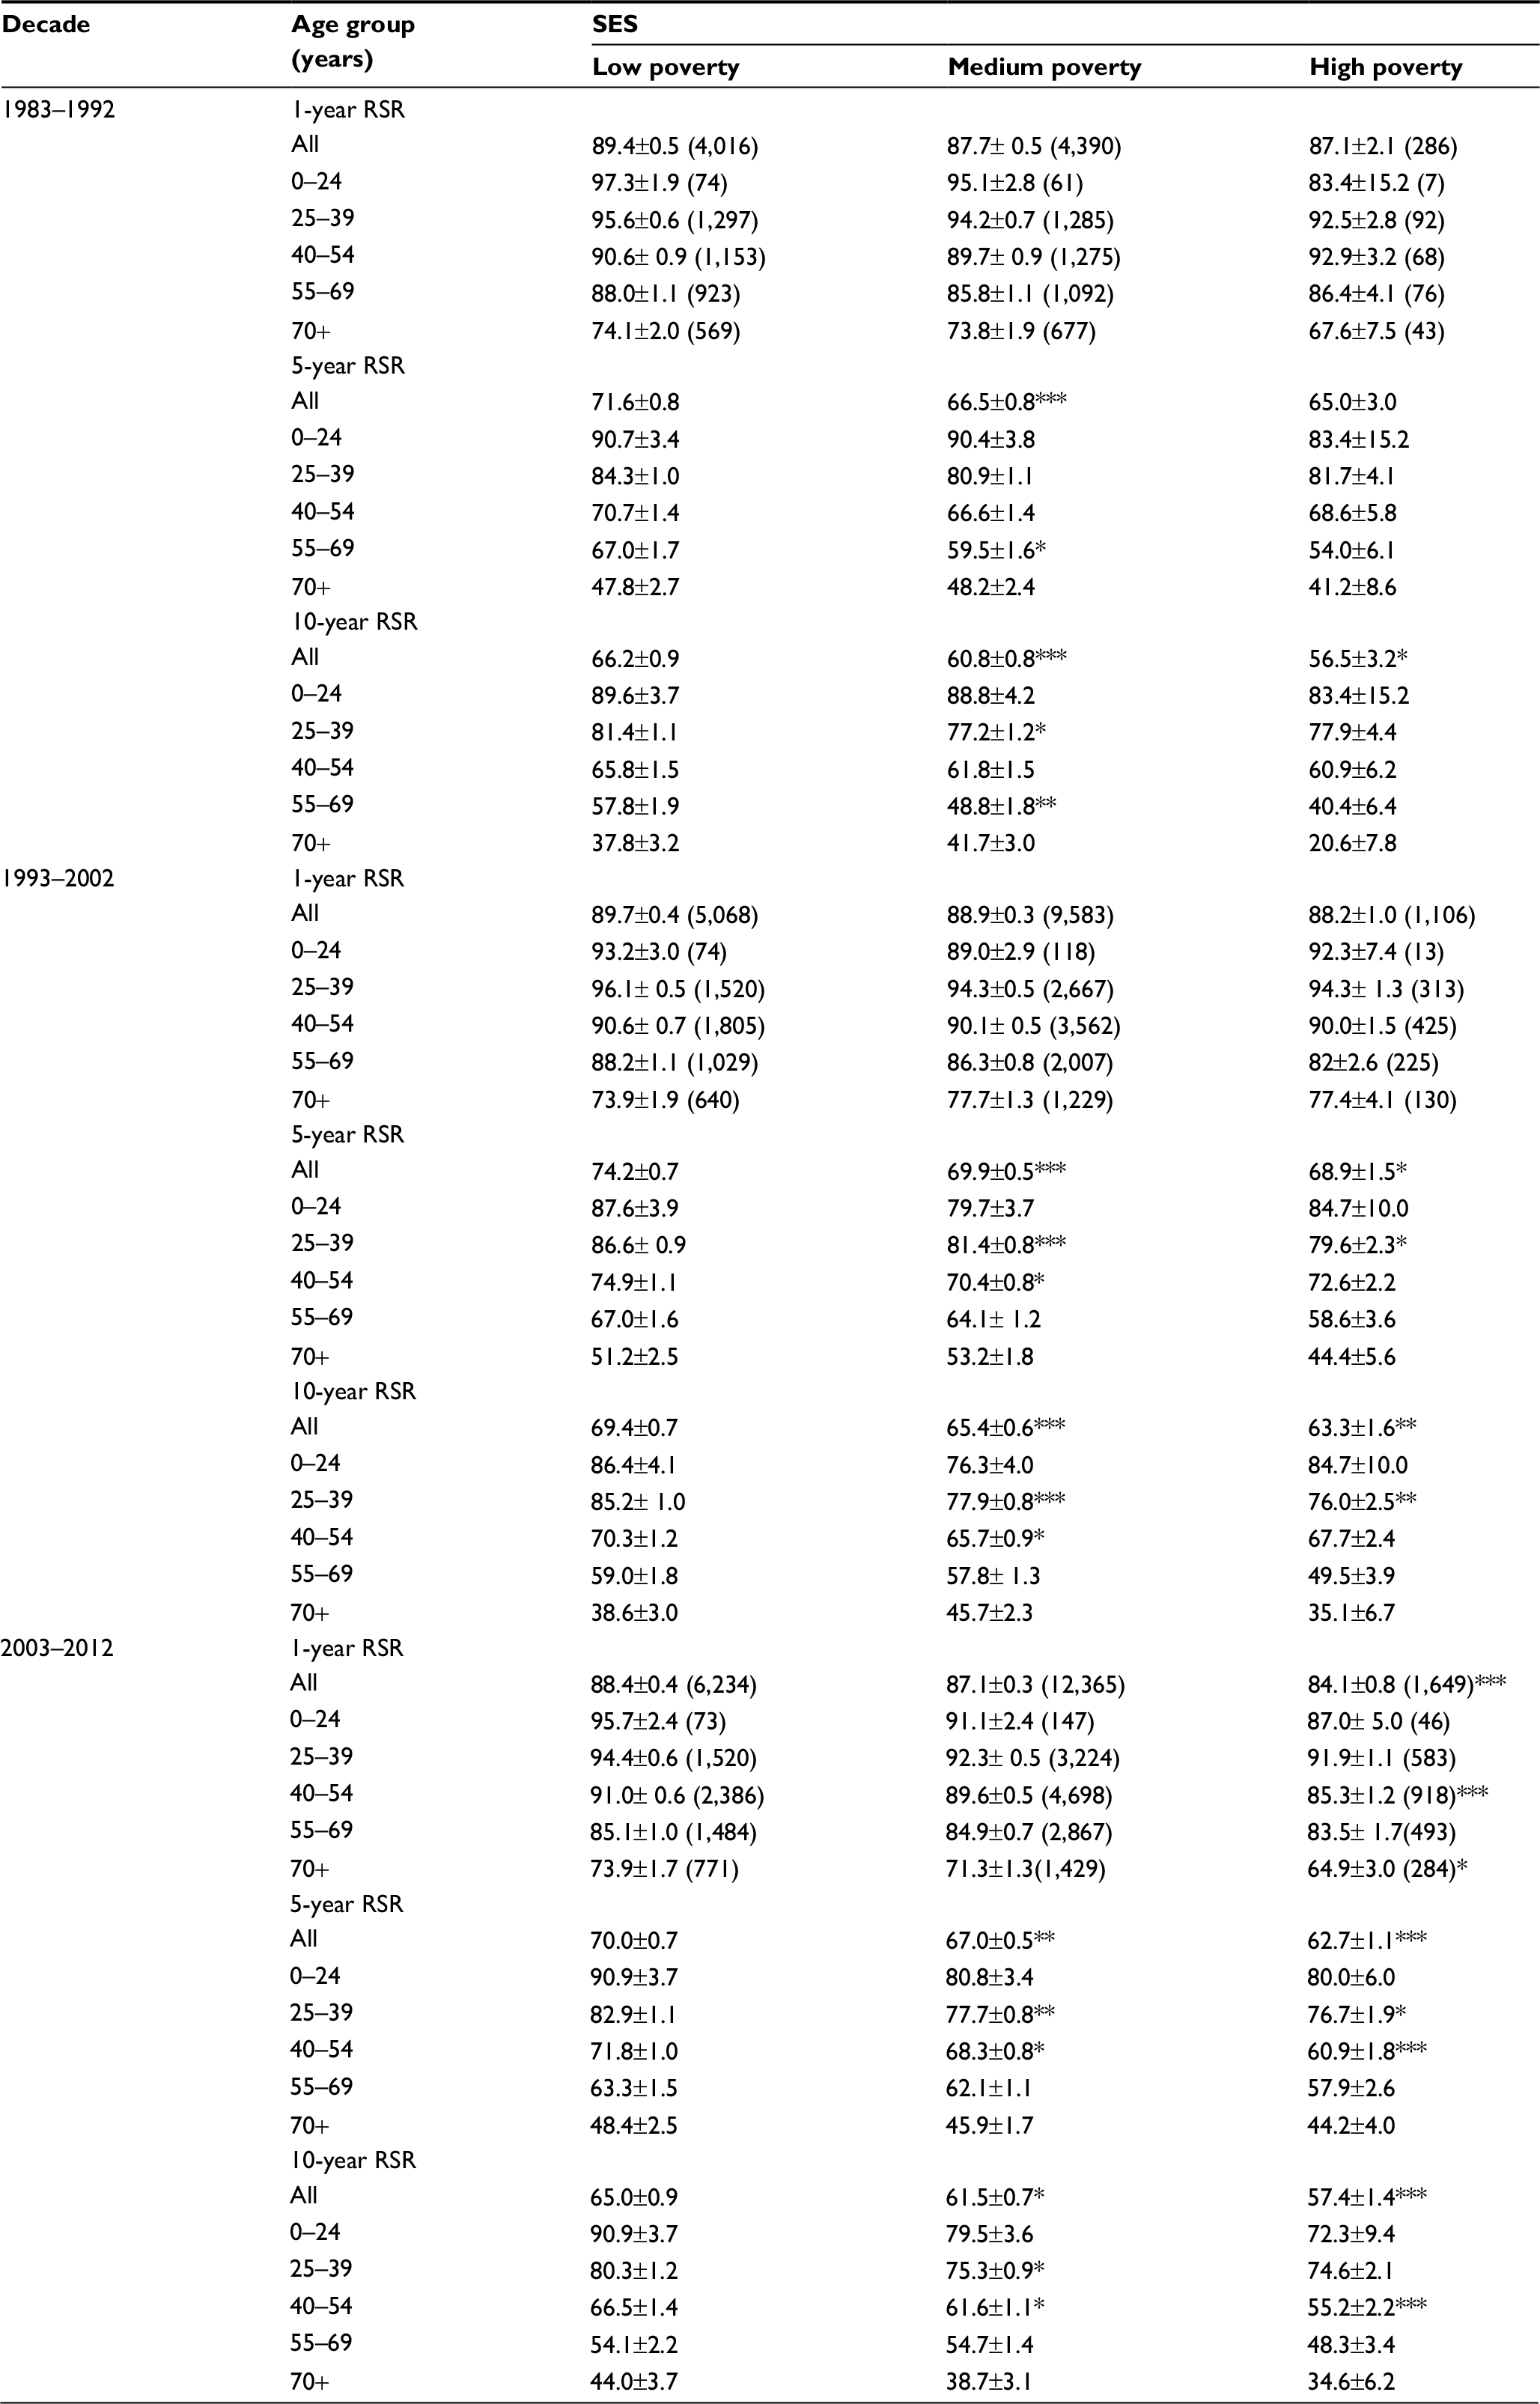 | Table S2 1-year, 5-year, and 10-year RSRs of SCC patients according to SES, age group, and calendar period from 1983 to 2012 at 18 SEER sites Note: Data are means ± SEM, with number of patients in parentheses. *p < 0.01, **p < 0.001, and ***p < 0.0001 for comparisons with the White group. Abbreviations: RSRs, relative survival rates; SCC, squamous cervical cancer; SES, socioeconomic status; SEER, Surveillance, Epidemiology, and End Results; SEM, standard error of the mean. |
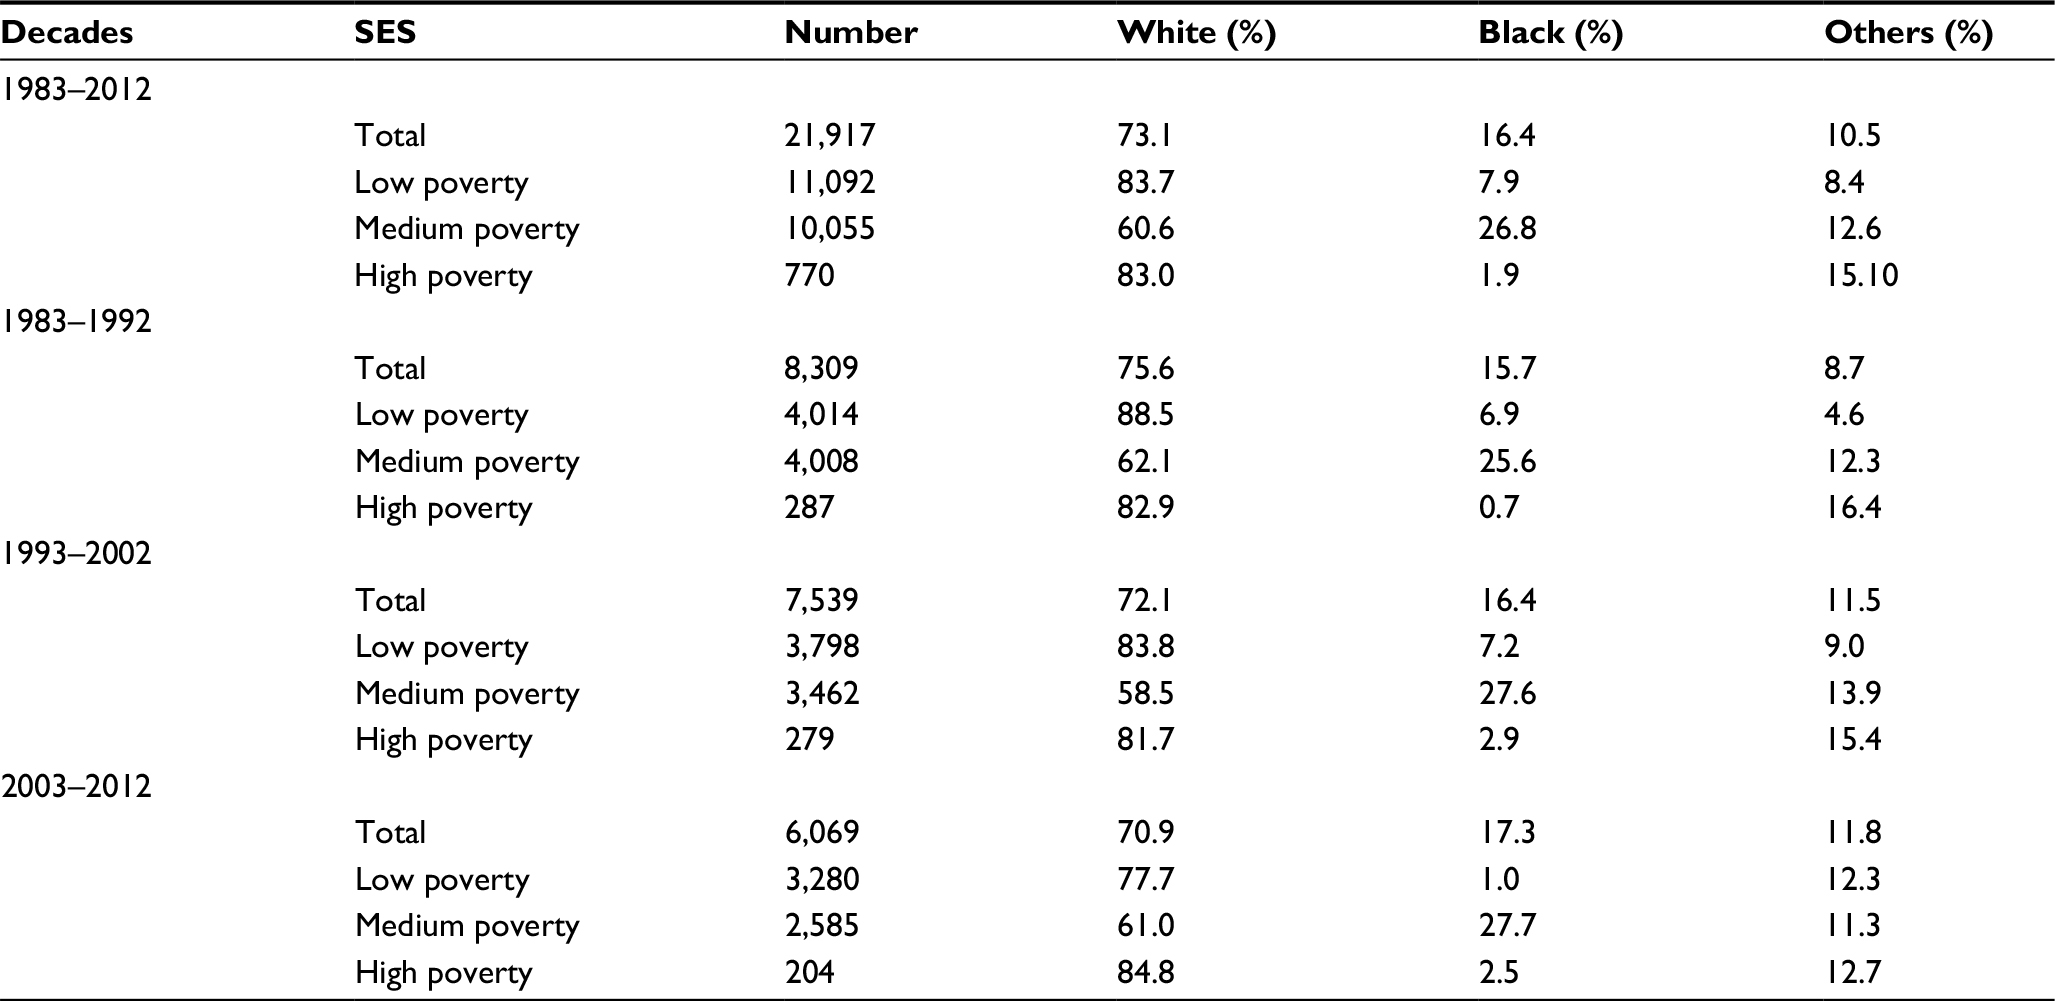 | Table S3 Summary data for race distribution by SES and calendar period in patients with SCC from 1983 to 2012 at 18 SEER sites Abbreviations: SES, socioeconomic status; SCC, squamous cervical cancer; SEER, Surveillance, Epidemiology, and End Results. |
 © 2018 The Author(s). This work is published and licensed by Dove Medical Press Limited. The full terms of this license are available at https://www.dovepress.com/terms.php and incorporate the Creative Commons Attribution - Non Commercial (unported, v3.0) License.
By accessing the work you hereby accept the Terms. Non-commercial uses of the work are permitted without any further permission from Dove Medical Press Limited, provided the work is properly attributed. For permission for commercial use of this work, please see paragraphs 4.2 and 5 of our Terms.
© 2018 The Author(s). This work is published and licensed by Dove Medical Press Limited. The full terms of this license are available at https://www.dovepress.com/terms.php and incorporate the Creative Commons Attribution - Non Commercial (unported, v3.0) License.
By accessing the work you hereby accept the Terms. Non-commercial uses of the work are permitted without any further permission from Dove Medical Press Limited, provided the work is properly attributed. For permission for commercial use of this work, please see paragraphs 4.2 and 5 of our Terms.