")
Back to Journals » Diabetes, Metabolic Syndrome and Obesity » Volume 10
Transition from pre-diabetes to diabetes and predictors of risk in Mexican-Americans
Authors Wu SH , McCormick JB, Curran JE, Fisher-Hoch SP
Received 7 March 2017
Accepted for publication 13 September 2017
Published 6 December 2017 Volume 2017:10 Pages 491—503
DOI https://doi.org/10.2147/DMSO.S136368
Checked for plagiarism Yes
Review by Single anonymous peer review
Peer reviewer comments 3
Editor who approved publication: Professor Ming-Hui Zou
Shenghui Wu,1 Joseph B McCormick,2 Joanne E Curran,3 Susan P Fisher-Hoch2
1Department of Epidemiology and Biostatistics, University of Texas Health at San Antonio-Laredo Campus, Laredo, 2Division of Epidemiology, University of Texas Health Science Center-Houston, School of Public Health, Brownsville Campus, Brownsville, 3South Texas Diabetes and Obesity Institute, School of Medicine, University of Texas Rio Grande Valley, Brownsville Campus, Brownsville, TX, USA
Background: No studies have examined risk factors for the transition from pre-diabetes to diabetes in populations with widespread obesity and diabetes. We determined proximal changes and factors affecting the transition among Mexican-Americans with pre-diabetes.
Methods: Participants with pre-diabetes (n=285) were recruited from our randomly sampled population-based Cameron County Hispanic Cohort. These participants were followed for an average of 27 months with repeat examination every 3 to 4 months. Metabolic health was defined as having less than 2 metabolic abnormalities (e.g., hypertension, elevated low-density lipoprotein, etc). Diabetes was identified as fasting blood glucose ≥126 mg/dL, glycated hemoglobin ≥6.5% and/or on hypoglycemic medication.
Results: Ninety-six of 285 (33.7%) participants transitioned to overt diabetes. The increased risk of diabetes in the metabolically unhealthy varying with follow-up time was 81% (adjusted odds ratio [OR]: 1.81; 95% CI: 1.09–3.02). The risk of diabetes increased 8% for each kg/m2 of increase in body mass index (BMI, OR: 1.08; 95% CI: 1.05–1.11) independent of covariates. Transition to diabetes was accompanied by a mean increase in BMI of 0.28 kg/m2, and deterioration in metabolic health of 9% (OR: 1.09; 95% CI: 1.003–1.18) compared with those who did not transition.
Conclusions: Deteriorating metabolic health and/or increasing BMI significantly raises the risk of transitioning from pre-diabetes to diabetes. Transition itself was accompanied by further increase in BMI and deterioration in metabolic health. These data underline the importance of improving metabolic health and avoiding weight gain in pre-diabetes as simple but clear diabetes prevention targets, and emphasize the importance of lifestyle management.
Keywords: transition, pre-diabetes, diabetes, predictors, risk, Mexican-Americans, Hispanic, Latino
Introduction
The prevalence of type 2 diabetes has grown to epidemic proportions globally in the last few decades.1,2 The burden is expected to increase even further due to aging, urbanization and the increasing prevalence of physical inactivity and obesity.2 In the USA, nearly 24 million persons have diabetes. One-quarter are undiagnosed and are unaware of their condition. At least 57 million citizens have pre-diabetes, defined as impaired fasting glucose of 100–125 mg/dL.3 By 2050, rates of diagnosed diabetes are projected to reach 48 million.3 Globally, the International Diabetes Federation estimates that there are currently 415 million people with diabetes, half of whom are undiagnosed, and three-quarters live in low- and middle-income countries.4 Similarly, the US burden is greatest in minorities such as Mexican-Americans.3
Impaired fasting glucose (100–125 mg/dL), impaired glucose tolerance (140–199 mg/dL at 2 hours) and/or impaired glycated hemoglobin (HbA1c, 5.7–6.4%) are classified as pre-diabetes.5,6 The oral glucose tolerance test is not widely used due to inconvenience, greater cost and lower reproducibility than fasting blood glucose (FBG) or HbA1c,6 which are commonly used in clinics and in population-based studies assessing the risk of diabetes. Several longitudinal studies support the observation that pre-diabetes is a risk factor for diabetes, cardiovascular disease and even cancer,7–10 but no studies have examined risk factors for the transition from pre-diabetes to diabetes and the proximal changes accompanying this transition in populations with widespread obesity and diabetes. The only relevant publication we are aware of is a longitudinal study among American-Indians without diabetes which showed that pre-diabetes at baseline was an independent predictor of transition to type 2 diabetes, compared to individuals with normal glucose metabolism at baseline.11 That study found that measures of baseline obesity, hemoglobin (HbA1c), FBG, 2-hour fasting plasma glucose, fasting insulin, albuminuria and insulin resistance helped predict transition.11 However, understanding proximal events by characterizing established metabolic and other markers accompanying transition to overt type 2 diabetes should yield better understanding of the precipitating risk factors among those with pre-diabetes.7–9 This would permit distinguishing the person with pre-diabetes at risk of transition from those who are not. This study was to determine the factors affecting transition from pre-diabetes to overt type 2 diabetes and proximal changes accompanying that transition in a Mexican-American cohort with high prevalence rates of diabetes (28%), obesity and undiagnosed pre-diabetes (31.6%).12 Unique aspects of this intensive study are that it provides longitudinal data, has general application and particular relevance for the largest and most rapidly growing minority in the USA.
Methods
Study participants
We created a nested cohort selected from our larger community-recruited and randomly sampled Cameron County Hispanic Cohort (CCHC, n=3,627 at the time of this study; currently 4,300), an on-going homogenous Mexican-American cohort.13,14 From this cohort, we selected 285 adult participants (Diabetes Risk Study [DRS] subjects) on the basis of pre-diabetes (FBG ≥100 mg/dL and <126 mg/dL and/or HbA1c 5.7%–6.4%) and examined them every 3 to 6 months for an average of 27 months (range: 3–129 months). The participants were randomly selected as part of the larger cohort, and we selected 285 out of about 900 randomly selected participants (28% already had diabetes and another 32% had pre-diabetes). So the 285 represented nearly all of those with pre-diabetes in the early days of the cohort. The DRS started from April, 2004 and ended in December, 2015. This study was approved by the Committee for the Protection of Human Subjects of the University of Texas Health, Houston, TX, USA.
Admission DRS examinations
At enrollment to this nested cohort all DRS subjects provided written informed consent. They then responded to a detailed survey of sociodemographic characteristics, lifestyle including physical activity, diet, medical and family history, and other potential exposures. Body measurements, including current weight, height, and waist and hip circumferences (HCs), were also taken.13,14 Weight was measured to the nearest tenth of a kilogram and height to the nearest tenth of a centimeter. Body mass index (BMI) was calculated by dividing weight in kilograms by height squared in meters (kg/m2). Waist circumference (WC) was measured at the level of the umbilicus and HC at the level of maximum width of buttocks with participants standing erect. Three blood pressure (BP) measurements were taken 5 minutes apart, and the average of the second and third reading was used.
In line with standard CCHC protocols, all DRS subjects provided blood sample at each visit following a 10 hours overnight fast. After collection, samples were placed on ice and centrifuged within 30 minutes. Following processing, samples were frozen at −80°C. Laboratory studies included complete blood count, metabolic and lipid panels, and HbA1c at a Clinical Laboratory Improvement Amendments certified laboratory. Fasting serum insulin was consistently performed in-house using Mercodia immunoassays (Uppsala, Sweden). Homeostasis model assessment insulin resistance (HOMA-IR) index was calculated as (glucose [nmol/L]×insulin [µU/mL]/22.5).15 High-sensitivity C-reactive protein (CRP) levels were measured using Quantikine® ELISA kit (R&D Systems, Inc., Minneapolis, MN, USA). The coefficient of variations for all biomarkers ranged from 0.99% to 11%.
Intermediate follow-up examinations (Short visit)
Every 3 to 4 months, a follow-up visit was performed, some of which were in the home. Questionnaires were administered to update demographic data, determine changes in diagnosed conditions, doctor visits or hospitalization since the last visit. Weight, WC, HC and BP were measured, and a blood sample following a 10 hours overnight fast was stored at −80°C.
Annual follow-up examinations (Long visit)
Once a year, a complete clinical examination identical to the admission protocol was performed in the clinic research unit. Physical activity and dietary questionnaire were re-administered. The International Physical Activity Questionnaire (IPAQ) short-form16 in the early years of the cohort or the Godin Leisure-Time Exercise Questionnaire instruments 17 in the later years of the cohort as reported previously18 was used to re-access physical activity in a typical week according to intensity, frequency (times/week) and duration (minutes/time). Metabolic equivalent (MET) adjusted minutes of moderate and vigorous physical activity in the last week were calculated based on responses.19 Moderate and vigorous physical activity ≥600 MET adjusted minutes was considered meeting US physical activity guidelines (USDHHS).19 Fruit and vegetable consumption was assessed by asking subjects how many portions of fruit and vegetables they ate daily using the Food Frequency Questionnaire.20 A portion size was defined as a half a cup of fresh, frozen or canned produce or a medium-sized piece of produce.21,22 Eating ≥5 fruit and vegetable portions daily was considered meeting US guidelines.21,22
Identification of diabetes
Diabetes was identified by the 2010 definition of diabetes of the American Diabetes Association: an FBG ≥126 mg/dL or HbA1c >6.5%6 or the subjects’ reporting being told by a health care provider that they had diabetes or if they were taking hypoglycemic medication. Transition to diabetes required two fasting FBG measurements at least 1 day apart meeting the American Diabetes Association criteria for diabetes.
Definition of metabolic health
Metabolic health was defined as having less than 2 of the following metabolic abnormalities: systolic BP (SBP) ≥130 mmHg and/or diastolic BP (DBP) ≥85 mmHg or on antihypertensive medication; triglyceride ≥150 mg/dL and high-density lipoprotein-cholesterol (HDLC) <40 mg/dL in men or <50 mg/dL in women.23,24 To avoid bias, we did not use blood glucose levels nor diabetes medication in the definition of metabolic health in our comparison of the risk for diabetes in metabolically healthy and unhealthy groups.
Statistical analysis
Descriptive analyses were conducted to compare the characteristics of the DRS subjects who did or did not transition to diabetes. Log-transformation was conducted to normalize the distribution of continuous variables as appropriate. The 2-sample t-test was used to compare means for continuous data. The Chi-square test was used to compare phenotypes for categorical data. Incidence density (person-years per 100 individuals) was calculated to evaluate the transition rate from pre-diabetes to diabetes, further classified by metabolic health status at enrollment.
To explore the predictors reflecting the transition from pre-diabetes to diabetes, the first overt diabetes transition was treated as the outcome. Since the outcome measurements at enrollment and the follow-up every 3–6 months are expected to be correlated, Generalized Estimating Equations (GEE) models were used to analyze the association between predicting factors and the risk of diabetes. Potential confounders were adjusted for likely associated with diabetes outcomes. Since our previous findings suggested the importance of metabolic health on diabetes risk25 and the purpose being to improve the power of statistics, our analyses used the composite indicator – metabolic health rather than single metabolic biomarker in the multivariable-adjusted models. Besides age, gender and follow-up time, other factors with significant univariate effect on diabetes risk were included into the final model. To avoid bias, we did not examine the association between diabetes risk and blood glucose levels, HbA1c or HOMA-IR in the analyses since they were critical components of the definition of diabetes. Potential confounders adjusted for in multivariable GEE models included age, gender, follow-up time, and time-varying BMI, white blood cell (WBC), insulin and metabolic health. Variables that were not significant or not confounders were excluded from the final model. The model including BMI did not include waist-to-hip ratio (WHR)/WC at the same time due to its collinearity with BMI. The exposure by follow-up time interaction term was also included into the model since it might suggest that the exposure might vary as time progresses. GEE model was also used to explore the predictors reflecting the transition from pre-diabetes to normal glucose level at the last visit.
The graph to present the cumulative incidence of diabetes over time was generated by a Cox regression model. To illustrate the risk for diabetes over time, we also used a restricted cubic spline GEE logistic regression analysis 26 to evaluate the risk of diabetes with follow-up months. Knots were placed at the 5th, 50th and 95th percentiles of the distribution of follow-up months.
Linear mixed-effects regression models with random intercept were used to estimate the association between repeated measures of markers such as plasma metabolic biomarker concentrations as the outcome (dependent variable), and transition to diabetes as categorical exposure (independent variable). Separate models were used for each marker to examine the changes of each marker accompanying transition. The models also controlled for covariates including follow-up months, time-varying BMI, time-varying metabolic health, age and gender. Interaction terms between diabetes and follow-up time were included to explore effect modification of the rate of transition to diabetes. The GEE model was used to analyze the effect of the transition from pre-diabetes to diabetes (independent variable) on the categorical variable, metabolic health (dependent variable). Potential confounders adjusted for in the multivariable GEE model included age, gender, follow-up time and BMI. The transition-to-diabetes by follow-up time interaction term was also included into the model.
Linear mixed-effects regression models were used to analyze the factors affecting the longitudinal change of fasting plasma glucose or HbA1c levels, respectively, after the diagnosis of pre-diabetes. Besides age, gender and follow-up time, other factors with significant univariate effect on glucose level or HbA1c levels were included into the final models, respectively.
Statistical analyses were carried out by using SAS version 9.4 (SAS Institute, Cary, NC, USA). All statistical tests were based on 2-sided probability.
Results
The mean age of 285 DRS subjects with pre-diabetes at baseline was 50 years; 36% were male. During the average of 27 months of follow-up (range: 3–129 months), 96 (33.7%) subjects transitioned from pre-diabetes to overt diabetes. The overall incidence density was 12.4/100 person-years, but 14.7/100 person-years in metabolic unhealthy obese subjects at enrollment and 6.4/100 person-years in metabolic healthy normal weight subjects at enrollment. The overweight/obese and metabolically unhealthy subjects have shorter time to develop diabetes than the metabolic healthy normal weight subjects (35.2 versus 31.4 months). Participants had 2–18 study visits (median 6 visits). The baseline BMI, WC, WHR and the levels of fasting glucose, HbA1c, CRP and DBP were significantly higher in subjects developing diabetes than those without. For other characteristics, no significant differences were observed between subjects developing diabetes and those without. Detailed characteristics by diabetes status during follow-up are shown in Table 1.
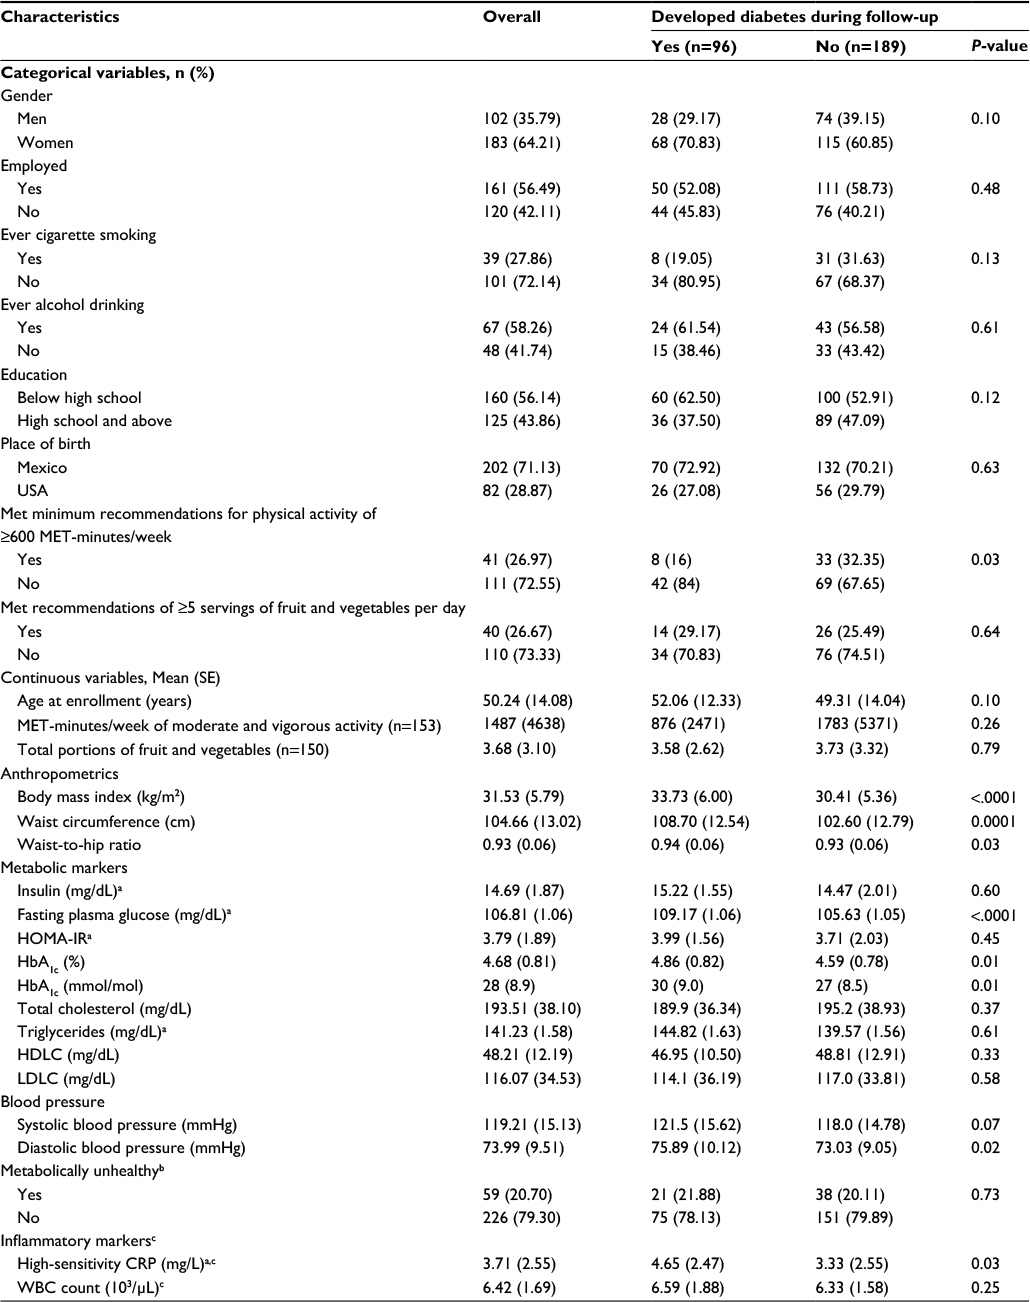 | Table 1 Cohort baseline characteristics according to the follow-up diabetes status: diabetes risk study (April, 2004–December, 2015) Notes: aGeometric concentrations. bMetabolic health was defined as having less than 2 of the following metabolic abnormalities: systolic blood pressure ≥130 mmHg and/or diastolic blood pressure ≥85 mmHg or on antihypertensive medication; triglyceride ≥150 mg/dL; HDLC <40 mg/dL in men or <50 mg/dL in women. cThe number for CRP is 58 in diabetes group and 120 in non-diabetes group; that for WBC is 86 and 172, respectively. Abbreviations: CRP, C-reactive protein; HbA1c, glycated hemoglobin; HDLC, high-density lipoprotein-cholesterol; HOMA-IR, homeostasis model assessment insulin resistance; LDLC, low-density lipoprotein-cholesterol; MET, metabolic equivalent; WBC, white blood cell. |
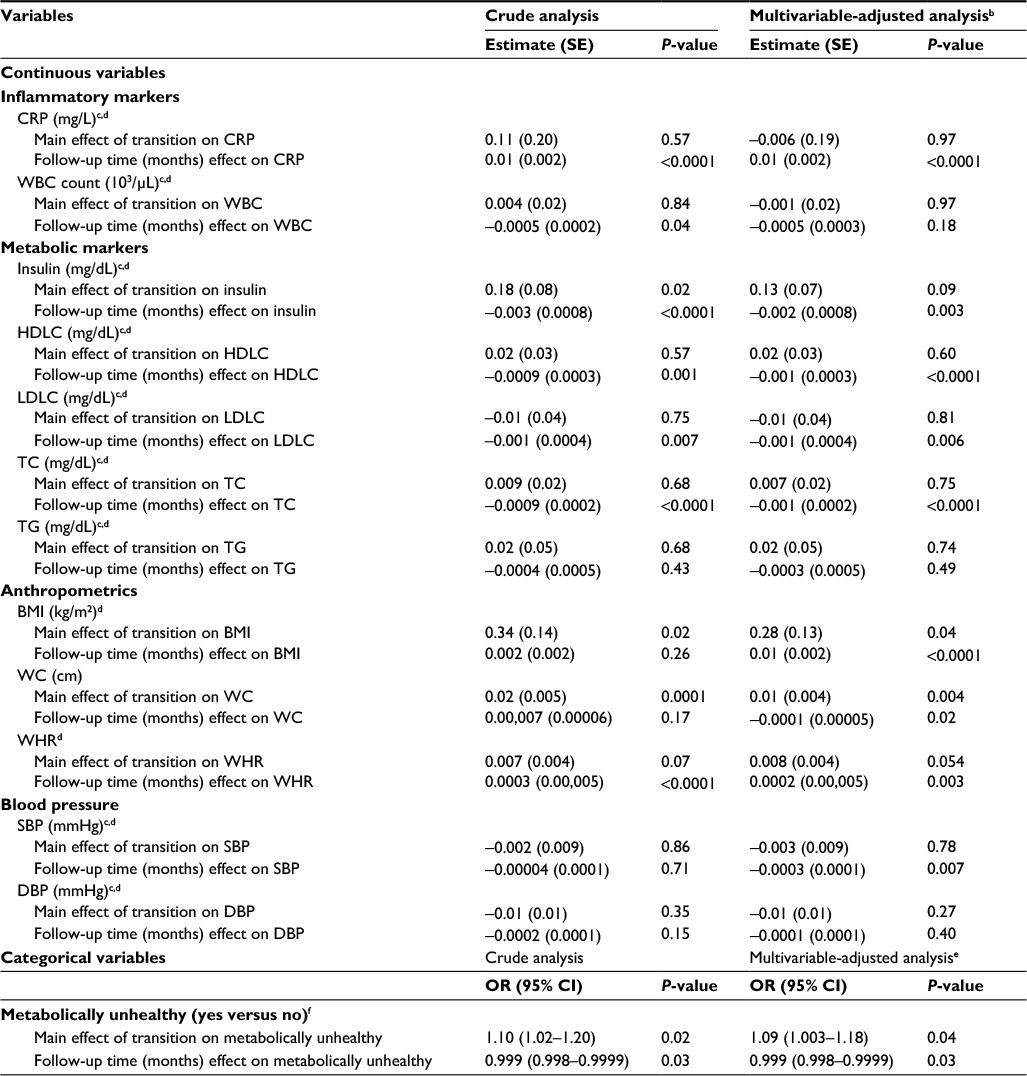
Table 2 presents the odds ratio (OR) of the transition from pre-diabetes to diabetes over time, and the overall associations between each marker and longitudinal overt diabetes development during 129-month follow-up after the pre-diabetes diagnosis. The risk of the transition from pre-diabetes to diabetes was not significantly associated with follow-up time. However, WBC, insulin, HDLC, triglycerides, metabolic health, BMI, WC, WHR and SBP were all significantly associated with the transition from pre-diabetes to diabetes in the crude analysis (all Ps<0.05), but these associations were no longer significant for WBC, insulin, WHR and SBP after adjusting for age, gender, follow-up time and BMI or metabolic health. Other factors including physical activity and diet were not statistically associated with the risk of transition to diabetes. Since metabolic health included HDLC, triglycerides and BP by definition, it was not put into the multivariable-adjusted model together with its components at the same time. In the final multivariable-adjusted GEE model (Table 3), only deteriorating metabolic health and higher BMI were significantly associated with the risk of transition to diabetes. The risk of diabetes increased 8% when BMI increased 1 kg/m2 (OR: 1.08; 95% CI: 1.05–1.11) excluding the effect of age, gender, metabolic health and follow-up period. Compared with the metabolically healthy, metabolically unhealthy DRS subjects increased their risk of transition to diabetes by 81% (OR: 1.81; 95% CI: 1.09–3.02) after adjusting for age, gender, BMI and follow-up time (Table 3). Interaction terms were not statistically significant in the final model. Table 4 shows the OR of the transition from pre-diabetes to normal glucose level at the last visit over time, and the significant influencing factors and longitudinal normal glucose transition during 129-month follow-up after the pre-diabetes diagnosis. The final model shows that insulin increment significantly decreased the possibility to transition from pre-diabetes to normal glucose level.
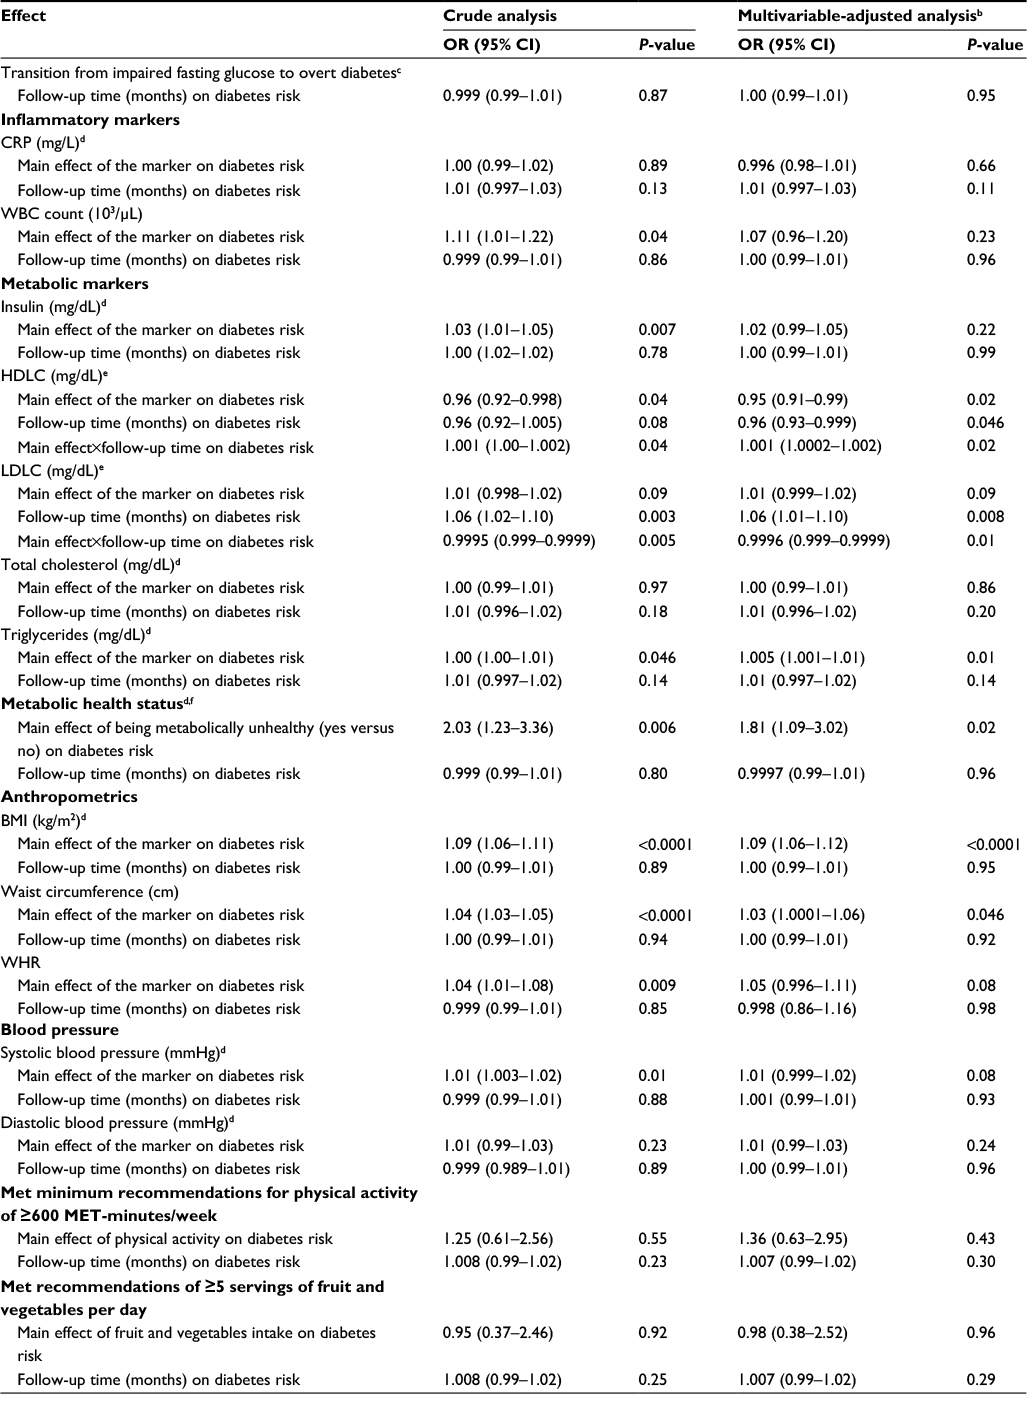 | Table 2 OR and 95% CIs reflecting the transition from impaired fasting glucose to diabetes, and the overall associations between each marker and longitudinal overt diabetes development during 129-month follow-up after the impaired fasting glucose diagnosisa Notes: aSeparate Generalized Estimating Equations models were used to test the transition from impaired fasting glucose to overt diabetes and the association between each marker (independent variable) and diabetes (dependent variable) over time. P<0.05 for the diabetes risk changes over time of the study for any marker. The estimate for the main effect of the marker represents the change in the OR of diabetes occurrence corresponding to a 1-unit increase in a marker at any follow-up time while holding all other predictors fixed. The estimate for the effect of metabolic health represents the change in the OR of diabetes occurrence corresponding to being metabolically unhealthy versus being metabolically healthy at any follow-up time, controlling for other predictors. The estimate for follow-up time on diabetes risk represents if there is a decline/increase over time in the risk of diabetes when all other predictors are fixed. The estimate for the main effect×follow-up time interaction represents effect modification of the diabetes status change by a marker; the change in diabetes status in the marker over each month of follow-up time, holding other predictors constant. bAdjusted for age, gender and time-varying BMI. cAn average of 9 repeated measures at every 3 to 6 months for an average of 27 months (range: 3–129 months) since baseline. dP>0.05 for the interactions between time and markers and the model did not include the interaction term due to P>0.05. eFurther adjusted for the interaction term between time and markers. fMetabolic health was defined as having less than 2 of the following metabolic abnormalities: systolic blood pressure ≥130 mmHg and/or diastolic blood pressure ≥85 mmHg or on antihypertensive medication; triglyceride ≥150 mg/dL; high-density lipoprotein cholesterol <40 mg/dL in men or <50 mg/dL in women. Abbreviations: BMI, body mass index; CRP, C-reactive protein; HDLC, high-density lipoprotein-cholesterol; LDLC, low-density lipoprotein-cholesterol; MET, metabolic equivalent; OR, odds ratio; WBC, white blood cell; WHR, waist-to-hip ratio. |
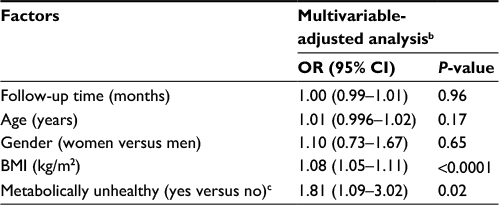 | Table 3 Multivariable-adjusted OR and 95% CIs reflecting the transition from impaired fasting glucose to diabetes, and the association between factors and longitudinal overt diabetes development during 129-month follow-up after the impaired fasting glucose diagnosisa Notes: aThe Generalized Estimating Equations model was used to test the transition from impaired fasting glucose to overt diabetes and the association between multiple factors and diabetes over time. The estimate for the effect of the factor (continuous variable) represents the change in the OR of diabetes occurrence corresponding to a 1-unit increase in a factor at any follow-up time while holding all other predictors fixed. bThe estimate for the effect of metabolic health represents the change in the OR of diabetes occurrence corresponding to being metabolically unhealthy compared with being metabolically healthy at any follow-up time, controlling for other predictors. The estimate for follow-up time on diabetes risk represents if there is a decline/increase over time in the risk of diabetes when all other predictors are fixed. The effect of the factor×follow-up time interaction terms was not significant in models. cAdjusted for age, gender, time-varying BMI, metabolic health. Waist-to-hip ratio was not adjusted for in this model due to its collinearity with BMI; homeostasis model assessment insulin resistance was not included in the model due to its calculation based on glucose and insulin. Metabolic health was defined as having less than 2 of the following metabolic abnormalities: systolic blood pressure ≥130 mmHg and/or diastolic blood pressure ≥85 mmHg or on antihypertensive medication; triglyceride ≥150 mg/dL; high-density lipoprotein cholesterol <40 mg/dL in men or <50 mg/dL in women. Abbreviations: BMI, body mass index; OR, odds ratio. |
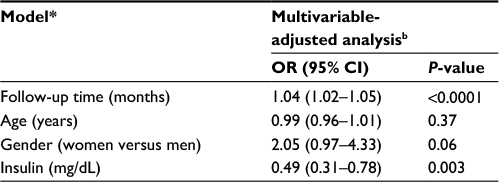 | Table 4 Multivariable-adjusted OR and 95% CIs reflecting the transition from impaired fasting glucose to normal level, and the association between factors and longitudinal reverting to normal blood glucose level during 129-month follow-up after the impaired fasting glucose diagnosisa Notes: aEighty-two subjects were reverting to normal level at the last visit from impaired fasting glucose since enrollment. The Generalized Estimating Equations model was used to test the transition from impaired fasting glucose to overt diabetes and the association between multiple factors and diabetes over time. The estimate for the effect of the factor (continuous variable) represents the change in the OR of diabetes occurrence corresponding to a 1-unit increase in a factor at any follow-up time while holding all other predictors fixed. The estimate for the effect of metabolic health represents the change in the OR of diabetes occurrence corresponding to being metabolically unhealthy compared with being metabolically healthy at any follow-up time, controlling for other predictors. The estimate for follow-up time on diabetes risk represents if there is a decline/increase over time in the risk of diabetes when all other predictors are fixed. The effect of the factor×follow-up time interaction terms was not significant in models. bThe final multivariable-adjusted models included significant variables except for age, gender and follow-up period. *The final multivariable-adjusted models only included significant variables except for age, gender and follow-up period. Abbreviation: OR, odds ratio. |
Figure 1 illustrates diabetes incidence increasing over time after adjusting for age, gender, metabolic health and time-varying BMI. Figure 2 visually depicts the shape of the relationship between follow-up time and diabetes risk after adjusting for potential confounding variables in a restricted cubic spline model. Follow-up months were inversely associated with the risk of diabetes, although the association was not significant (Ps for linear and nonlinear association >0.05).
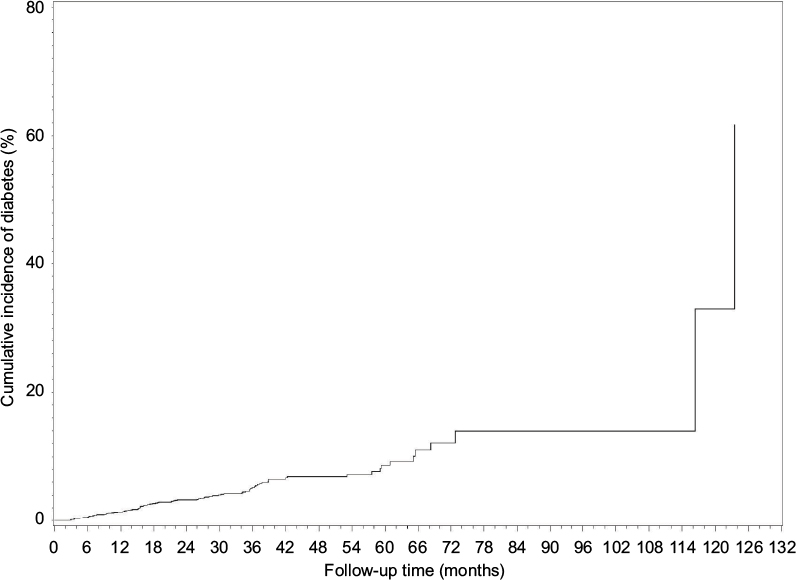 | Figure 1 The cumulative incidence of diabetes rate by follow-up time. Note: The model was adjusted for age, sex, metabolic health and time-varying body mass index. |
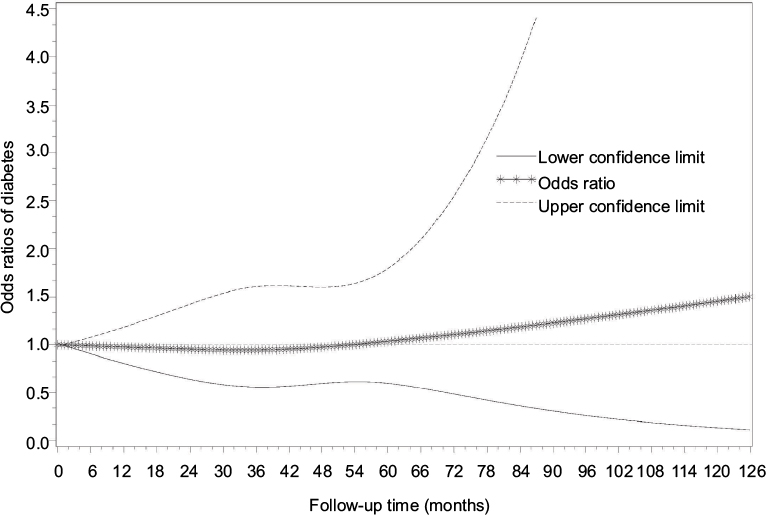 | Figure 2 Smoothed plot for ORs of the diabetes risk according to follow-up time. Notes: The ORs were estimated by using the restricted cubic-spline Generalized Estimating Equations logistic models with knots placed at the 5th, 50th, and 95th percentiles of follow-up months. The linear regression was not significant (P=0.82), and the nonlinear regression was not significant (P=0.76). The model was adjusted for age, sex, metabolic health and time-varying body mass index. Abbreviation: ORs, odds ratios. |
Table 5 shows the changes of markers accompanying transition from pre-diabetes to diabetes during the 129-month follow-up after the diagnosis of pre-diabetes. Statistically significant positive crude associations were found between diabetes and both log-transformed insulin levels, BMI and WC, but the association for insulin concentration became non-significant after adjusting for follow-up time, age, gender, metabolic health and BMI (P=0.07). At any follow-up time point, transition to diabetes in subjects increased BMI by 0.28 (SE: 0.13, P=0.04) kg/m2 and increased WC by 0.01 (SE: 0.004, P=0.004) cm as compared with subjects who did not (the reference group), while controlling for other covariates. Transition to diabetes was also associated with deterioration in metabolic health by 9% (OR: 1.09; 95% CI: 1.003–1.18) compared with those who did not transition. No statistically significant associations were observed for other markers in the crude and adjusted model.
 | Table 5 The changes of markers accompanying transition from impaired fasting glucose to overt type 2 diabetes during 129-month follow-up after the diagnosis of impaired fasting glucosea Notes: aSeparate linear mixed-effects models were used to test the associations between diabetes development (independent variable) and each marker (dependent variable) for an average of 9 repeated measures at every 3 to 6 months for an average of 27 months (range: 3–129 months) since baseline. The estimate for the main effect represents the difference in a marker with diabetes occurrence at any follow-up time, controlling for other predictors. The estimate for follow-up time represents the rate of a marker change; the difference in the marker per month of follow-up when all other predictors are fixed. For example, an estimate of 0.10 for the main effect represents an increase of 0.10 in a marker with diabetes occurrence at any follow-up time, controlling for other predictors. An estimate of 0.01 for follow-up time represents the increasing rate of 0.01 of a marker change; the increase of 0.01 in the marker per month of follow-up when all other predictors are fixed. bAdjusted for age, gender and time-varying BMI. Additionally adjusted for metabolic health for CRP, WBC, insulin, LDLC and TC. Adjusted for age, gender and metabolic health for BMI and WHR. cMarkers were natural log-transformed to achieve an approximately normal distribution. dP>0.05 for the interactions between time and markers and the model did not include the interaction term due to P>0.05. eAdjusted for age, gender and time-varying BMI. fThe Generalized Estimating Equations model was used to test the effect of transition from impaired fasting glucose to overt diabetes on metabolically unhealthy over time. The estimate for the effect of transition on metabolically unhealthy represents the change in the OR of diabetes occurrence corresponding to being metabolically unhealthy compared with being metabolically healthy at any follow-up time, controlling for other predictors. The estimate for follow-up time on metabolically unhealthy represents if there is a decline/increase over time in the risk for metabolically unhealthy when all other predictors are fixed. The effect of the factor×follow-up time interaction terms was not significant in models. Abbreviations: BMI, body mass index; CRP, C-reactive protein; DBP, diastolic blood pressure; HDLC, high-density lipoprotein cholesterol; LDLC, low-density lipoprotein cholesterol; OR, odds ratio; SBP, systolic blood pressure; TC, total cholesterol; TG, triglycerides; WBC, white blood cell; WC, waist circumference; WHR, waist-to-hip. |
Table 6 presents the factors affecting the longitudinal change of fasting plasma glucose level after the pre-diabetes diagnosis. Besides age, gender and follow-up time, other factors with significant univariate effect on glucose level were included in the final model. Older age, higher BMI and concentrations of insulin, HbA1c and triglycerides significantly contribute to the longitudinal increase in plasma fasting glucose concentrations after adjusting for follow-up time and gender. Similarly, older age, women (compared with men) and higher BMI and concentrations of insulin, fasting glucose, total cholesterol and DBP significantly contribute to the longitudinal increment of HbA1c level after adjusting for follow-up time (Table 7).
 | Table 6 Estimates for multiple factors associated with the longitudinal change of fasting plasma glucose level after the impaired fasting glucose diagnosis among 285 Mexican-Americans, 2004–2015, in Cameron County Hispanic Cohort Studya Notes: aLinear mixed-effects model was used to test the associations between fasting plasma glucose level (dependent variable) and factors affecting its change for an average of 9 repeated measures at every 3 to 6 months for an average of 27 months (range: 3–129 months) since baseline. Except age and gender, other factors with significant univariate effect on glucose level were included in the model. The estimate for the effect of each factor represents the difference in glucose level with 1-unit increase of each factor (continuous variables) at any follow-up time, controlling for other predictors. The estimate for the effect of gender represents the difference in glucose level with women versus men at any follow-up time, controlling for other predictors. The estimate for follow-up time represents the rate of glucose level change; the difference in the glucose level per month of follow-up when all other predictors are fixed. Glucose level was natural log-transformed to achieve an approximately normal distribution. |
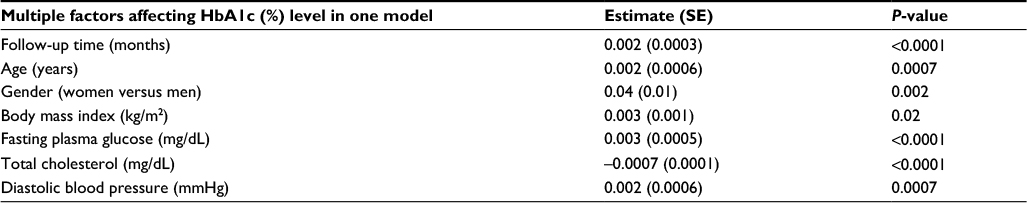 | Table 7 Estimates for multiple factors associated with the longitudinal change of plasma HbA1c level after first observation of transition to impaired fasting glucose among 285 Mexican-Americans, 2004–2015, in Cameron County Hispanic Cohort Studya Notes: aLinear mixed-effects model was used to test the associations between plasma HbA1c level (dependent variable) and factors affecting its change for an average of 9 repeated measures at every 3 to 6 months for an average of 27 months (range: 3–129 months) since baseline. Except age and gender, other factors with significant univariate effect on HbA1c level were included in the model. The estimate for the effect of each factor represents the difference in HbA1c level with 1-unit increase of each factor (continuous variables) at any follow-up time, controlling for other predictors. The estimate for the effect of gender represents the difference in HbA1c level with women versus men at any follow-up time, controlling for other predictors. The estimate for follow-up time represents the rate of HbA1c level change; the difference in the HbA1c level per month of follow-up when all other predictors are fixed. HbA1c level was natural log-transformed to achieve an approximately normal distribution. Abbreviation: HbA1c, glycated hemoglobin. |
Discussion
Our data show that the critical factors determining transition from pre-diabetes to diabetes in a high-risk Mexican-American cohort are poor metabolic health and increase in BMI. One-third of our DRS subjects were observed to transition from pre-diabetes to diabetes during an average period of 27 months (3 months to nearly 11 years), with incidence density of 12.4/100 person-years. Poor metabolic health was the major risk factor, with incidence density of 13.8/100 person-months and an increased risk of transition to diabetes of 81%. Increasing BMI over the same time period was also a factor in transition; by 8% for each 1 kg/m2 increase in BMI. These data give strong indications that the opportunity to impact diabetes is great in those with pre-diabetes through improving overall metabolic health and controlling or reducing BMI.
These observations are entirely consistent with our previous study of the association of obesity and metabolic health with diabetes.25 In that study, highest prevalence of diabetes was in those obese with significant metabolic abnormalities and the second highest prevalence in those not obese but with significant metabolic abnormalities. Although obesity alone is important, metabolic health is more so.25 Not surprisingly, diabetes incidence increased over time among subjects with pre-diabetes. Older age and increased BMI, elevated insulin levels, HbA1c and triglycerides significantly contribute to the longitudinal increase in plasma fasting glucose concentrations after adjusting for follow-up time and gender. Similarly, older age, women (compared with men) and increased BMI, elevated insulin levels, fasting glucose, total cholesterol and DBP significantly contribute to the longitudinal increment of HbA1c levels after adjusting for follow-up time.
To our knowledge, our study is the first to examine proximal changes accompanying the transition from pre-diabetes to diabetes among a population of Mexican-Americans with extreme prevalence of diabetes (27.8%).12 Our findings show that deteriorating metabolic health and increased BMI are the most important modifiable risk factors in transition to diabetes. Although these principles are generally accepted, they are not widely applied in these high-risk individuals. Our data emphasize the concept that strategies to improve metabolic health and maintain or regain normal weight are key in individuals with pre-diabetes and essential to controlling the pandemic of diabetes. These concepts are supported by the literature. A Korean cohort of 406 subjects with pre-diabetes was followed-up every 3–6 months for up to 9 years.27 They report a transition rate from pre-diabetes to diabetes of 20%,27 which was lower than the proportion of the cases over total number of the subjects (33.7%), but higher than the rate of 12.5/100 person-years in our study. The reason for the differences may include ethnicity, population structure, lifestyles and environment, different definitions of pre-diabetes and more importantly, different measurement methods. We used incidence density as the measurement of the rate of transition to avoid the effect of different follow-up periods of time on the rate, or introducing other bias. That study reported that surrogate markers (30-minute post-load glucose and C-peptide concentrations) reflecting β-cell dysfunction were more closely associated with diabetes transition than insulin resistance indices.27 However, all indices of β-cell dysfunction in that study were calculated by fasting glucose, which was included in the definition of diabetes and is, therefore, highly correlated with diabetes, introducing bias. In support of our findings, several studies have shown that the metabolic syndrome was a strong predictor of incident diabetes.28–31 However, Asians develop diabetes at considerably lower BMI than Western populations,32 so it cannot be assumed that diabetes is a single disease entity but more likely it is a complex including type 1 diabetes and a range of maturity-onset diabetes.33 Racial/ethnic disparities in diabetes prevalence have become most pronounced, and Mexican-Americans had highest rate compared with other ethnic groups.34
Our findings extend observations in the literature. Ford35 summarized the findings from 5 major studies that examined the risk of incident diabetes among subjects with the metabolic syndrome as defined by National Cholesterol Education Program (NCEP) and the World Health Organization and reported that random-effects estimate of relative risk was 3.08 (95% CI: 2.16–4.40, P for heterogeneity <0.001). One study by Stern et al28 showed that the metabolic syndrome as defined by the NCEP criteria can predict incident diabetes in the general population. The Strong Heart Study (SHS), which is a population-based longitudinal study, showed that the measures of baseline obesity help predict the transition to type 2 diabetes in non-diabetic American Indians in the future, compared with subjects with normal glucose tolerance at baseline.11
Being metabolically unhealthy is a pre-diabetes state and also a risk factor for the development of type 2 diabetes.36 Impaired insulin secretion with insulin deficiency with or without insulin resistance is the pathophysiological basis for the development of type 2 diabetes.36 The underlying disturbances for the pathophysiology of abnormal triglycerides in type 2 diabetes are hepatic overproduction and delay clearance of triglyceride-rich lipoproteins the synthesis and secretion of which is related to insulin resistance.37 Similarly, the potential mechanism to support that obesity is a predictor of the transition from pre-diabetes to diabetes may be related to the reduced insulin sensitivity in adipose tissues among individuals with impaired fasting glycemia.38 Hyperglycemia in the fasting state seems primarily to be caused by an inherent insulin secretory dysfunction followed by a decline in hepatic insulin sensitivity.39 Although not statistically significant, our findings also show that baseline HOMA-IR was higher in DRS subjects transitioned from pre-diabetes to diabetes than those without (3.99 versus 3.71) (Table 1), while triglycerides were statistically higher in DRS subjects transitioned from pre-diabetes to diabetes compared with those without the transition (multivariable-adjusted OR: 1.005; P=0.01) (Table 2). Besides, the etiology involved in the transition from pre-diabetes to diabetes includes environmental factors, physical inactivity, diet, smoking and genetic factors.38 Our study also found that more DRS subjects who did not transition from pre-diabetes to diabetes met minimum recommendations for moderate and vigorous physical activity of ≥600 MET-minutes/week compared with their counterparts at enrollment (33% versus 16%; P=0.03) (Table 1). The lack of association was likely because these factors are not significant determinants of developing diabetes from pre-diabetes. Alcohol and smoking are not generally identified as risk factors for diabetes and our study was no exception. The question of diet is more complex, but we utilize a standardized method of diet measurement and none of its components nor the instrument as a whole was associated with developing diabetes. Overall, the transition from pre-diabetes states to type 2 diabetes is characterized by a vicious cycle that includes severe deleterious effects on glucose metabolism: reduced hepatic insulin sensitivity, stationary β-cell dysfunction and/or chronic low β-cell mass, altered glucagon-like peptide-1 secretion and inappropriately elevated glucagon secretion.38
There are some limitations in our research. Some measurements, such as physical activity, were self-reported, which may affect its precision as a predictor. We could not completely rule out the possibility of residual confounding due to unmeasured or inadequately measured covariates.
This study had several strengths. First, this well-characterized cohort is derived from a general population-based randomly selected Mexican-American cohort, thus avoiding bias inherent in studies drawing from clinic populations or other non-randomly selected populations with established disease or mixed ethnicity. Second, the high-intensity, longitudinal study design gives strong power to explore the predictors related to the transition from pre-diabetes to diabetes, determine proximal changes accompanying the transition and finally to define a high-risk group for diabetes prevention. Third, the long-term follow-up data are very precious as every 3 to 6 months’ follow-up is time, cost and personnel consuming. Dynamic measures of glucose regulation also enhanced the prognostic value for progression to diabetes. Fourth, the transition rate from pre-diabetes to diabetes in our study was measured by incidence density or person-time incidence rate. This measure excludes the effect of how many years each person contributed to the study when they developed diabetes and much more accurate than prevalence. To our knowledge, this is the first study to use incidence density to calculate the transition rate from pre-diabetes to diabetes. Finally, we used fasting plasma glucose to diagnose pre-diabetes in our population-based study due to practicability, cost and reproducibility compared with other tests. Thus, our population-based study examined the transition from pre-diabetes to diabetes in a practical way.
In conclusion, compared with metabolically healthy pre-diabetes DRS subjects, metabolically unhealthy pre-diabetes DRS subjects had increased risk of transition to diabetes. Pre-diabetes DRS subjects with higher BMI were also significantly more likely to convert to diabetes. Being metabolically unhealthy or having higher BMI level accompanied the transition. Being metabolically unhealthy and higher BMI are modifiable harmful factors amenable to modification and reduction of risk in Mexican-Americans. Efforts should be primarily focused on improving metabolic health and weight control intervention.
Highlights
- Deteriorating metabolic health and/or increasing body mass index (BMI) significantly raises the risk of transitioning from pre-diabetes to diabetes among Mexican-Americans with pre-diabetes.
- Transition itself was accompanied by further increase in BMI and deterioration in metabolic health.
- These data underline the importance of improving metabolic health and avoiding weight gain in pre-diabetes as simple but clear diabetes prevention targets and emphasize the importance of lifestyle management.
Acknowledgments
This work was supported by MD000170 P20 funded from the National Center on Minority Health and Health Disparities, the Centers for Translational Science Award 1U54RR023417–01 from the National Center for Research Resources and the Centers for Disease Control Award RO1 DP000210–01 for Research Resources.
We thank our cohort team, particularly Rocio Uribe and her colleagues who recruited and documented the participants. We also thank the data management team, Marcela Morris and her laboratory team for their contributions, and Christina Villarreal and Norma Perez-Olazaran for administrative support. We thank the Valley Baptist Medical Center in Brownsville for housing our Clinical Research Unit in Brownsville. We also thank Dr. Reininger for the preparation of the questionnaires collecting physical activity and diet data.
Disclosure
The authors report no conflicts of interest in this work.
References
Danaei G, Finucane MM, Lu Y, et al. National, regional, and global trends in fasting plasma glucose and diabetes prevalence since 1980: systematic analysis of health examination surveys and epidemiological studies with 370 country-years and 2.7 million participants. Lancet. 2011;378(9785):31–40. | ||
Wild S, Roglic G, Green A, Sicree R, King H. Global prevalence of diabetes: estimates for the year 2000 and projections for 2030. Diabetes Care. 2004;27(5):1047–1053. | ||
Centers for Disease Control and Prevention. Preventing Chronic Disease: Preventing Diabetes and its Complications. U.S. Department of Health and Human Services; 2008 Aug. Available from: http://atfiles.org/files/pdf/CDC-HHS.pdf. Accessed November 06, 2017. | ||
IDF Diabetes Atlas – 7th Edition. Available from: http://www.diabetesatlas.org/. 2016. International Diabetes Federation. Accessed November 03, 2017. | ||
Buysschaert M, Bergman M. Definition of prediabetes. Med Clin North Am. 2011;95(2):289–297, vii. | ||
American Diabetes Association. Standards of medical care in diabetes– 2010. Diabetes Care. 2010;33(Suppl 1):S11–S61. | ||
Morris DH, Khunti K, Achana F, et al. Progression rates from HbA1c 6.0–6.4% and other prediabetes definitions to type 2 diabetes: a meta-analysis. Diabetologia. 2013;56(7):1489–1493. | ||
Huang Y, Cai X, Chen P, et al. Associations of prediabetes with all-cause and cardiovascular mortality: a meta-analysis. Ann Med. 2014;46(8):684–692. | ||
Huang Y, Cai X, Qiu M, et al. Prediabetes and the risk of cancer: a meta-analysis. Diabetologia. 2014;57(11):2261–2269. | ||
Baena-Diez JM, Penafiel J, Subirana I, et al. Risk of cause-specific death in individuals with diabetes: a competing risks analysis. Diabetes Care. 2016;39(11):1987–1995. | ||
Wang H, Shara NM, Calhoun D, Umans JG, Lee ET, Howard BV. Incidence rates and predictors of diabetes in those with prediabetes: the Strong Heart Study. Diabetes Metab Res Rev. 2010;26(5):378–385. | ||
Fisher-Hoch SP, Vatcheva KP, Rahbar MH, McCormick JB. Undiagnosed diabetes and pre-diabetes in health disparities. PLoS One. 2015;10(7):e0133135. | ||
Fisher-Hoch SP, Rentfro AR, Salinas JJ, et al. Socioeconomic status and prevalence of obesity and diabetes in a Mexican American community, Cameron County, Texas, 2004–2007. Prev Chronic Dis. 2010;7(3):A53. | ||
Fisher-Hoch SP, Vatcheva KP, Laing ST, et al. Missed opportunities for diagnosis and treatment of diabetes, hypertension, and hypercholesterolemia in a Mexican American population, Cameron County Hispanic Cohort, 2003–2008. Prev Chronic Dis. 2012;9:110298. | ||
Matthews DR, Hosker JP, Rudenski AS, Naylor BA, Treacher DF, Turner RC. Homeostasis model assessment: insulin resistance and beta-cell function from fasting plasma glucose and insulin concentrations in man. Diabetologia. 1985;28(7):412–419. | ||
Craig CL, Marshall AL, Sjostrom M, et al. International physical activity questionnaire: 12-country reliability and validity. Med Sci Sports Exerc. 2003;35(8):1381–1395. | ||
Gofin G, Shephard RJ. Godin leisure-time exercise questionnaire. Med Sci Sports Exerc. 2015;29:S36–S38. | ||
Reininger BM, Mitchell-Bennett L, Lee M, et al. Tu Salud, ¡Si Cuenta!: Exposure to a community-wide campaign and its associations with physical activity and fruit and vegetable consumption among individuals of Mexican descent. Soc Sci Med. 2015;143:98–106. | ||
USDHHS. 2008 Physical activity guidelines for Americans. USDHHS; 2008. Available from: http://www.health.gov/paguidelines/pdf/paguide.pdf. Accessed November 06, 2017. | ||
Reininger BM, Wang J, Fisher-Hoch SP, Boutte A, Vatcheva K, McCormick JB. Non-communicable diseases and preventive health behaviors: a comparison of Hispanics nationally and those living along the US-Mexico border. BMC Public Health. 2015;15:564. | ||
US Department of Agriculture. Choose My Plate, Food Groups. US Department of Agriculture; 2013. Available from: http://www.choosemyplate.gov/foodgroups/. Accessed November 06, 2017. | ||
US Department of Agriculture. Choose My Plate, Vegetables. US Department of Agriculture; 2013. Available from: http://www.choosemyplate.gov/foodgroups/vegetables.html. Accessed November 06, 2017. | ||
Grundy SM, Cleeman JI, Daniels SR, et al. Diagnosis and management of the metabolic syndrome: an American Heart Association/National Heart, Lung, and Blood Institute Scientific Statement. Circulation. 2005;112:2735–2752. | ||
Wildman RP, Muntner P, Reynolds K, et al. The obese without cardiometabolic risk factor clustering and the normal weight with cardiometabolic risk factor clustering: prevalence and correlates of 2 phenotypes among the US population (NHANES 1999–2004). Arch Intern Med. 2008;168(15):1617–1624. | ||
Wu S, Fisher-Hoch SP, Reninger B, Vatcheva K, McCormick JB. Metabolic health has greater impact on diabetes than simple overweight/obesity in Mexican Americans. J Diabetes Res. 2016;2016:4094876. | ||
Harrell FJ Jr. Regression modeling strategies: with applications to linear models, logistic regression, survival analysis. New York, NY: Springer-Verlag; 2001. | ||
Kim YA, Ku EJ, Khang AR, et al. Role of various indices derived from an oral glucose tolerance test in the prediction of conversion from prediabetes to type 2 diabetes. Diabetes Res Clin Pract. 2014;106(2):351–359. | ||
Stern MP, Williams K, Gonzalez-Villalpando C, Hunt KJ, Haffner SM. Does the metabolic syndrome improve identification of individuals at risk of type 2 diabetes and/or cardiovascular disease? Diabetes Care. 2004;27(11):2676–2681. | ||
Meigs JB, Williams K, Sullivan LM, et al. Using metabolic syndrome traits for efficient detection of impaired glucose tolerance. Diabetes Care. 2004;27(6):1417–1426. | ||
Hanley AJ, Festa A, D’Agostino RB Jr, et al. Metabolic and inflammation variable clusters and prediction of type 2 diabetes: factor analysis using directly measured insulin sensitivity. Diabetes. 2004;53(7):1773–1781. | ||
Laaksonen DE, Lakka HM, Niskanen LK, Kaplan GA, Salonen JT, Lakka TA. Metabolic syndrome and development of diabetes mellitus: application and validation of recently suggested definitions of the metabolic syndrome in a prospective cohort study. Am J Epidemiol. 2002;156(11):1070–1077. | ||
Ma RC, Chan JC. Type 2 diabetes in East Asians: similarities and differences with populations in Europe and the United States. Ann N Y Acad Sci. 2013;1281:64–91. | ||
Leslie RD, Palmer J, Schloot NC, Lernmark A. Diabetes at the crossroads: relevance of disease classification to pathophysiology and treatment. Diabetologia. 2016;59(1):13–20. | ||
Zhang Q, Wang Y, Huang ES. Changes in racial/ethnic disparities in the prevalence of Type 2 diabetes by obesity level among US adults. Ethn Health. 2009;14(5):439–457. | ||
Ford ES. Risks for all-cause mortality, cardiovascular disease, and diabetes associated with the metabolic syndrome: a summary of the evidence. Diabetes Care. 2005;28(7):1769–1778. | ||
Babu A, Fogelfeld L. Metabolic syndrome and prediabetes. Dis Mon. 2006;52(2–3):55–144. | ||
Taskinen MR, Boren J. New insights into the pathophysiology of dyslipidemia in type 2 diabetes. Atherosclerosis. 2015;239(2):483–495. | ||
Faerch K, Borch-Johnsen K, Holst JJ, Vaag A. Pathophysiology and etiology of impaired fasting glycemia and impaired glucose tolerance: does it matter for prevention and treatment of type 2 diabetes? Diabetologia. 2009;52(9):1714–1723. | ||
Faerch K, Vaag A, Holst JJ, Hansen T, Jørgensen T, Borch-Johnsen K. Natural history of insulin sensitivity and insulin secretion in the progression from normal glucose tolerance to impaired fasting glycemia and impaired glucose tolerance: the Inter99 study. Diabetes Care. 2009;32(3):439–444. |
 © 2017 The Author(s). This work is published and licensed by Dove Medical Press Limited. The full terms of this license are available at https://www.dovepress.com/terms.php and incorporate the Creative Commons Attribution - Non Commercial (unported, v3.0) License.
By accessing the work you hereby accept the Terms. Non-commercial uses of the work are permitted without any further permission from Dove Medical Press Limited, provided the work is properly attributed. For permission for commercial use of this work, please see paragraphs 4.2 and 5 of our Terms.
© 2017 The Author(s). This work is published and licensed by Dove Medical Press Limited. The full terms of this license are available at https://www.dovepress.com/terms.php and incorporate the Creative Commons Attribution - Non Commercial (unported, v3.0) License.
By accessing the work you hereby accept the Terms. Non-commercial uses of the work are permitted without any further permission from Dove Medical Press Limited, provided the work is properly attributed. For permission for commercial use of this work, please see paragraphs 4.2 and 5 of our Terms.