")
Back to Journals » Journal of Inflammation Research » Volume 15
Transcriptional Landscape of Enhancer RNAs in Peripheral Blood Mononuclear Cells from Patients with Systemic Lupus Erythematosus
Authors Guo G, Wang H, Tong X, Ye L, Shi X, Fang S, Hu Y, Han F , Chen C, Ding N, Su B, Xue X, Zhang H
Received 30 July 2021
Accepted for publication 11 January 2022
Published 4 February 2022 Volume 2022:15 Pages 775—791
DOI https://doi.org/10.2147/JIR.S331188
Checked for plagiarism Yes
Review by Single anonymous peer review
Peer reviewer comments 2
Editor who approved publication: Professor Ning Quan
Gangqiang Guo,1,* Huijing Wang,2,* Xinya Tong,1,* Lele Ye,1 Xinyu Shi,1 Su Fang,1 Ya Hu,3 Fei Han,2 Chaosheng Chen,3 Ning Ding,1 Bofeng Su,3 Xiangyang Xue,1 Huidi Zhang3
1Wenzhou Collaborative Innovation Center of Gastrointestinal Cancer in Basic Research & Precision Medicine, Wenzhou Key Laboratory of Cancer-Related Pathogens & Immunity, Department of Microbiology and Immunology, Institute of Molecular Virology and Immunology, Institute of Tropical Medicine, School of Basic Medical Sciences, Wenzhou Medical University, Wenzhou, 325035, People’s Republic of China; 2Kidney Disease Center, The First Affiliated Hospital, Zhejiang University School of Medicine, Hangzhou, 310058, People’s Republic of China; 3Department of Nephrology, First Affiliated Hospital, Wenzhou Medical University, Wenzhou, 325000, People’s Republic of China
*These authors contributed equally to this work
Correspondence: Bofeng Su; Huidi Zhang
Department of Nephrology, First Affiliated Hospital, Wenzhou Medical University, Wenzhou, 325000, People’s Republic of China
, Email [email protected]; [email protected]
Objective: Enhancer RNAs (eRNAs), a class of non-coding RNAs, play indispensable roles in regulating target gene transcription and maintaining cell identity in cooperation with promoters. In this study, we investigated the transcriptional landscape and potential functions of eRNAs in peripheral blood mononuclear cells (PBMCs) from patients with systemic lupus erythematosus (SLE).
Methods: PBMCs from five patients with stable SLE, five patients with active SLE, and ten healthy individuals (HCs) were subjected to RNA-sequencing. Putative regulators, differential expression, and pathways were analyzed. eRNAs that were significantly upregulated were first validated by RT-qPCR in 12 samples. Then, candidate eRNAs were confirmed in a validation cohort of 45 samples. We conducted comprehensive pathway analyses to explore the correlations between the candidate eRNAs and SLE pathology.
Results: By analyzing eRNA transcript data from PBMCs from SLE patients and HCs, we identified various eRNAs and functional super-enhancers potentially related with SLE. The SLE-specificity of eRNAs seemed to be largely driven by SLE-specific transcription factors (TFs). A Venn diagram of eRNAs differentially expressed in stable, active, and total SLE vs HCs revealed that 13 and 23 eRNAs were commonly upregulated and downregulated, respectively, in patients with stable SLE and those with active SLE. The commonly upregulated eRNAs participate in regulating SLE-related pathways. Only eRNA TCONS_00034326 was significantly (P < 0.05) upregulated in PBMCs of patients with SLE when compared with those of HCs as indicated by RT-qPCR. The area under the receiver-operating curve of TCONS_00034326 for distinguishing SLE patients from HCs was 0.691. Through its putative SLE-related master TF, TCONS_00034326 is involved in multiple SLE-relevant signaling pathways, especially tumor necrosis factor signaling.
Conclusion: This study unraveled the transcriptional landscape of eRNAs, eRNA-related TFs, and super-enhancers in PBMCs from SLE patients and HCs. We identified a panel of SLE-relevant eRNAs, providing potential targets in SLE pathogenesis.
Keywords: enhancer RNA, eRNA, systemic lupus erythematosus, SLE, PBMCs, transcription factors, TFs, super-enhancer
Introduction
Systemic lupus erythematosus (SLE) is a multisystem autoimmune disease characterized by loss of immune tolerance, immune cell activation, and pathogenic autoantibody production.1 The pathology of SLE, which is a highly clinically heterogeneous disease, remains largely unclear, but involves the dysregulation of multiple immune cell lineages and genes. Epigenetic alterations in peripheral blood immune cells, including T cells and B cells, have been implicated in the pathogenesis of SLE.2 Epigenomic disease-related gene regulation in peripheral blood mononuclear cells (PBMCs) has been found to contribute to abnormal inflammatory cytokine production during the course of the disease.3 In particular, non-coding (nc)RNAs are involved in immune cell responses and their potential role in SLE has gained increased attention.4 We previously reported that microRNAs,5 circular RNAs,6 and long ncRNAs7 in PBMCs play significant roles in SLE pathogenesis and serve as potential biomarkers.
Recently, it has been reported that enhancers and super-enhancers (SEs) participate in transcriptional control and play roles in maintaining cell identity and homeostasis in all cell types, and may be involved in increased autoimmune disease risk and disease development through spatiotemporal regulation of gene transcription.8–10 Enhancer (e)RNAs, which are a type of ncRNA, are transcribed from enhancers, which are cis-regulatory elements in the genome.11 Some studies have examined eRNAs from monocytes of SLE patients, and discussed the roles of SEs and eRNAs in the pathogenesis of autoimmune diseases, including SLE.7,12 Intriguingly, eRNAs have been identified as one of the most plausible candidates in the regulation of functional interactions between enhancers and promoters.13 Growing evidence suggests that at least some eRNAs play critical roles in enhancer functions by recruiting transcription factors (TFs) to specific enhancers, promoting the establishment of enhancer–promoter looping.13 Based on the intensity of TF binding, a distinct subset of enhancers have been termed SEs,14 which are more powerful in regulating gene expression than regular enhancers. Various studies have demonstrated the critical roles of eRNAs in target gene transcription.10,15,16 A recent study showed that eRNAs exert key roles in cancer pathogenesis and are potential therapeutic targets worthy of further investigation.11 However, the relationships between eRNAs, associated SEs, and TFs and SLE pathogenesis in PBMCs have not been explored. Given the prominent functions of eRNAs and SEs in both physiological and pathological conditions, we hypothesized that eRNAs may contribute to SLE and investigated the hypothesis based on epigenomic profiling.
In this study, we used RNA-sequencing (RNA-seq) data from 20 PBMC samples of 10 SLE patients and 10 healthy controls (HCs) to characterize the expression landscape of eRNAs and associated SEs. The putative functions of the eRNAs identified were investigated using the Functional Annotation of the Mammalian Genome (FANTOM) project,17 Roadmap Epigenomics project,18 and DENdb19 databases, which comprise annotations of numerous regulatory elements, including enhancers. We identified eRNA expression associated with the inflammatory environment in SLE. Additionally, we validated the differentially expressed eRNAs in SLE patients compared with HCs and we discussed the putative functions of the eRNAs in SLE.
Methods
Subjects and Study Design
RNA-seq data from PBMCs from 10 female SLE patients stratified by their disease activity characteristics and 10 female HCs, generated in our previous study,6 were used to profile and analyze eRNA expression in this study. Based on the SLE disease activity index (SLEDAI), patients were classified into a stable disease group (SLEDAI < 5, SSG) and an active disease group (SLEDAI ≥ 5, SAG). For validation, 31 SLE patients and 26 age- and sex-matched HCs without arthralgia, heart failure, renal failure, or autoimmune disease, and free from other inflammatory conditions, were recruited in this study. The research protocol was approved by the Medical Ethical Committees of the First Affiliated Hospital of Wenzhou Medical University. All subjects participating in this study provided written informed consent.
PBMC and RNA Isolation and Next-Generation Sequencing
Full protocol details were reported in our previous study.6 In brief, sequencing libraries were prepared using a NEBNext® Ultra™ Directional RNA Library Prep Kit for Illumina® (NEB, USA) according to the manufacturer’s protocol. Ribosomal (r)RNA was removed from the total RNA using Ribo-Zero™ rRNA Removal kit (Human/Mouse/Rat) (Illumina, San Diego, CA, USA). The libraries were sequenced on an Illumina HiSeq instrument (Illumina), generating 150-bp pair-end reads.
Identification and Quantification of eRNAs
Clean RNA-seq reads were mapped using the Hisat2 software (http://ccb.jhu.edu/software/hisat2).20 Samples with a mapping rate of >80% and a proportion of multiple mapped reads of <20% were considered to be reliable and usable for subsequent analyses. The StringTie software was used to assemble the reads into transcripts and to quantify them based on genome alignment.21 Determining the eRNA transcription region, ie, the enhancer region, is essential for eRNA identification. We identified eRNAs by integrating various previously reported strategies for eRNA identification.9,11,22 The entire process comprised five major steps. (1) Collection of enhancer annotation data. In this study, three databases that use multi-omics methods to infer enhancer regions, ie, FANTOM 5, Roadmap Epigenomics, and DENdb, were used to determine enhancer regions and eRNA transcription regions.11,17,19 A dataset of putative enhancer regions in human PBMCs was constructed based on the human hg19 reference genome by cross-comparisons in the three databases. (2) Filtering of the enhancer annotation data. Putative enhancer regions were compared with annotated genes in the hg19 reference genome, and enhancer regions overlapping with known genes (including upstream 1-kb and downstream 1-kb regions) were filtered out to prevent noise generated by eRNAs from enhancers too close to promoters. The remaining enhancer regions (with >99% sequence similarity to the original sequence) were defined as hg19 genome eRNA transcription regions11 and were used for subsequent analyses. (3) Transcript assembly and merging. Transcript assemblies from each sample were merged using the Cuffmerge software. (4) eRNA transcript filtering. The Cuffcompare software was used to compare and analyze the assembled transcripts and eRNA transcription regions. Transcripts overlapping with eRNA transcription regions and falling in the antisense strand of the eRNA transcription region were obtained. Next, transcripts that crossed into the coding region and its 1-kb flanking regions due to assembled transcripts being too long were excluded. Thus, candidate eRNA transcripts were obtained. (5) Single-exon screening. Finally, transcripts containing exons were screened out as eRNAs rarely undergo splicing. Based on the eRNA transcript data, corresponding enhancer positions were annotated. A human PBMC eRNA.gtf file containing locus data, enhancer annotation data, and exon data of each eRNA transcript was generated (Supplementary File, Table S1) and was used for subsequent eRNA quantification and differential expression analysis. eRNA expression levels in human PBMCs were calculated as the mean expression value as fragments per kilobase of transcript sequence per millions base pairs sequenced reads per million (FPKM). The Cuffdiff software was used to analyze differential expression, using threshold values of P < 0.05 and fold change >2.23
Identification of TFs and SEs
Enhancers regulate target gene transcription by binding TFs, transcriptional initiation cofactors, RNA polymerase II, and other proteins involved. Recent studies on eRNAs have shown that TFs are also involved in the regulation of eRNA transcription. Through correlation analysis of the transcription status of eRNAs and related TFs, the correlations between TFs and eRNAs, enhancers, and specific cell types can be investigated.11,24 Human TF genes were downloaded from the AnimalTFDB.25,26 Pearson correlation coefficients of single eRNAs and TFs were calculated to obtain a set of TFs co-expressed with eRNAs. Based on the table of critical values for Pearson correlation and the degrees of freedom determined by the number of samples27 (https://conjointly.com/kb/correlation-statistic/), a 0.05 cutoff level for significance for Pearson correlation was selected. Key TFs were selected based on the proportion of eRNAs co-expressed with TFs to all eRNAs. Based on the correlations between eRNAs and TFs, TFs showing a significant correlation with >10% of eRNAs were identified as key TFs. The FIMO software in the MEME suite (http://meme-suite.org/doc/fimo.html?man_type=web) was used to obtain human TF motif data from the Jaspar database (http://jaspar.genereg.net/), and TF-binding sites/motifs were predicted based on the enhancer loci data corresponding to the eRNAs obtained from the analysis.28,29
SEs are cis-regulatory elements with determinative regulatory effects on cell fate. The ROSE algorithm, a tool for SE identification developed by the Young Lab at MIT (http://younglab.wi.mit.edu/super_enhancer_code.html), uses the quantitative.bam file from chromatin immunoprecipitation (ChIP)-seq data to determine the peak size of binding between TFs or cofactors and a 12.5-kb locus. Through ranking and background calculations, putative SE regions exceeding the background cutoff value are determined.14,30 A recent study combined eRNA expression levels and the ROSE algorithm to predict SEs.31 Therefore, these methods were combined for de novo SE prediction. The SEs identified were annotated using the SEdb and dbSuper databases.
Bioinformatics Analysis of eRNA Targets
eRNAs participate in the regulation of enhancer activation of adjacent target genes and the transcription of nearby target genes in a cis-regulatory manner through their transcriptional behavior. In addition, they can regulate distant target genes in trans by binding with trans-acting elements.9 eRNA expression levels are positively correlated with the activity of their enhancers and thus, correlations between eRNA expression levels and gene expression levels can be used to predict target genes of enhancers.15 Therefore, we predicted target genes of eRNAs based on co-location and co-expression.
As for co-location analysis, enhancers can regulate the transcription and expression of upstream and downstream genes from a distance, and the effective distance based on enhancer activity is generally <1 Mb. Therefore, we set the co-location threshold to 1 Mb up- and downstream of the eRNA, and genes within 1 Mb upstream and downstream were searched based on the location of the eRNA. For eRNA co-location analysis, the most recent version of the BEDTools software was used, with the parameters -D b -a eRNA.bed -b coding-gene.bed. -D b indicates that the distance is based on coding genes; a negative number indicates that the eRNA is downstream of the gene, and a positive number indicates that it is upstream.
Co-expression analysis is based on the principle that if an eRNA has a regulatory relationship with a target gene, their expression levels in different samples and groups should be highly correlated. We used the Python SciPy package to determine correlations between eRNAs and genes by calculating Pearson correlation coefficients, based on which target genes were predicted. The table of critical values for Pearson correlation was used for confirmation, with degrees of freedom = number of samples – 2.27
Next, we performed functional enrichment analysis of the target genes of differential eRNAs to predict the biological functions of the eRNAs. Gene Ontology (GO), Kyoto Encyclopedia of Genes and Genomes (KEGG), and Reactome functional enrichment analyses were performed on co-located and co-expressed target genes of up- and downregulated eRNAs using the over-representation analysis method in the clusterProfiler package. Additionally, the putative functions of target genes and master TFs of candidate eRNAs were analyzed using the KEGG Orthology Based Annotation System (KOBAS) web software version 3.0 (http://kobas.cbi.pku.edu.cn/kobas3) based on pathway enrichment analysis and DAVID Bioinformatics Resources 6.8 (https://david.ncifcrf.gov/tools.jsp), respectively. Padj < 0.05 or P < 0.05 was regarded significant enrichment.
Quantitative Reverse Transcription PCR (RT-qPCR) Validation of the eRNA Expression Data
Detailed protocols are provided in our previous report.6 RT-qPCRs were run on a qTOWER 2.2 Real-Time PCR system (Analytik Jena, Jena, Germany) using reaction mixtures containing 1 μL of diluted cDNA and 5 μL of 2× SYBR® Green Supermix (DBI, Ludwigshafen, Germany). The thermal cycling conditions were as follows: 95 °C for 3 min followed by 39 cycles of 95 °C for 10s and 60 °C for 30s. Relative eRNA levels in PBMCs were calculated using the following equation: amount of target = 2−ΔCt, where delta Ct = Ct eRNAs – Ct GAPDH. The sequences of the eRNA-specific primers used are provided in Supplementary File, Table S2. Each biological replicate was analyzed in triplicate.
Statistical Analysis
Statistical analysis was conducted using the SPSS 22.0 software (SPSS, Inc., Chicago, IL, USA). Means of two groups were compared using the independent-samples t-test or Mann–Whitney U-test, as relevant. A two-sided P-value < 0.05 was considered statistically significant. The Wilcoxon test was used for differential eRNA expression analysis. Receiver operating characteristic (ROC) curve analysis of PBMC eRNA expression was conducted using MedCalc® Statistical Software version 19.6.1 (MedCalc Software Ltd., Ostend, Belgium; https://www.medcalc.org; 2020).
Results
eRNA Profiling of PBMCs from SLE Patients and HCs
A flow chart of the transcriptome-wide eRNA profiling analysis is shown in Figure 1. In total, 32,308 eRNA transcripts, comprising 16,594 (51.36%) sense strands and 15,714 (48.64%) antisense strands, were identified in the 20 samples (10 SLE patients and 10 HCs) by eRNA identification using the FANTOM, Roadmap Epigenomics, and DENdb databases (Supplementary File, Table S1). The SLE cohort comprised 10 patients, 5 of whom had stable disease (SSG) and five of whom had active disease (SAG). Analysis of the distribution of eRNA transcripts in the HC, SSG, and SAG groups revealed that eRNAs were transcribed from all chromosomes (Figure 2A and B and Supplementary File, Figure S1A). The median number of eRNAs identified was 14,022 in HC PBMCs, 13,065 in SSG PBMCs, and 11,706 in SAG PBMCs, with no significant difference between the HC group and the SSG and SAG groups, nor between the SSG and SAG groups (Figure 2C). Analysis of the eRNA length distribution revealed that the majority of eRNAs in the HC, SSG, and SAG groups were 200–800 nt (Supplementary File, Figure S1B). The mean eRNA transcript expression levels (in FPKM) in HCs were lower than those in the two SLE groups, especially in the SAG group (P < 0.05) (Figure 2B and D). Mean eRNA transcript expression levels did not significantly differ between the SSG and SAG group (Figure 2D). Next, we classified all eRNAs identified into three groups based on their expression: 5873 ubiquitous eRNAs were expressed in >80% (16/20) of the samples, 22,233 median-ubiquitous eRNAs were expressed in at least two samples, and 2908 special eRNAs were expressed in only one sample (Figure 2E, Supplementary File, Table S3). Special eRNAs accounted for only 9% of the eRNAs detected in PBMCs from the SLE and HC groups, and for 91% of the eRNAs in at least two samples.
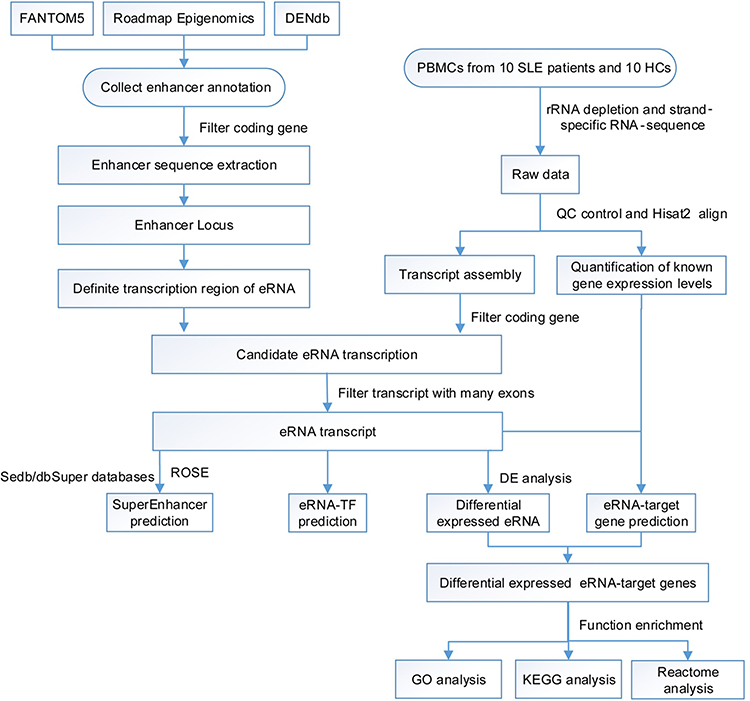 |
Figure 1 Flow chart of eRNA identification. |
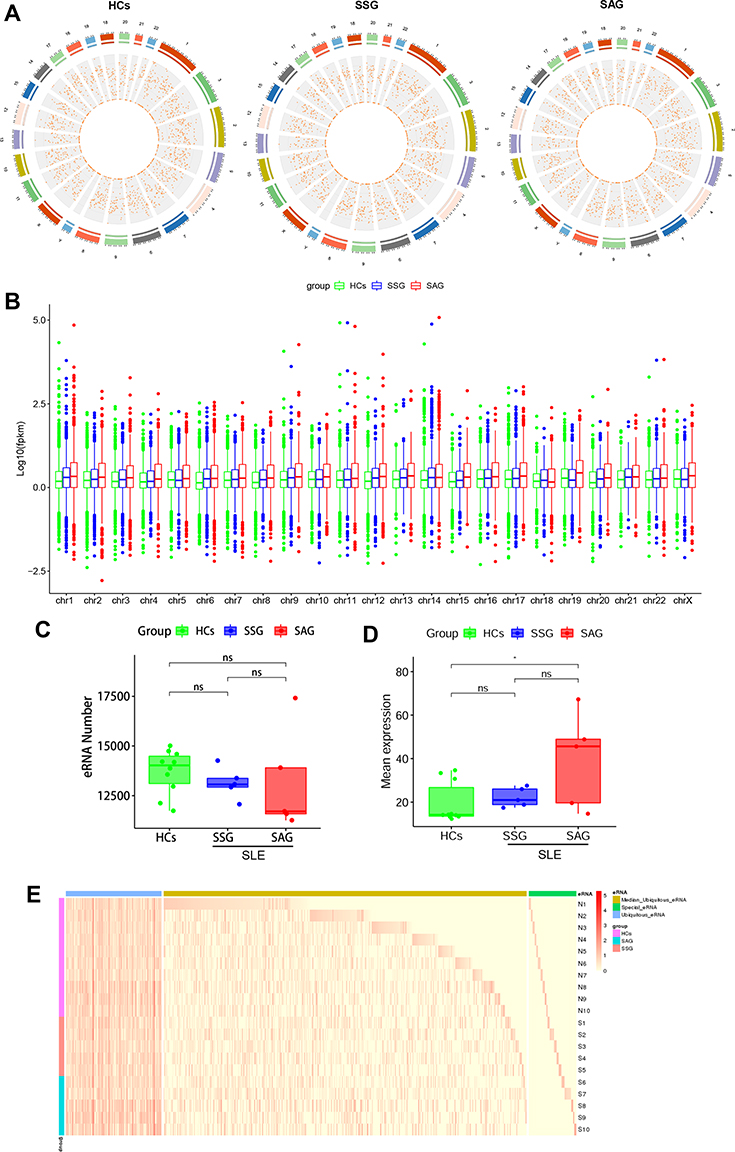 |
Figure 2 Expression landscape of eRNAs in PBMCs from healthy controls (HCs) and patients with systemic lupus erythematosus (SLE). (A) Distribution of eRNAs in the chromosomes of HCs, active SLE patients (SAG group), and stable SLE patients (SSG group). The outer circle is a chromosome positional map, and the numbers outside the circle indicate the chromosome numbers. Different colors are used to distinguish different chromosomes. Tick marks indicate chromosome coordinates. Unit are in millions. The inner circle indicates the circular RNA density of each coordinate interval in the chromosomes. Data are shown as a scatter plot, with each point representing a coordinate interval in the chromosome, and values decrease from the outside to the inside. (B) Mean eRNA expression in chromosomes of the HC, SAG, and SSG groups. The lower and upper hinges correspond to the 25th and 75th percentiles. The upper whisker extends from the hinge to the largest value no further than 1.5 * IQR from the hinge. The lower whisker extends from the hinge to the smallest value at most 1.5 * IQR of the hinge (where IQR is the inter-quartile range, or distance between the first and third quartiles). Outliers are plotted individually. (C) Numbers of eRNAs in the HC, SAG, and SSG groups. Each dot represents an individual sample. (D) Total mean eRNA expression in the HC, SSG, and SAG groups. Each dot represents an individual sample. *P < 0.05; ns, no statistical significance. (E) Expression profile of eRNA in human PBMCs. Blue, yellow, and green bars indicate ubiquitous, semi-ubiquitous, and unique eRNAs, respectively. Purple, red, and blue-green bars denote the HC, SAG, and SSG groups, respectively. The red color gradient represents the eRNA expression level (in FPKM). Abbreviation: ns, no statistical significance. |
SE Profiling of PBMCs from SLE Patients and HCs
SEs, an emerging and distinct class of enhancers, have broader and more profound effects in pathological and physiological conditions than regular enhancers,32 and they drive master genes crucial for cell identity. Therefore, we explored the landscape of SEs in PBMCs from SLE patients and HCs. In total, 7068 functional SEs (Supplementary File, Table S4) were detected in the total samples. In Supplementary File, Figure S2A, they are ranked according to their expression levels in SSG and SAG patients and HCs. We annotated the identified functional SEs using the SEdb and dbSuper databases (Supplementary File, Table S5). Intriguingly, each SE was generally associated with one to several eRNAs, whereas each eRNA was related to only one SE (Supplementary File, Table S5). For example, one SE was associated with four eRNAs, including TCONS_00378828, TCONS_00392560, TCONS_00378829, and TCONS_00378832, whereas TCONS_00034326 was related to only one SE (chr1:89238617–89240917). Analysis of the length distribution of the SEs revealed that the majority of SEs in the HC, SSG, and SAG groups were 2000–9000 nt, and the number of SEs was higher in HCs than in the two SLE groups (Supplementary File, Figure S2B). We classified the SEs identified into three groups: 16 ubiquitous SEs were expressed in >80% (16/20) of the samples, 4387 semi-ubiquitous SEs were expressed in at least two samples, and 2665 unique SEs were expressed in only one sample (Supplementary File, Figure S2C, Table S4). In contrast to the findings for eRNAs, ubiquitous SEs accounted for only 0.2% of the SEs detected in PBMCs from SLE patients and HCs, and for 38% of SEs in only one sample. Intriguingly, the number of SE transcripts was lower in both SLE groups than in HCs, especially in the SAG group (P < 0.05), whereas there was not significant difference between the SSG and SAG groups (Supplementary File, Figure S2D). The majority of SEs were associated with 1–10 eRNA(s), and the number of SEs associated with different eRNAs decreased with increasing disease activity (Supplementary File, Figure S2E).
Analysis of SLE-Related Master TFs of eRNAs
SEs consist of multiple enhancer-like elements that are densely occupied by master TFs.14 TFs play an important role in mediating eRNA biogenesis;9 however, SLE-related TFs of eRNAs have not been fully unraveled. We collected SLE-related TFs from the AnimalTFDB25,26 and evaluated Pearson correlations between individual TF and eRNA expression levels in the SLE PBMC samples. Putative master regulators were defined as those significantly correlated with ≥10% of individual eRNAs. Based on computational predictions, we found 281 SLE-related putative master TFs, including several well-known regulators, such as JUNB, JUN, and STAT5 (Figure 3A, Supplementary File, Table S6). JUNB is lowly expressed in SLE and induces interleukin-6 secretion,33 suggesting its potential importance in eRNA regulation in SLE.
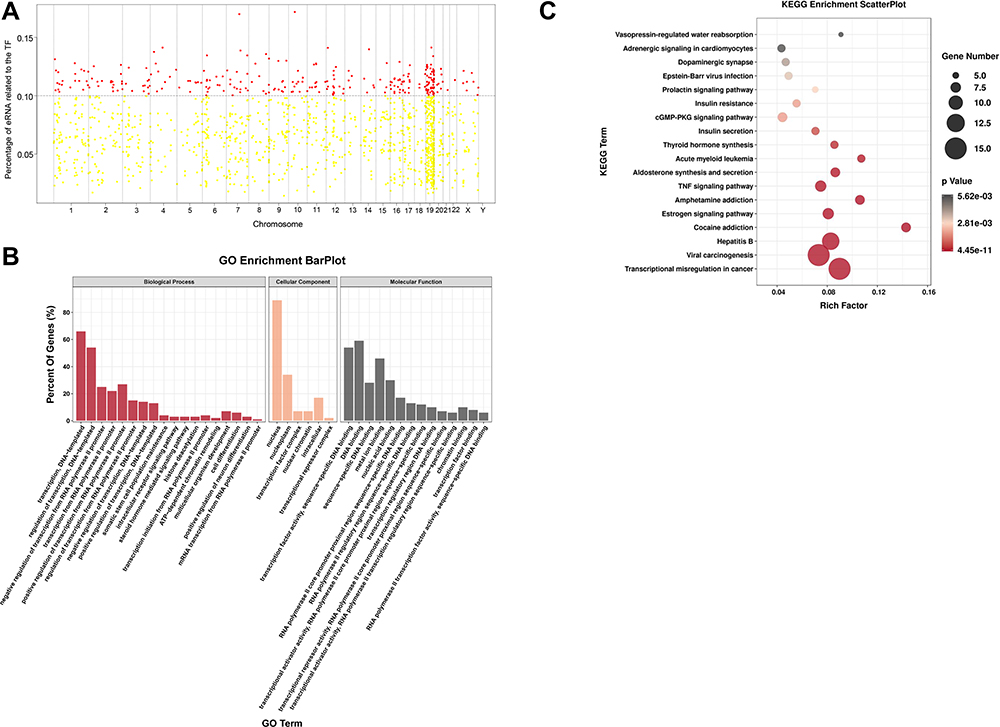 |
Figure 3 Putative regulation of eRNA biogenesis in SLE PBMCs. (A) Putative regulators of eRNAs in SLE PBMCs. Each dot represents one transcription factor (TF). Red dots denote putative master TFs significantly correlated to ≥10% of individual eRNAs. The X-axis indicates the chromosomes and the y-axis the percentage of eRNAs correlated to each TF. (B) Gene Ontology (GO) analysis of putative SLE-related master TFs. Biological processes are indicated in red, cellular components in Orange, and molecular functions in black. (C) KEGG pathway analysis of putative SLE-related master TFs. The Y-axis indicates pathway names and the X-axis the richness factor. |
Next, we performed GO analyses of the identified TFs. In the biological process category, TFs were mostly enriched in transcriptional processes, in the CC category, they were mostly linked to the nucleus and TF complex, and in the molecular function category, they were mostly associated with nucleic-acid-related molecular binding functions (Figure 3B, Supplementary File, Table S6). KEGG analyses revealed that the TFs, including CREB3, JUN, and JUNB, were significantly enriched in the cGMP-PKG and tumor necrosis factor (TNF) signaling pathways (Figure 3C, Supplementary File, Table S6). KEGG pathway analysis results obtained using DAVID are detailed in Supplementary File, Table S6. The master regulators were generally enriched in functions related to SLE-related pathways, which provides a potential explanation for the high mean expression levels of eRNAs observed in the SLE groups.
Enhancers activate their target genes by binding TFs, transcriptional initiation cofactors, and related proteins. TFs have a domain that binds to a specific DNA sequence, and the sequence on the corresponding enhancer is known as the TF-binding site or conserved domain (motif). By predicting the motifs in a TF binding an enhancer, the binding sites between specific TFs and the enhancer locus and their probabilities can be inferred, allowing prediction of their regulatory relationship in the cell. Putative enhancer motifs in SLE-related master TFs (q < 0.05) were predicted and are listed in Supplementary File, Table S7.
Differentially Expressed eRNAs in PBMCs from SLE Patients and HCs
To find key eRNA biomarkers of SLE, we determined eRNAs differentially expressed in the SSG vs HC, SAG vs HC, and SLE (SSG and SAG) vs HC groups. We found 66 up- and 45 downregulated eRNAs in SLE vs HCs (Figure 4A and B, Supplementary File, Figure S3A and B). There were 109 up- and 149 downregulated eRNAs in SSG vs HCs (Figure 4A and B, Supplementary File, Figure S2C and D), and 105 up- and 69 down-regulated eRNAs in SAG vs HCs (Figure 4A and B, Supplementary File, Figure S3E and F). Based on the intersections in a Venn diagram of the differentially expressed eRNAs from comparisons of the HC vs the SLE, SAG, and SSG groups, we were able to narrow down the upregulated candidate SLE-related eRNAs to 13 and the downregulated candidate SLE-related eRNAs to 23 (Figure 4A and B). Clustering heatmaps of these eRNAs are shown in Figure 4C and D. Importantly, 10 of the 13 upregulated candidate SLE-related eRNAs and 17 of the 23 downregulated candidate SLE-related eRNAs were associated with functional SEs, which suggests that these candidate eRNAs have key roles in SLE pathogenesis.
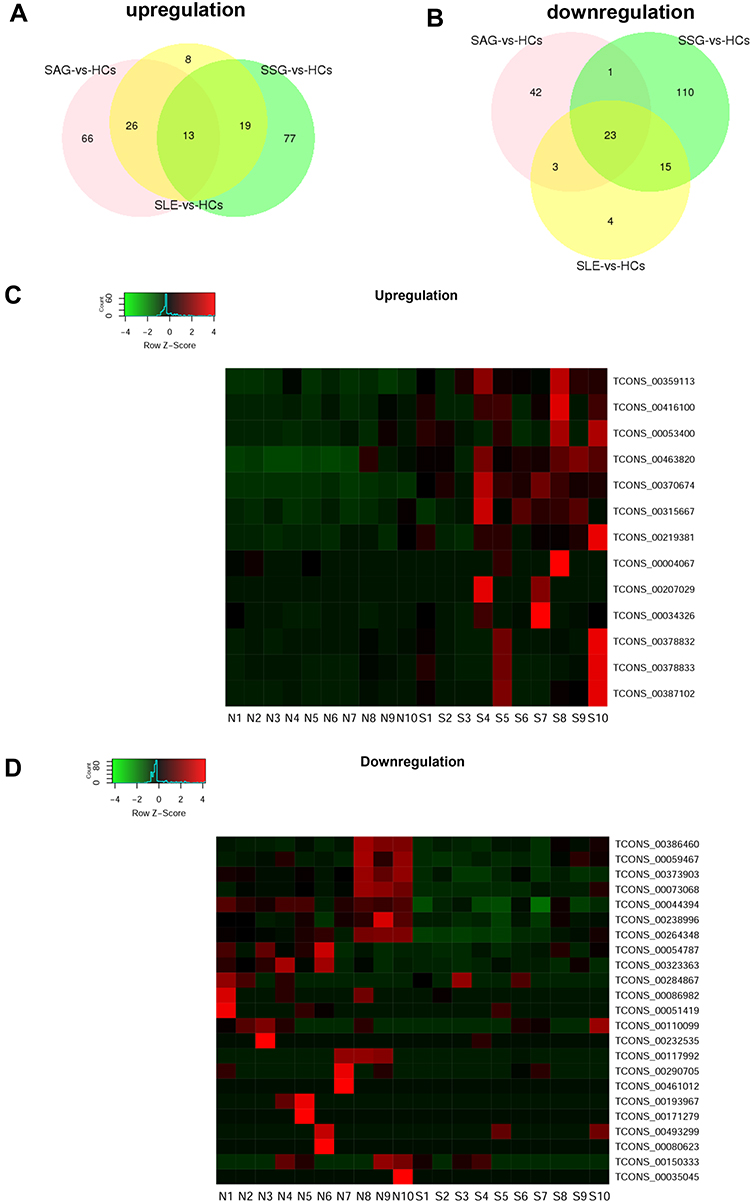 |
Figure 4 Differentially expressed eRNAs in PBMCs from HCs and SLE patients. (A and B) Venn diagram showing the overlap between significantly differentially expressed eRNAs in PBMCs of SLE patients (SAG and SSG) vs HCs, SAG vs HCs, and SSG vs HCs. (C and D) Hierarchical clustering of the 13 commonly upregulated and 23 commonly downregulated eRNAs. Red represents relatively high expression and green relatively low expression. |
Pathway Analysis of the Targets of Candidate SLE-Related eRNAs
Based on the eRNA transcriptome data, we explored the functions of putative co-expressed and co-located target genes of the candidate SLE-related differentially expressed eRNAs using GO, Reactome, and KEGG pathway analyses. In GO analysis, co-expressed targets of the 13 upregulated eRNAs were significantly enriched in cellular response to type I interferon (IFN) and the IFN-related signaling pathway, whereas those of the 23 downregulated eRNAs were markedly enriched in cytosolic ribosome and nuclear-transcribed mRNA catabolic process (Supplementary File, Figure S4A). In Reactome pathway analysis, the co-expressed targets of the 13 upregulated eRNAs were involved in IFN-related regulation signaling, cytokine signaling, and DNA methylation, whereas those of the 23 downregulated eRNAs were associated with eukaryotic translation-related regulation signaling (Supplementary File, Figure S4B). In KEGG pathway analysis, the co-expressed targets of the 13 upregulated eRNAs mostly participated in the systemic lupus erythematosus pathway, cytokine-cytokine receptor interaction, and Toll-like receptor signaling pathway, whereas those of the 23 downregulated eRNAs were involved in RNA degradation and other metabolism-related regulatory processes (Supplementary File, Figure S4C). Interestingly, the co-expressed targets of candidate upregulated eRNAs were largely associated with SLE-related pathways, including IFN-related, systemic lupus erythematosus, and cytokine signaling.
According to GO analysis, the co-located targets of the 13 upregulated eRNAs were markedly enriched in pyrophosphatase activity and other binding-related processes (Supplementary File, Figure S4D). Reactome analysis revealed that the co-located targets of the candidate upregulated eRNAs were involved in gene expression and DNA methylation (Supplementary File, Figure S4E), and KEGG pathway results indicated that the co-located targets of the candidate upregulated eRNAs participated in the systemic lupus erythematosus pathway (Supplementary File, Figure S4F). In contrast, the co-located targets of the candidate downregulated eRNAs were not significantly enriched in any pathway. Based on the data, both co-expressed targets and co-located targets of upregulated eRNAs were likely to participate in SLE-related pathways. KEGG analysis of the integrated co-expressed and co-located targets of the candidate upregulated eRNAs revealed that they were commonly involved in systemic lupus erythematosus (Padj < 0.05) as shown in Supplementary File, Figure S5. Most of these are involved in autoantigens, cytokine–cytokine receptor interaction, immune complexes, and tissue injury and damage. Together, these results suggested that the targets of upregulated rather than those of downregulated eRNAs play a critical role in regulating SLE-related signaling.
Validation of Candidate Upregulated eRNAs
To evaluate the clinical utility of the upregulated candidate SLE-related eRNAs, we measured their expression in a validation cohort consisting of six SLE patients and six HCs. Among the 13 candidate eRNAs, four eRNAs were excluded based on the following criteria: 1) eRNA was not detected in several HC samples; 2) eRNA > 10,000 bp. Additionally, RT-qPCR of TCONS_00053400 failed. Thus, only eight upregulated eRNAs (TCONS_00034326, TCONS_00416100, TCONS_000219381, TCONS_00315667, TCONS_00359113, TCONS_00378832, TCONS_00463820, TCONS_00378833) were evaluated in the first validation cohort (Figure 5A, Supplementary File, Figure S6A). Based on eRNA expression being upregulated in the majority of samples of the first validation cohort, TCONS_00034326, TCONS_00416100, and TCONS_000219381 were selected for validation in another, larger cohort, including 25 SLE patients and 20 HCs. Only TCONS_00034326 was significantly increased in expression in SLE patients in the second validation cohort (P < 0.05; Figure 5B, Supplementary File, Figure S6B). To confirm the potential utility of TCONS_00034326 as a diagnostic biomarker, we conducted ROC curve analysis. The AUC of TCONS_00034326 for distinguishing SLE patients from HCs was 0.691, with a diagnostic sensitivity of 0.833 and specificity of 0.55 (Figure 5C).
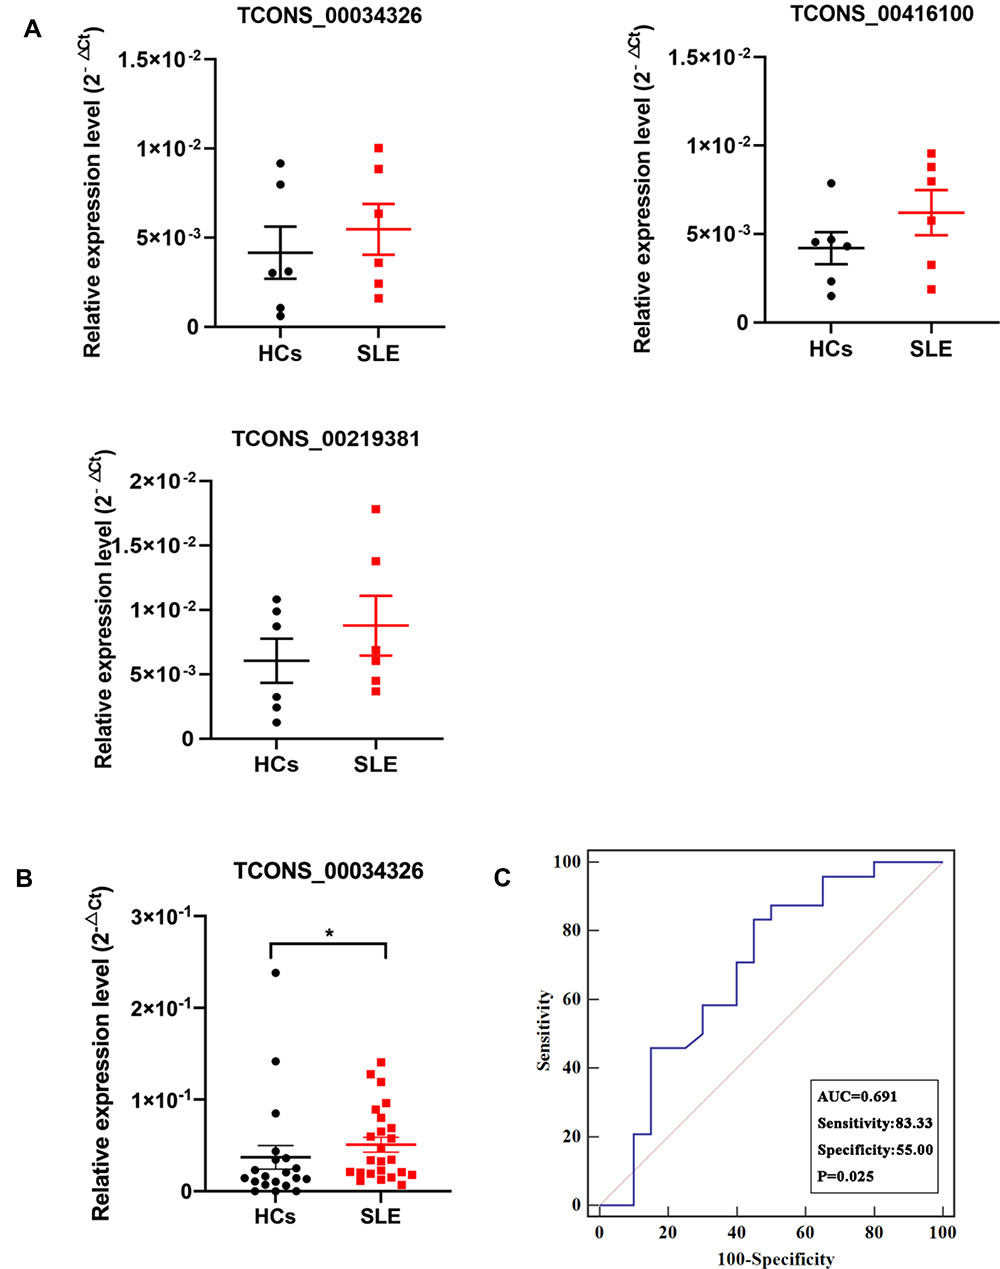 |
Figure 5 Expression of candidate SLE-related upregulated eRNAs. (A) Expression of three selected eRNAs in a validation cohort comprising six SLE patients and six HCs as indicated by RT-qPCR. The three eRNAs were selected for analysis in a larger validation cohort. Data are presented as 2−ΔCt relative to GAPDH expression (mean ± SEM). (B) Expression of TCONS_00034326 in a large validation cohort comprising 25 SLE patients and 20 HCs. One outlier in the SLE group was excluded. *P < 0.05. (C) ROC curve of TCONS_00034326 in the large validation cohort for SLE diagnosis. |
Potential Functions of TCONS_00034326 in SLE
Functional analysis of TCONS_00034326 in SLE was conducted using KOBAS version 3.0. Pathway analysis indicated that the targets of TCONS_00034326 were significantly enriched in vital SLE-related pathways, including TNF signaling, immune signaling, metabolic pathways, and NF-kappa B signaling (Figure 6A, Supplementary File, Figure S7A–C, Table S8). TCONS_00034326 was strongly related to an SE (chr1:89238617–89240917), which is more powerful in regulating gene expression in SLE than the eRNA (Supplementary File, Table S4). To investigate the potential biological function of TCONS_00034326 further, we applied two methods to identify TCONS_00034326-related master TFs. On the one hand, considering that TCONS_00034326 was associated with the SE in chr1:89238617–89240917, we combined TCONS_00034326-related TFs with SE-associated TFs and found three TFs, including SP1, SPI1, and ZNF467, which activate the transcription of various genes (Figure 6B).34–36 On the other hand, we obtained 26 TCONS_00034326-related TFs (|PCC| > 0.8). Based on a Venn diagram of TCONS_00034326-related TFs and SLE-related master TFs, we found 24 common candidate TFs (Figure 6B). Pathway analysis of these 24 TFs showed that they are involved in TNF signaling and IFN-α/β and -γ signaling (Figure 6C, Supplementary File, Table S9). Notably, three of the 24 (IRF1, CREB5 and JUN) TFs participate in the TNF signaling pathway, which is involved in mediating immunopathogenic injury in SLE.37,38 Two of the 24 TFs (IRF1 and IRF2) are involved in signaling of not only IFN-α/β, but also IFN-γ, which are inducers and effectors in SLE pathogenesis.39,40 Altogether, these findings indicate that TCONS_00034326 and its related master TFs may be of great significance in modulating SLE pathogenesis.
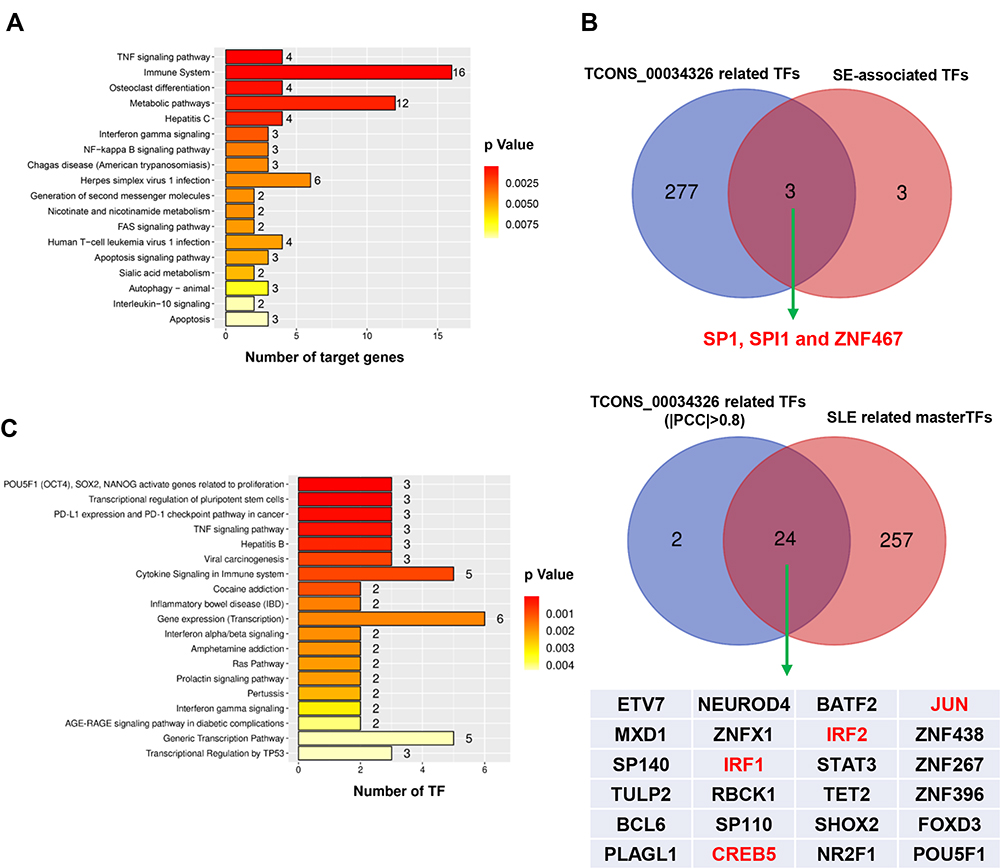 |
Figure 6 Putative regulation and regulatory network of eRNA biogenesis in SLE. (A). Putative regulatory pathways of TCONS_00034326 target genes in SLE. Three well-known SLE-related pathways (TNF signaling, immune system and metabolic pathways, and NF-κB signaling) are detailed in Supplementary File, Table S8 and Figure S7. (B) Overlap of TCONS_00034326-related TFs and SE-associated TFs (upper panel) and of TCONS_00034326-related TFs and SLE-related master TFs (lower panel). (C) Putative regulatory pathways of 24 TCONS_00034326-related master TFs in SLE. Three master TFs participate in TNF signaling, two master TFs are involved in interferon α/β and γ signaling (Supplementary File, Table S9). |
Discussion
Recently, the importance of eRNAs and SEs in the regulation of gene transcription has been increasingly recognized based on their wide transcription in various conditions. Some eRNAs transcriptome studies in human cancers11,41 and neuronal systems42 have highlighted the unique role of eRNAs in gene regulation in human tissues and organs and demonstrated that eRNAs have value as potential therapeutic targets. In this study, we utilized a novel computational framework to reveal the global expression landscapes of eRNAs in PBMC samples from SLE patients and HCs.
Zhang et al identified cancer-specific eRNAs by integrating multi-omics data from the large-scale ENCODE, FANTOM, and Roadmap Epigenomics projects.11 Carullo et al combined “assay for transposase-accessible chromatin”-seq and RNA-seq, which enabled genome-wide enhancer identification and putative enhancer–gene pair prediction based on transcriptional output correlations.42 Similarly, by integrating enhancer annotation data from the FANTOM, Roadmap Epigenomics, and DENdb databases, we gained novel insights into the eRNA and SE expression landscapes of human PBMCs. We utilized these three project databases to identify eRNAs as comprehensively and accurately as possible, to ensure that our results are reliable. eRNAs were first detected in large-scale transcriptome profiling,43 and RNA polymerase II ChIP-seq44 studies. Subsequently, in a study of genome-wide eRNA synthesis, transcripts from enhancers were detected by RNA-seq using total RNAs, but not polyadenylated RNAs alone.45 Polyadenylated RNA-seq detects accumulated RNA end products rather than the dynamic, transient transcriptional activity of a cell, and is not sufficiently robust to detect eRNAs, which generally lack poly(A) tails.32 Compared to other tools used to detect eRNAs, RNA-seq is a well-established and simple tool that allows high-throughput analysis; however, it detects RNA end products rather than the dynamic transcriptional activity, and most reads are from highly expressed coding genes.9 Therefore, we utilized genome-wide transcriptomics along with strand-specific library construction and multiple bioinformatics analyses to study the eRNA composition of the PBMC population after ribosomal RNA depletion to obtain complete eRNA profiles.
We observed that eRNAs were transcribed from all chromosomes in HCs and SLE patients, and more than 90% of eRNA genes were detected in at least two samples from SLE patients and HCs, whereas 9% of eRNAs were detected in only one sample, which is slightly different from findings in a cancer study.11 Consequently, RT-qPCR did not detect the unique eRNAs in some of the samples, which may be due to the very low or lack of expression of these eRNAs. eRNAs are retained in the nucleus, and they are very unstable and therefore, can degrade within minutes.8 The total numbers of eRNAs did not significantly differ between the SLE and HC groups, but the mean eRNA expression was increased in the SAG group when compared with that in the HC group. The recently reported heart-specific eRNA HERNA1 promotes pathological cardiac metabolism and contractile dysfunction, and knockdown of HERNA1 protected mice from heart disease and even reversed cardiac pathology in mice.46 Likewise, increased eRNA expression is likely to be correlated with SLE pathology.
SEs have been shown to recruit transcription complexes and generate eRNAs. Consistent with a previous report,10 we found that SEs were generally substantially longer than the majority of eRNAs. The number of SEs was negatively correlated with disease activity, which implicates that an imbalance in SEs promotes SLE pathogenesis. In contrast to the findings for eRNAs, unique SEs accounted for nearly 38%, whereas ubiquitous SEs represented only 0.2% of the SEs identified in the total SLE and HC PBMC samples. The large proportion of unique SEs may be due to disease heterogeneity and differences in disease activity among the patients, or the small sample size in this study. Accumulating evidence suggests that eRNAs are not only associated with SEs, but also play functional roles in SE biology.8 The fact that SE transcript numbers were negatively correlated with disease activity and eRNA expression levels were positively correlated with disease activity may suggest that part of the eRNAs play a key role in the progression of lupus. One study revealed that differential eRNA expression in patients with autoimmune disease was especially localized to SEs near known genetic variants for autoimmune disease risk.47 Thus, SEs appear to play an important role in the biology of SLE. As regulators of the transcriptional machinery, eRNAs can recruit and regulate TFs and promote enhancer and gene transcription.48 We identified various SLE-specific TFs as potential regulators of eRNA biogenesis.24 Specific master TFs widely activate the gene expression program to define cell identity, and contribute to multiple diseases.14,49 In accordance herewith, we observed that putative SLE-related master regulators of eRNAs generally displayed a significant enrichment in functions related to transcriptional misregulation, suggesting a potential mechanistic relation between eRNA biogenesis and genome instability. In line herewith, in a recent report,11 putative master regulators of eRNAs in cancer were generally involved in modulating genomic instability. Interestingly, we found that many SLE-related TFs were involved in modulating the TNF signaling pathway, which mediates immunopathogenic injury in SLE, greatly expanding our knowledge of eRNA biogenesis in SLE.
By classifying the samples according to SLE disease activity, we identified 13 and 23 eRNAs that were commonly upregulated and downregulated, respectively, in active and stable disease. For comprehensive and integral pathway analysis of the candidate SLE-related differentially expressed eRNAs, we used the GO, Reactome, and KEGG pathway analysis tools. GO and Reactome analyses showed that co-expressed target genes of the upregulated eRNAs were largely involved in IFN signaling, which has key immune effector functions in SLE.50,51 Intriguingly, KEGG analysis indicated that co-expressed and co-located target genes of the upregulated candidate SLE-related eRNAs participate in systemic lupus erythematosus pathways, including IFN-γ, which corroborates that eRNAs function in SLE pathogenesis. Importantly, ten of the 13 candidate upregulated eRNAs were related to SEs. Accumulating evidence suggests that eRNAs can provide insights into diagnosing, prognosticating, treating, and understanding the pathogenesis of diseases that cannot be achieved with current biomarkers.8 Considering the putative biological functions of the candidate eRNAs, we further explored their potential functionality as diagnostic biomarkers of SLE through validation analysis. TCONS_00034326 expression was markedly increased in SLE patients compared with HCs. We used ROC curve analysis to confirm the usability of TCONS_00034326 as a biomarker. We demonstrated the SLE-specific expression of certain eRNAs, suggesting that these may be powerful diagnostic and/or prognostic markers in SLE.
TCONS_00034326 was strongly related to an SE (chr1:89238617–89240917), which is more powerful in regulating gene expression in SLE than an eRNA (Supplementary File, Table S5). Using two different methods, we identified 26 TCONS_00034326-related SLE master TFs, including SP1, SPI1, ZNF467, IRF1, and IRF2. SP1 has been implicated in inflammation and genome instability, as well as in epigenetic silencing.52 Using the KOBAS software and DAVID pathway enrichment, we further explored the biological roles of the target genes and master TFs of TCONS_00034326. Pathway enrichment analysis indicated that both the target genes and master TFs of TCONS_00034326 were relevant to the regulation of SLE pathological pathways, including TNF signaling and IFN-α/β and γ signaling. TNF signaling is involved in various immunoregulatory and proinflammatory processes in SLE.53 To some degree, TNF apparently has dual effects in checking autoimmunity and fostering inflammation.54 In fact, anti-TNF-induced lupus is an adverse effect related to the use of TNF blockers in autoimmune arthritis, with manifestations ranging from mild cutaneous to serious fatal conditions. Type-I IFNs (IFN-α/β) are regarded key IFNs in the pathogenesis of SLE,55 and mounting evidence suggests that IFN-γ also plays an essential role in SLE development and severity.40 Our data indicate that TCONS_00034326 plays an important role in SLE pathogenesis by recruiting these master TFs. Further, these results suggest that appreciable expression of eRNAs are clinically valuable and inform and motivates future investigation of the molecular mechanisms of eRNA in the immunopathogenesis of SLE.
This study had some limitations. First, our sample size was relatively small. A larger population for validation is required to further explore the clinical value of eRNAs, including TCONS_00034326. Second, the mechanisms of the eRNAs identified in regulating SLE were not revealed. The SEs in our study were identified from analytical databases and may not represent the actual SEs in SLE, and further experimentation is needed to validate these results. We are currently developing a roadmap to evaluate the undetermined mechanisms of eRNA-mediated SLE-related regulation.
Conclusion
Our study portrayed transcriptional eRNA landscapes in PBMCs from SLE patients and HCs and identified several eRNAs that are relevant to SLE. We suggest these may serve as prospective diagnostic and therapeutic targets in SLE pathogenesis.
Data Sharing Statement
The raw data supporting the conclusions of this manuscript will be made available by the authors, without undue reservation, to any qualified researcher.
Ethics Statement
This study was conducted in accordance with the Declaration of Helsinki. The research protocol was approved by the Medical Ethical Committees of the First Affiliated Hospital of Wenzhou Medical University. All subjects who participated in this research provided written informed consent.
Acknowledgments
We thank all the study participants, including the SLE patients and healthy volunteers.
Author Contributions
All authors made a significant contribution to the work reported, whether that is in the conception, study design, execution, acquisition of data, analysis and interpretation, or in all these areas; took part in drafting, revising, or critically reviewing the article; gave final approval of the version to be published; have agreed on the journal to which the article has been submitted; and agree to be accountable for all aspects of the work.
Funding
This study was supported by National Nature Science Foundation of China (grant No. 82001705), Zhejiang Provincial Natural Science Foundation of China (grant No. LY20H100003), Medical Health Science and Technology Project of Zhejiang Provincial Health Commission (grant No. 2019KY453), Wenzhou Municipal Science and Technology Bureau (grant No.Y20210089; No. Y20180158).
Disclosure
The authors have declared no conflicts of interest.
References
1. Manson JJ, Rahman A. Systemic lupus erythematosus. Orphanet J Rare Dis. 2006;1(1):6. doi:10.1186/1750-1172-1-6
2. Catalina MD, Owen KA, Labonte AC, Grammer AC, Lipsky PE. The pathogenesis of systemic lupus erythematosus: harnessing big data to understand the molecular basis of lupus. J Autoimmun. 2020;110:102359. doi:10.1016/j.jaut.2019.102359
3. Caielli S, Veiga DT, Balasubramanian P, et al. A CD4(+) T cell population expanded in lupus blood provides B cell help through interleukin-10 and succinate. Nat Med. 2019;25(1):75–81. doi:10.1038/s41591-018-0254-9
4. Hedrich CM. Epigenetics in SLE. Curr Rheumatol Rep. 2017;19(9):58. doi:10.1007/s11926-017-0685-1
5. Guo G, Wang H, Shi X, et al. NovelmiRNA-25 inhibits AMPD2 in peripheral blood mononuclear cells of patients with systemic lupus erythematosus and represents a promising novel biomarker. J Transl Med. 2018;16(1):370. doi:10.1186/s12967-018-1739-5
6. Guo G, Wang H, Ye L, et al. Hsa_circ_0000479 as a novel diagnostic biomarker of systemic lupus erythematosus. Front Immunol. 2019;10:2281. doi:10.3389/fimmu.2019.02281
7. Shi L, Li S, Maurer K, Zhang Z, Petri M, Sullivan KE. Enhancer RNA and NFκΒ-dependent P300 regulation of ADAMDEC1. Mol Immunol. 2018;103:312–321. doi:10.1016/j.molimm.2018.09.019
8. Arnold PR, Wells AD, Li XC. Diversity and emerging roles of enhancer RNA in regulation of gene expression and cell fate. Front Cell Dev Biol. 2019;7:377. doi:10.3389/fcell.2019.00377
9. Li W, Notani D, Rosenfeld MG. Enhancers as non-coding RNA transcription units: recent insights and future perspectives. Nat Rev Genet. 2016;17(4):207–223. doi:10.1038/nrg.2016.4
10. Mao R, Wu Y, Ming Y, et al. Enhancer RNAs: a missing regulatory layer in gene transcription. Sci China Life Sci. 2019;62(7):905–912. doi:10.1007/s11427-017-9370-9
11. Zhang Z, Lee J-H, Ruan H, et al. Transcriptional landscape and clinical utility of enhancer RNAs for eRNA-targeted therapy in cancer. Nat Commun. 2019;10(1):4562. doi:10.1038/s41467-019-12543-5
12. Yamagata K, Nakayamada S, Tanaka Y. Critical roles of super-enhancers in the pathogenesis of autoimmune diseases. Inflam Regen. 2020;40:16. doi:10.1186/s41232-020-00124-9
13. Wu M, Shen J. From super-enhancer non-coding RNA to immune checkpoint: frameworks to functions. Front Oncol. 2019;9:1307. doi:10.3389/fonc.2019.01307
14. Whyte WA, Orlando DA, Hnisz D, et al. Master transcription factors and mediator establish super-enhancers at key cell identity genes. Cell. 2013;153(2):307–319. doi:10.1016/j.cell.2013.03.035
15. Kim YJ, Xie P, Cao L, Zhang MQ, Kim TH. Global transcriptional activity dynamics reveal functional enhancer RNAs. Genome Res. 2018;28(12):1799–1811. doi:10.1101/gr.233486.117
16. Sartorelli V, Lauberth SM. Enhancer RNAs are an important regulatory layer of the epigenome. Nat Struct Mol Biol. 2020;27(6):521–528. doi:10.1038/s41594-020-0446-0
17. Andersson R, Gebhard C, Miguel-Escalada I, et al. An atlas of active enhancers across human cell types and tissues. Nature. 2014;507(7493):455–461. doi:10.1038/nature12787
18. Bernstein BE, Stamatoyannopoulos JA, Costello JF, et al. The NIH roadmap epigenomics mapping consortium. Nat Biotechnol. 2010;28(10):1045–1048. doi:10.1038/nbt1010-1045
19. Ashoor H, Kleftogiannis D, Radovanovic A, Bajic VB. DENdb: database of integrated human enhancers [database]. Database. 2015;2015:bav085. doi:10.1093/database/bav085
20. Kim D, Langmead B, Salzberg SL. HISAT: a fast spliced aligner with low memory requirements. Nat Methods. 2015;12(4):357–360. doi:10.1038/nmeth.3317
21. Pertea M, Pertea GM, Antonescu CM, Chang TC, Mendell JT, Salzberg SL. StringTie enables improved reconstruction of a transcriptome from RNA-seq reads. Nat Biotechnol. 2015;33(3):290–295. doi:10.1038/nbt.3122
22. Dorighi KM, Swigut T, Henriques T, et al. Mll3 and Mll4 facilitate enhancer RNA synthesis and transcription from promoters independently of H3K4 monomethylation. Mol Cell. 2017;66(4):
23. Robinson MD, McCarthy DJ, Smyth GK. edgeR: a bioconductor package for differential expression analysis of digital gene expression data. Bioinformatics. 2010;26(1):139–140. doi:10.1093/bioinformatics/btp616
24. Azofeifa JG, Allen MA, Hendrix JR, Read T, Rubin JD, Dowell RD. Enhancer RNA profiling predicts transcription factor activity. Genome Res. 2018;28(3):334–344. doi:10.1101/gr.225755.117
25. Zhang H-M, Chen H, Liu W, et al. AnimalTFDB: a comprehensive animal transcription factor database. Nucleic Acids Res. 2012;40(D1):D144–D149. doi:10.1093/nar/gkr965
26. Chen X, Li A, Sun BF, et al. 5-methylcytosine promotes pathogenesis of bladder cancer through stabilizing mRNAs. Nat Cell Biol. 2019;21(8):978–990. doi:10.1038/s41556-019-0361-y
27. Afyouni S, Smith SM, Nichols TE. Effective degrees of freedom of the Pearson’s correlation coefficient under autocorrelation. Neuroimage. 2019;199:609–625. doi:10.1016/j.neuroimage.2019.05.011
28. Fornes O, Castro-Mondragon JA, Khan A, et al. JASPAR 2020: update of the open-access database of transcription factor binding profiles. Nucleic Acids Res. 2020;48(D1):D87–D92. doi:10.1093/nar/gkz1001
29. Grant CE, Bailey TL, Noble WS. FIMO: scanning for occurrences of a given motif. Bioinformatics. 2011;27(7):1017–1018. doi:10.1093/bioinformatics/btr064
30. Lovén J, Hoke HA, Lin CY, et al. Selective inhibition of tumor oncogenes by disruption of super-enhancers. Cell. 2013;153(2):320–334. doi:10.1016/j.cell.2013.03.036
31. Chang HC, Huang HC, Juan HF, Hsu CL. Investigating the role of super-enhancer RNAs underlying embryonic stem cell differentiation. BMC Genom. 2019;20(Suppl10):896. doi:10.1186/s12864-019-6293-x
32. Alvarez-Dominguez JR, Knoll M, Gromatzky AA, Lodish HF. The super-enhancer-derived alncRNA-EC7/bloodlinc potentiates red blood cell development in trans. Cell Rep. 2017;19(12):2503–2514. doi:10.1016/j.celrep.2017.05.082
33. Pflegerl P, Vesely P, Hantusch B, et al. Epidermal loss of JunB leads to a SLE phenotype due to hyper IL-6 signaling. Proc Natl Acad Sci U S A. 2009;106(48):20423–20428. doi:10.1073/pnas.0910371106
34. Vizcaíno C, Mansilla S, Portugal J. Sp1 transcription factor: a long-standing target in cancer chemotherapy. Pharmacol Ther. 2015;152:111–124. doi:10.1016/j.pharmthera.2015.05.008
35. Hikami K, Kawasaki A, Ito I, et al. Association of a functional polymorphism in the 3′-untranslated region of SPI1 with systemic lupus erythematosus. Arthritis Rheum. 2011;63(3):755–763. doi:10.1002/art.30188
36. Nakayama K, Kim KW, Miyajima A. A novel nuclear zinc finger protein EZI enhances nuclear retention and transactivation of STAT3. EMBO J. 2002;21(22):6174–6184. doi:10.1093/emboj/cdf596
37. Zhu L, Yang X, Chen W, et al. Decreased expressions of the TNF-alpha signaling adapters in peripheral blood mononuclear cells (PBMCs) are correlated with disease activity in patients with systemic lupus erythematosus. Clin Rheumatol. 2007;26(9):1481–1489. doi:10.1007/s10067-006-0531-8
38. Zhu LJ, Landolt-Marticorena C, Li T, et al. Altered expression of TNF-alpha signaling pathway proteins in systemic lupus erythematosus. J Rheumatol. 2010;37(8):1658–1666. doi:10.3899/jrheum.091123
39. Sozzani S, Bosisio D, Scarsi M, Tincani A. Type I interferons in systemic autoimmunity. Autoimmunity. 2010;43(3):196–203. doi:10.3109/08916930903510872
40. Pollard KM, Cauvi DM, Toomey CB, Morris KV, Kono DH. Interferon-γ and systemic autoimmunity. Discov Med. 2013;16(87):123–131.
41. Pan CW, Wen S, Chen L, Wei Y, Niu Y, Zhao Y. Functional roles of antisense enhancer RNA for promoting prostate cancer progression. Theranostics. 2021;11(4):1780–1794. doi:10.7150/thno.51931
42. Carullo NVN, Phillips RA
43. Cheng J, Kapranov P, Drenkow J, et al. Transcriptional maps of 10 human chromosomes at 5-nucleotide resolution. Science. 2005;308(5725):1149–1154. doi:10.1126/science.1108625
44. Carroll JS, Meyer CA, Song J, et al. Genome-wide analysis of estrogen receptor binding sites. Nat Genet. 2006;38(11):1289–1297. doi:10.1038/ng1901
45. Kim TK, Hemberg M, Gray JM, et al. Widespread transcription at neuronal activity-regulated enhancers. Nature. 2010;465(7295):182–187. doi:10.1038/nature09033
46. Mirtschink P, Bischof C, Pham MD, et al. Inhibition of the hypoxia-inducible factor 1α-induced cardiospecific HERNA1 enhance-templated RNA protects from heart disease. Circulation. 2019;139(24):2778–2792. doi:10.1161/CIRCULATIONAHA.118.036769
47. Aune TM, Crooke PS
48. Sigova AA, Abraham BJ, Ji X, et al. Transcription factor trapping by RNA in gene regulatory elements. Science. 2015;350(6263):978–981. doi:10.1126/science.aad3346
49. Hnisz D, Abraham BJ, Lee TI, et al. Super-enhancers in the control of cell identity and disease. Cell. 2013;155(4):934–947. doi:10.1016/j.cell.2013.09.053
50. Crow MK, Olferiev M, Kirou KA. Targeting of type I interferon in systemic autoimmune diseases. Transl Res. 2015;165(2):296–305. doi:10.1016/j.trsl.2014.10.005
51. Tsokos GC, Lo MS, Costa Reis P, Sullivan KE. New insights into the immunopathogenesis of systemic lupus erythematosus. Nat Rev Rheumatol. 2016;12(12):716–730. doi:10.1038/nrrheum.2016.186
52. Beishline K, Azizkhan-Clifford J. Sp1 and the “hallmarks of cancer”. FEBS J. 2015;282(2):224–258. doi:10.1111/febs.13148
53. Postal M, Appenzeller S. The role of tumor necrosis factor-alpha (TNF-α) in the pathogenesis of systemic lupus erythematosus. Cytokine. 2011;56(3):537–543. doi:10.1016/j.cyto.2011.08.026
54. Aringer M, Smolen JS. The role of tumor necrosis factor-alpha in systemic lupus erythematosus. Arthritis Res Ther. 2008;10(1):202. doi:10.1186/ar2341
55. Chyuan I-T, Tzeng H-T, Chen J-Y. Signaling pathways of type I and type III interferons and targeted therapies in systemic lupus erythematosus. Cells. 2019;8(9):963. doi:10.3390/cells8090963
 © 2022 The Author(s). This work is published and licensed by Dove Medical Press Limited. The full terms of this license are available at https://www.dovepress.com/terms.php and incorporate the Creative Commons Attribution - Non Commercial (unported, v3.0) License.
By accessing the work you hereby accept the Terms. Non-commercial uses of the work are permitted without any further permission from Dove Medical Press Limited, provided the work is properly attributed. For permission for commercial use of this work, please see paragraphs 4.2 and 5 of our Terms.
© 2022 The Author(s). This work is published and licensed by Dove Medical Press Limited. The full terms of this license are available at https://www.dovepress.com/terms.php and incorporate the Creative Commons Attribution - Non Commercial (unported, v3.0) License.
By accessing the work you hereby accept the Terms. Non-commercial uses of the work are permitted without any further permission from Dove Medical Press Limited, provided the work is properly attributed. For permission for commercial use of this work, please see paragraphs 4.2 and 5 of our Terms.