")
Back to Journals » Cancer Management and Research » Volume 11
Transcatheter arterial embolization combined with hypoxia-replicative oncolytic adenovirus perfusion enhances the therapeutic effect of hepatic carcinoma
Authors Zhang H, Xiong F , Qian K , Liu Y, Liang B, Xiong B, Yang F , Zheng C
Received 29 September 2018
Accepted for publication 6 December 2018
Published 23 January 2019 Volume 2019:11 Pages 981—996
DOI https://doi.org/10.2147/CMAR.S189208
Checked for plagiarism Yes
Review by Single anonymous peer review
Peer reviewer comments 2
Editor who approved publication: Professor Harikrishna Nakshatri
Hongsen Zhang, Fu Xiong, Kun Qian, Yiming Liu, Bin Liang, Bin Xiong, Fan Yang, Chuansheng Zheng
Department of Radiology, Union Hospital of Tongji Medical College, Huazhong University of Science and Technology, Wuhan, China
Purpose: Transcatheter arterial embolization or transcatheter arterial chemoembolization has become a critical therapy for unresectable hepatocarcinoma. Although hypoxia caused by embolization can induce apoptosis and necrosis of the majority of tumor cells, a small proportion of cells can survive with hypoxia and chemotherapy resistance. HIF-1α induced by hypoxia is the key factor rendering surviving tumor cells invasive and metastatic properties. Thus, we generated a synthetic hypoxia-replicative oncolytic adenovirus (HYAD) expecting to further eliminate the surviving tumor cells, which expressed HIF-1α.
Materials and methods: In our study, we detected protein expression, proliferation, apoptosis, and necrosis of hepatic tumor cell line when infected with HYAD under hypoxia and normoxia. And we constructed VX2 hepatic cancer rabbit models to explore the therapeutic effect of transcatheter arterial embolization combined with HYAD perfusion under digital subtraction angiography. Inhibition of tumor growth and invasion was detected by histopathological examination and contrast-enhanced CT scan.
Results: Experiments in vitro verified that HYAD expressed and replicated along with HIF-1α expression or hypoxia. Compared with wild adenovirus type 5 (WT), HYAD expressed much more under hypoxia, which was the main principle of HYAD killing surviving tumor cells posttransarterial embolization. In vivo experiment of VX2 models, HYAD perfusion combined with polyvinyl alcohol (PVA) embolization achieved the highest expression quantity and the longest expression duration compared with simple HYAD perfusion, WT perfusion combined with PVA embolization, and simple WT perfusion. Because adenovirus expression protein E1A had the properties of promoting apoptosis, inhibiting invasion, and inhibiting metastasis, HYAD perfusion combined with PVA embolization group efficiently repressed tumor growth and intrahepatic metastases compared to other processing groups.
Conclusion: HYAD can overcome the hypoxic tumor microenvironment postembolization and target the surviving tumor cells with specificity. In turn, HYAD perfusion combined with PVA embolization can bring out the best effect in each other.
Keywords: transcatheter arterial embolization, hepatocarcinoma, hypoxia, oncolytic adenovirus
Introduction
Hepatocellular carcinoma (HCC) has become a common and highly aggressive and malignant type of cancer which to date is the fifth most common cancer and the second most mortal cancer worldwide.1,2 Many different therapeutic methods have been applicated for this kind of uncurable malignant tumor including surgical treatment, ablation treatment, transarterial chemoembolization (TACE), molecularly targeted treatment and hepatic transplantation.2 Herein, TACE and molecularly targeted therapy have become vitally critical therapeutic means for the intermediate and advanced liver cancer. While hypoxia caused by TACE in survival tumor cells leads to the release of angiogenic growth factors that can induce tumor recurrences or metastases and a poor outcome for patients,3 which is called hypoxic response. There are some clinical trials having confirmed that inhibiting angiogenesis attributed to hypoxia response combines with TACE can induce an interesting response rate, time to progress and overall survival (OS).4,5 Obviously, restricting the hypoxia response accompanying with TACE is critical for preventing relapse of HCC. While a SPACE trial has verified that sorafenib plus TACE was technically feasible, but the combination did not improve time to progress in a clinically meaningful manner compared with TACE alone.6 Hence, an alternative approach for combination with TACE is necessary.
Tumor cells adapt to the hypoxia microenvironment through activating many hypoxia-related molecules, mainly the hypoxia-inducible factors (HIFs).7 HIF is a heterodimer consisting of one of three α subunits (HIF-1α, HIF-2α, or HIF-3α) bound to the aryl hydrocarbon receptor nuclear translocator, which is called HIF-1β that is constitutively expressed.8,9 The hypoxic response is mainly ascribed to HIF-1α.10 HIF-1α is a transcription factor that plays a central role in cellular adaptation to decreased oxygen concentration. In normoxia environment, all the normal cells in vivo barely produce HIF-1α, by the reason that when the partial pressure of oxygen reduced, tyrosine hydroxylase will be inactive and subsequently inactivate the von Hippel–Lindau, which encodes a ubiquitin ligase involved in HIF-1 degradation. Nevertheless, in most solid tumors regardless of their origin, location, or genetic alterations, HIF-1α is expressed.11–13 In this process, hypoxic cancer cells acquire invasive and metastatic properties as well as resistance to chemotherapy and radiation therapy, which together constitute the lethal cancer phenotype.12–15
There are some studies having proved that HCC expresses HIF-1α in peritumoral liver tissues and in HCC tissues in varying degrees, whereas normal hepatic tissues express HIF-1α scarcely.16,17 And several studies imply that HIF-1α is an independent prognosticator for both survival and recurrence in HCC.17 Therefore, the hypoxia microenvironment of tumor has become an important target of the molecular therapy or gene therapy. Among them, oncolytic adenovirus has become a significant treatment means which has emerged as a promising approach for the treatment of tumors resistant to other treatment modalities.18 The modified adenovirus generally based on the biological characteristics of the target tumor cells replicate and complete their lytic cycle preferentially therein. And the new viral progeny is released that can repeat the process and multiply antitumoral effects by renewing the therapeutic agent in situ hence amplifying the oncolytic effect until the tumor is eliminated.19 E1 gene consisting of E1A and E1B is the expression gene of adenovirus, which is essential for Ad replication and has the intrinsic specialty of cytotoxic and lytic effects to tumor cells. Exception of the direct damage mechanism, still oncolytic viruses activate toll-like receptor signaling leading to induction of acute local tumor inflammation.19,20 The secreted cytokins by inflammation cells can further induce tumor cells cytotoxicity to apoptosis and necrosis.21 Several kinds of synthetic adenovirus targeting HIF-1α have been constructed to treat tumors, which spontaneously produce HIF-1α such as retinoblastoma and clear cell renal carcinoma.22,23 Nevertheless, hypoxia-selective oncolytic adenovirus has not been applicated in the conventional treatment process inducing hypoxia. In view of this, we constructed a synthetic hypoxia-replicative oncolytic adenovirus (HYAD) and combined it with TACE, expecting to exert the efficacy of both extremely.
Materials and methods
Construction and generation of a hypoxia selective oncolytic adenovirus
A synthetic adenovirus was constructed based on human adenovirus serotype 5 (Ad5). The 35 bp human VEGF hypoxia response element (HRE) (CCACA GTGCA TACGT GGGCT CCAAC AGGTC CTCTT; GenBank, NC_000006.12) was connected by T4 ligase to form nine copies of tandem repeat sequences. With introduction of Xhol I restriction sites to both ends of the TPA responsive element region in pBI Tel vector (Clontech, Shanghai, China), the 9× HRE sequence was connected to the restriction sites. E1 gene cloned by PCR from Ad5 was connected into EcoR V site of multiple cloning site I, obtaining pBI-9× HRE-E1 vector. The sequence from SV40 poly A to E1 was amplified by PCR with pBI-9× HRE-E1 as the template. Subsequently, this sequence was introduced into pShuttle vector (AdEasy™ XL Adenoviral Vector System, Shanghai, China). After being packaged, filtrated, and purified, the synthetic adenovirus was amplificated and titrated in HEK293 cells followed by storing at –80°C.
Cell line and cell culture
Human embryonic kidney cell line expressing the adenovirus E1 region (HEK293), hepatic tumor cell line (HepG2), and hepatic normal cell line (LO2) were purchased from the American Type Culture Collection (Manassas, VA, USA). All the cell lines were cultured in DMEM (Gibco BRL, Waltham, MA, USA) supplemented with 10% FBS (Gibco BRL). In normoxia condition, cells were incubated in a chamber, which maintained at 37°C, with an air humidified atmosphere containing 5% CO2. We mimicked hypoxia condition by adding 100 µM cobalt dichloride (CoCl2; Sigma, St. Louis, MO, USA) to the complete medium with the culture condition described as preceding text.
Animal studies
Adult New Zealand White rabbits weighing 2.5–3.0 kg were used in this study. VX2 tumor cells were incubated to be injected into the muscle of the right thigh of a rabbit. When the tumor grew to a diameter of 10 cm nearly, the rabbit was sacrificed and the tumor tissue was harvested. The tumor tissue was cut into cubes at the size of 1 mm³, then these cubes were soaked into Hanks’ solution. Incision was made in rabbits along the abdominal white line after anesthetized with pentobarbital sodium (3%, 40 mg/kg; Sigma-Aldrich), and all efforts were made to minimize suffering. Under the sterile tactically, each tumor tissue cube was embedded into the hepatic left lobe of each rabbit and then the incision was sutured. After 15–16 days, the hepatic tumor formation and growth situation were detected by a spiral contrast-enhanced CT scanner (SOMATOM Sensation 64 Spiral, Siemens, Munich, Germany) 1 day before interventional operation. Hereafter, all the operation was performed under digital subtraction angiography (Angiostar Plus, Siemens Medical Solutions, Munich, Germany) guidance. Each right femoral artery of the rabbits was inserted with a 4F sheath, and a 4F Visceral Cobra (Cook, IN, USA) was used to select the celiac axis. Then a 2.7F coaxial microcatheter system (Terumo, Tokyo, Japan) was advanced to super select the feeding artery of the tumor through the 4F Visceral Cobra.
Histological, immunohistochemical, and immunofluorescence evaluation of hepatic tumor tissue
Tumor tissues were collected from the rabbits at 1, 3, and 7 days post the first treatment. Tumor tissues were fixed in 4% formalin and embedded in paraffin. Representative tissue slides were stained with H&E (Sigma-Aldrich). Tumor slides were also stained with a mouse anti-Axl monoclonal antibody (dilution:1:50, Abcam, Cambridge, UK) to assess the expression of Axl in tumor tissue. After overnight incubation with primary antibodies at 4°C, tumor slides were processed with an ABC-peroxidase kit (ChemoMate DAKO Envision kit; DAKO, Carpinteria, CA, USA). To assess viral replication in tumor tissues by immunofluorescence analysis, simultaneously the slides were stained with a mouse anti-E1A IgG Ab (dilution:1:50, Abcam) and a rabbit anti-HIF-1α IgG Ab (dilution:1:50, Abcam) and then respectively incubated with an Alexa Fluor fluorescein isothiocyanate-conjugated rabbit antimouse IgG (secondary) Ab (dilution:1:200, Abcam) and an Alexa Fluor 594-conjugated donkey antirabbit IgG (secondary) Ab (dilution:1:200, Abcam). Nuclear staining with DAPI (Sigma-Aldrich) was also performed. The induction of apoptosis (TUNEL-positive spots) in tumor tissue was assessed by means of a TUNEL assay kit (Roche, Shanghai, China). All slides were counterstained with Mayer’s hematoxylin. The expression levels of E1A, HIF-1α, Axl, and TUNEL-positive cells (apoptotic cells) were semiquantitatively analyzed by using the Image J analysis software (version 1.8.0; National Institutes of Health, Bethesda, MD, USA).
Western blot
The levels of HIF-1α, E1A, and β-actin protein expression were determined by immunoblotting. Immunolabeling detected by enhanced chemiluminescence (Amersham Pharmacia Biotechnology, Piscataway, NJ, USA) and visualized with a digital luminescent image analyzer (Fujifilm LAS-1000 CH, Shanghai, China).
Proliferation, apoptosis, and necrosis
To assess the inhibiting and lethal effect of the synthetic adenovirus, hepG2 cells and LO2 cells dispensed (2,000 cells/well) in 96-well plates were infected with the HYAD and wild adenovirus 5 type (WT) at multiplicity of infection (MOI) of 1, 10, and 100 under normoxia and hypoxia, respectively. After 24, 48, 72, and 96 hours, each well was added with 10 μL cell-counting kit-8 solution (Dojindo Molecular Technologies, INC, MD, USA) followed by incubating for 3 hours in the incubator. The absorbance was measured at 450 nm by a microplate reader (SpectraMaxM4, Molecular Devices, Shanghai, China). HepG2 cells and LO2 cells dispensed (5×10⁵ cells/well) in 6-well plates were infected with HYAD and WT at MOI of 1 and 10 under normoxia and hypoxia, respectively. At 96 hours postinfection, the cells were harvested and washed by PBS two times. Five microliters of Annexin V-APC (BioLegend, CA, USA) and then 5 μL 7-AAD (7-aminoactinomycin D; BioLegend) were added into the cells before they were analyzed by flow cytometry (Attune NxT Flow Cytometer, Thermo Fisher Scientific, MA, USA) within 4 hours.
Real-time quantitative PCR
Real-time quantitative PCR was performed to measure E1 mRNA expression. Oligonucleotide primers for PCR were designed as follows: forward primer 5′- CCAAGCTTAGGCGGTTTCGCAGATT-3′; reverse primer 5′- CCATCGATGCACAAGGTTTGGCATAGA-3′ (GenBank, NC_001405.1).
The segment was amplified by PCR and linked within the vector pmv261 (EK-Bioscience, Shanghai, China) after enzyme digestion. Luria–Bertani medium was used to screen and amplify the successfully connected clone. The plasmid was extracted, the concentration (ng/μL) was detected, and the copies were calculated after the plasmid had been verified by PCR. The standard curve is shown as below (Figure 1).
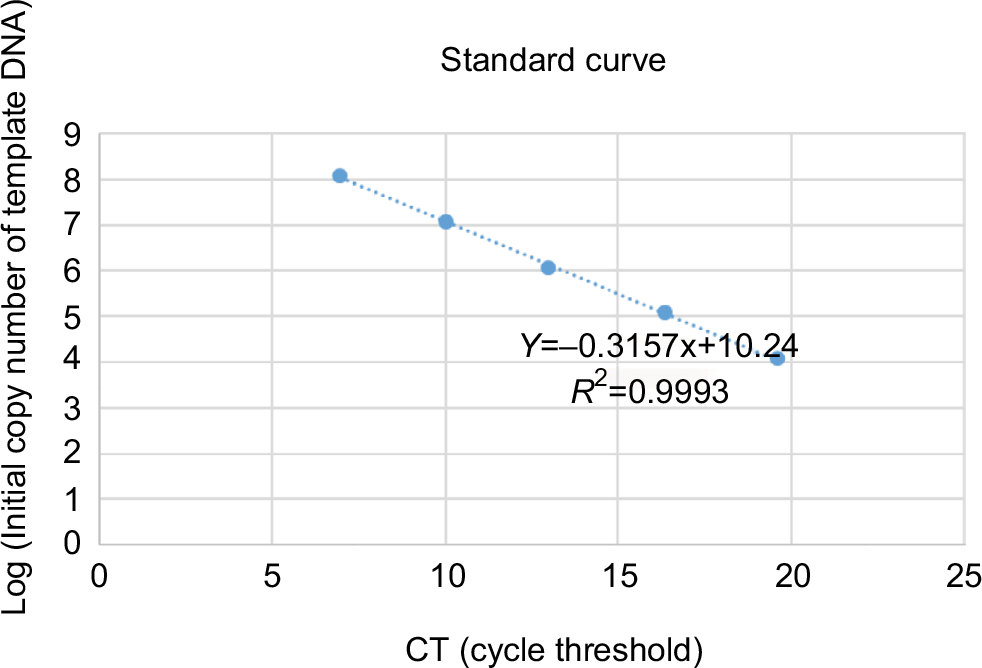 | Figure 1 Standard curve of RT-PCR. |
HepG2 cells and LO2 cells infected with HYAD and WT at MOI 10 were incubated in 6-well plates (1×10⁶ cells/well) under normoxia and hypoxia, respectively. At 24 hours postinfection, the cells and supernatant were harvested, and the DNA was extracted by virus genome extraction kit (Axygen, Hangzhou, China). The DNA content (per 40 µL) was detected by PCR and the standard curve.
Statistical analysis
SPSS, version 23.0 for Mac (IBM Corporation, Armonk, NY, USA) was used for all analyses. Data were expressed as the mean ± SD. Statistical analysis was carried out using 7-aminoactinomycin D; test and Tamhane’s T2(M) test. Data were considered statistically significant when the P-value was <0.05.
Ethics statement
All facilities were approved by the Association for Assessment and Accreditation of Laboratory Animal Care. All animal studies were performed according to the institutionally approved protocols of Huazhong University of Science and Technology.
Results
Synthesis of hypoxia-replicative oncolytic adenovirus
To generate a kind of synthetic virus based on WT Ad5 that selectively replicated in hypoxic cells or the tumor areas expressing HIF-1α, E1 gene was placed downstream of a HIF-1α responsive promoter, which was composed of nine tandem copies of the HRE from human VEGF gene and a minimal cytomegalovirus promoter. The SV40 polyadenylation (polyA) signal was included to further decrease the potential of E1 expression from transcripts initiated by the promoter located upstream of HRE, beyond the sequence already contained in the adenoviral backbone that insulated the modified E1 promoter, which might improve inducible transgene expression.24 The synthetic adenovirus was amplified in HEK293 cells.
Selective expression of oncolytic adenovirus in vitro
The hepatic tumor cell line HepG2 and hepatic normal cell line LO2 were cultured in a chamber under normoxia condition (5%CO2 and 21%O2, 37°C). And hypoxia condition was mimicked by the chemical reagent cobalt dichloride (CoCl2), which has a characteristic of generating reactive oxygen species and enhancing the transcription of the HIF-1α.25 The synthetic virus (HYAD) and WT Ad5 as a control viruses were used to infect HepG2 at the MOI 10 in normoxia and hypoxia condition, respectively. Proteins from cell lysate were collected and quantified on indicated days postinfection. HepG2 under hypoxia condition expressed HIF-1α in abundance at 72 hours. The expression quantity of HIF-1α under hypoxia is more than that under normoxia (Figure 2A). The quantities under hypoxia were 14.4-, 3.4-, and 1.9-fold in noninfection (control), HYAD infection, and WT infection, respectively, higher than that under normoxia (***P<0.001). By the reason that cells can express HIF-1α in many different conditions such as oxygen partial pressure decline, stress response or other stimulations,26,27 HepG2 expresses HIF-1α under normoxia and hypoxia condition after infected with HYAD or WT. The amount of HIF-1α expression under normoxia was far less than that under hypoxia condition in control, so much as it only could be detected on the slim odds. The expression of E1A and HIF-1α has a disparity when these cells infected with WT under normoxia compared with hypoxia. E1A expressed under hypoxia was less than that under normoxia in WT (Figure 2B). The quantity of E1A under hypoxia was 5.0-fold (**P<0.01) higher than that under normoxia when cells infected with HYAD. Conversely, the quantity under hypoxia was only 73.3% of that under normoxia when cells infected with WT. This manifests that the replication of WT is declined under the control of the circumstance of hypoxia. A study had verified that adenovirus production decreased under hypoxia, which resulted from a decrease in viral protein levels, by the reason that the rate of cellular protein synthesis was reduced.28 In normoxic condition, E1A expression of HepG2 cells infected with HYAD was only 52.9% of that infected with WT. However, the former was 3.6 folds (*P<0.05) the latter under hypoxia. RT-PCR was applied to further detect the relation between normoxia/hypoxia and the transcription of E1A. We can see that after HepG2 cells were infected for 24 hours by HYAD, the transcription level was increased acutely under hypoxia (Figure 2C). And the standard curve line is shown in Figure 1. While under normoxia, the transcription level increased slightly. And in the WT infection group, the transcription under normoxia slightly descended under hypoxia compared with normoxia, presumably because of the inhibition of replication under hypoxia for wild adenovirus. This was agreed with the Western blot result. We observed that the HYAD prompted the infected cells expressing more E1A under hypoxia than under normoxia. This is consistent with the expression of HIF-1α.
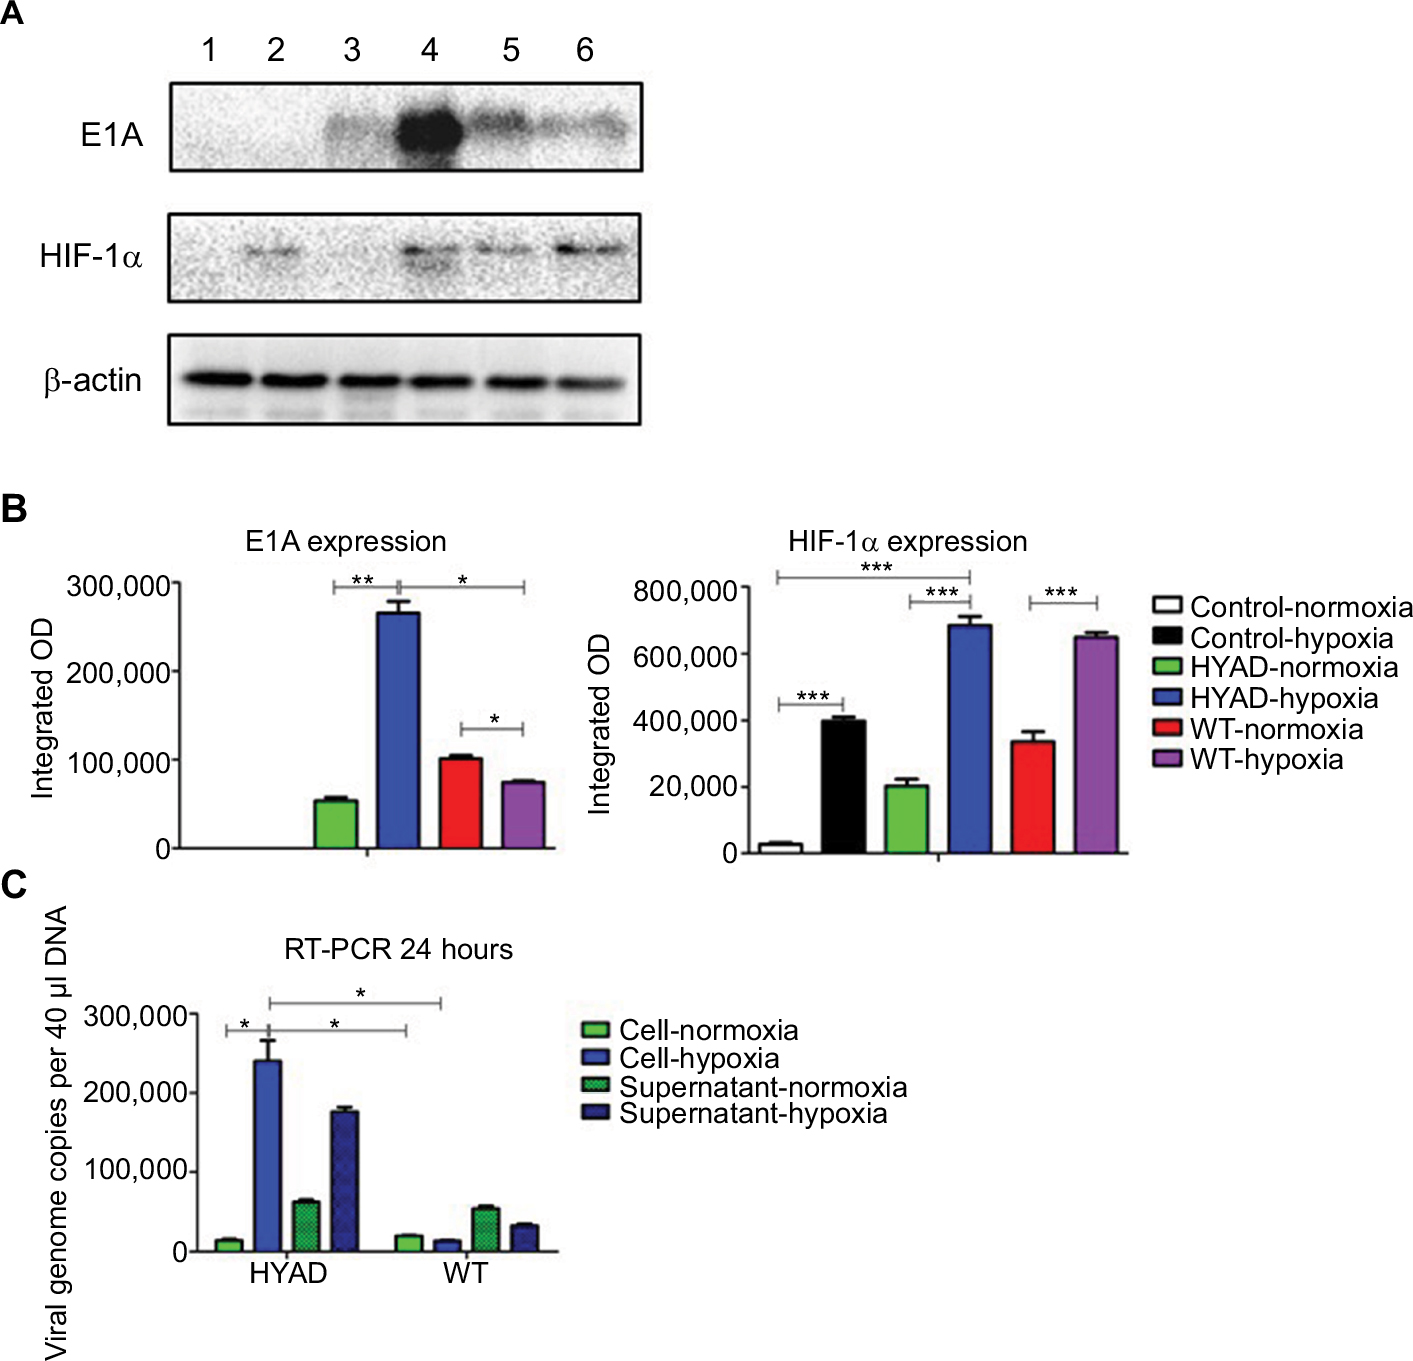 | Figure 2 Expression of HepG2 infected with HYAD vs WT under normoxia and hypoxia. Notes: (A) Western blot showed the expression of E1A and HIF-1α: 1) represented no virus infection under normoxia,2) no virus under hypoxia; 3) HYAD under normoxia; 4) HYAD under hypoxia; 5) WT under normoxia; and 6) WT under hypoxia. (B) Semiquantitative analysis of Western blot showed under hypoxia, the amount of HIF-1α was 14.4-, 3.4-, and 1.9-fold higher in control, HYAD, and WT than that under normoxia, respectively (***P<0.001). The amount of E1A in HYAD under hypoxia was 5.0 folds (**P<0.01) that in HYAD under normoxia and 3.6 folds (*P<0.05) that in WT under hypoxia. (C) Absolute quantification of E1A in RT-PCR revealed that after infected for 24 hours, the translation of E1A in HYAD group (at MOI 10) under hypoxia was 17.2-fold (*P<0.05) higher than that in HYAD under normoxia and 17.9-fold (*P<0.05) higher than that in WT under hypoxia. Abbreviations: HYAD, hypoxia-replicative oncolytic adenovirus; MOI, multiplicity of infection; WT, wild adenovirus type 5. |
The results mean E1A expresses at low level in normal oxygen partial pressure when hepatic tumor cells infected with HYAD. It indicates that hypoxia can intensely stimulate E1A expression in HYAD group, but has little impact on the counterpart of WT.
The influence of HYAD on proliferation, apoptosis, and necrosis on tumor and normal cells
After incubated for 24, 48, 72, and 96 hours, nearly the HYAD had no impact on the proliferation of LO2 cells whether under normoxia or hypoxia at low MOI (1 and 10) (Figure 3). At 96 hours, the disparity trend of change was obvious. When the MOI of HYAD was 10, there was no statistical difference in proliferation compared to control under normoxia. While the proliferation of WT could reduce by 26.6% (***P<0.001) in the same condition. There was no obvious difference for WT in LO2 and HepG2 groups at MOI 10 under normoxia compared with hypoxia. However, cells infected with HYAD represented disparity in proliferation in different oxygen environments. The inhibition ratios of proliferation were 49.8% (**P<0.01) in HepG2 and 18.5% (***P<0.001) in LO2, respectively. While at MOI 100, HYAD obviously restrained the propagation of the cells even under normoxia. In HepG2 group, the proliferation of control under hypoxia was 1.6 folds that of HYAD group at MOI 100 under normoxia. Conversely, the former was only 84% of the latter at MOI 10. This was due to the toxic side effects of adenovirus transfection, especially at high MOI.29 And this phenomenon was further under hypoxia. Remarkably, WT had an inhibiting effect on LO2, and the effect degree was in accordance with the MOI. We can conclude that WT has more inhibiting action on hepatic normal cells than HYAD and this kind of synthetic selective expression virus has just a little impact on nontumor cells unless high multiplicity infection. Especially, when the MOI of HYAD was 10, the inhibition ratio of HepG2 was 2.7-fold higher than that of LO2 under hypoxia. In spite of high inhibition ratio of proliferation at MOI 100 under nornoxia for HYAD, there were still disparities under normoxia vs hypoxia. In HepG2 group, the proliferation under normoxia was 4.7 folds (*P<0.05) that under hypoxia. And it was 1.7 folds (*P<0.05) in LO2 group. Relatively speaking, cells infected with WT did not represent obviously in this aspect.
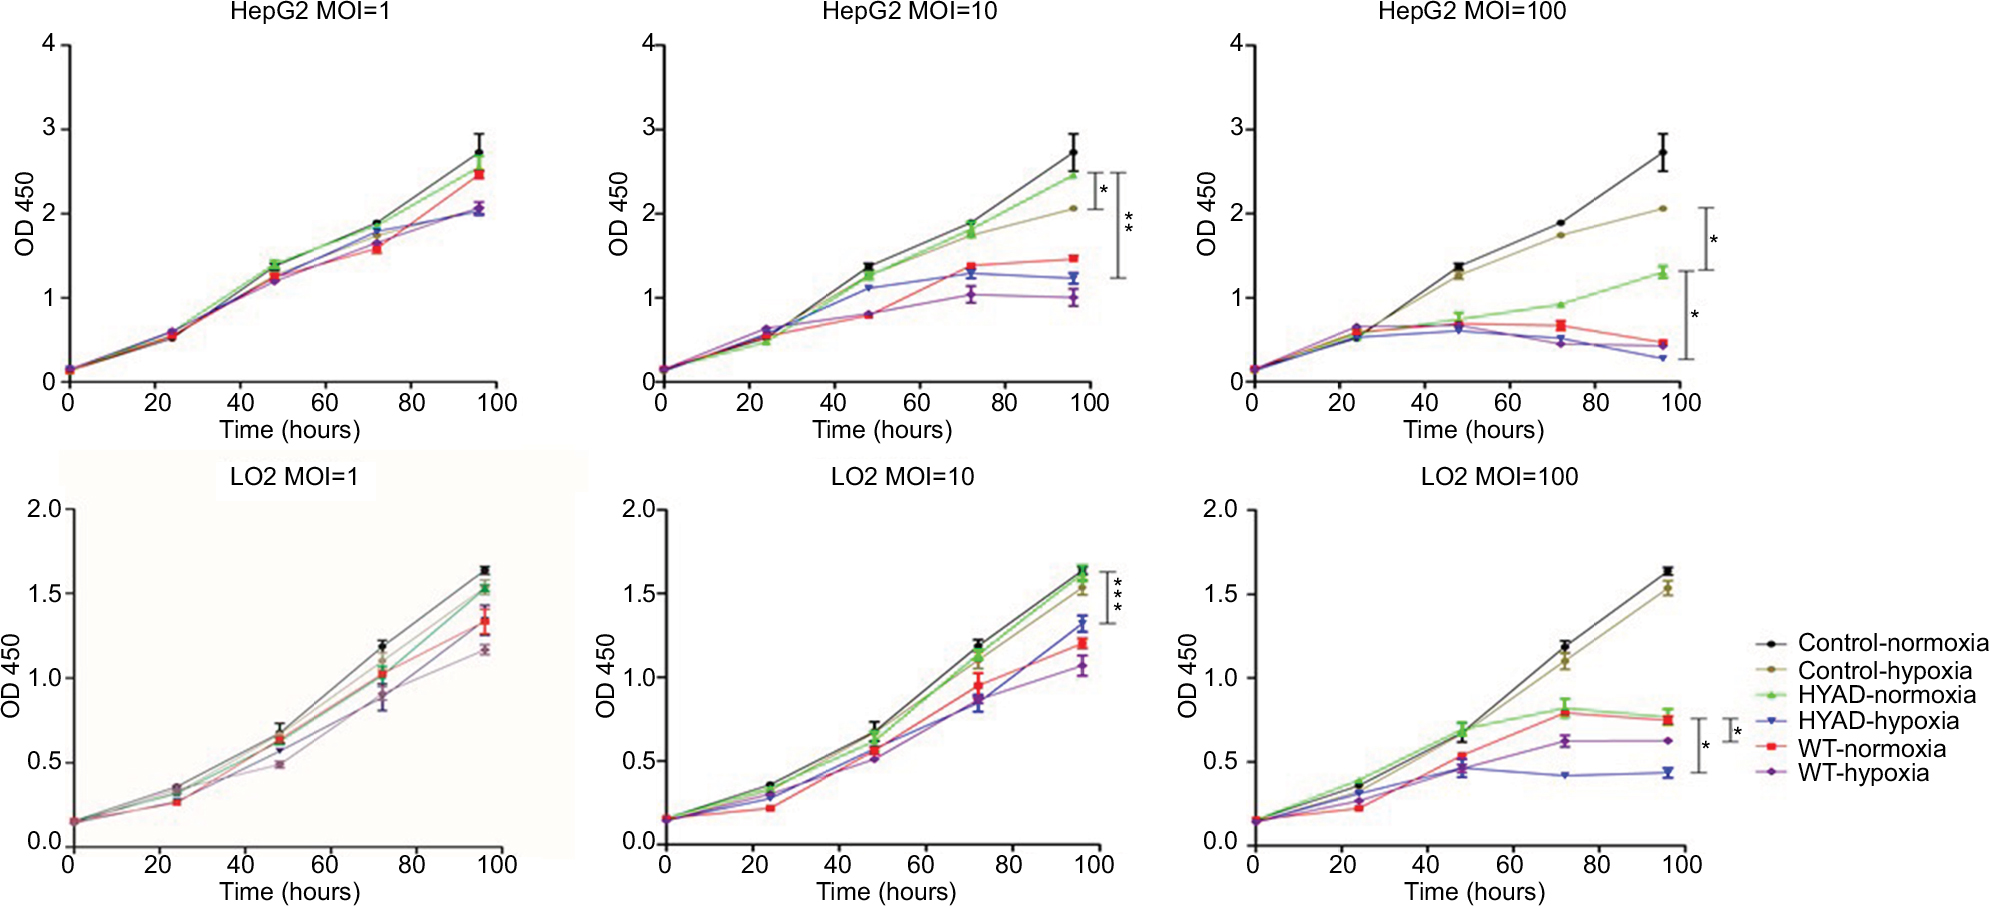 | Figure 3 proliferation of HepG2 and LO2 in control, HYAD, and WT group after being infected for 24, 48, 72, and 96 hours at MOI 1, 10, and 100, respectively. Notes: CCK-8 kit was used to detect the proliferation and the absorbance was measured at 450 nm. Cells were harvested at the indicated time. Data are the mean ± SD of three independent experiments. *P<0.05; **P<0.01; ***P<0.001. Abbreviations: CCK-8, cell-counting kit-8; HYAD, hypoxia-replicative oncolytic adenovirus; MOI, multiplicity of infection; WT, wild adenovirus type 5. |
The necrosis of LO2 infected with HYAD under normoxia was at low level, although the apoptosis was at high level (Figure 4). Relatively low proliferation rate of LO2 compared with HepG2 can explain this phenomenon. There was almost no contradiction that WT induced drastic necrosis and apoptosis under normoxia vs hypoxia. At 96 hours postinfection, the apoptosis and necrosis of HepG2 or LO2 infected with HYAD increased much under hypoxia more than that under normoxia. The fold values were 2.8 of apoptosis and 2.5 of necrosis in HepG2, and 2.5 of apoptosis and 5.6 of necrosis in LO2 (***P<0.001). The apoptosis and necrosis were a little higher under hypoxia than under normoxia when infected with WT. This can be explained by the replication inhibition results from the decline of oxygen partial pressure. All these predict that HepG2 as a kind of tumor cell line has more hypoxia sensitivity than LO2 cell line, and HYAD can induce an efficient killing of HepG2 cells under hypoxia. And the influence of HYAD on LO2 at low MOI can be neglected under normoxia.
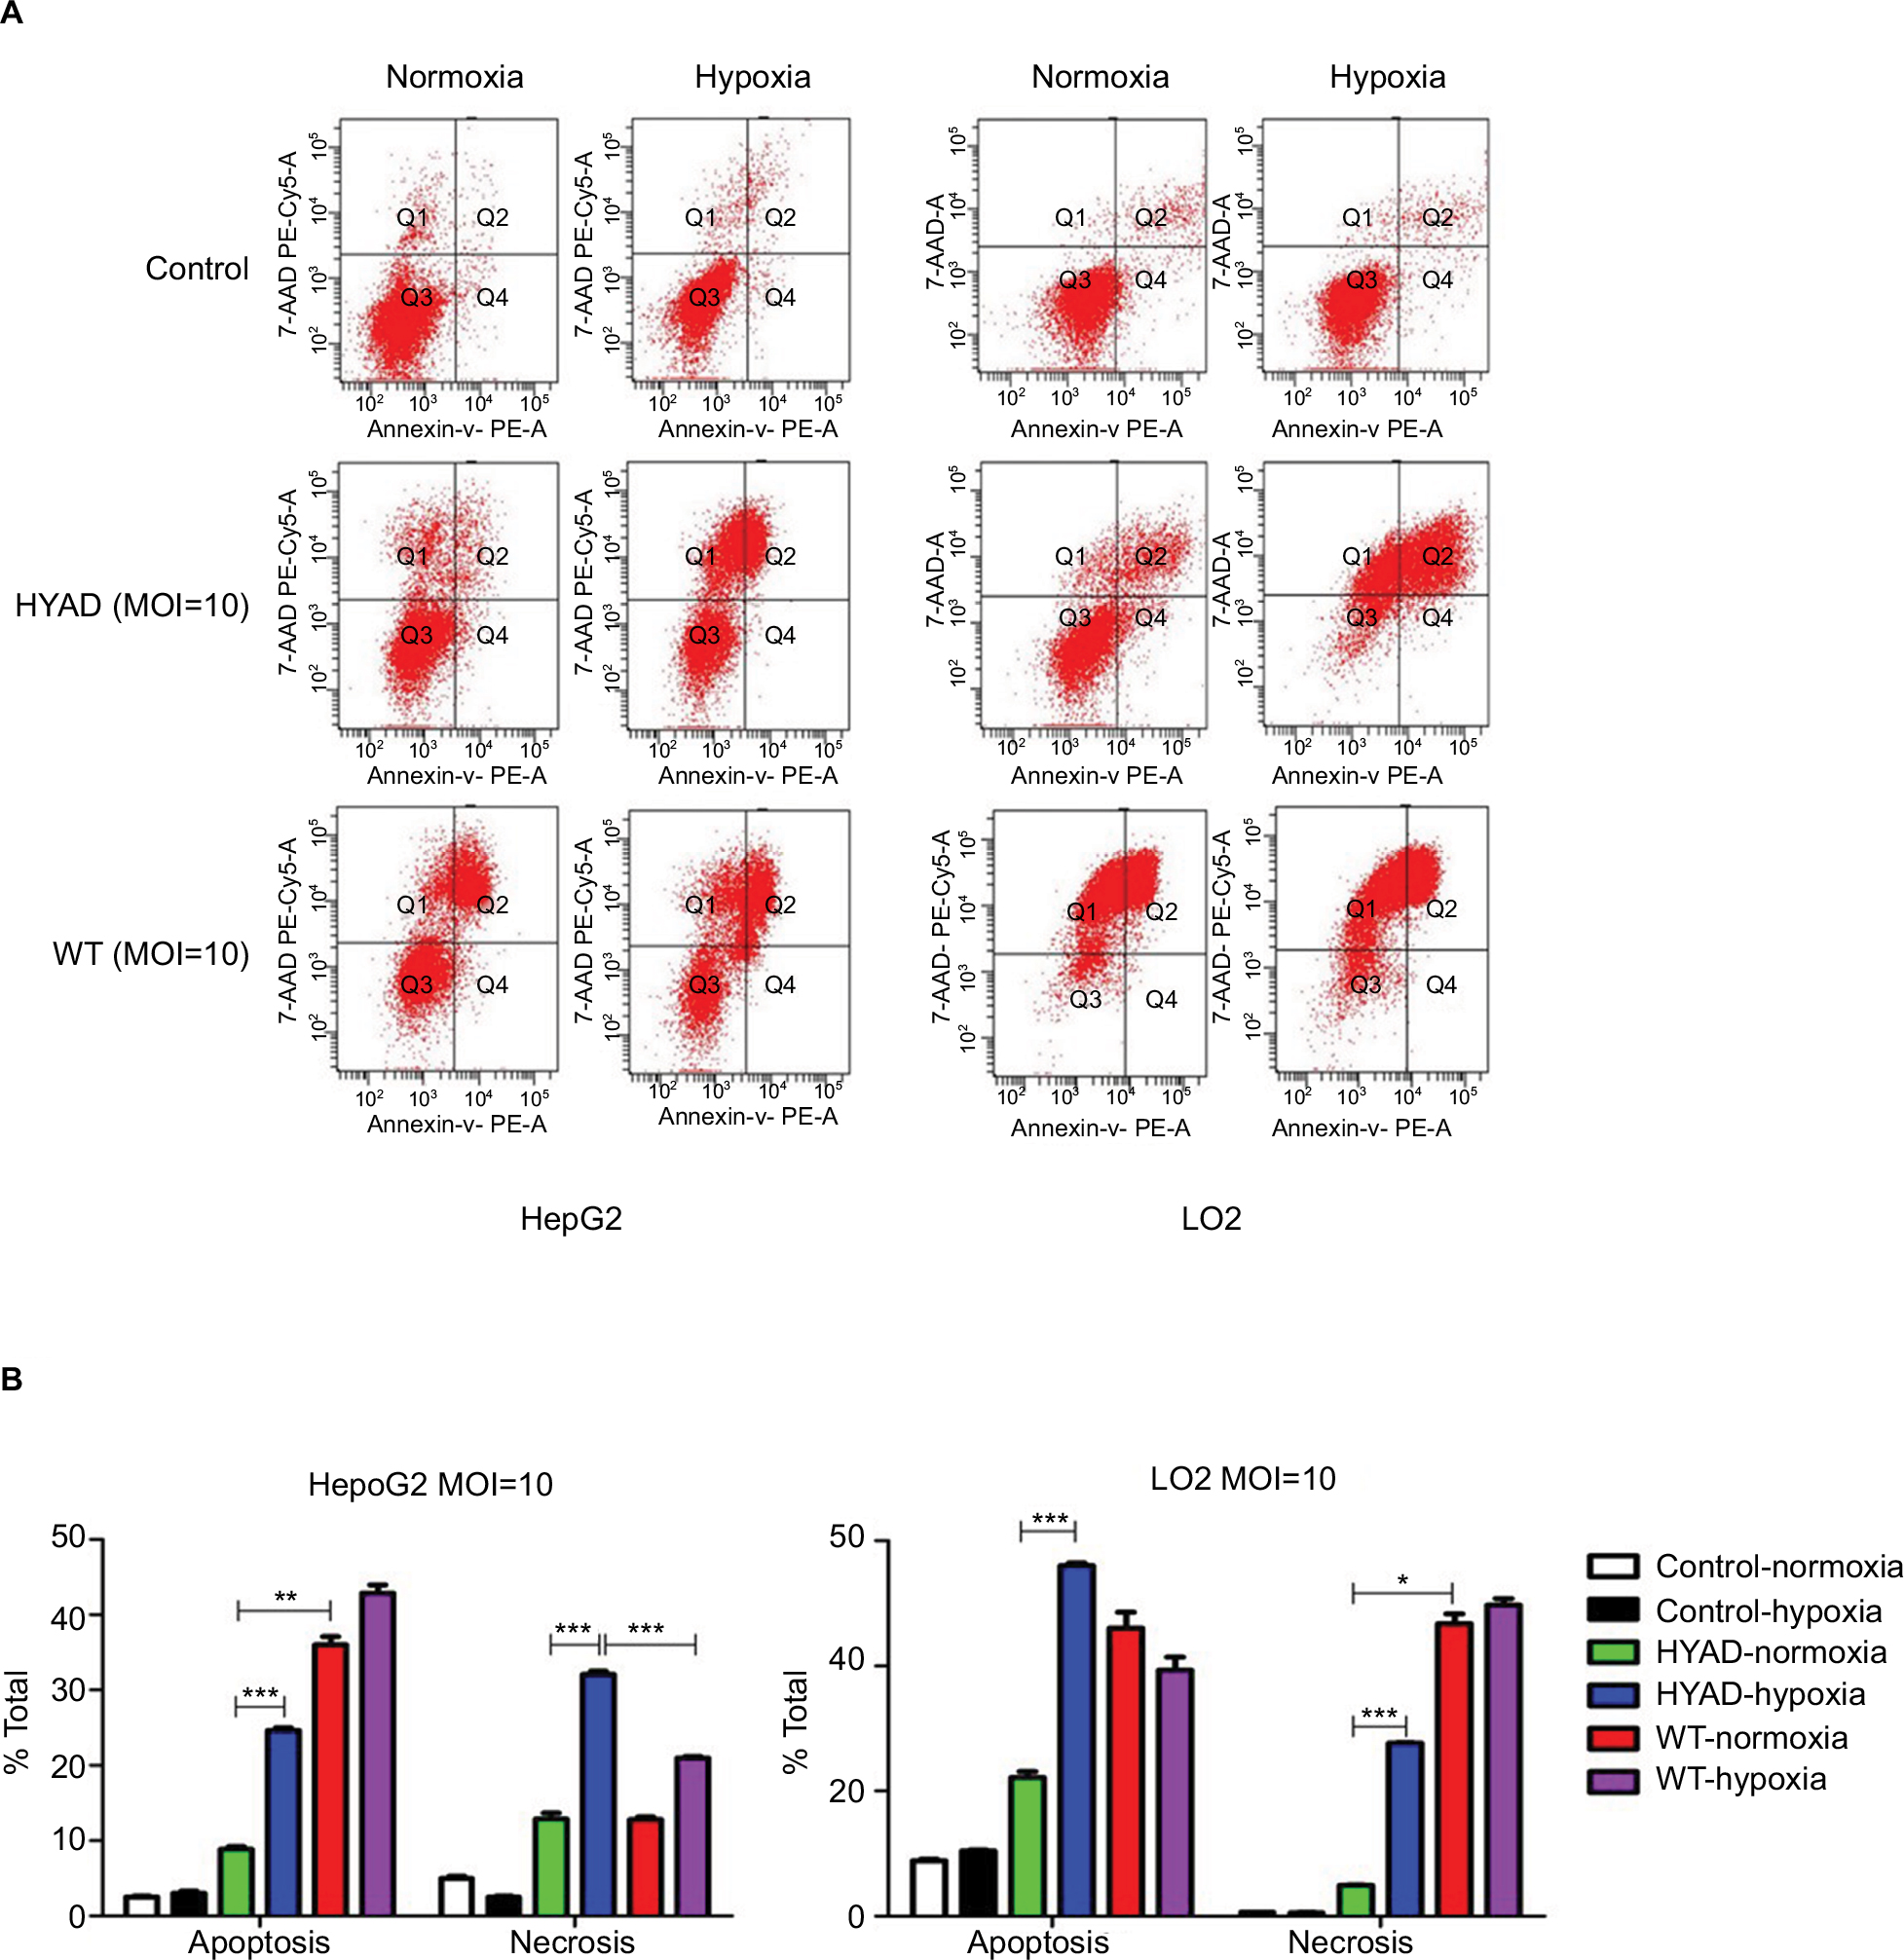 | Figure 4 Apoptosis and necrosis of HepG2 and LO2 cells infected with HYAD and WT under normoxia and hypoxia at 96 hours postinfection. Notes: (A) Flow cytometry analysis was applied to detect the apoptosis and necrosis with HYAD and WT at MOI 10. (B) The percentages of apoptosis and necrosis of all the cells were presented in the graphs. Data are the mean ± SD of three independent experiments. *P<0.05; **P<0.01; ***P<0.001. Abbreviations: HYAD, hypoxia-replicative oncolytic adenovirus; MOI, multiplicity of infection; WT, wild adenovirus type 5; 7-AAD, 7-aminoactinomycin D. |
The expressions of HYAD combined with interventional embolization in VX2 hepatic tumor models
To evaluate the antitumor effect of HYAD in interventional therapy model, VX2 liver tumor rabbit models were constructed. A 2.7F coaxial microcatheter system was advanced to super select the feeding artery of the tumor through a 4F Visceral Cobra in alternative femoral artery in each rabbit (Figure 5).
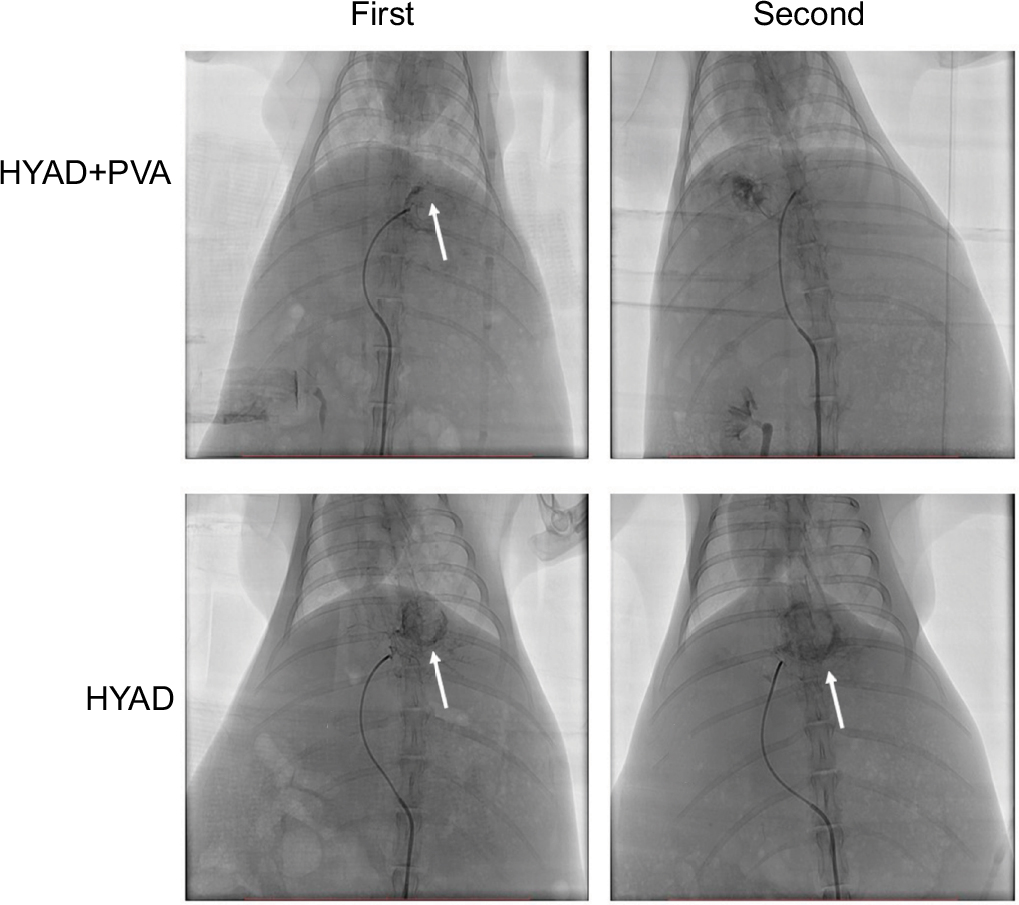 | Figure 5 DSA of VX2 liver tumor rabbit model. Notes: After the tumor matured, in treatment groups requiring PVA embolization, under fluoroscopic guidance, about 0.5 mL PVA particles in 100–300 µm size of mixture were injected into the blood supplying arteries of tumor in each rabbit, and the embolization ended as antegrade blood flow was completely static. One week later, groups A and B took a second injection of HYAD with 1×10⁹ PFU (1 mL PBS dilution). At first intervention in groups A and B, contrast dyeing of neoplasm was obvious after injecting contrast agent (marked by white arrow). One week later, because of PVA embolization, contrast dyeing of neoplasm could not be seen in group A but could be seen in group B. Abbreviations: DSA, digital subtraction angiography; HYAD, hypoxia-replicative oncolytic adenovirus; HYAD+PVA, HYAD combined with PVA particle embolization; PVA, polyvinyl alcohol. |
Rabbits were divided into six groups: A) injected with 1×10⁹ plaque forming unit (PFU; 1 mL PBS dilution) of HYAD through microcatheter followed by 100–300 µm polyvinyl alcohol (PVA) particle; B) injected with 1×10⁹ PFU (1 mL PBS dilution) of HYAD; C) injected with 1×10⁹ PFU (1 mL PBS dilution) of WT through microcatheter followed by 100–300 µm PVA particle; D) injected with 1×10⁹ PFU (1 mL PBS dilution) of WT; E) injected with 100–300 µm PVA particle; and F) injected with 1 mL PBS dilution. The rabbits of group A–F (in each group, n=5) were euthanatized, and the tumors were harvested at days 1, 3, and 7 postoperation, respectively. After 1 week, the rabbits of group A (n=5) and group B (n=5) were inserted with 4F sheath in the other artery and injected with 1×10⁹ PFU of HYAD the second time.
Double immunofluorescent labeling was applied to detect the expression of E1A and HIF-1α (Figure 6). At 1, 3, and 7 days after the first interventional manipulation, tumors were collected and five samples in each group were stained with immunofluorescent dye. E1A was stained with green label, HIF-1α was stained with red label, and cell nucleus was stained with blue (DAPI). Quantitative analysis showed that HIF-1α sustained high expression in group A. The expression peak was on the third day, and it was 2.2 (*P<0.05) and 3.8 (*P<0.05) times that on the first and seventh day, respectively. Although HIF-1α showed a gradual downward trend in group B, the quantity of HIF-1α on the first day was 2.5 times (*P<0.05) higher than that on the third day and 4.3 times (*P<0.05) higher than that on the seventh day. At the same time point, the expression of HIF-1α in group A was considerably higher than that in group B, because of PVA embolization. The former was 7.7-fold (*P<0.05) and 3.5-fold (*P<0.05) higher than the latter at day 3 and day 7, respectively.
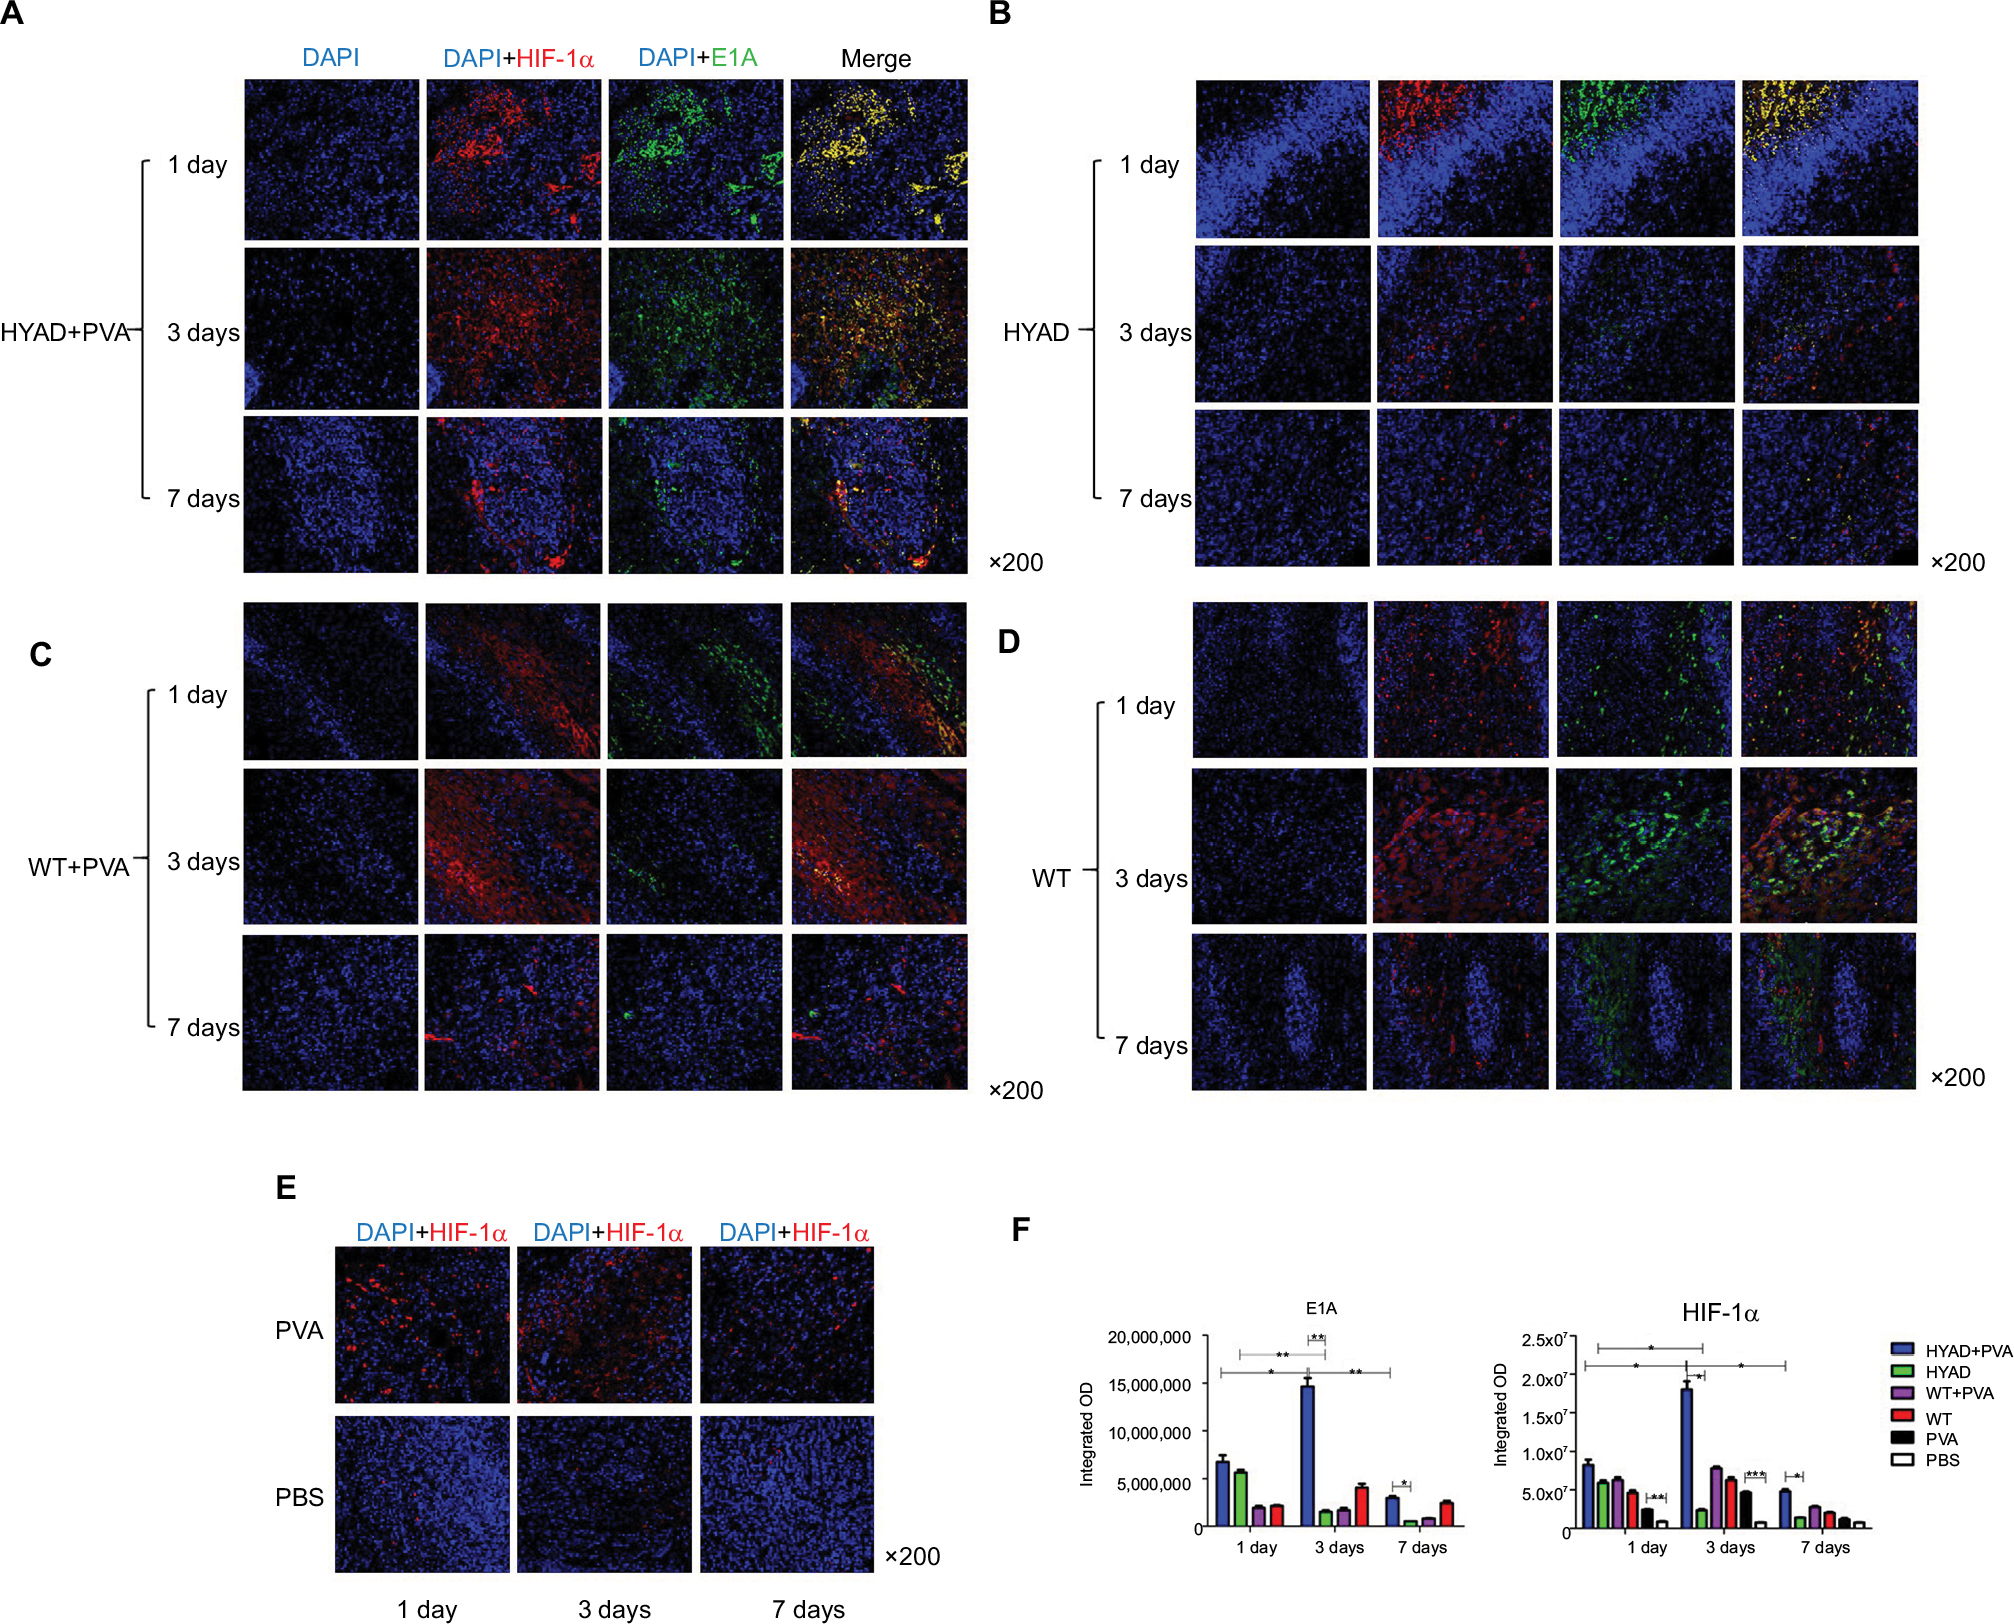 | Figure 6 Immunofluorescent staining of HIF-1α and E1A at days 1, 3, and 7 post the first interventional manipulation. Notes: (A–D) Double immunofluorescent labeling of HIF-1α and E1A in HYAD perfusion combined with PVA embolization, simple HYAD perfusion, WT perfusion combined with PVA embolization, and simple WT perfusion groups, respectively. (E) Immunofluorescent staining of HIF-1α in PVA embolization and PBS perfusion (control). (F) Semiquantitative analysis of the staining by integrated optical density demonstrating the expression levels in different groups. Each data point indicates mean ± SD. *P<0.05; **P<0.01; ***P<0.001. Abbreviations: HYAD, hypoxia-replicative oncolytic adenovirus; HYAD+PVA, HYAD combined with PVA particle embolization; PVA, polyvinyl alcohol; WT, wild adenovirus type 5 perfusion; WT+PVA, WT combined with PVA particle embolization. |
Similar situation presented in the E1A expression. In group A, E1A expression peaked on the third day postoperation as well, and it was 2.2 (*P<0.05) and 4.9 (*P<0.05) times that on the first day and seventh day, respectively. Simple HYAD perfusion also showed E1A expression decreased piecemeal. The quantity at day 1 was 3.7 (**P<0.01) folds and 11.1 folds (**P<0.01) that at day 3 and day 7, respectively. Huge distinction of E1A expression was represented between groups A and B. The fold values were 9.6 (**P<0.01) and 5.8 (*P<0.05) at day 3 and day 7, respectively, in group B. We can speculate that HYAD perfusion combined with PVA embolization will play a huge antitumor role compared with simple HYAD perfusion.
TUNEL assay can detect the apoptotic cells. TUNEL staining at day 3 postintervention revealed the killing effect. H&E staining showed the massive destruction of cellular structure in group A, which was more than that in simple HYAD perfusion group and PVA embolization group (Figure 7A). Apparently, HYAD perfusion with PVA embolization had the upper most apoptosis effect. It was 3.3 folds the simple PVA embolization (**P<0.01), and there was no significant statistical difference between HYAD perfusion and simple PVA embolization. Volume growth of carcinoma in situ (Figure 8) was in line with the effect of apoptosis almost in early stage (Figure 4).
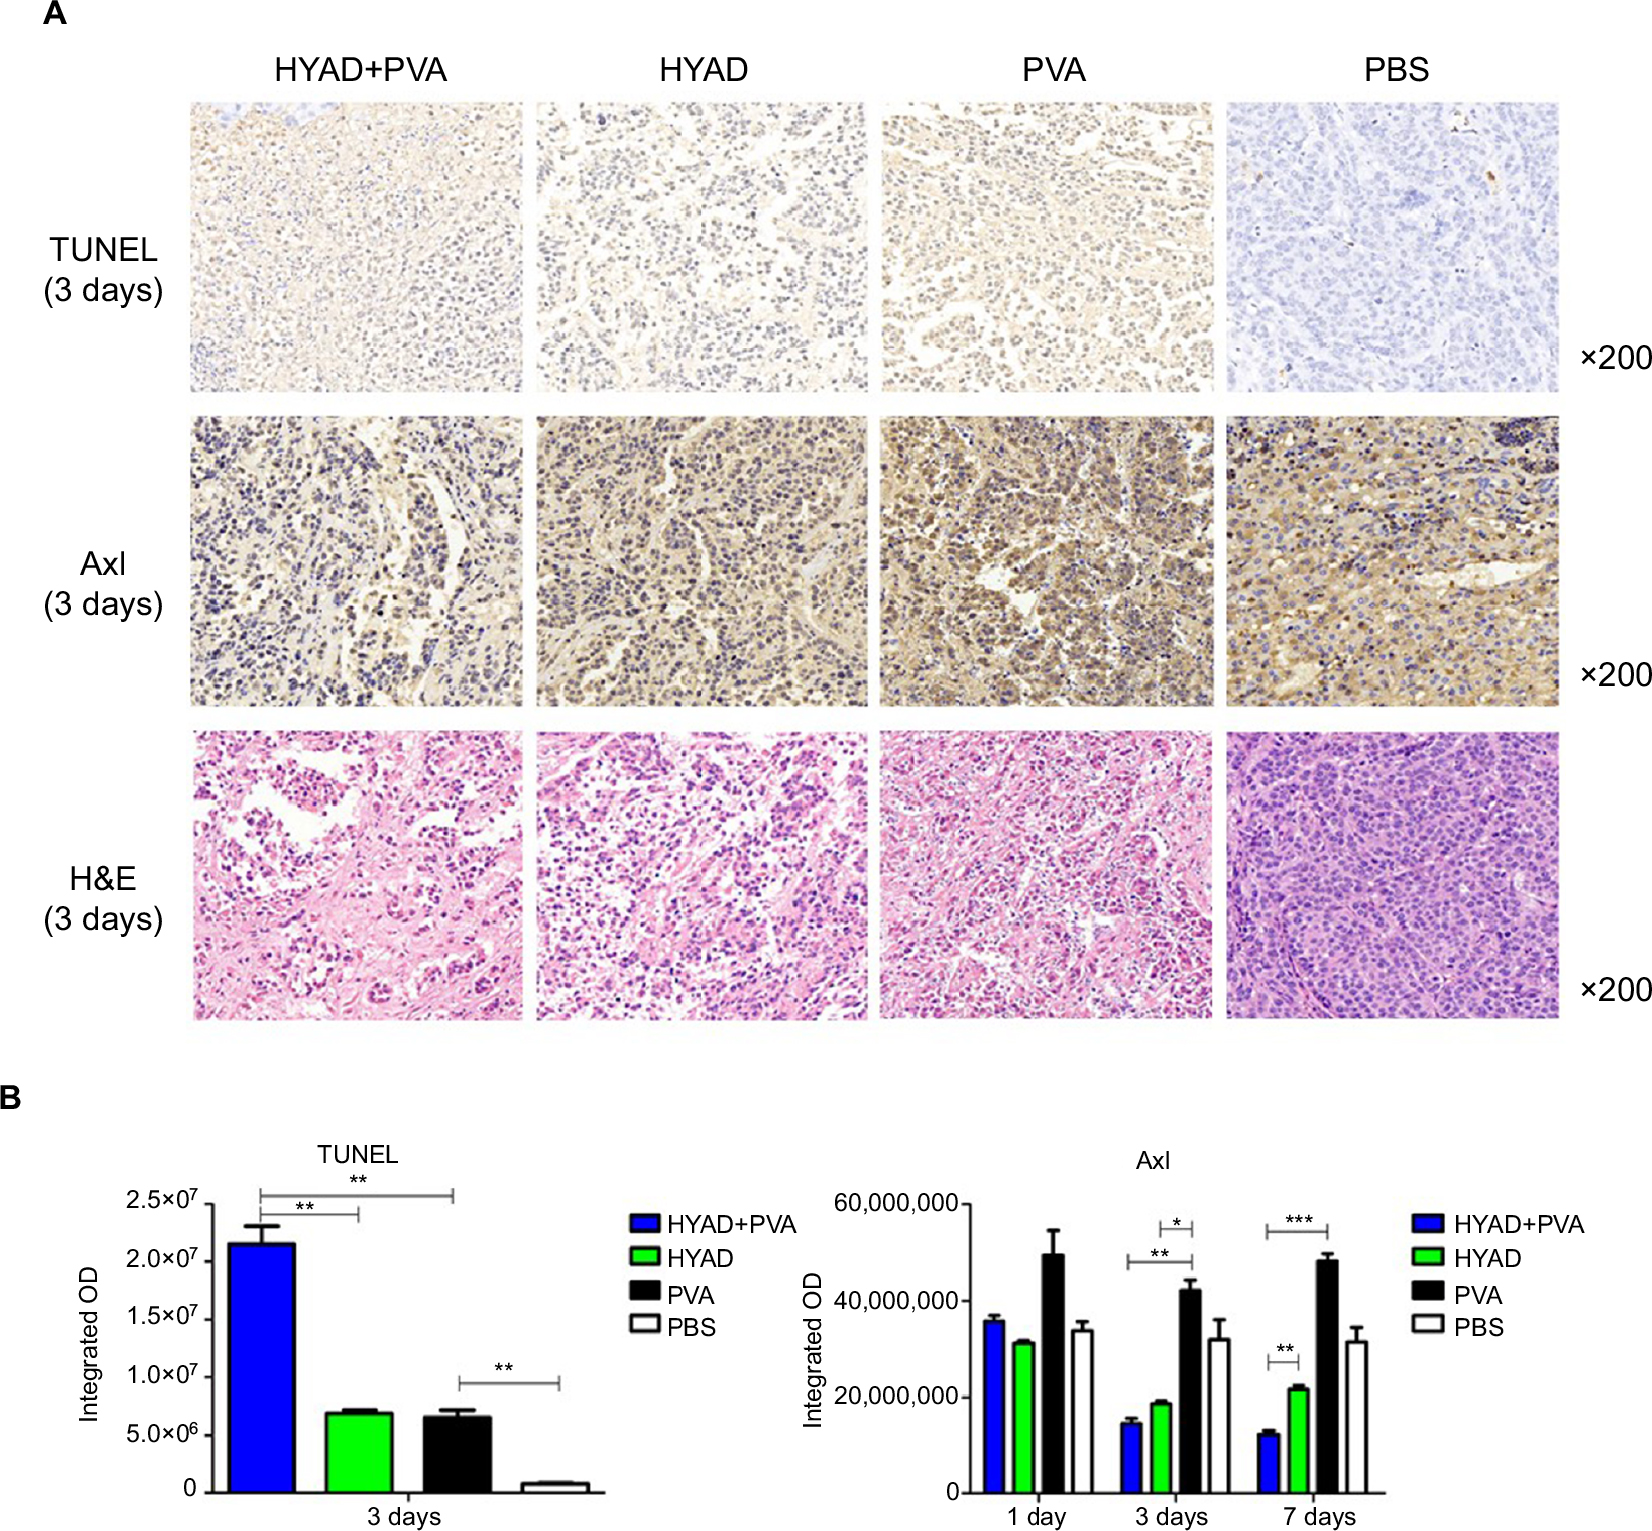 | Figure 7 TUNEL assay and tyrosine kinase Axl staining. Notes: (A) Rabbits were sacrificed, and the tumors were collected on the days 1, 3, and 7 after the first interventional manipulation. TUNEL and H&E staining on day 3 and Axl staining at days 1, 3, and 7 in each group were performed. (B) Semiquantitative analysis of the staining by integrated OD demonstrating the expression levels in different groups. Each data point indicates mean ± SD. *P<0.05; **P<0.01; ***P<0.001. Abbreviations: HYAD, hypoxia-replicative oncolytic adenovirus; HYAD+PVA, HYAD combined with PVA particle embolization; PVA, polyvinyl alcohol. |
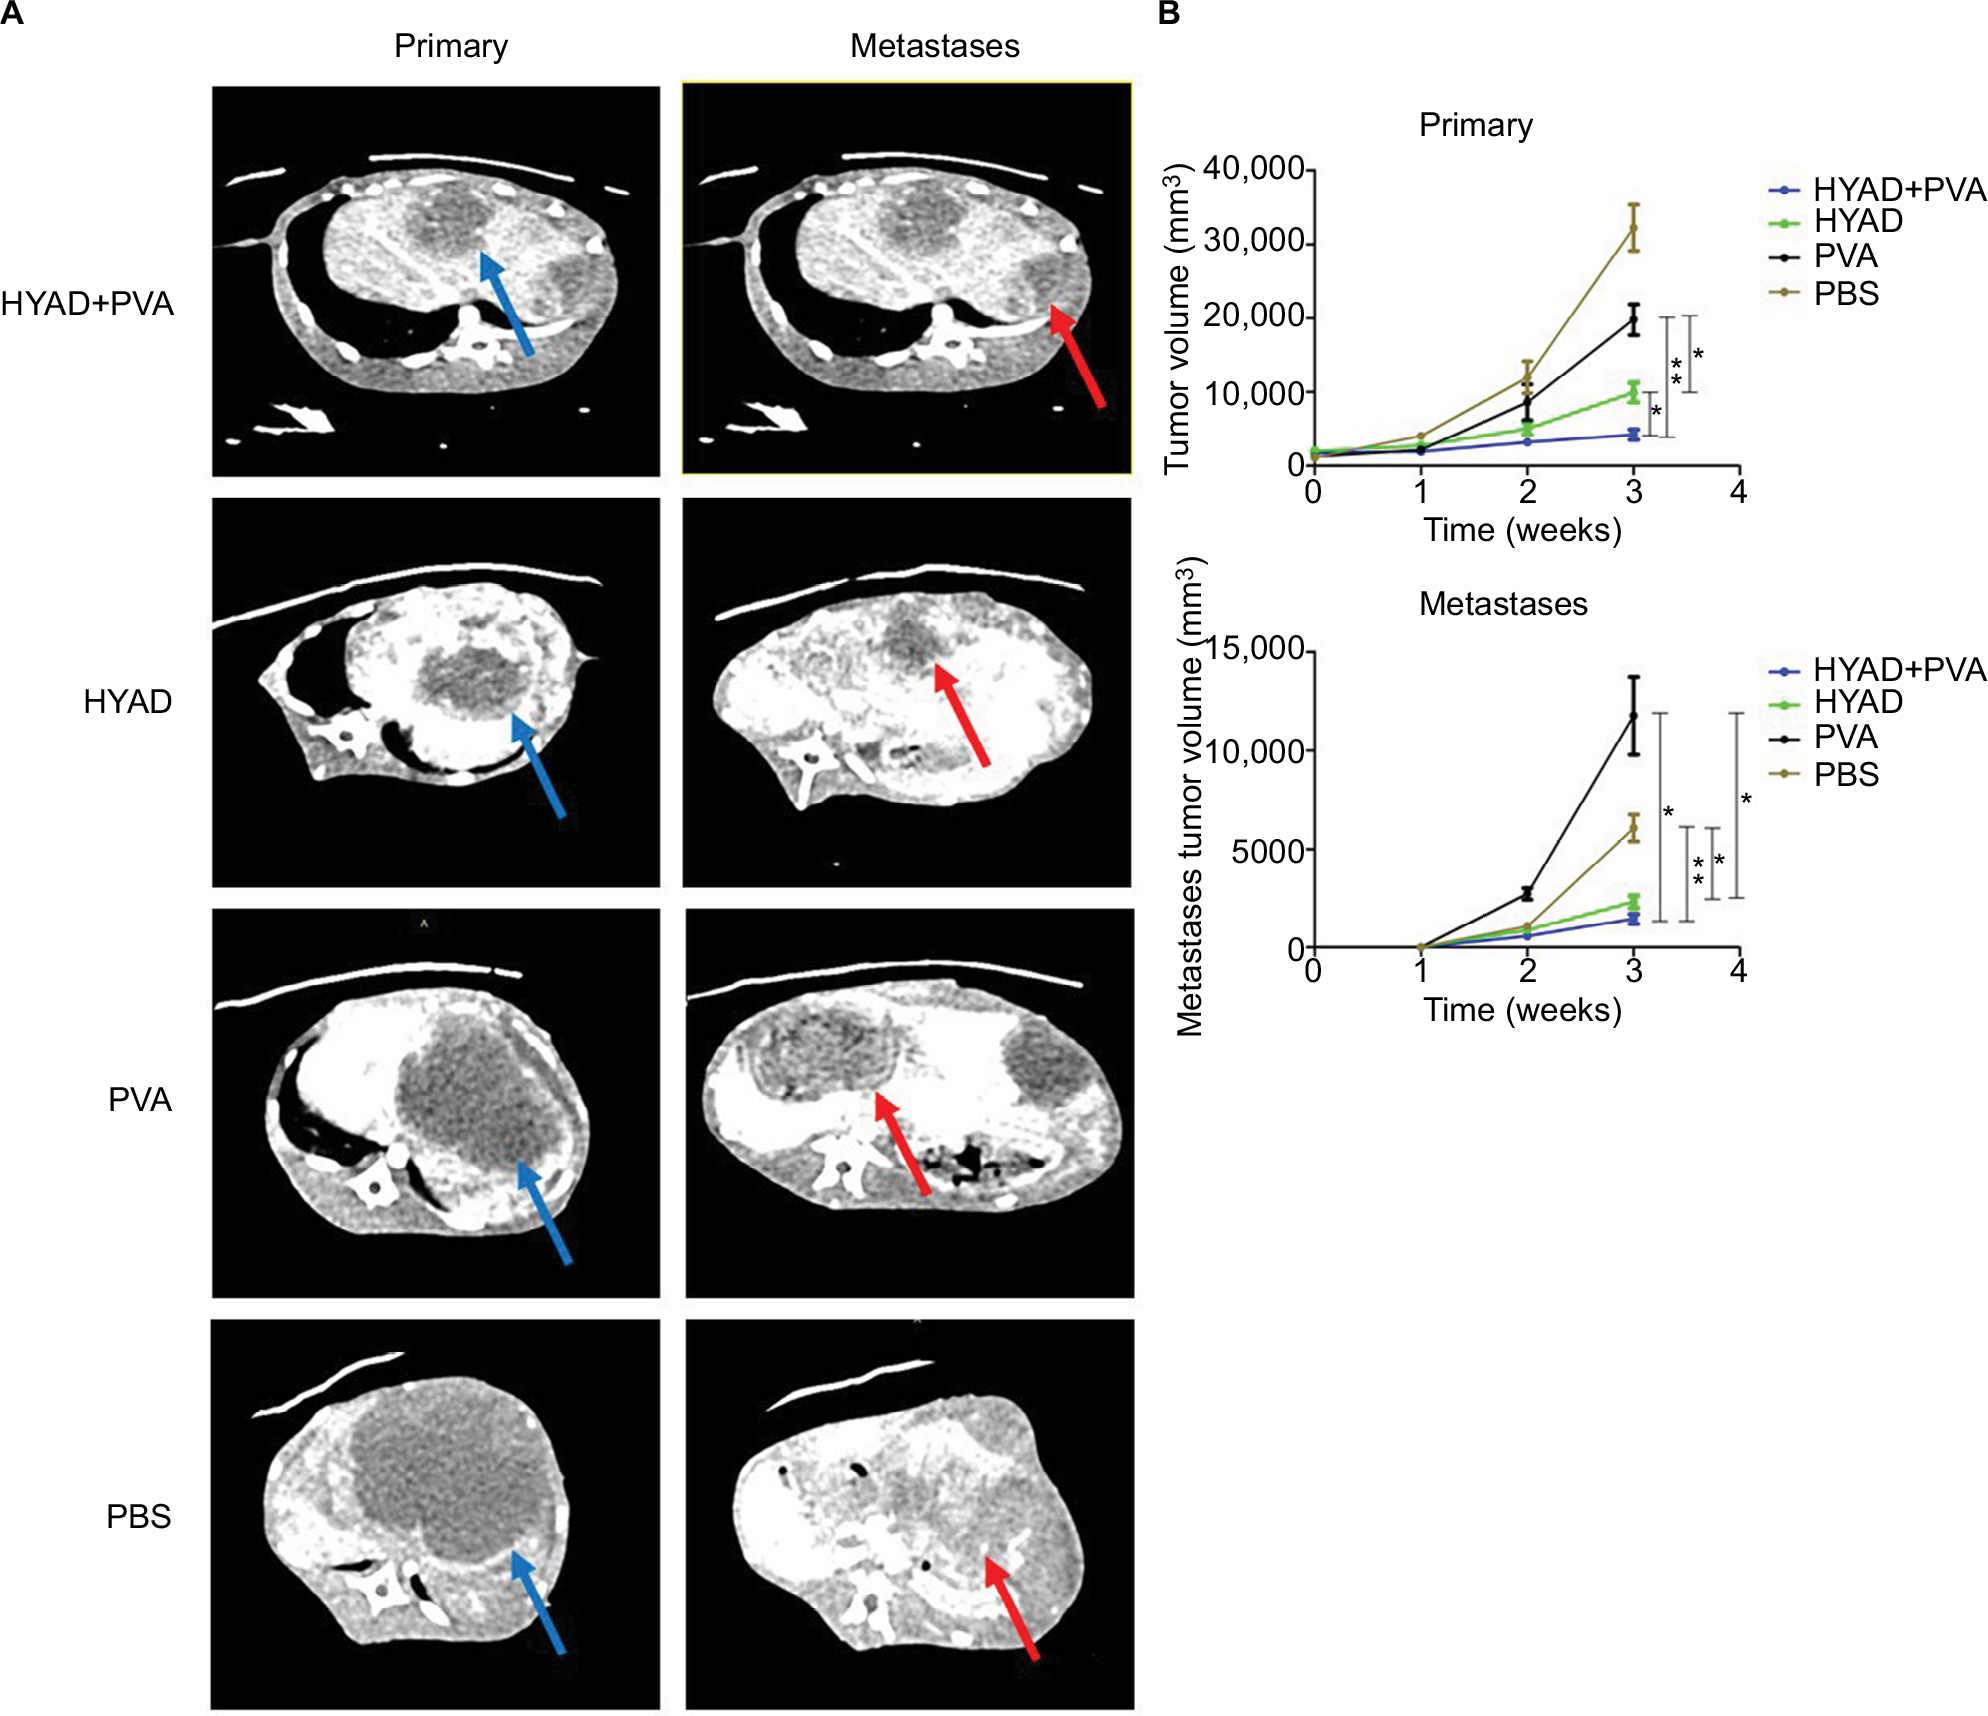 | Figure 8 Tumor volumes of primary and metastatic lesions detected by contrast-enhanced CT scan. Notes: (A) Tumors of primary and metastases were illustrated at 3 weeks post the first interventional manipulation (primary tumor marked with blue arrow, metastases marked with red arrow). (B) Before interventional operation and at 1, 2, and 3 weeks post the first interventional manipulation, the volumes of primary and metastatic lesions were detected by contrast-enhanced CT scan. Each data point indicates mean ± SD. Abbreviations: HYAD, hypoxia-replicative oncolytic adenovirus; HYAD+PVA, HYAD combined with PVA particle embolization; PVA, polyvinyl alcohol. |
Immumohistochemical staining of anti-Axl showed that this invasive and metastatic protein maintained high-level expression after embolization, which exceeds the PBS groups (Figure 7B). Expression quantity in HYAD perfusion combined with embolization fell as much as 65.5% (**P<0.01) compared with that in PVA group at day 3. And at the same time point, the simple HYAD perfusion fell 55.6% (*P<0.05). On the seventh day, the decreased values were 74.3% (***P<0.001) and 55.2% (***P<0.001), respectively. Some studies have demonstrated that HIF-1α bound directly to Axl to activate its expression.30,31 And Axl is an independent factor influencing prognosis and recurrence.32 Unfortunately, embolization can cause necrosis, meanwhile still induce metastases which can be attributed to HIF-1α. Therefore, the PVA embolization group had the biggest volume of intrahepatic metastatic tumor, which increased by 94.0% compared with that of PBS. In view of the inhibiting effect of E1A for Axl, HYAD combined with embolization and simple HYAD perfusion presented inhibiting metastases (Figure 8). All these are consistent with the expression of HIF-1α and E1A.
Antitumor effect of HYAD combined with interventional embolization on orthotopic hepatic tumors
Spiral contrast-enhanced CT scan was used to assess the growth status of tumors in situ and intrahepatic metastases at 1, 2, and 3 weeks after the first interventional manipulation (Figure 8). In the orthotopic hepatic VX2 tumor models, HYAD injected into hepatic artery followed by PVA particle embolization could inhibit the tumor more strongly than the group of simple HYAD perfusion. At the last predicted time point (3 weeks), volume of the latter group was 1.75 folds as big as the former (*P<0.05). HYAD combined with PVA embolization and simple HYAD perfusion reduced mean tumor volumes by 78.6% (**P<0.01) and 50.0% (*P<0.05), respectively, compared with simple PVA embolization. PVA embolization just reduced the tumor volumes by 38.6% vs PBS, although it had a strong inhibiting efficacy at the first week postembolization, which could be attributed to the generation of HIF-1α leading to the angiogenesis and glycometabolism conversion of the surviving tumor cells. By targeting the surviving tumor cells at the region expressing HIF-1α, HYAD can continue killing the potential tumor cells of resurgence.
And the enhanced scan verified that HYAD combined with PVA embolization could restrain intrahepatic metastases, which was superior to the simple HYAD perfusion group and PVA embolization group. The mean volume of intrahepatic metastases of PVA embolization group was nearly 1.9 folds that of the control (PBS) group. Nevertheless, the counterpart of HYAD combined with PVA embolization group and simple HYAD perfusion group reduced by 72.1% (**P<0.01) and 55.4% (*P<0.05) compared with PBS group, respectively. The results are in accordance with the inhibition of the Axl by E1A (Figure 7), a protein reduces invasion, mobility, and metastases of the cells in primary lesion.
The correlation analysis of expression proteins HIF-1α and E1A in orthotopic tumor tissue
In order to uncover the varying and hidden correlation between the two proteins of HIF-1α and E1A over time, we applied the ImageJ software to analyze the double immunofluorescent staining (Figure 9). The Pearson’s correlation coefficients (Pearson’s-Rr) of HYAD perfusion combined with PVA embolization were 0.88, 0.78, and 0.87 at days 1, 3, 7, respectively, and in the simple HYAD perfusion, were 0.87, 0.81, and 0.66 at days 1, 3, 7, respectively. While in the groups of wild adenovirus perfusion combined with PVA embolization and simple wild adenovirus perfusion, the Pearson’s-Rr were low at days 1 and 3, which verged on 0. These results follow the rule that two proteins have a positive linear correlation when Pearson’s-Rr is close to 1, have a negative correlation when Pearson’s-Rr is close to –1, or have no correlation when Pearson’s-Rr is close to 0. All these verify that HYAD expresses under the control of hypoxia almost strictly, whereas the wild adenovirus expresses by itself with impregnability of hypoxia nearly at early stage.
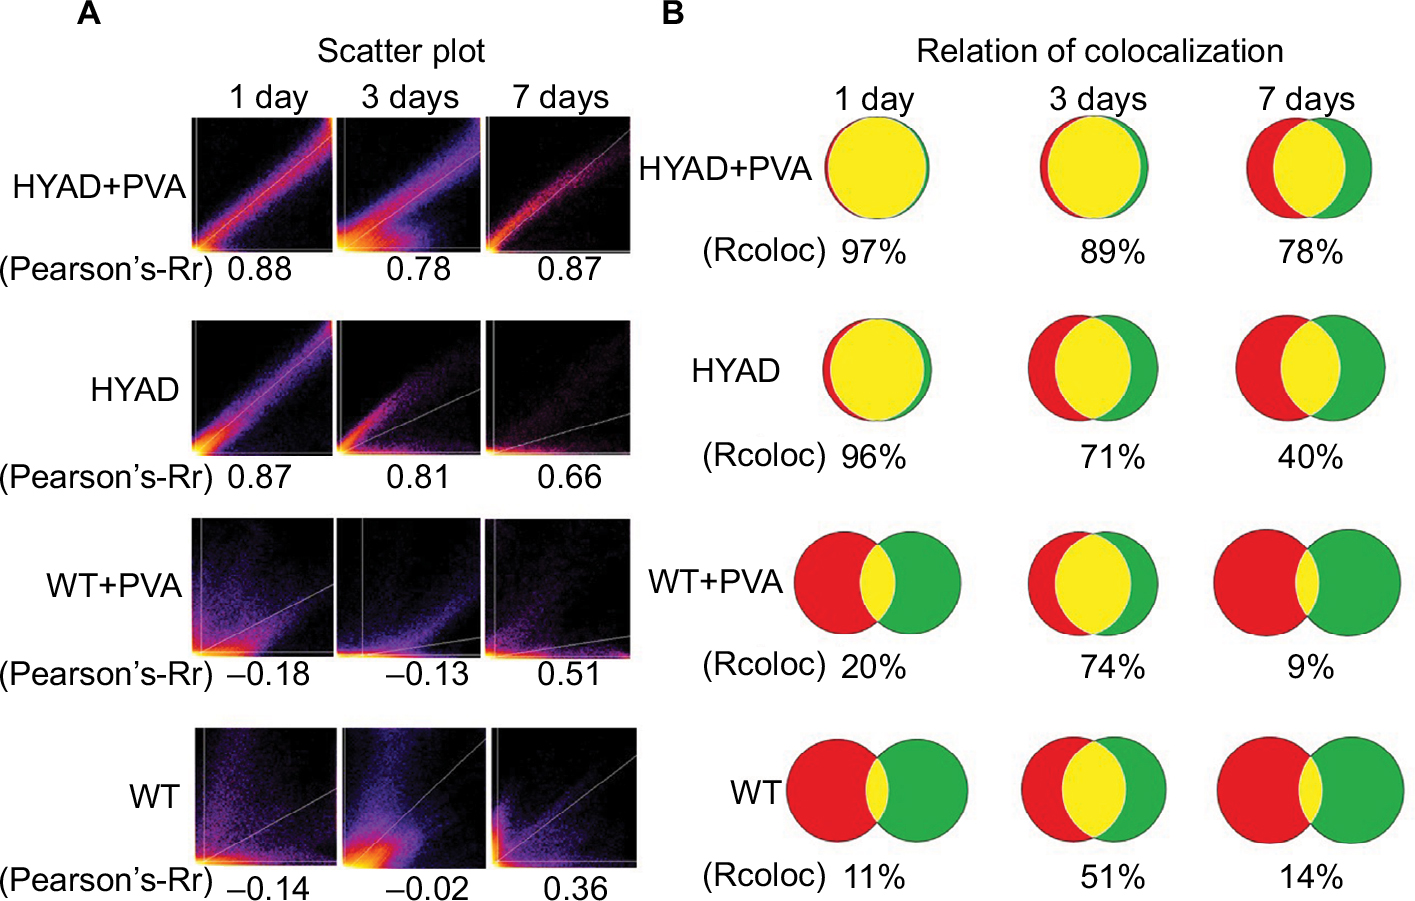 | Figure 9 Correlation analysis of expression proteins HIF-1α and E1A. Notes: (A) Scatter plots were shown of groups A, B, C, and D at days 1, 3, and 7 postmanipulation, and the Pearson’s correlation coefficient (Pearson’s-Rr) of each time point was analyzed, respectively. (B) Colocalization was illustrated as overlapping circles. Red circles represent HIF-1α, green circles represent E1A, and yellow areas represent the colocalization of HIF-1α and E1A. Rcoloc was represented in terms of percentages. Abbreviations: HYAD, hypoxia-replicative oncolytic adenovirus; HYAD+PVA, HYAD combined with PVA particle embolization; PVA, polyvinyl alcohol; Rcoloc, relation of colocalization; WT, wild adenovirus type 5 perfusion; WT+PVA, WT combined with PVA particle embolization. |
Further relation of colocalization (Rcoloc) analysis revealed the correlation of expression areas between HIF-1α and E1A. In the wild groups, the color correlation were 20% and 11% in the group of WT perfusion combined with PVA embolization and the group of simple WT perfusion at day 1, respectively. In the group of HYAD perfusion combined with PVA embolization, the Rcoloc was 97%, 89%, and 78% at days 1, 3, 7, respectively, and in the group of simple HYAD perfusion, Rcoloc was 96%, 71%, and 40%, respectively.
Discussion
Transcatheter embolization has become a mainstay treatment for intermediate and advanced liver cancer patients.33 While hypoxia of surviving tumor cells after embolization is the main reason for recurrences and metastases of primary lesion, and especially, the incomplete embolization accounts for more deteriorative phenotype. Many targeted agents have been developed for targeting angiogenesis and glycometabolism conversion due to hypoxia such as sorafenib and 3-bromopyruvic acid.34,35 Although these drugs affect the signal paths inducing tumor progression, the surviving tumor cells are still viable induced by molecular resistance.36,37 Therefore, targeting the surviving tumor cells under hypoxia and directly killing them has been a vital plot for the treatment after transcatheter embolization. The main emphasis is placed on the problem of HIF-1α expression, which is the malignant phenotype attribution as well as cancer-specific representation postembolization.
Herein, we constructed a synthetic adenovirus with the characteristic of selective expression under hypoxia/HIF-1α, intending to kill the surviving tumor cells or the tumor cells in situ without complete embolization. The results agree with other studies that have revealed tandem HREs can promote the expression downstream under hypoxia microenvironment.38,39 Expression protein E1A of adenovirus endows its capacity of eliciting apoptosis and inhibiting metastases of surviving tumor cells (Figure 8).
Western blot validates that E1A expression is dependent on the expression of HIF-1α and PCR analysis further confirms that under hypoxia, the amount of E1A transcription is much more than that under normoxia by absolute quantification. Although there is slightly leaky expression after infected by HYAD under normoxia, the necrosis of LO2 is not apparent, which differs from HepG2. We can speculate that HepG2 cell line has a more sensitive peculiarity than LO2 cell line to HYAD. In spite of the relatively small impact on LO2, at high titers, the synthetic adenovirus still has a strong inhibition to the proliferation of the normal hepatic cells (Figure 3). Therefore, avoiding high titers viruses systemic delivery is critical for reducing liver damage. Local delivery of synthetic adenovirus through supply artery can be a good means of reinforcing therapeutic effects and eschewing side effects. In addition, in vivo, adenovirus in the blood circulation by vein injection can be neutralized by preexisting antibodies.40 And some studies have verified that virus mainly expresses and replicates at the selected area by feeding artery perfusion other than the nonselected area.41 Hence we can hypothesize that the adverse effect will be reduced to the minimum by this means and local perfusion can be an optimized means for delivering vectors to the lesion.
PVA embolization following HYAD perfusion renders the virus avoiding being largely swept off before transfecting into target cells owing to supply blood occlusion. Above all, hypoxia endowed by embolization provides the critical condition in essence involving HYAD replication and dispersion in surviving tumor region. In contrast, simple virus perfusion cannot satisfy the sake of taking maximum advantage of HYAD, although it presented high expression at early stage. HIF-1α was passively expressed because of cellular stress from being transfected.26,27 The expression level of HIF-1α further reduced rapidly after transfection from original low level (Figure 6). Therefore, in transarterial perfusion group, E1A expression of HYAD stepped into swift descent and demonstrated limited effect in inhibiting tumor growth and metastases (Figure 8). Correlation analysis highlights that HIF-1α and E1A harbor positive correlation and colocalization in HYAD combined with embolization group as time passed. While in simple HYAD perfusion, the correlation presented poor performance over time after early stage (Figure 9). In control, simple WT perfusion and WT perfusion combined with PVA embolization presented poor performance in correlation all the time. It figures out that the expression area of WT is not according to hypoxia area but catheter transmission area, and it replicates by itself.
In view of disparity of expression quantity and expression duration, the apoptosis and Axl inhibition in HYAD perfusion combined with embolization all presented the uppermost effect (Figure 7). As a consequence, the inhibiting proliferation in primary lesion and intrahepatic metastases can achieve the best effect by this means (Figure 8).
The expression levels of HIF-1α and E1A in each interventional operation group were assessed by immunofluorescent staining. Simple PVA embolization made an expression peak of HIF-1α at day 3, and at day 7, the expression of HIF-1α declined because of massive necrosis of the tumor cells due to oxygen partial pressure and nutrition supply declined. This result agrees with the early research in VX2 hepatic tumor rabbit model.42,43 Likewise, in the group HYAD perfusion combined with PVA embolization, the expression peak of HIF-1α appeared on the third day postoperation and declined on the seventh day. While the HIF-1α expression quantity of HYAD perfusion combined with PVA group was almost 3.4 folds that of simple PVA embolization group on the first day (on the third day 3.6 folds, *P<0.05; on the seventh day 1.3 folds, **P<0.01). By the reason that hepatic cells may be in the state of stress after being infected with virus, these cells can express a huge amount of HIF-1α, which is not simply induced by hypoxia. So, we can speculate that the expressions of HIF-1α from tumor cells and that of E1A from HYAD are at the state of mutual promotion in the tumor microenvironment. Correspondingly, the expression of E1A follows the variation tendency of HIF-1α. The similar phenomenon can be seen in the group of simple HYAD perfusion. However, the two groups differed dramatically in the profile of expression. In the group of simple HYAD perfusion, the expression peak of E1A was at day 1, and it gradually fell thereafter, which was congruous with the HIF-1α. The expression of HIF-1α of HYAD perfusion combined with PVA embolization was 1.2 folds that of simple HYAD perfusion at day 1, 6.6 folds at day 3 (*P<0.05), and 1.1 folds at day 7 (*P<0.05). The E1A was 1.2 folds at day 1, 7.3 folds at day 3 (**P<0.01), and 3.0 folds at day 7 (*P<0.05), respectively.
We can conclude that HYAD perfusion combined with PVA embolization can maintain the expression profile of HYAD under the control of hypoxia favorably. While simple HYAD perfusion cannot keep the expression and replication under the control of hypoxia completely at late stage, the possible reason may be that without embolization, the virus will be eliminated by the antibody of the blood and the HIF-1α will not be expressed persistently.40 The group WT perfusion combined with PVA embolization showed low expression level of E1A, which was unconformable with the expression of HIF-1α. While the group simple WT perfusion was agreed with HIF-1α, the underlying reason is that in spite of blood flush decline with embolization, hypoxia out of embolization significantly reduces WT replication, a kind of virus with self-replicating.
Several studies have confirmed that expression protein E1A harbors the capability of downregulating the invasion and migration protein such as tyrosine kinase Axl,44–46 which induces the tumor metastasis by NF-kB signal pathway.45 In recent years, Axl has emerged as a key facilitator of immune escape and drug resistance by cancer cells, leading to aggressive and metastatic cancers. Stimulation of HCC cell lines by Axl ligand growth arrest specific 6 (Gas6) enhances cell migration and invasion.47 E1A suppresses the signaling pathway of Axl and inhibits downstream molecules that are important for cancer metastasis, including Akt and NF-kB.48 We assess the migration of the tumor by intrahepatic metastases. As a result of inducing angiogenesis and glycolysis by HIF-1α, the tumors embolized by simple PVA particle easily become invasive and intrahepatic metastatic. While PVA embolization combined with HYAD perfusion can counteract this side effect in interventional therapy.
In recent years, immunotherapy has become the new standard of care for advanced HCC worldwide, considering that adjuvant treatment with sorafenib did not show any improvement in recurrence-free survival or OS.49 Overall, less side effects and higher rates of objective responses confer immunotherapeutics such as PD-1 or PD-L1 with the ability of replacing sorafenib from standard first-line treatment. Unfortunately, only 15%–20% of patients show objective responses to PD-1/PD-L1-targeted immunotherapy.50 This may be attributed to the tumor microenvironment, especially characterized by hypoxia, lack of nutrients and high concentration of acids, which will prevent T cells from proliferation and cytokine production.51 In view of efficient antitumor immune responses of oncolytic viruses playing a critical role in killing tumor, the combination of oncolytic viruses with immunotherapy may be a strong therapy modality.52
Conclusion
In summary, the synthetic HYAD can reach the highest potential of killing surviving tumor cells and inhibiting them to become invasive and metastatic when combined with transcatheter arterial embolization. HYAD can clean the hypoxic-resistant tumor cells after interventional embolization, and the HIF-1α expression induced by interventional embolization can promote expression and replication of HYAD with accurate targeting in turn. This combination therapy can increase the expression amount and duration of synthetic adenovirus. Targeting the microenvironment characteristic induced by embolization of hepatocarcinoma may be an important method of multimodal therapy combined with viral therapy.
Acknowledgments
We are grateful to Professor Ping Han in the Department of Radiology, Wuhan Union Hospital of Tongji Medical College, Huazhong University of Science and Technology for providing medical image equipment. This study was supported by grants (81371662 and 81601580) from National Natural Sciences Foundation of China.
Author contributions
HZ collected, designed, analyzed data, and wrote the manuscript; FY conceived the study and discussed data; FX, KQ, and BX performed the experiments in vivo; YL and BL performed the experiments in vitro; CZ conceived the study, supervised the whole process of the study, and wrote the manuscript. All authors contributed toward data analysis, drafting and revising the paper, gave final approval of the version to be published, and agree to be accountable for all aspects of the work.
Disclosure
The authors report no conflicts of interest in this work.
References
Heimbach JK, Kulik LM, Finn RS, et al. AASLD guidelines for the treatment of hepatocellular carcinoma. Hepatology. 2018;67(1):358–380. | ||
Song P, Cai Y, Tang H, Li C, Huang J. The clinical management of hepatocellular carcinoma worldwide: a concise review and comparison of current guidelines from 2001 to 2017. Biosci Trends. 2017;11(4):389–398. | ||
Arizumi T, Ueshima K, Minami T, et al. Effectiveness of sorafenib in patients with transcatheter arterial chemoembolization (TACE) refractory and intermediate-stage hepatocellular carcinoma. Liver Cancer. 2015;4(4):253–262. | ||
Erhardt A, Kolligs F, Dollinger M, et al. TACE plus sorafenib for the treatment of hepatocellular carcinoma: results of the multicenter, phase II SOCRATES trial. Cancer Chemother Pharmacol. 2014;74(5):947–954. | ||
Dufour JF, Hoppe H, Heim MH, et al. Continuous administration of sorafenib in combination with transarterial chemoembolization in patients with hepatocellular carcinoma: results of a phase I study. Oncologist. 2010;15(11):1198–1204. | ||
Lencioni R, Llovet JM, Han G, et al. Sorafenib or placebo plus TACE with doxorubicin-eluting beads for intermediate stage HCC: the SPACE trial. J Hepatol. 2016;64(5):1090–1098. | ||
Yang SL, Liu LP, Jiang JX, Xiong ZF, He QJ, Wu C. The correlation of expression levels of HIF-1α and HIF-2α in hepatocellular carcinoma with capsular invasion, portal vein tumor thrombi and patients’ clinical outcome. Jpn J Clin Oncol. 2014;44(2):159–167. | ||
Warfel NA, El-Deiry WS. HIF-1 signaling in drug resistance to chemotherapy. Curr Med Chem. 2014;21(26):3021–3028. | ||
Shah T, Krishnamachary B, Wildes F, et al. HIF isoforms have divergent effects on invasion, metastasis, metabolism and formation of lipid droplets. Oncotarget. 2015;6(29):28104–28119. | ||
Darby IA, Hewitson TD. Hypoxia in tissue repair and fibrosis. Cell Tissue Res. 2016;365(3):553–562. | ||
Mujcic H, Hill RP, Koritzinsky M, Wouters BG. Hypoxia signaling and the metastatic phenotype. Curr Mol Med. 2014;14(5):565–579. | ||
Tennant DA, Frezza C, MacKenzie ED, et al. Reactivating HIF prolyl hydroxylases under hypoxia results in metabolic catastrophe and cell death. Oncogene. 2009;28(45):4009–4021. | ||
Luo D, Wang Z, Wu J, Jiang C, Wu J. The role of hypoxia inducible factor-1 in hepatocellular carcinoma. Biomed Res Int. 2014;2014(3–4):1–11. | ||
Tang CM, Yu J. Hypoxia-inducible factor-1 as a therapeutic target in cancer. J Gastroenterol Hepatol. 2013;28(3):401–405. | ||
Aravalli RN, Cressman EN, Steer CJ. Cellular and molecular mechanisms of hepatocellular carcinoma: an update. Arch Toxicol. 2013;87(2):227–247. | ||
Li S, Yao D, Wang L. Expression characteristics of hypoxia-inducible factor-1α and its clinical values in diagnosis and prognosis of hepatocellular carcinoma. Hepat Mon. 2011;11(10):821–828. | ||
Dai CX, Gao Q, Qiu SJ, et al. Hypoxia-inducible factor-1 alpha, in association with inflammation, angiogenesis and MYC, is a critical prognostic factor in patients with HCC after surgery. BMC Cancer. 2009;9:418. | ||
Yamamoto Y, Nagasato M, Yoshida T, Aoki K. Recent advances in genetic modification of adenovirus vectors for cancer treatment. Cancer Sci. 2017;108(5):831–837. | ||
Niemann J, Kühnel F. Oncolytic viruses: adenoviruses. Virus Genes. 2017;53(5):700–706. | ||
Wongthida P, Diaz RM, Galivo F, et al. VSV oncolytic virotherapy in the B16 model depends upon intact MyD88 signaling. Mol Ther. 2011;19(1):150–158. | ||
di Paolo NC, Baldwin LK, Irons EE, Papayannopoulou T, Tomlinson S, Shayakhmetov DM. IL-1α and complement cooperate in triggering local neutrophilic inflammation in response to adenovirus and eliminating virus-containing cells. PLoS Pathog. 2014;10(3):e1004035. | ||
Wang H, Wei F, Li H, Ji X, Li S, Chen X. Combination of oncolytic adenovirus and endostatin inhibits human retinoblastoma in an in vivo mouse model. Int J Mol Med. 2013;31(2):377–385. | ||
Cuevas Y, Hernández-Alcoceba R, Aragones J, et al. Specific oncolytic effect of a new hypoxia-inducible factor-dependent replicative adenovirus on von Hippel-Lindau-defective renal cell carcinomas. Cancer Res. 2003;63(20):6877–6884. | ||
Steinwaerder DS, Lieber A. Insulation from viral transcriptional regulatory elements improves inducible transgene expression from adenovirus vectors in vitro and in vivo. Gene Ther. 2000;7(7):556–567. | ||
Lee JH, Choi SH, Baek MW, et al. CoCl2 induces apoptosis through the mitochondria- and death receptor-mediated pathway in the mouse embryonic stem cells. Mol Cell Biochem. 2013;379(1–2):133–140. | ||
Werth N, Beerlage C, Rosenberger C, et al. Activation of hypoxia inducible factor 1 is a general phenomenon in infections with human pathogens. PLoS One. 2010;5(7):e11576. | ||
Zinkernagel AS, Johnson RS, Nizet V. Hypoxia inducible factor (HIF) function in innate immunity and infection. J Mol Med. 2007;85(12):1339–1346. | ||
Pipiya T, Sauthoff H, Huang YQ, et al. Hypoxia reduces adenoviral replication in cancer cells by downregulation of viral protein expression. Gene Ther. 2005;12(11):911–917. | ||
Lozier JN, Csako G, Mondoro TH, et al. Toxicity of a first-generation adenoviral vector in rhesus macaques. Hum Gene Ther. 2002;13(1):113–124. | ||
Nalwoga H, Ahmed L, Arnes JB, Wabinga H, Akslen LA. Strong expression of hypoxia-inducible factor-1α (HIF-1α) is associated with Axl expression and features of aggressive tumors in african breast cancer. PLoS One. 2016;11(1):e0146823. | ||
Rankin EB, Fuh KC, Castellini L, et al. Direct regulation of GAS6/AXL signaling by HIF promotes renal metastasis through SRC and MET. Proc Natl Acad Sci USA. 2014;111(37):13373–13378. | ||
Cichoń MA, Szentpetery Z, Caley MP, et al. The receptor tyrosine kinase Axl regulates cell-cell adhesion and stemness in cutaneous squamous cell carcinoma. Oncogene. 2014;33(32):4185–4192. | ||
Lencioni R, de Baere T, Soulen MC, Rilling WS, Geschwind JF. Lipiodol transarterial chemoembolization for hepatocellular carcinoma: a systematic review of efficacy and safety data. Hepatology. 2016;64(1):106–116. | ||
Llovet JM, Ricci S, Mazzaferro V, et al. Sorafenib in advanced hepatocellular carcinoma. N Engl J Med. 2008;359(4):378–390. | ||
Gong L, Wei Y, Yu X, Peng J, Leng X. 3-Bromopyruvic acid, a hexokinase II inhibitor, is an effective antitumor agent on the hepatoma cells: in vitro and in vivo findings. Anticancer Agents Med Chem. 2014;14(5):771–776. | ||
Pollutri D, Patrizi C, Marinelli S, et al. The epigenetically regulated miR-494 associates with stem-cell phenotype and induces sorafenib resistance in hepatocellular carcinoma. Cell Death Dis. 2018;9(1):4. | ||
Shao Z, Li Y, Dai W, et al. ETS-1 induces Sorafenib-resistance in hepatocellular carcinoma cells via regulating transcription factor activity of PXR. Pharmacol Res. 2018;135:188–200. | ||
Kwon OJ, Kim PH, Huyn S, Wu L, Kim M, Yun CO. A hypoxia- and {alpha}-fetoprotein-dependent oncolytic adenovirus exhibits specific killing of hepatocellular carcinomas. Clin Cancer Res. 2010;16(24):6071–6082. | ||
Kietzmann T, Samoylenko A, Roth U, Jungermann K. Hypoxia-inducible factor-1 and hypoxia response elements mediate the induction of plasminogen activator inhibitor-1 gene expression by insulin in primary rat hepatocytes. Blood. 2003;101(3):907–914. | ||
Sumida SM, Truitt DM, Lemckert AA, et al. Neutralizing antibodies to adenovirus serotype 5 vaccine vectors are directed primarily against the adenovirus hexon protein. J Immunol. 2005;174(11):7179–7185. | ||
Park BH, Lee JH, Jeong JS, et al. Vascular administration of adenoviral vector soaked in absorbable gelatin sponge particles (GSP) prolongs the transgene expression in hepatocytes. Cancer Gene Ther. 2005;12(2):116–121. | ||
Liang B, Zheng C, Feng G, et al. Expression of hypoxia-inducible factor-1α in liver tumors after transcatheter arterial embolization in an animal model. J Huazhong Univ Sci Med. 2009;29(6):776–781. | ||
Liang B, Zheng CS, Feng GS, et al. Correlation of hypoxia-inducible factor 1alpha with angiogenesis in liver tumors after transcatheter arterial embolization in an animal model. Cardiovasc Intervent Radiol. 2010;33(4):806–812. | ||
Yang G, Meng X, Sun L, et al. Antitumor effects of a dual cancer-specific oncolytic adenovirus on colorectal cancer in vitro and in vivo. Exp Ther Med. 2015;9(2):327–334. | ||
Paccez JD, Vasques GJ, Correa RG, et al. The receptor tyrosine kinase Axl is an essential regulator of prostate cancer proliferation and tumor growth and represents a new therapeutic target. Oncogene. 2013;32(6):689–698. | ||
Kanlikilicer P, Ozpolat B, Aslan B, et al. Therapeutic targeting of AXL receptor tyrosine kinase inhibits tumor growth and intraperitoneal metastasis in ovarian cancer models. Mol Ther Nucleic Acids. 2017;9:251–262. | ||
Lee HJ, Jeng YM, Chen YL, Chung L, Yuan RH. Gas6/Axl pathway promotes tumor invasion through the transcriptional activation of Slug in hepatocellular carcinoma. Carcinogenesis. 2014;35(4):769–775. | ||
Lee WP, Wen Y, Varnum B, Hung MC. Akt is required for Axl-Gas6 signaling to protect cells from E1A-mediated apoptosis. Oncogene. 2002;21(3):329–336. | ||
Bruix J, Takayama T, Mazzaferro V, et al. Adjuvant sorafenib for hepatocellular carcinoma after resection or ablation (STORM): a phase 3, randomised, double-blind, placebo-controlled trial. Lancet Oncol. 2015;16(13):1344–1354. | ||
El-Khoueiry AB, Sangro B, Yau T, et al. Nivolumab in patients with advanced hepatocellular carcinoma (CheckMate 040): an open-label, non-comparative, phase 1/2 dose escalation and expansion trial. Lancet. 2017;389(10088):2492–2502. | ||
D’Aloia MM, Zizzari IG, Sacchetti B, Pierelli L, Alimandi M. CAR-T cells: the long and winding road to solid tumors. Cell Death Dis. 2018;9(3):282. | ||
Melcher A, Parato K, Rooney CM, Bell JC. Thunder and lightning: immunotherapy and oncolytic viruses collide. Mol Ther. 2011;19(6):1008–1016. |
 © 2019 The Author(s). This work is published and licensed by Dove Medical Press Limited. The full terms of this license are available at https://www.dovepress.com/terms.php and incorporate the Creative Commons Attribution - Non Commercial (unported, v3.0) License.
By accessing the work you hereby accept the Terms. Non-commercial uses of the work are permitted without any further permission from Dove Medical Press Limited, provided the work is properly attributed. For permission for commercial use of this work, please see paragraphs 4.2 and 5 of our Terms.
© 2019 The Author(s). This work is published and licensed by Dove Medical Press Limited. The full terms of this license are available at https://www.dovepress.com/terms.php and incorporate the Creative Commons Attribution - Non Commercial (unported, v3.0) License.
By accessing the work you hereby accept the Terms. Non-commercial uses of the work are permitted without any further permission from Dove Medical Press Limited, provided the work is properly attributed. For permission for commercial use of this work, please see paragraphs 4.2 and 5 of our Terms.