")
Back to Journals » Journal of Pain Research » Volume 14
Trajectories of Opioid Coverage After Long-Term Opioid Therapy Initiation Among a National Cohort of US Veterans
Authors Hayes CJ , Gressler LE, Hu B, Jones BL, Williams JS, Martin BC
Received 24 February 2021
Accepted for publication 1 May 2021
Published 14 June 2021 Volume 2021:14 Pages 1745—1762
DOI https://doi.org/10.2147/JPR.S308196
Checked for plagiarism Yes
Review by Single anonymous peer review
Peer reviewer comments 3
Editor who approved publication: Dr Timothy Atkinson
Corey J Hayes,1,2 Laura E Gressler,3 Bo Hu,1,2 Bobby L Jones,4 J Silas Williams,1,2 Bradley C Martin5
1Center for Mental Healthcare and Outcomes Research, Central Arkansas Veterans Healthcare System, North Little Rock, AR, USA; 2Center of Health Services Research, Department of Psychiatry, College of Medicine, University of Arkansas for Medical Sciences, Little Rock, AR, USA; 3Department of Pharmaceutical Health Services Research, College of Pharmacy, University of Maryland Baltimore, Baltimore, MD, USA; 4Department of Psychiatry, University of Pittsburgh School of Medicine, Pittsburgh, PA, USA; 5Division of Pharmaceutical Evaluation and Policy, College of Pharmacy, University of Arkansas for Medical Sciences, Little Rock, AR, USA
Correspondence: Bradley C Martin
Division of Pharmaceutical Evaluation and Policy, College of Pharmacy, University of Arkansas for Medical Sciences, 4301 West Markham Street, Slot 522, Little Rock, AR, 72205 Tel +1 501 603 1992
Fax +1 501 686 5156
Email [email protected]
Purpose: The objective of this study was to identify the trajectories that patients take after initiating long-term opioid therapy (LTOT).
Materials and Methods: Using a retrospective cohort design, veterans with chronic non-cancer pain (CNCP) initiating LTOT were identified. Group-based trajectory models were used to identify opioid therapy trajectories based on days of opioid supply (primary outcome) and average daily morphine milligram equivalent dose (AMME; secondary outcome) in each 180-day period following initiation of LTOT.
Results: A total of 438,398 veterans with CNCP initiated LTOT. Nine trajectories were identified: 33.7% with persistent, high days covered, 17.7% with persistent, moderate days covered, 16.6% with slow, persistent days-covered reduction, 2.4% with days-covered reduction followed by increase, 4.6% with delayed days-covered reduction, 4.1% with rapid days-covered reduction, 10.9% with moderate-paced discontinuation, 3.4% with delayed discontinuation, and 6.5% with rapid discontinuation. Patients following discontinuation trajectories were more likely to be younger, persons of color, use more supportive services (eg, physical therapy), and received less opioid days’ supply and lower doses prior to initiating LTOT as compared to patients following persistent opioid days-covered trajectories. AMME trajectories were similar to days-covered trajectories.
Conclusion: Among persons initiating LTOT, nine opioid trajectories emerged which can be broadly characterized into three main trajectory groups: persistent opioid therapy (2 trajectories), reductions in opioid therapy (4 trajectories), and discontinuation (3 trajectories). A majority of patients (51.4%) maintained persistent opioid therapy. Further research is needed to assess the risks of opioid-related adverse outcomes among the identified trajectories.
Keywords: opioids, group-based trajectory models, long-term opioid therapy, chronic non-cancer pain, veterans
Introduction
Opioid therapy for chronic, non-cancer pain (CNCP) is pervasive and the risks associated with opioid therapy are substantial. Approximately 20% of adults experience CNCP.1 Up to 50% of veterans experience pain regularly,2 and roughly 30% of those receive at least one opioid prescription.3–5 Among veterans receiving opioid therapy for CNCP, approximately 57% receive long-term opioid therapy (LTOT), ie, opioid therapy for 90 days or longer.6 Opioid therapy is associated with an increased risk of serious adverse events, such as opioid overdose and substance use disorders.7–9 Furthermore, LTOT exacerbates the risk of these adverse events.7
Once initiated on LTOT, subsequent opioid treatment plans vary greatly. Patients on LTOT may, in concert with their prescribing provider, either discontinue the opioid or make changes to more adequately address their pain or manage side effects. Additionally, veterans and their prescribing providers may opt to continue LTOT, which may involve changes in the dose and days of opioid therapy, if experiencing gains in pain relief or quality of life. Veterans experiencing adverse events that are life-threatening or side effects that greatly impact their quality of life may also opt to, or per their prescribing provider’s guidance, reduce or completely discontinue their opioid regimen. Managing patients on LTOT is complex. Longer durations of opioid therapy have been associated with an increased risk of side effects and complications including constipation, breathing problems, depression, anxiety, and substance use disorders.10 Continuing LTOT is also associated with an 87% increase in risk of all-cause mortality.11 Electing to discontinue opioid therapy may also be unfavorable for the prescribing provider and patient since discontinuation is associated with an increase in emergency department visits and hospitalizations due to opioid poisoning, development of substance use disorders, and death from overdose or suicide.12,13
To our knowledge, no studies have described the longitudinal trajectories of change in opioid therapy among patients living with CNCP and on LTOT. Group-based trajectory models (GBTM) can be leveraged graphically to identify subgroups of patients based on their changes in opioid therapy over time. While some models limit their assessment of utilization to two time points, GBTM allow for a more comprehensive assessment of patterns by incorporating usage over three or more time points.14,15 This provides a more granular assessment of changes in time and allows for a more accurate determination of factors (eg, comorbidities, concomitant medication use, health status) associated with varying treatment patterns among veterans on LTOT. GBTM can also be used to identify utilization patterns that may lead to higher or lower risks of adverse events.
Describing the prevalent opioid therapy trajectories and identifying the patient characteristics associated with each trajectory can give providers insights into which trajectory their patients are likely to follow and identify patients who are likely to follow a high-risk opioid trajectory. This insight may afford the opportunity to potentially modify the patient’s trajectory and therefore mitigate the patient’s risk. The objectives of this paper are to (i) identify the different trajectories of opioid therapy based on days of therapy and morphine equivalent dose followed by veterans after initiating LTOT and (ii) contrast the characteristics of veterans who fall into each of the identified trajectories.
Materials and Methods
Setting
Inpatient and outpatient medical visit, demographic, and outpatient pharmacy files from the Corporate Data Warehouse (CDW) of the Veterans Health Administration (VHA) were used from the fiscal years of 2008 to 2015. The VHA is the largest integrated healthcare system in the United States with over 1,200 healthcare facilities serving over 9 million veterans.16 The data within CDW are derived from the Veterans Health Information Systems and Technology Architecture (VISTA), which is the electronic medical record used by VHA nationally. Access to CDW was obtained using the VHA Informatics and Computing Infrastructure (VINCI). The study was approved by the Central Arkansas Veterans Healthcare System Institutional Review Board (IRB # 742020–17). For this study, patient consent was not required by the Central Arkansas Veterans Healthcare System Institutional Review Board because of the secondary nature of the work and the extent of the number of patient records reviewed with limited patient identifiers (eg, scrambled social security numbers instead of actual social security numbers). Patient data confidentiality was maintained in compliance with the Declaration of Helsinki.
Study Design and Participants
This study was a retrospective cohort study of veterans with a diagnosis of at least one CNCP condition, per International Classification of Diseases, Ninth Edition codes, from October 1st, 2008 to September 30th, 2015 and prescribed LTOT. CNCP conditions included arthritis, back pain, neck pain, neuropathic pain, and headache/migraine pain.17–19 The VHA Drug Class Code CN101 (opioid analgesics) was used to identify opioids. LTOT was defined as receiving at least a 90-day supply of non-parenteral opioids within any 180-day period with no more than a 30-day gap in supply.18 The veteran’s index date was defined as the first day of the first 180-day period in which the patient was considered to be on LTOT. Veterans were followed for 720 days from their index date. See Supplemental Figure 1 for a visual representation of the cohort.
Exclusion Criteria
This study focused on adults with reliable opioid prescription data who regularly sought care at VHA and did not have a history of cancer or terminal illnesses. The following six exclusion criteria were implemented based on the CDW records observed in the 12 months prior to the index date (unless noted otherwise): (1) index date before October 1st, 2009 to ensure baseline data capture and incident LTOT, (2) under 18 years of age, (3) having at least one potentially erroneous opioid prescription record, including the inability to calculate morphine milligram equivalents (MME), average daily dose above 1000 MMEs, or a prescription quantity greater than 1000 units, after the index date, (4) visit to a substance abuse program in VHA, (5) diagnosis for cancer (except for non-melanoma skin cancer), (5) receipt of hospice/palliative care or admission to a nursing home, and (6) last VHA visit occurred within the first 180-day period, precluding the ability to contribute to trajectory creation.
Outcome: Trajectories of Days Covered of Opioid Therapy
Our outcome of interest was membership in a distinct identified trajectory of opioid therapy by constructing 180-day measures of days covered with an opioid. The identification and determination of membership occurred in two phases. First, based on dispensing date and days supplied, we calculated the days covered in 180-day intervals (ie, the number of days for which an opioid analgesic was prescribed in each 180-day period) for 720 days starting from the index date, which is four 180-day periods. Next, we estimated a GBTM with days covered as the outcome variable. Details regarding the GBTM are summarized in the Statistical Analysis section.
Secondary Outcome: Trajectories of Average Morphine Milligram Equivalent Daily Dose of Opioid Therapy
We evaluated a secondary outcome of interest, membership in a distinct, identified trajectory of opioid therapy by constructing 180-day measures of average morphine milligram equivalent daily dose (AMME). We calculated AMME in three steps. First, we multiplied the dose of each prescription by the number of dosage units dispensed and a morphine milligram equivalent conversion factor.20 Second, we divided the product of dose, dosage units, and the conversion factor by the days’ supplied of each prescription within the 180-day period. Third, we averaged the daily dose for all prescriptions for each 180-day period by patient. Similar to days’ covered, we estimated a GBTM with AMME as the outcome variable. We initially tried to estimate the GBTM using raw AMME values; however, this resulted in false convergence due to the value ranges. Therefore, we transformed AMME to the logarithmic scale.
Covariates
Demographic, medical, and medication-related covariates were derived for this study based on previous literature.19,21–23 Demographic covariates included age, gender, race, marital status, and geographic region.24 Medical covariates included the enhanced Charlson Comorbidity Index (eCCI),25 diagnoses of mental health conditions (schizophrenia, major depressive disorder, post-traumatic stress disorder, anxiety disorders, bipolar disorder, multiple mental health conditions), and diagnoses for CNCP conditions (listed above). Medication classes that aid in treating pain or increase the risk of opioid-related adverse outcomes when combined with opioids (benzodiazepines, hypnotics/other non-benzodiazepine sedatives, skeletal muscle relaxants, antidepressants, other non-opioid analgesics) were identified using the VHA Drug Classification System.26–29 Opioid medication characteristics for the 180 days before and after LTOT index date were also evaluated including schedule of opioids prescribed (controlled substances, US Drug Enforcement Administration (DEA) schedules II–IV),30 duration of action (long-acting, short-acting), AMME, and mean days covered. To characterize healthcare utilization for potential pain management, healthcare visits (physical therapy, pain clinic, chiropractic care, medicine/primary care, and mental health visits) were identified using VHA stop codes and described by the number of days with each healthcare visit type. Using the vital-sign files, pain scores were also captured in the 180-day periods before and after the index date as average pain score, first pain score in the 180-day period, last pain score in the 180-day period, and pain score change (difference between initial and last pain score). Demographic covariates were determined using the value closest to but before the index date. All other covariates were determined using data from the 180 days before and after the index date except for CNCP conditions, which were derived using data from the 365 days prior to the index date.
Statistical Methods
GBTMs were used to categorize veterans into trajectory subgroups based on patterns of change in days covered over time.31,32 Days covered was modeled as a longitudinal, continuous outcome with days covered summed for each of the four 180-day time periods starting with the index date. The time variable was denoted as singular points in time to represent each 180-day period. Veterans were censored at the first 180 day window where the veteran did not have an inpatient or outpatient visit or pharmacy prescription fill such that data points were represented as missing in the GBTMs. GBTMs provide trajectories of average predicted and observed days covered over time for each patient group as well as proportion of patients in each group trajectory. Trajectory groups were continuously added to the models until (1) the Bayesian information criterion (BIC) was maximized and (2) Nagin’s diagnostic criteria for GBTMs showed that none of the groups had an average posterior probability <0.7.31,32 Trajectory groups were then compared on the covariate characteristics listed above using χ2 and analyses of variance (ANOVA) tests.
Analyses were conducted using SAS Enterprise Guide 7.1 (SAS Institute Inc., Cary, NC, USA) and the PROC TRAJ macro.31,33
Results
Sample Derivation and Characteristics
A total of 438,398 veterans was retained in the sample following implementation of the inclusion and exclusion criteria (Figure 1). Overall, approximately two-thirds were White, 90% male, 60% between the ages of 51 and 70, and approximately 70% resided in urban areas. Arthritis and back or neck pain were the most common pain conditions. Approximately 60% of veterans in each group had one or more mental health diagnoses. Mean days covered for the first 180-day period after the index date was 138.1 [standard deviation (SD)=28.1] and the AMME was 21.5 (SD=19.7). Approximately half used Schedule II opioids exclusively and over 90% used short-acting opioids exclusively during the first 180-day period.
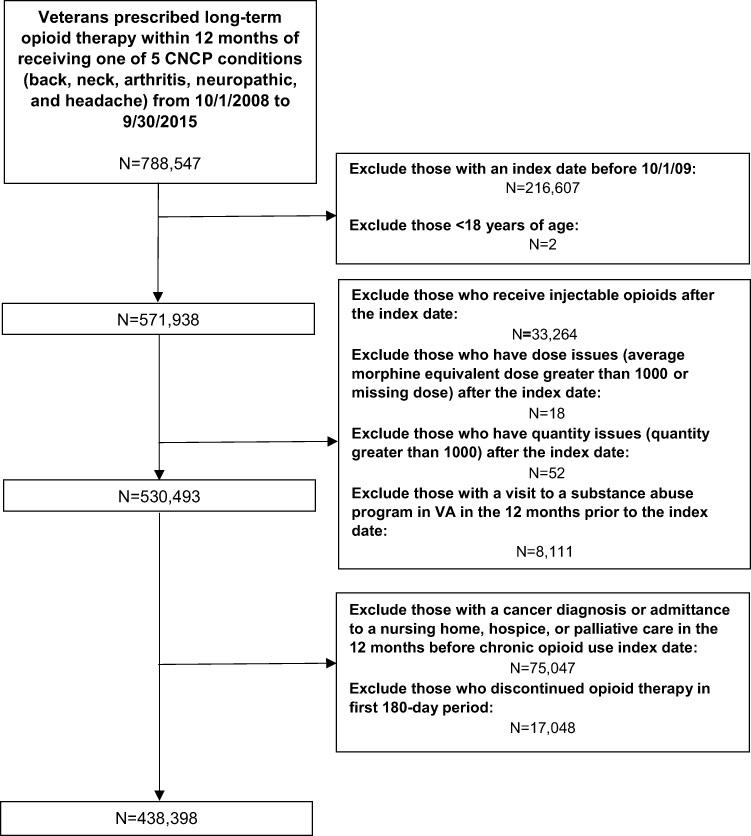 |
Figure 1 Derivation of study sample. |
Opioid Days-Covered Trajectories
After examining the BIC and Nagin’s diagnostic criteria, a model with nine distinct trajectories was selected as the final, most comprehensive, and inclusive model (Table 1, Supplemental Tables 1 and 2).15 Figure 2 graphically displays the predicted days covered over time for each trajectory. Table 1 and Supplemental Figure 2, respectively, provide the means and box plots for observed opioid days covered for each identified trajectory group. Patients in the nine trajectories experienced either persistent days of opioid coverage, reductions in opioid coverage, or discontinuation of opioid therapy.
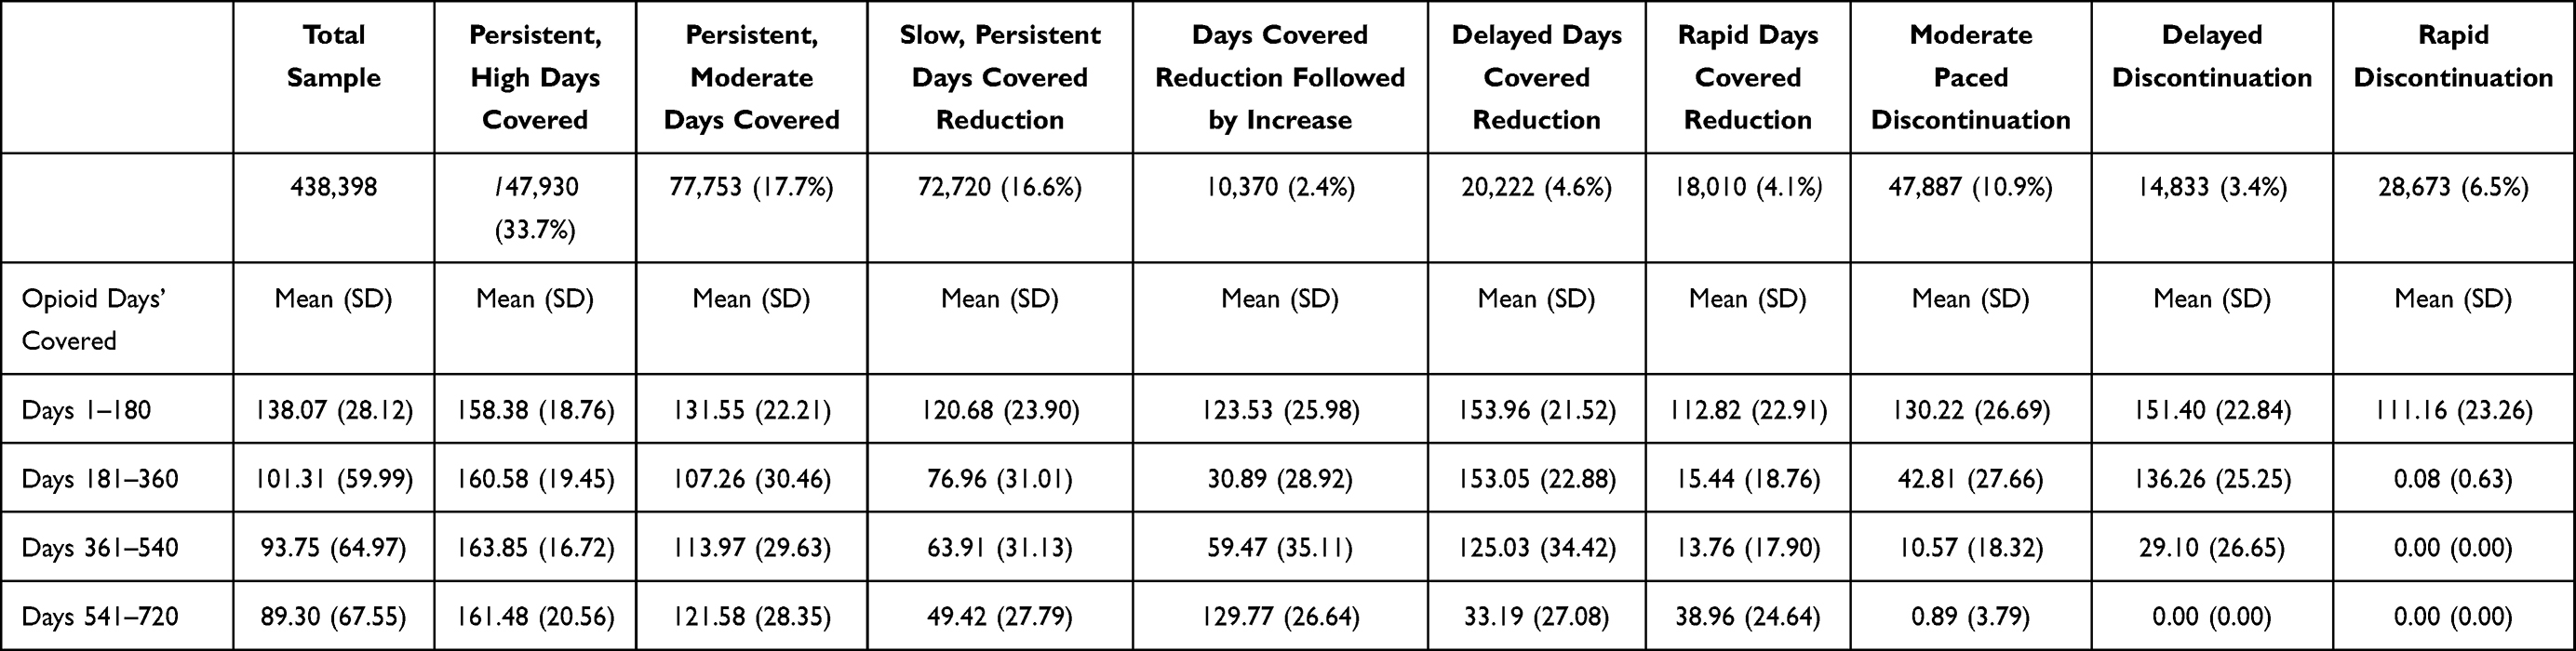 |
Table 1 Mean Days Covered by Opioid Trajectory |
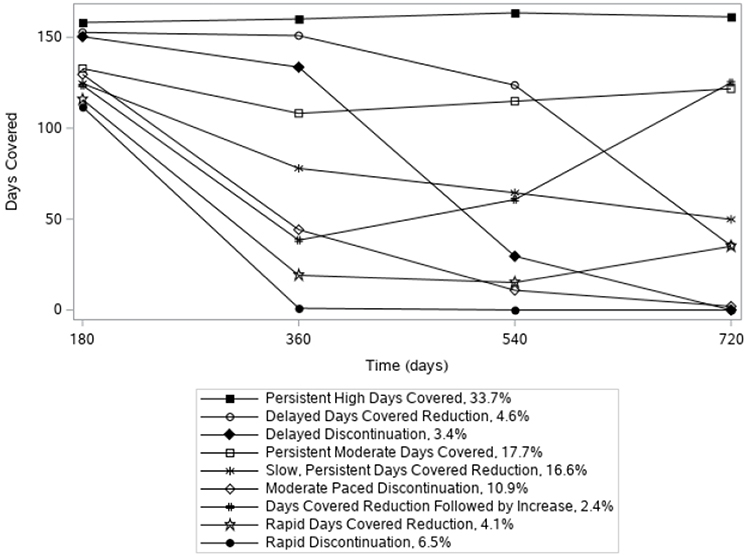 |
Figure 2 Graphical depiction of the nine days covered trajectories of Veteran initiating long-term opioid therapy. |
Trajectories with Persistent Opioid Coverage
Approximately half of patients, once initiated on LTOT, remained on LTOT over the two years of follow-up, with consistent days covered at each time point. For these patients, two trajectories emerged; patients with persistent, high days covered (N=147,930; 33.7%, 95% CI: 33.6–33.9%) maintained 158.4–163.9 mean days covered across all time points. Patients with persistent, moderate days covered (N=77,753; 17.7%, 95% CI: 17.6–17.9%) consistently had 107.3–131.6 mean days covered across all four time points.
Trajectories with Reductions in Opioid Coverage
Approximately 28% of patients followed one of four trajectory groups experiencing reductions in opioid days covered. These trajectories differed by the rate at which the reduction occurred and one small group that experienced reductions followed by increases in days covered. Veterans within the slow, persistent reductions in days covered (N=72,720; 16.6%, 95% CI: 16.5–16.7%) group experienced days-covered reductions at each of the four time points, going from 120.7 mean days covered to an average of 49.4 days covered by the fourth 180-day period. Veterans with delayed days-covered reductions (N=20,222; 4.6%, 95% CI: 4.6–4.8%) had relatively stable days of opioid coverage over the first three time periods, ranging from 154.0 days covered on average to 125.0 mean days covered; however, by the last time point, their average days covered had reduced to 33.2 days. Patients with rapid days-covered reductions (N=18,010; 4.1%, 95% CI: 4.1–4.2%) who initiated LTOT with 112.8 days of opioid coverage on average experienced a rapid decrease in the mean days covered at the second period to 15.4 days. The two remaining time points for this group showed days covered remained between 13.8 and 39.0 days covered. A small group of veterans experienced a days-covered reduction followed by increases (N=10,370; 2.4% 95% CI: 2.3–2.4%); this group initiated LTOT with 123.5 days covered on average, which, at second 180-day period, dropped to an average of 30.9 days covered. The days covered then slowly increased over the subsequent two time periods to approximately the same days covered as the first time point (mean days covered day 361–540: 59.5, mean days covered day 541–720: 129.8).
Discontinuation Trajectories
Three of the nine groups were characterized by discontinuation of opioid therapy. Each discontinuation trajectory was characterized by the rate at which discontinuation occurred and collectively accounted for roughly 20% of the sample. Patients with moderate-paced discontinuation (N=47,887; 10.9%, 95% CI: 10.8–11.0%) slowly decreased the total days covered at each 180-day period, with the largest decrease observed from the first to second period ranging from 130.22 to 42.81 days covered. Patients with delayed discontinuation (N=14,833; 3.4%, 95% CI: 3.3–3.4%) remained relatively stable in their number of days covered from 180 to 360 days post-index date (151.40 to 136.26 mean days covered, respectively) but experienced a significant drop from the third to fourth period, dropping from 136.26 mean days covered to 29.10 mean days covered. A small proportion (N=28,673; 6.5%, 95% CI: 6.5–6.6%) experienced rapid discontinuation, almost completely discontinuing opioid therapy by the second 180-day period and remaining off opioid therapy for the remainder of follow-up.
Demographic Characteristics by Trajectory Group
The characteristics of veterans following each trajectory are provided in Table 2 and Supplemental Table 3. Owing to the large sample sizes, significant differences were found across all the characteristics of veterans and trajectory membership; however, in many cases the differences in composition across trajectories were small. Despite being small, notable differences did exist in demographic, clinical, and medication-related characteristics. The trajectory with the highest percentage of Whites consisted of those on persistent high days covered (73.1%), and Blacks were disproportionately represented in the slow, persistent days-covered reduction trajectory (20.2%). A higher percentage of those with back and/or neck pain experienced persistent, high days covered (25.3%) as compared to those that experienced rapid days-covered reduction (18.5%). Additionally, a higher percentage of those with no mental health conditions rapidly discontinued opioid therapy (41.8%) as compared to those who experienced delayed days-covered reductions (33.8%) or persistent, high days covered (35.5%). Mean number of physical therapy visits were also higher for those experiencing rapid days-covered reduction (5.55 visits) and rapid discontinuation (5.52 visits) as compared to those who experienced persistent, high days covered (4.44 visits). A higher percentage of veterans using other psychoactive medications (ie, antidepressants, benzodiazepines, hypnotics and non-benzodiazepine sedatives, and skeletal muscle relaxants) experienced persistent opioid therapy (persistent, high and moderate days covered) as compared to those who experienced rapid discontinuation (eg, benzodiazepines: persistent, high days covered: 23.0% vs rapid discontinuation: 18.3%; Table 2). No opioid therapy in the 180 days prior to the index date was more common for those who experienced rapid discontinuation (67.8%) as compared to those who experienced persistent, moderate days covered (44.5%) or slow, persistent days-covered reduction (42.3%). Mean opioid days covered in the 180 days prior to the index date was also highest for patients experiencing persistent, moderate days covered (48.6 days) as compared to patients experiencing rapid discontinuation (38.4 days). Use of controlled substances of schedule IV opioids only in the 180 days after the index date was highest among those who rapidly discontinued opioid therapy (42.1%) and lowest for those who had persistent, high days covered (20.9%). AMME in the 180 days prior to the index date was highest for patients experiencing persistent, high days covered (21.2 AMME) as compared to those experiencing rapid discontinuation (18.35 AMME). AMME in the 180 days after the index date was also highest for patients experiencing persistent, high days covered (25.9 AMME) as compared to those who experienced slow, persistent days-covered reduction (18.34 AMME), rapid days-covered reduction (18.65 AMME), and rapid discontinuation (18.4 AMME). Average pain scores in the baseline period were higher for those on persistent high days covered (4.33) and lowest for those who underwent rapid opioid discontinuation (3.80).
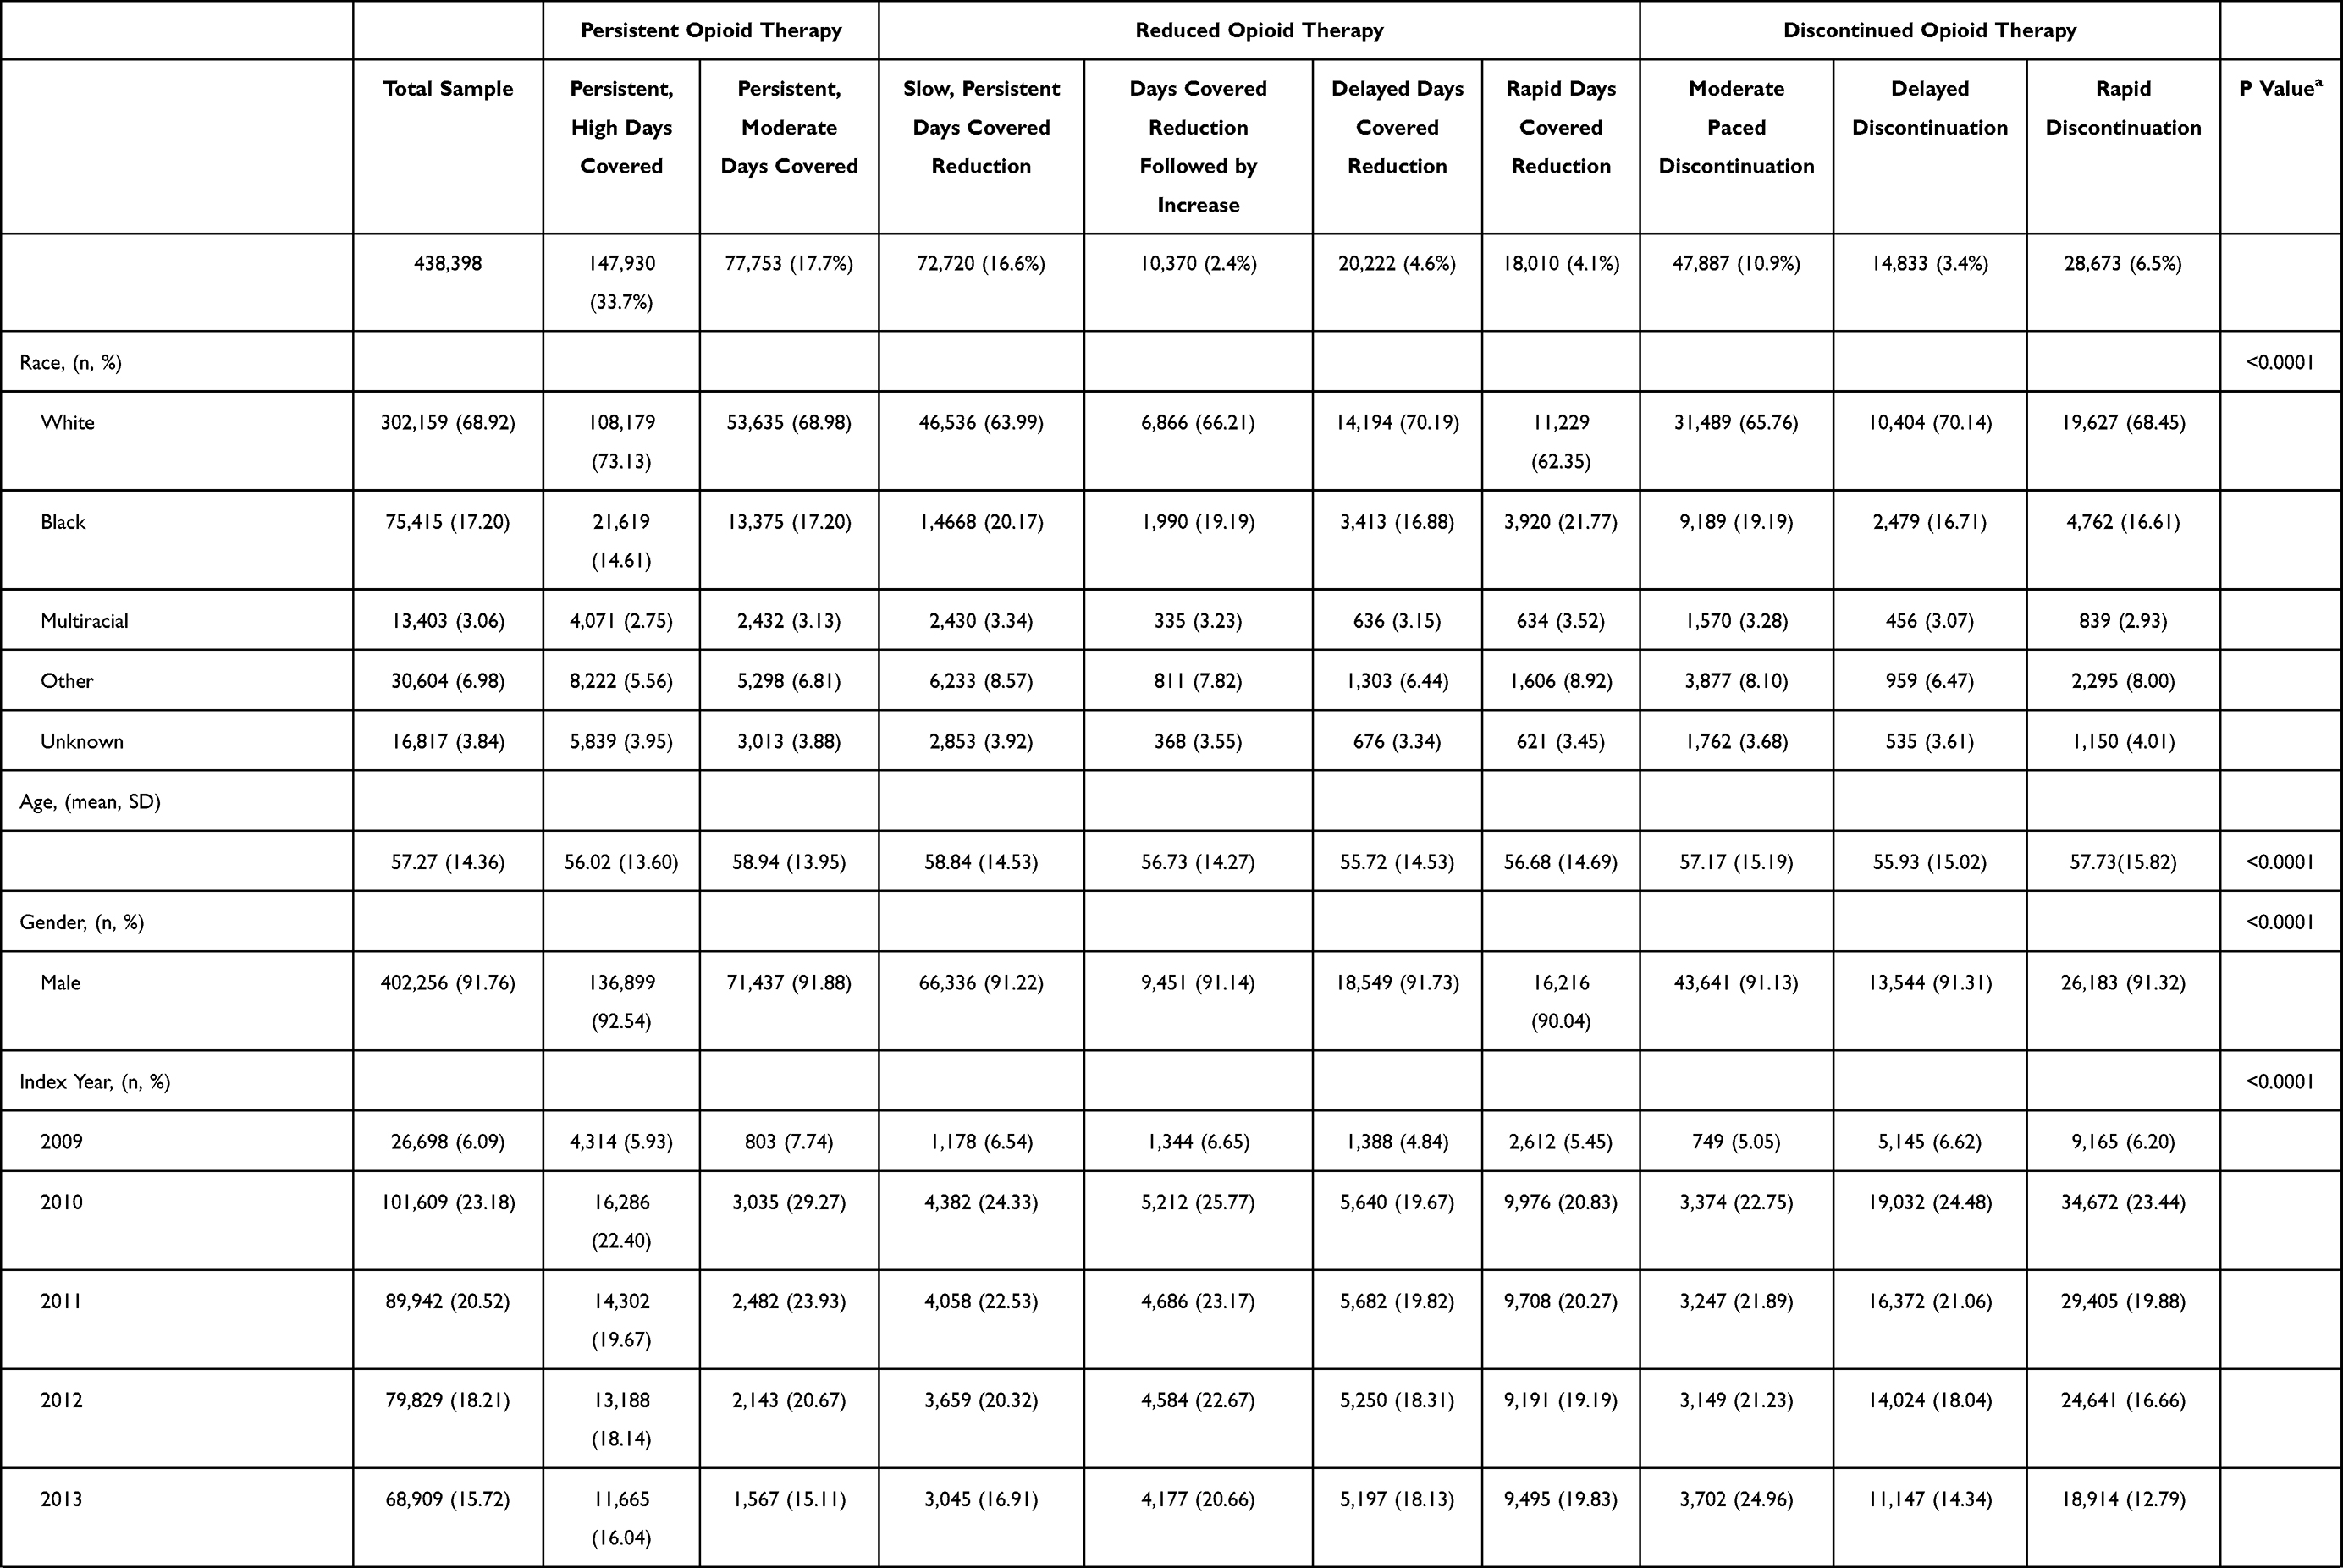 |  | 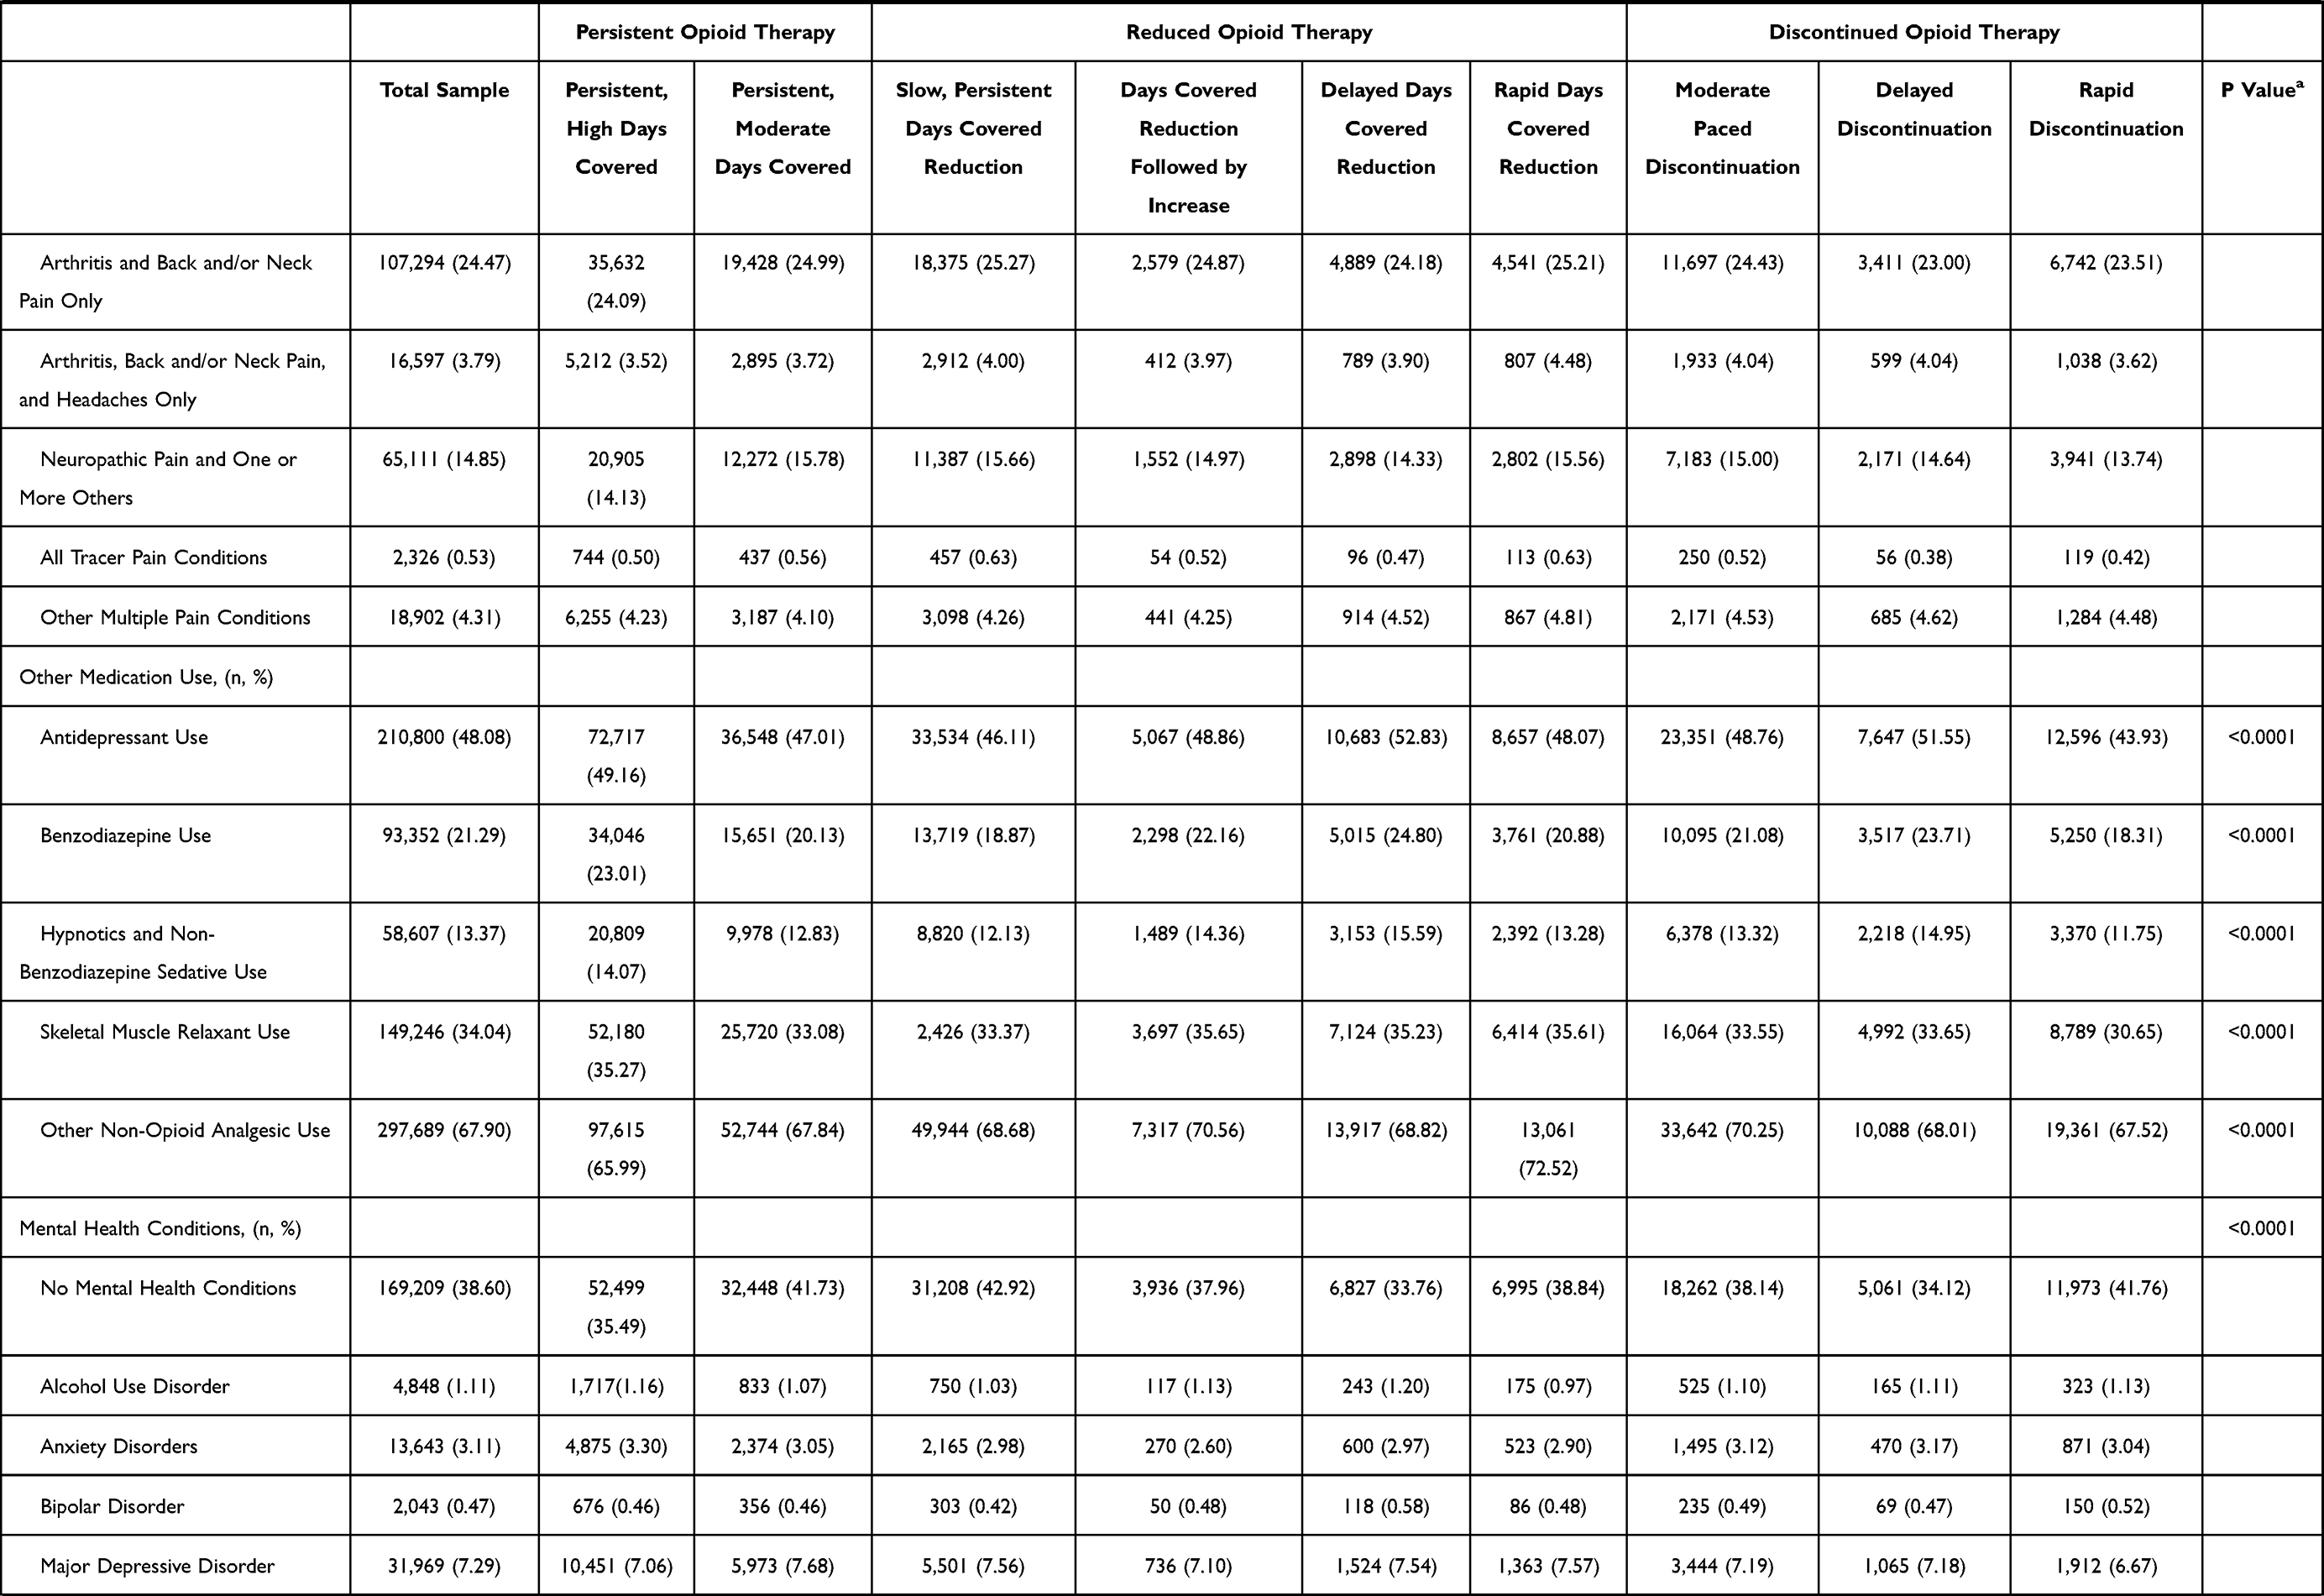 | 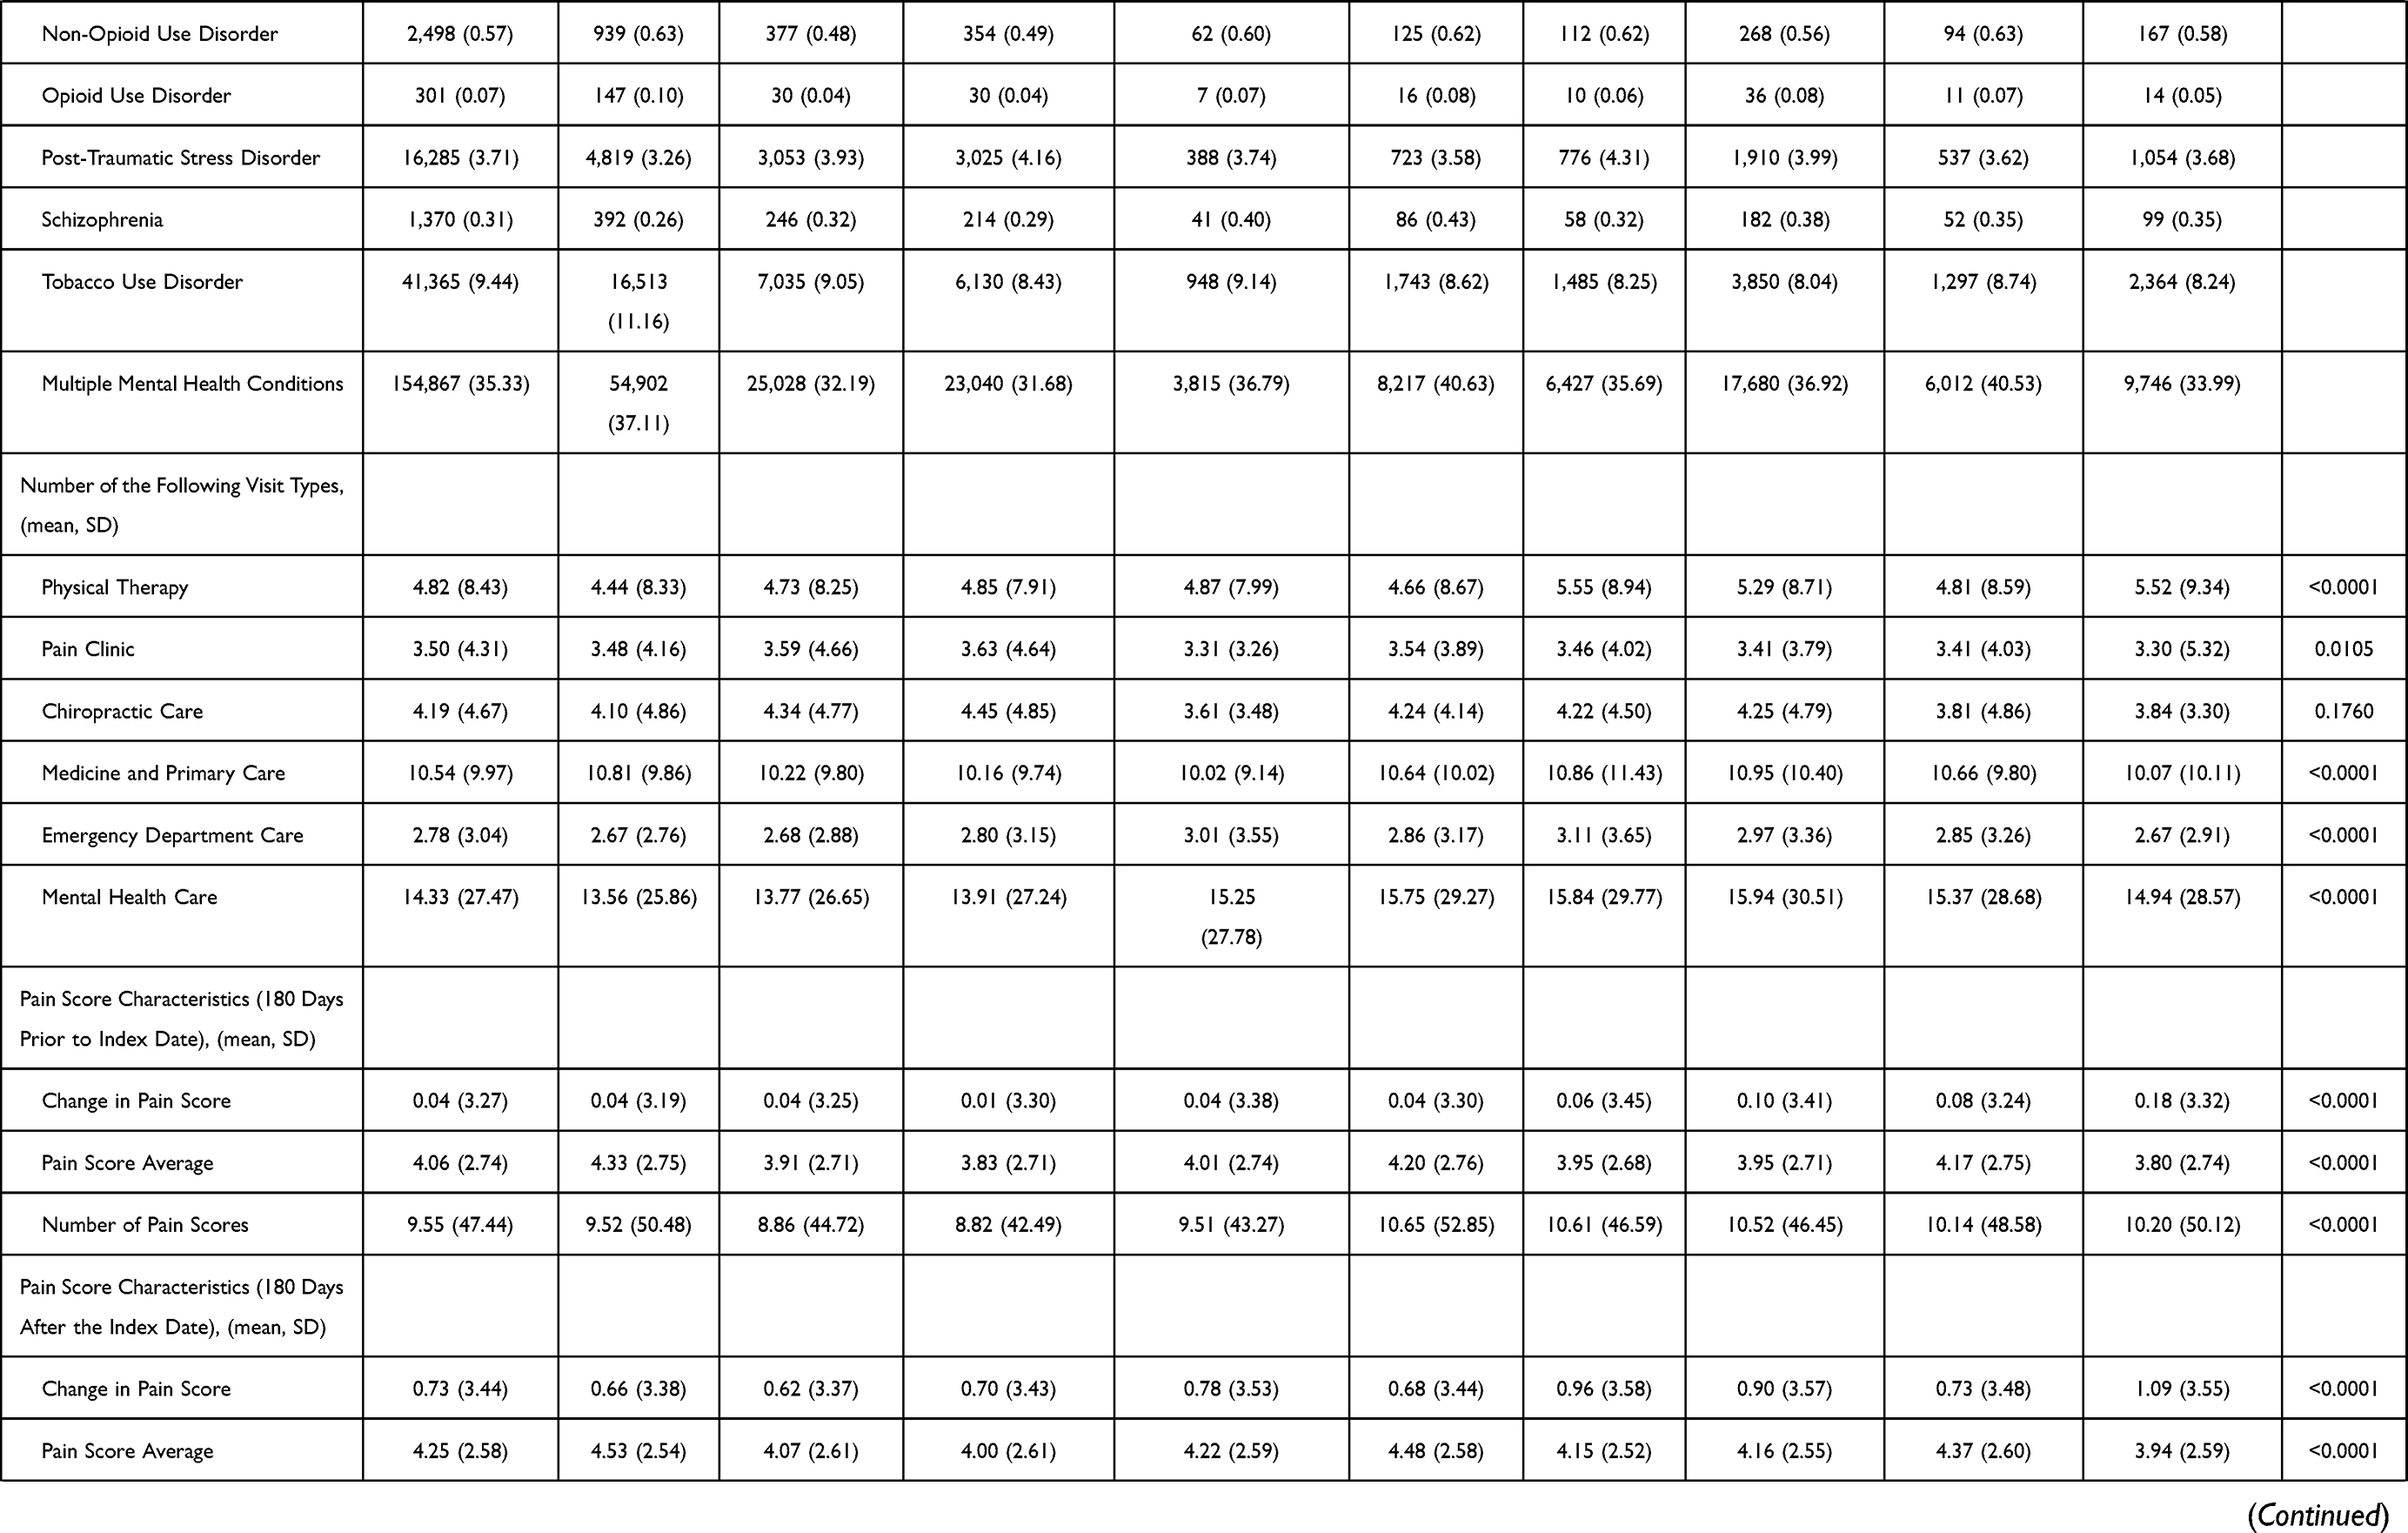 | 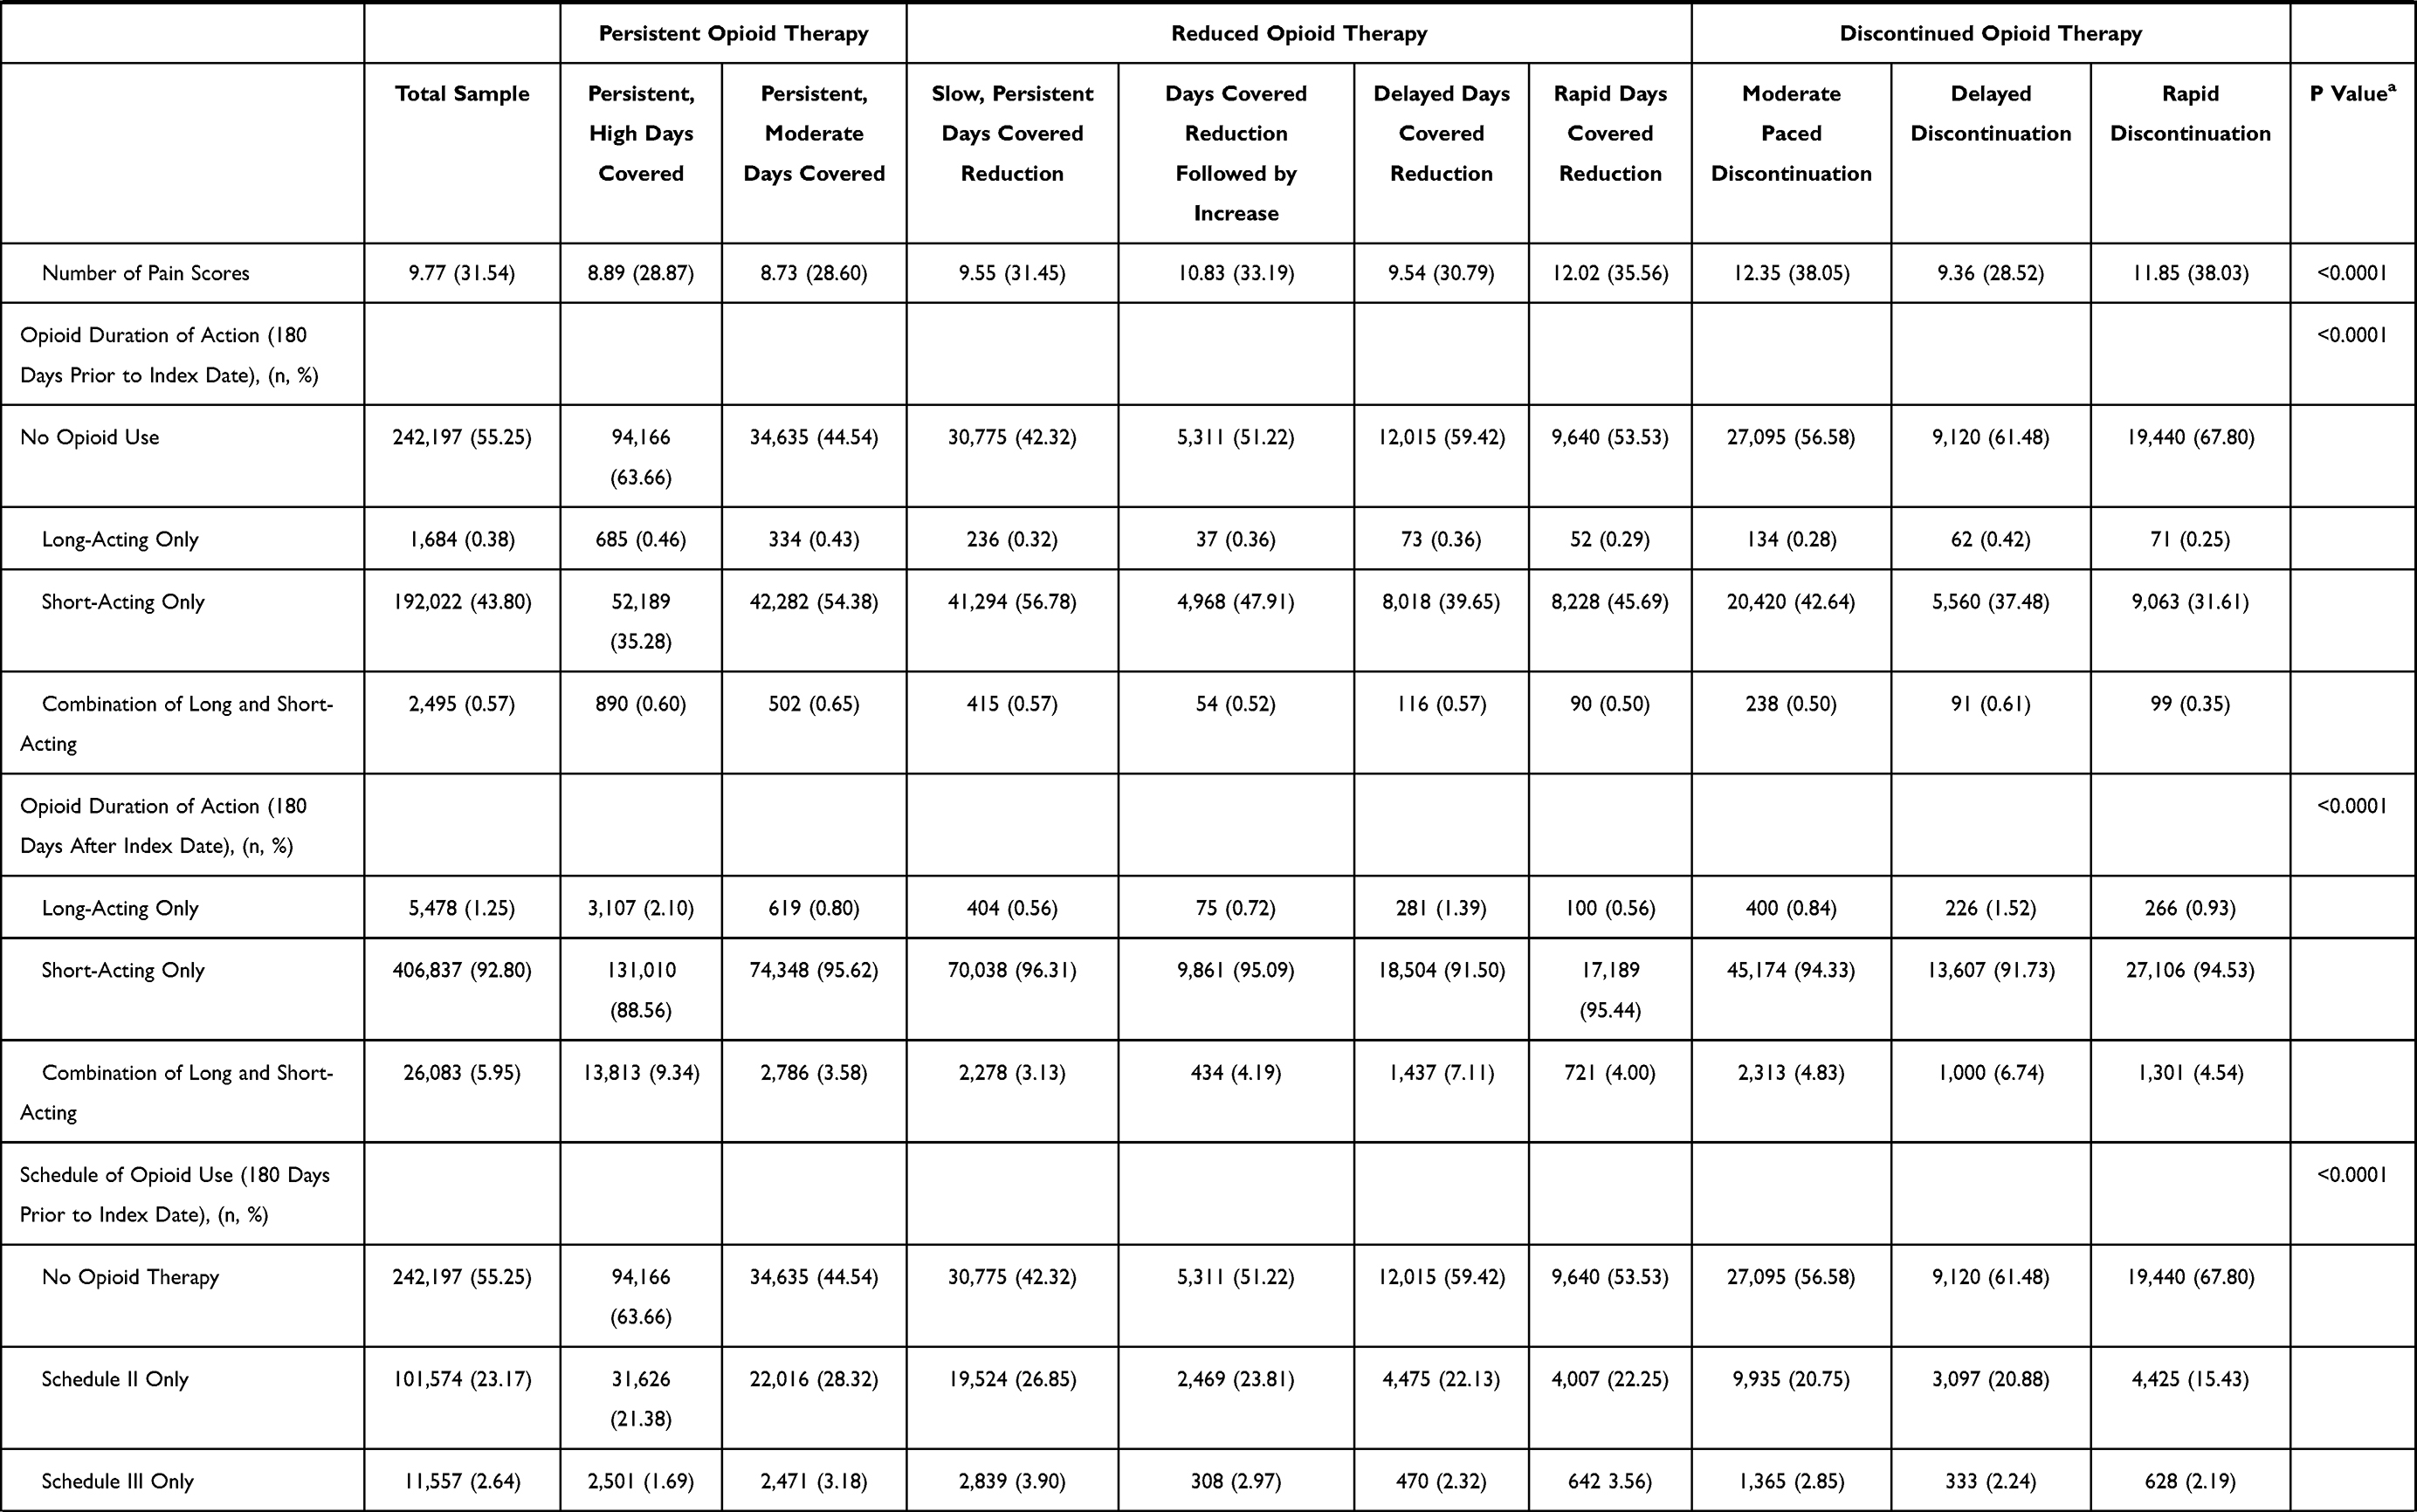 | 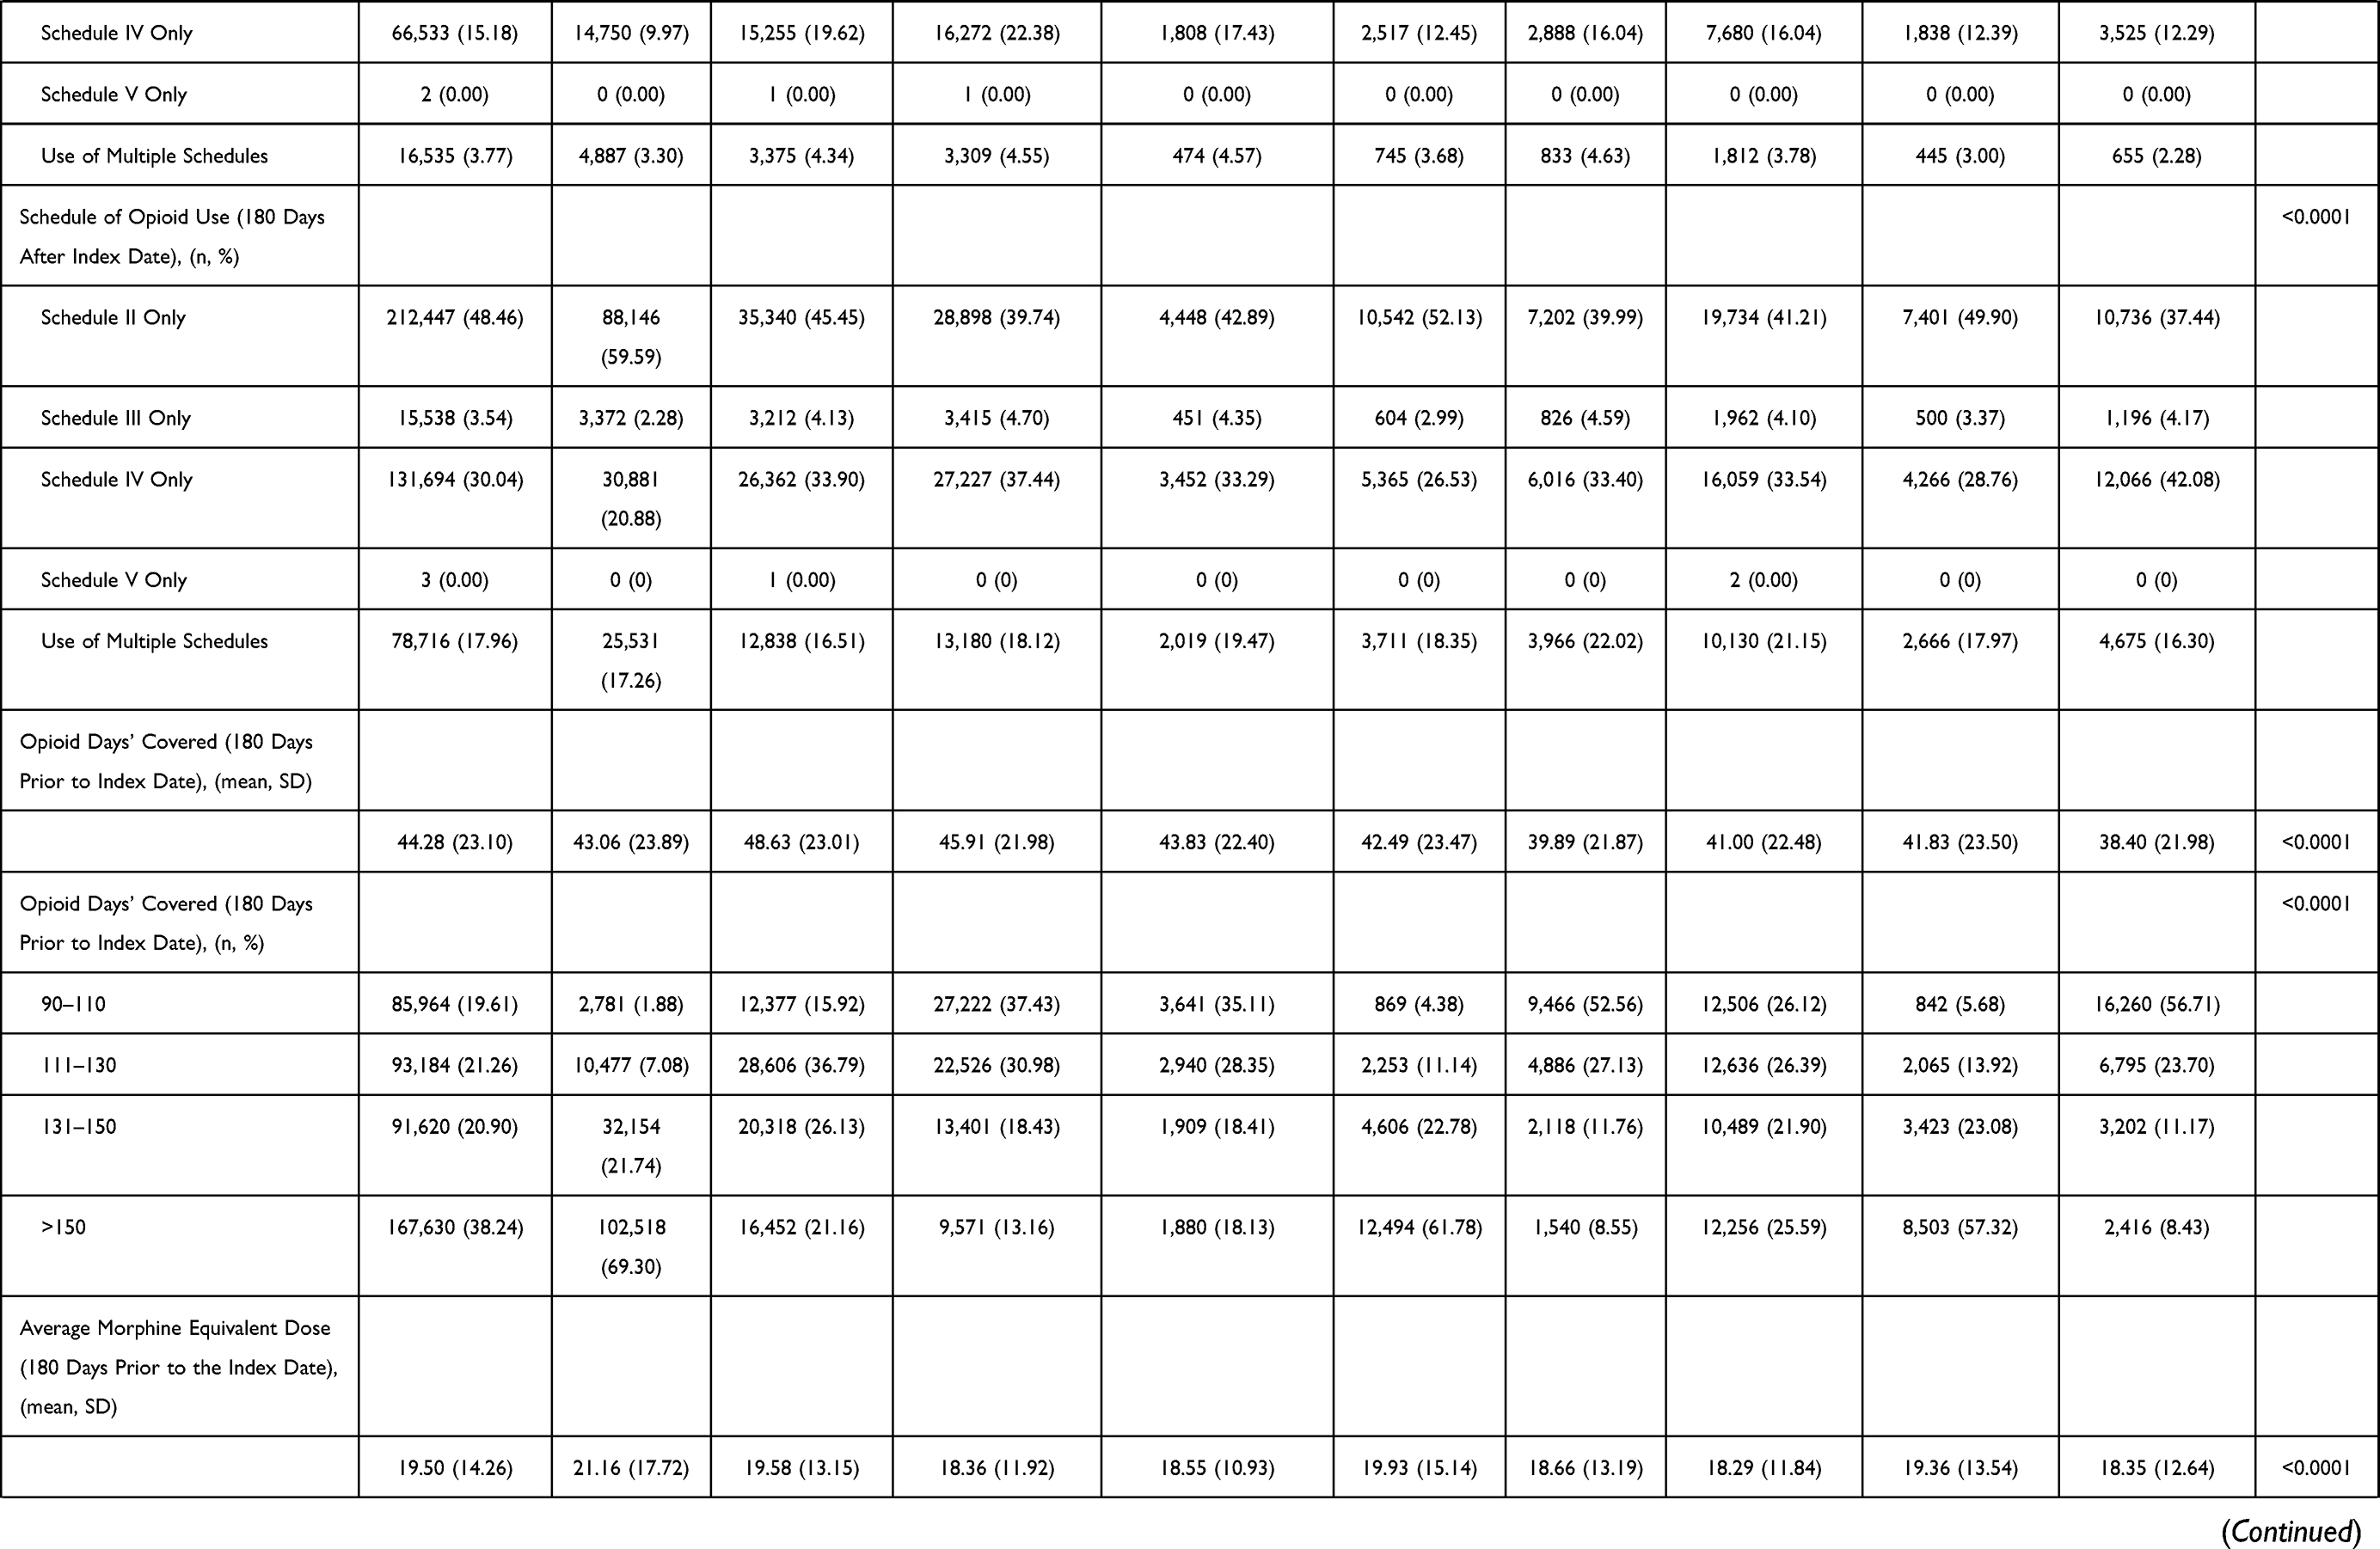 | 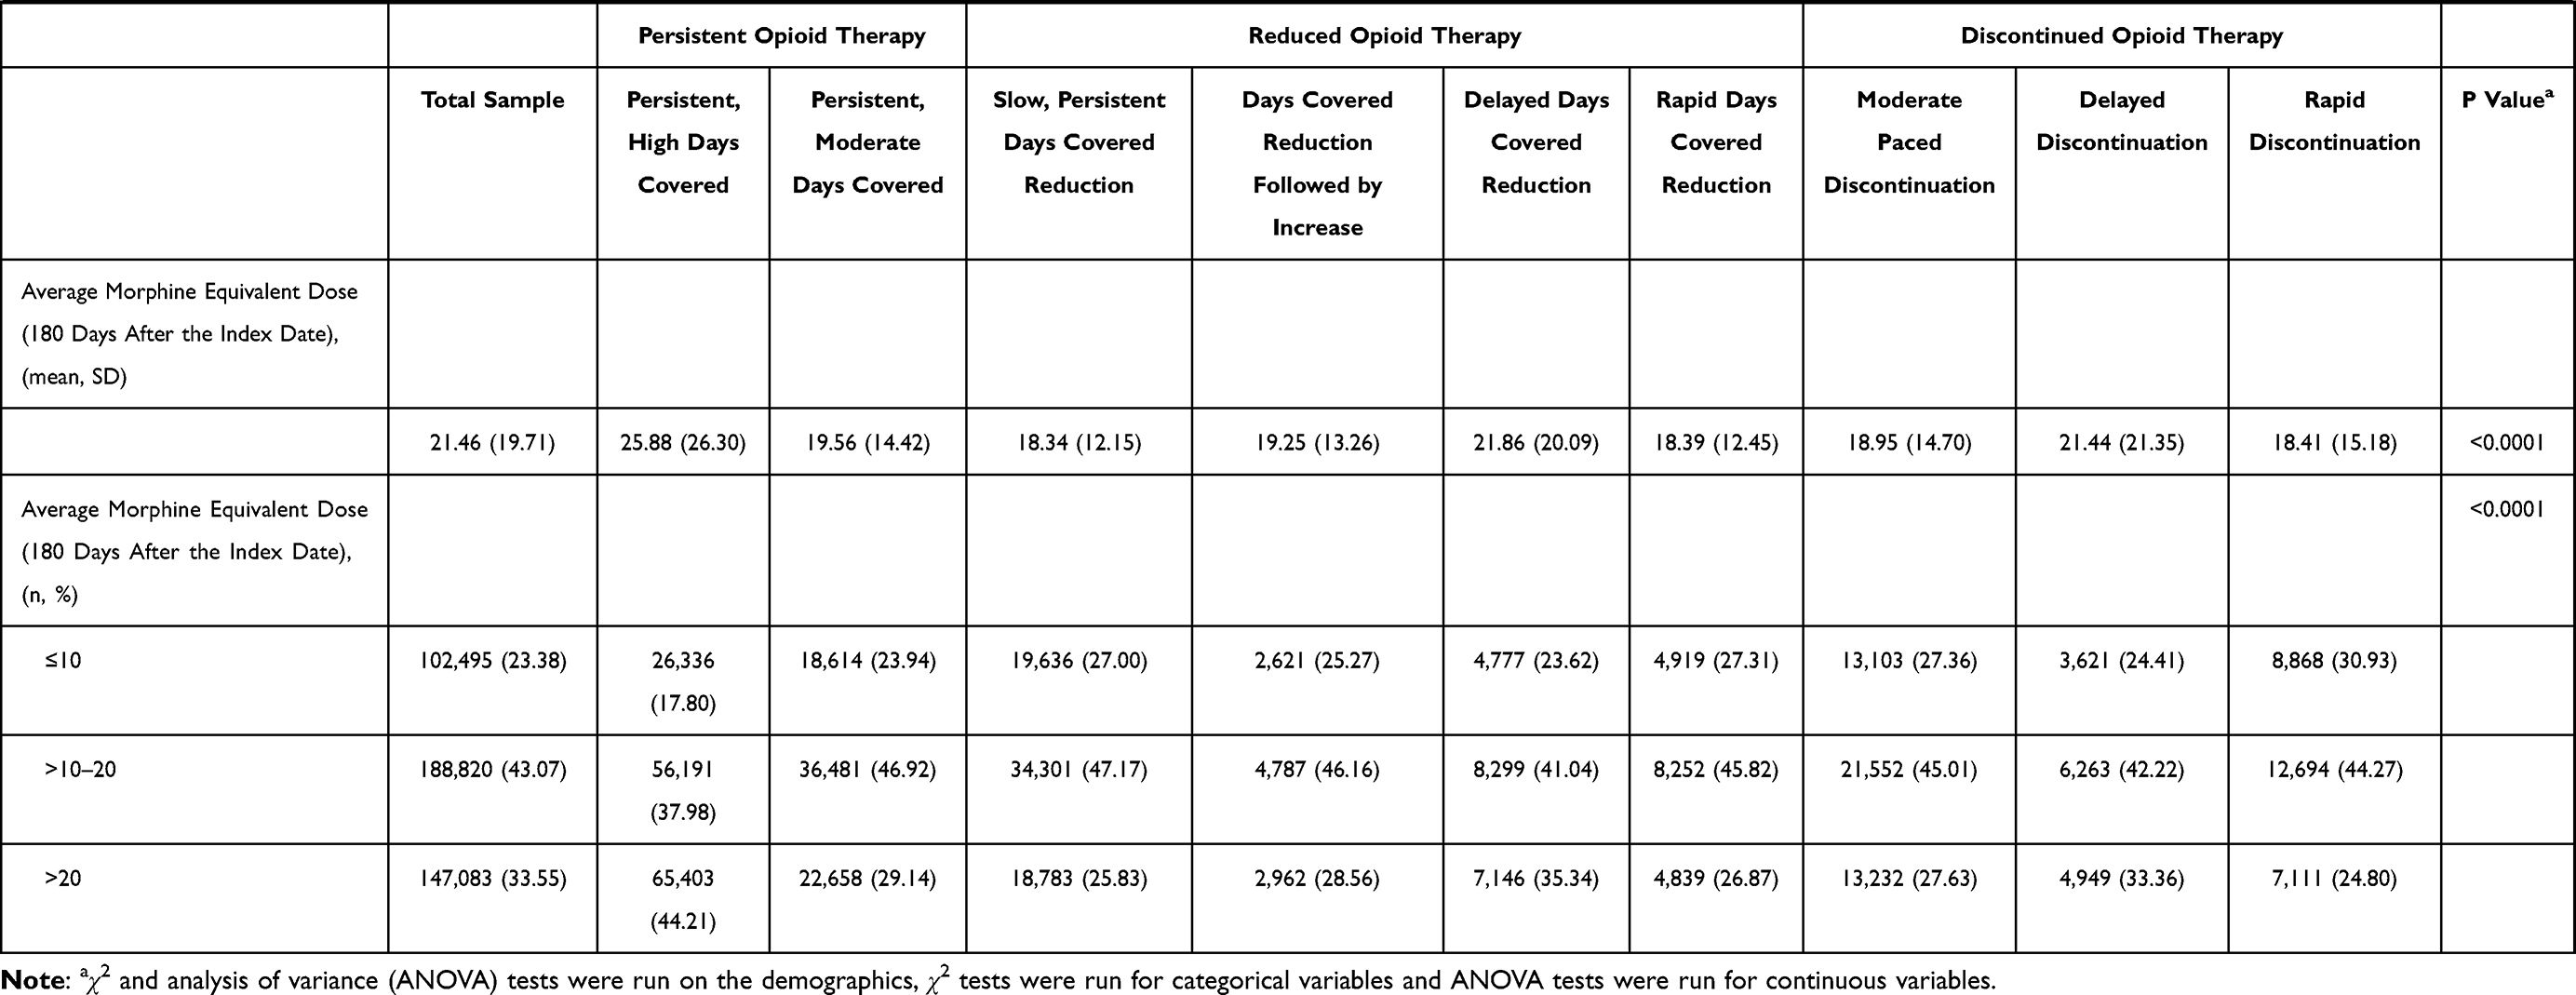 |
Table 2 Veteran Demographics by Opioid Trajectory |
Secondary Outcome: AMME Trajectories
After examining the BIC and Nagin’s diagnostic criteria, a model with eight distinct AMME trajectories was selected as the final model (Supplemental Tables 4 and 5).15 Supplemental Figure 3 graphically displays the predicted AMME over time for each trajectory. Most of the AMME trajectories were similar to days-covered trajectories (ie, delayed discontinuation, slow, persistent-dose reduction, persistent high dose, persistent moderate dose, rapid discontinuation/reduction, and dose reduction followed by increase). However, two unique trajectories emerged: midpoint discontinuation (6.7%, 95% CI: 6.6%–6.7%) and persistent, moderately high dose (26.7%, 95% CI: 26.6%–26.9%). Patients following the midpoint discontinuation trajectory had consistent dosing through 180 and 360 days after the index date, but discontinued completely between 360 and 540 days after the index date. Patients following the persistent, moderately high dose trajectory followed the same trajectory as those following the moderate-dose trajectory only with slightly higher doses (per logarithmic scale).
Discussion
Previous studies have evaluated initial opioid trajectories among opioid-naïve patients;34,35 however, to our knowledge, this is the first study to identify trajectories among patients initiating LTOT that provides insights on the course of opioid therapy among patients on the most risky opioid therapy regimens over the two years after initiating LTOT. Nine trajectories were identified that we broadly characterized into three overall opioid therapy patterns: persistent days of opioid coverage, reductions in opioid coverage, or discontinuation of opioid therapy. Despite the known risks of LTOT, the majority of veterans (>50%) experienced persistent days of opioid coverage, providing more evidence that once patients are initiated on LTOT for CNCP, the majority continue opioid therapy for two years or longer.36 The smallest percentage of veterans (~20%) experienced discontinuation of opioid therapy over the two years of follow-up. The trajectories within these three broad patterns that we characterized varied by rates of persistent opioid coverage, the time points when persons experienced discontinuation or reductions in opioid use and for one trajectory experienced an increase in opioid days covered after an initial reduction in opioid therapy.
Specific trajectories such as discontinuation and LTOT have been evaluated within the literature.13,37,38 It is clear from our study that more distinct trajectories exist within these overall categories, and general assessments of trajectories (eg, discontinuation) do not take into account the rate at which the trajectory occurs (eg, rapid, delayed, or slow persistent discontinuation). For example, the trajectory groups that emerged from these data suggest that a minority (31%) of patients discontinue opioids rapidly and over two-thirds of patients who discontinue opioids appear to undergo slow tapering regimens, which is supported by several guidelines.39,40 Limiting evaluations to all those who discontinue may ignore clinically relevant differences in opioid therapy over time that can affect patient quality of life and outcomes. Furthermore, many definitions of opioid therapy patterns such as LTOT and discontinuation take into account only a finite amount of time,23,41 while many veterans’ opioid therapy patterns occur over years. Investigating distinct trajectories within already identified patterns of use over longer time periods provides more insight into the longitudinal therapy patterns of veterans. Identification of these trajectories will also allow for future assessments of opioid-related adverse outcomes by patient trajectory to understand the potential negative consequences associated with each specific trajectory. This knowledge can help drive policy and clinical decisions on the long-term management of opioid therapy for those currently on LTOT.
The number of trajectory groups determined from this study, nine, could be debated depending on other criteria. Four of the nine trajectories observed in our study occur in fewer than 5% of the sample. It has been suggested that trajectories could be condensed if less than 5% of the cohort follows a specific trajectory.31 Since the purpose of this paper was to describe the expanse of trajectories that could be identified, we did not consider any trajectory too small and instead relied on goodness of fit indices to identify the optimal number of trajectories.31,32 However, we recognize that some of the trajectories identified may reflect subtle distinctions in opioid therapy over time that separate only a small proportion of patients initially on LTOT. For example, three of the four trajectories that reflect reductions in opioid therapy over time have fewer than 5% of subjects in each trajectory, and the distinction between these groups are driven mostly by the period in which opioid therapy was reduced. Future research is needed to determine if these subtle distinctions lead to differences in risks (eg, rates of opioid overdoses).
Patient characteristics within each trajectory give providers insight into which patients are more likely to follow trajectories resulting in the three overall types of trajectories. Veterans following trajectories of persistent opioid therapy are more likely to be White, be between the ages of 51–60, have back and/or neck pain only, have more mental health conditions (particularly multiple mental health conditions), have received opioid therapy prior to initiating LTOT, receive Schedule II opioids or multiple opioid schedules, use fewer alternative pain therapies, and have more days of opioid supply and higher doses prescribed to them before initiating LTOT. These findings are consistent with previous literature on the characteristics related to LTOT.42–45 However, the patient characteristics of the newly identified days-covered reduction and discontinuation trajectories show that patients following these trajectories are more likely to be persons of color,46–48 of older and younger age ranges, have arthritis only, have no mental health conditions, use more supportive services such as physical therapy and mental health, use short-acting, Schedule IV opioids only, and have received no opioid therapy prior to initiating LTOT. Some of these factors such as physical therapy, mental health service utilization, and non-opioid analgesic therapy are modifiable and may play a role in patients’ probability of following shorter opioid trajectories. In addition, the number of pain scores documented in the medical record is higher for patients following shorter trajectories, indicating that higher-intensity care may also be associated with shorter opioid trajectories. These differences in patient characteristics may give a clinician insight into which trajectory each patient is likely to follow while also giving the clinician the opportunity potentially to modify the patient’s trajectory.
The AMME trajectories did not provide many additional insights, mostly because dose is dependent on having days of opioid coverage, and therefore, the AMME trajectories largely mimicked days’ covered trajectories. In addition, characteristic to veterans and similar to a previous study of veterans,18 the AMME remained relatively low, which may differ from civilian populations. Unlike the days’ covered trajectories, the AMME trajectories separated those who had delayed discontinuation (discontinuing between 540 and 720 days after the index date) and those with midpoint discontinuation (discontinuing between 360 and 540 days after the index date). It also parsed groups with moderately high and moderate doses.
Limitations
Several limitations exist with this study. First, findings from these analyses in veterans may not be generalizable to the civilian population due to their military background and because veterans are mostly White males. Second, the model groups all patients into a trajectory regardless of fit; therefore, some patients may be forced into trajectories that do not optimally represent their opioid therapy patterns. However, this is likely to represent few patients given we have taken a more inclusive and comprehensive approach to defining trajectories than previous studies.31 Third, days covered from prescription fill records does not indicate opioid use; instead, prescription fill records only indicate what the patient received. However, previous studies have found high positive and negative predictive values between claims data and self-reported medication use.49,50 Lastly, using VHA data from CDW does not allow for obtaining information on opioid fills outside of the VHA. It is possible and likely that some of these veterans may seek opioid medications outside of the VHA system, particularly after discontinuing opioid therapy. A recent study has found that 32% of veterans on LTOT received concurrent non-VHA opioid prescriptions.51,52 To mitigate incorrectly classifying discontinued opioid therapy when opioids were accessed in non-VHA settings, our study censored veterans’ data at the first 180 days window when they did not have at least one VHA visit (inpatient or outpatient) or receive one prescription fill from the VHA. This provides some consistency in use of the VHA for healthcare needs.
Conclusion
Over half of veterans initiated on LTOT continue in their persistent use of opioid therapy, approximately 20% discontinue opioid therapy, and the remainder experience reductions in opioid therapy over two years of follow-up. Individual trajectories within these broad therapy patterns differ in the days covered of persistent opioid therapy or rates of opioid therapy decreases within the reduction and discontinuation patterns, resulting in nine distinct trajectory patterns among veterans who initiate LTOT. Patient characteristics and modifiable factors such as intensive pain monitoring and use of physical therapy services differed between the trajectories. Further research is needed to assess the risks of opioid-related adverse outcomes among the identified trajectories.
Acknowledgments
The authors would like to thank Cindy Reid for her help with technical editing and submission of the manuscript.
Funding
Research reported in this publication was supported by the National Institute on Drug Abuse of the National Institutes of Health under Award Number R36DA046717. The content is solely the responsibility of the authors and does not necessarily represent the official views of the National Institutes of Health. Dr. Hayes was also supported by the National Institute on Drug Abuse under the Translational Training in Addiction Grant [1T32 DA 022981]. This material is the result of work supported with resources and the use of facilities at the Veterans Health Administration.
Disclosure
Dr. Martin receives royalties from TrestleTree LLC for the commercialization of an opioid risk prediction tool, which is unrelated to the current study. Dr. Martin is a paid consultant for eMaxHealth Systems for unrelated projects; also serves as a member of the Midwest CEPAC of ICER and receives compensation for reviews for work unrelated to this study. The remaining authors have no conflicts of interest to declare.
References
1. Andrew R, Derry S, Taylor RS, Straube S, Phillips CJ. The costs and consequences of adequately managed chronic non-cancer pain and chronic neuropathic pain. Pain Pract. 2014;14(1):79–94. doi:10.1111/papr.12050
2. Kerns RD, Otis J, Rosenberg R, Reid MC. Veterans’ reports of pain and associations with ratings of health, health-risk behaviors, affective distress, and use of the healthcare system. J Rehabil Res Dev. 2003;40(5):371–379. doi:10.1682/JRRD.2003.09.0371
3. Wu PC, Lang C, Hasson NK, Linder SH, Clark DJ. Opioid use in young veterans. J Opioid Manag. 2010;6(2):133–139. doi:10.5055/jom.2010.0013
4. Dobscha SK, Morasco BJ, Duckart JP, Macey T, Deyo RA. Correlates of prescription opioid initiation and long-term opioid use in veterans with persistent pain. Clin J Pain. 2013;29(2):102–108. doi:10.1097/AJP.0b013e3182490bdb
5. Minegishi T, Frakt A. Reducing long-term opioid use in the veterans health administration. J Gen Intern Med. 2018;33(6):781–782. doi:10.1007/s11606-018-4352-7
6. Hudson TJ, Painter JT, Martin B, et al. Pharmacoepidemiologic analyses of opioid use among OEF/OIF/OND veterans. Pain. 2017;158:1039. doi:10.1097/j.pain.0000000000000874
7. Els C, Jackson TD, Kunyk D, et al. Adverse events associated with medium- and long-term use of opioids for chronic non-cancer pain: an overview of cochrane reviews. Cochrane Database Syst Rev. 2017;10(10):CD012509. doi:10.1002/14651858.CD012509.pub2
8. Morasco BJ, Dobscha SK. Prescription medication misuse and substance use disorder in VA primary care patients with chronic pain. Gen Hosp Psychiatry. 2008;30(2):93–99. doi:10.1016/j.genhosppsych.2007.12.004
9. Seal KH, Shi Y, Cohen G, et al. Association of mental health disorders with prescription opioids and high-risk opioid use in US veterans of Iraq and Afghanistan. JAMA. 2012;307(9):940–947. doi:10.1001/jama.2012.234
10. Baldini A, Von Korff M, Lin EHB. A review of potential adverse effects of long-term opioid therapy: a practitioner’s guide. Prim Care Companion CNS Disord. 2012;14(3). doi:10.4088/PCC.11m01326
11. Gomes T, Mamdani MM, Dhalla IA, Paterson JM, Juurlink DN. Opioid dose and drug-related mortality in patients with nonmalignant pain. Arch Intern Med. 2011;171(7):686–691. doi:10.1001/archinternmed.2011.117
12. Mark TL, Parish W. Opioid medication discontinuation and risk of adverse opioid-related health care events. J Subst Abuse Treat. 2019;103:58–63. doi:10.1016/j.jsat.2019.05.001
13. Oliva EM, Bowe T, Manhapra A, et al. Associations between stopping prescriptions for opioids, length of opioid treatment, and overdose or suicide deaths in US veterans: observational evaluation. BMJ. 2020;368. doi:10.1136/bmj.m283
14. Curran PJ, Muthen BO. The application of latent curve analysis to testing developmental theories in intervention research. Am J Community Psychol. 1999;27(4):567–595. doi:10.1023/A:1022137429115
15. Nagin DS. Group-based modeling of development. Harvard University Press; 2005.
16. About VHA - Veterans Health Administration. Available from: https://www.va.gov/health/aboutvha.asp.
17. Edlund MJ, Austen MA, Sullivan MD, et al. Patterns of opioid use for chronic noncancer pain in the Veterans Health Administration from 2009 to 2011. Pain. 2014;155(11):2337–2343. doi:10.1016/j.pain.2014.08.033
18. Vanderlip ER, Sullivan MD, Edlund MJ, et al. National study of discontinuation of long-term opioid therapy among veterans. Pain. 2014;155(12):2673–2679. doi:10.1016/j.pain.2014.09.034
19. Edlund MJ, Martin BC, Devries A, Fan M-Y, Braden JB, Sullivan MD. Trends in use of opioids for chronic noncancer pain among individuals with mental health and substance use disorders: the TROUP study. Clin J Pain. 2010;26(1):1–8. doi:10.1097/AJP.0b013e3181b99f35
20. Centers for Disease Control and Prevention. Calculating total daily dose of opioids for safer dosage. Centers for Disease Control and Prevention; 2017. Available from: https://www.cdc.gov/drugoverdose/pdf/calculating_total_daily_dose-a.pdf.
21. Edlund MJ, Steffick D, Hudson T, Harris KM, Sullivan M. Risk factors for clinically recognized opioid abuse and dependence among veterans using opioids for chronic non-cancer pain. Pain. 2007;129(3):355–362. doi:10.1016/j.pain.2007.02.014
22. Sullivan MD, Edlund MJ, Fan MY, Devries A, Brennan braden J, Martin BC. Risks for possible and probable opioid misuse among recipients of chronic opioid therapy in commercial and medicaid insurance plans: the TROUP study. Pain. 2010;150(2):332–339. doi:10.1016/j.pain.2010.05.020
23. Hayes CJ, Krebs EE, Hudson T, Brown J, Li C, Martin BC. Impact of opioid dose escalation on the development of substance use disorders, accidents, self‐inflicted injuries, opioid overdoses and alcohol and non‐opioid drug‐related overdoses: a retrospective cohort study. Addiction. 2020;115:
24. Rural Urban Commuting Area Codes Data. Available from: http://depts.washington.edu/uwruca/ruca-uses.php.
25. Charlson ME, Charlson RE, Peterson JC, Marinopoulos SS, Briggs WM, Hollenberg JP. The Charlson comorbidity index is adapted to predict costs of chronic disease in primary care patients. J Clin Epidemiol. 2008;61(12):1234–1240. doi:10.1016/j.jclinepi.2008.01.006
26. Gressler. LE, Martin BC, Hudson TJ, Painter JT. The relationship between concomitant benzodiazepine-opioid use and adverse outcomes among U.S. veterans. Pain. 2017;159(3):1. doi:10.1097/j.pain.0000000000001111
27. Cho J, Spence MM, Niu F, Hui RL, Gray P, Steinberg S. Risk of overdose with exposure to prescription opioids, benzodiazepines, and non-benzodiazepine sedative-hypnotics in adults: a retrospective cohort study. J Gen Intern Med. 2020;35(3):696–703. doi:10.1007/s11606-019-05545-y
28. Turner BJ, Liang Y. Drug overdose in a retrospective cohort with non-cancer pain treated with opioids, antidepressants, and/or sedative-hypnotics: interactions with mental health disorders. J Gen Intern Med. 2015;30(8):1081–1096. doi:10.1007/s11606-015-3199-4
29. Garg RK, Fulton-Kehoe D, Franklin GM. Patterns of opioid use and risk of opioid overdose death among medicaid patients. Med Care. 2017;55(7):661–668. doi:10.1097/MLR.0000000000000738
30. Drug scheduling. Available from: https://www.dea.gov/drug-scheduling.
31. Lo-Ciganic WH, Gellad WF, Gordon AJ, et al. Association between trajectories of buprenorphine treatment and emergency department and in-patient utilization. Addiction. 2016;111(5):892–902. doi:10.1111/add.13270
32. Nagin DS, Odgers CL. Group-based trajectory modeling in clinical research. Annu Rev Clin Psychol. 2010;6(1):109–138. doi:10.1146/annurev.clinpsy.121208.131413
33. traj: group-based modeling of longitudinal data. Available from: http://www.andrew.cmu.edu/user/bjones/.
34. Brunet L, Napravnik S, Heine AD, Leone PA, Eron JJ. Longitudinal opioid use among HIV-infected patients, 2000 to 2014. J Acquir Immune Defic Syndr. 2017;75:77–80. doi:10.1097/QAI.0000000000001321
35. Elmer J, Fogliato R, Setia N, et al. Trajectories of prescription opioids filled over time. PLoS One. 2019;14(10):e0222677. doi:10.1371/journal.pone.0222677
36. Martin BC, Fan M-Y, Edlund MJ, Devries A, Braden JB, Sullivan MD. Long-term chronic opioid therapy discontinuation rates from the TROUP study. J Gen Intern Med. 2011;26(12):1450–1457. doi:10.1007/s11606-011-1771-0
37. James JR, Scott JAM, Klein JW, et al. Mortality after discontinuation of primary care–based chronic opioid therapy for pain: a retrospective cohort study. J Gen Intern Med. 2019;34(12):2749–2755. doi:10.1007/s11606-019-05301-2
38. Demidenko MI, Dobscha SK, Morasco BJ, Meath THA, Ilgen MA, Lovejoy TI. Suicidal ideation and suicidal self-directed violence following clinician-initiated prescription opioid discontinuation among long-term opioid users. Gen Hosp Psychiatry. 2017;47:29–35. doi:10.1016/j.genhosppsych.2017.04.011
39. Dowell D, Haegerich TM, Chou R. CDC guideline for prescribing opioids for chronic pain — United States, 2016. MMWR Recomm Rep. 2016;65(1):1–49. doi:10.15585/mmwr.rr6501e1er
40. Veterans Health Administration, Department of Defense. VA/DoD clinical practice guideline for the management of opioid therapy for chronic pain. V1.0. 2003.
41. Hayes CJ, Krebs EE, Hudson T, Brown J, Li C, Martin BC. Impact of opioid dose escalation on pain intensity. Pain. 2020;161:979–988. doi:10.1097/j.pain.0000000000001784
42. Edlund MJ, Martin BC, Fan MY, Braden JB, Devries A, Sullivan MD. An analysis of heavy utilizers of opioids for chronic noncancer pain in the TROUP study. J Pain Symptom Manage. 2010;40(2):279–289. doi:10.1016/j.jpainsymman.2010.01.012
43. Sullivan MD, Edlund MJ, Fan MY, Devries A, Brennan Braden J, Martin BC. Trends in use of opioids for non-cancer pain conditions 2000–2005 in commercial and Medicaid insurance plans: the TROUP study. Pain. 2008;138(2):440–449. doi:10.1016/j.pain.2008.04.027
44. Shah A, Hayes CJ, Martin BC. Characteristics of initial prescription episodes and likelihood of long-term opioid use — United States, 2006–2015. MMWR Morb Mortal Wkly Rep. 2017;66(10):265–269. doi:10.15585/mmwr.mm6610a1
45. Shah A, Hayes CJ, Martin BC. Factors influencing long-term opioid use among opioid naive patients: an examination of initial prescription characteristics and pain etiologies. J Pain. 2017;18(11):1374–1383. doi:10.1016/j.jpain.2017.06.010
46. Alexander MJ, Kiang MV, Barbieri M. Trends in black and white opioid mortality in the United States, 1979–2015. Epidemiology. 2018;29(5):707–715. doi:10.1097/EDE.0000000000000858
47. Pletcher MJ, Kertesz SG, Kohn MA, Gonzales R. Trends in opioid prescribing by race/ethnicity for patients seeking care in US emergency departments. JAMA. 2008;299(1):70–78. doi:10.1001/jama.2007.64
48. Tamayo-Sarver JH, Hinze SW, Cydulka RK, Baker DW. Racial and ethnic disparities in emergency department analgesic prescription. Am J Public Health. 2003;93(12):2067–2073. doi:10.2105/AJPH.93.12.2067
49. Zhao JP, Sheehy O, Gorgui J, Bérard BA. Can we rely on pharmacy claims databases to ascertain maternal use of medications during pregnancy? Birth Defects Res. 2017;109(6):423–431. doi:10.1002/bdra.23604
50. Sjahid SI, Van Der Linden PD, Stricker BHC. Agreement between the pharmacy medication history and patient interview for cardiovascular drugs: the Rotterdam elderly study. Br J Clin Pharmacol. 1998;45(6):591–595. doi:10.1046/j.1365-2125.1998.00716.x
51. In progress: improving opioid safety. Available from: https://www.hsrd.research.va.gov/publications/inprogress/sep18/default.cfm?InProgressMenu=aug18-3&utm_source=InProgress&utm_medium=email&utm_campaign=InProgress0918.
52. IIR 15–091 – HSR&D study. Available from: https://www.hsrd.research.va.gov/research/abstracts.cfm?Project_ID=2141704533.
 © 2021 The Author(s). This work is published and licensed by Dove Medical Press Limited. The full terms of this license are available at https://www.dovepress.com/terms.php and incorporate the Creative Commons Attribution - Non Commercial (unported, v3.0) License.
By accessing the work you hereby accept the Terms. Non-commercial uses of the work are permitted without any further permission from Dove Medical Press Limited, provided the work is properly attributed. For permission for commercial use of this work, please see paragraphs 4.2 and 5 of our Terms.
© 2021 The Author(s). This work is published and licensed by Dove Medical Press Limited. The full terms of this license are available at https://www.dovepress.com/terms.php and incorporate the Creative Commons Attribution - Non Commercial (unported, v3.0) License.
By accessing the work you hereby accept the Terms. Non-commercial uses of the work are permitted without any further permission from Dove Medical Press Limited, provided the work is properly attributed. For permission for commercial use of this work, please see paragraphs 4.2 and 5 of our Terms.