")
Back to Journals » Clinical Epidemiology » Volume 13
Trajectories of Musculoskeletal Healthcare Utilization of People with Chronic Musculoskeletal Pain – A Population-Based Cohort Study
Authors Mose S , Kent P , Smith A, Andersen JH, Christiansen DH
Received 9 June 2021
Accepted for publication 20 August 2021
Published 17 September 2021 Volume 2021:13 Pages 825—843
DOI https://doi.org/10.2147/CLEP.S323903
Checked for plagiarism Yes
Review by Single anonymous peer review
Peer reviewer comments 2
Editor who approved publication: Dr Eyal Cohen
Video abstract of "Trajectories of musculoskeletal healthcare utilization" [ID 323903].
Views: 101
Søren Mose,1,2 Peter Kent,3,4 Anne Smith,3 Johan Hviid Andersen,1 David Høyrup Christiansen1
1Department of Occupational Medicine, Danish Ramazzini Centre - University Research Clinic, Herning, Denmark; 2School of Physiotherapy, VIA University College, Holstebro, Denmark; 3Curtin School of Allied Health, Curtin University, Perth, WA, Australia; 4Center for Muscle and Joint Health, University of Southern Denmark, Odense, Denmark
Correspondence: Søren Mose
Department of Occupational Medicine, Danish Ramazzini Centre - University Research Clinic, Gl. Landevej 61, Herning, 7400, Denmark
Tel +45 87552371
Email [email protected]
Background and Aim: Chronic musculoskeletal pain is common and associated with more general healthcare-seeking. However, musculoskeletal-related healthcare utilization is under-explored. This study aimed to explore, describe and profile trajectories of long-term musculoskeletal healthcare for people reporting chronic musculoskeletal pain.
Methods: This exploratory prognostic cohort study combined survey and national health register data from a representative group of adult Danes reporting chronic musculoskeletal pain (N = 2929). Trajectories of long-term musculoskeletal healthcare use were generated using latent class growth analysis. Types of healthcare-seeking, individual, sociodemographic, health, belief and work-related factors were used to describe and profile identified trajectories.
Results: We identified five distinct trajectories of long-term musculoskeletal healthcare utilization (low stable, low ascending, low descending, medium stable and high stable). The low stable trajectory group (no or almost no annual contacts) represented 39% of the sample, whereas the high stable trajectory group (consistent high number of annual contacts) represented 8%. Most healthcare-seeking was in primary healthcare settings (GP/physiotherapy/chiropractor). Opioid consumption was primarily in the high stable trajectory group, and surgery was rare. There were statistically significant differences across the five trajectory groups in individual, sociodemographic, health, belief and work-related profiles.
Conclusion: Long-term use of musculoskeletal healthcare services varied in this chronic musculoskeletal pain population. Almost 40% coped without seeking care, whereas 8% had consistent high use of healthcare services. Chronic musculoskeletal pain was mostly managed in primary care settings, which aligns with musculoskeletal guidelines, as did the use of pain medication and surgery. People with different musculoskeletal healthcare trajectories had different individual, sociodemographic, health, belief and work-related profiles.
Keywords: musculoskeletal, chronic musculoskeletal pain, healthcare utilization, latent class growth analysis, healthcare registers
Introduction
Chronic pain is common with a prevalence of 20–40% across diverse populations around the world1,2 and is associated with increased medical costs and considerable economic burden for individuals and society.2,3 People reporting chronic pain have the largest morbidity (when measured as years lived with disability) and chronic pain negatively impacts physical function and quality of life.2,4 Chronic pain is generally defined as pain lasting >3 months or as pain persisting beyond the time of expected healing5 and among people reporting chronic pain, musculoskeletal pain is the most prevalent reported condition.2
Chronic pain is associated with higher use of healthcare services,6–10 even though only a proportion (16–46%) of people with chronic pain seek healthcare.11,12 Those who seek healthcare due to pain seem to have varying pathways and consult diverse healthcare professionals in different healthcare sectors (eg, General Practitioners (GP), Chiropractors, Physiotherapists, Orthopaedic surgeons, Rheumatologists, Pain specialists) and may receive very different treatment modalities (eg, medication, rest, manual therapy, exercise, cognitive-based approaches, surgery).7 People with chronic musculoskeletal pain who seek care often have healthcare-seeking pathways that do not align with musculoskeletal pain management guidelines.13,14 Such pathways are often characterized by multiple referrals and examinations, and often lead to referrals or consultations with surgeons rather than to pain specialists or pain rehabilitation units.14 However, types of musculoskeletal healthcare utilization for people with chronic musculoskeletal pain have not yet been thoroughly described.
Several factors are associated with high levels of healthcare utilization due to pain.7,15 These include older age,7,15,16 low socioeconomic status,7,16 marital status (people never married seek healthcare less often than those married)17 and being female,7,15,18 high pain intensity,18–20 high level of disability,18,19,21 number of pain sites,21 comorbidity,16 body mass index (BMI), poor general health,15,16,22 negative health beliefs (health anxiety, catastrophizing, fear avoidance),15,22,23 being retired or unemployed,8 and previous healthcare use.22,24 Personality has also been suggested as an important factor in the development of pain and coping strategies – including healthcare-seeking.25 However, these findings are inconsistent and contradictory across studies,7,21,23,26 and few studies have explored factors associated with musculoskeletal healthcare utilization.
More knowledge about long-term trajectories of musculoskeletal healthcare utilization for people with chronic musculoskeletal pain could help to identify those at risk of non-guideline adherent pathways and help to design alternative clinical pathways in order to improve prognosis, quality of life and optimize the use of healthcare resources.
Therefore, the aims of this study were to 1) explore trajectories of musculoskeletal healthcare utilization in people with chronic musculoskeletal pain, 2) describe the types and use of musculoskeletal healthcare services (eg, primary/secondary healthcare, medication, rehabilitation) within such trajectories, and 3) profile any identified trajectories on individual, sociodemographic, health, belief and work-related factors.
Materials and Methods
Design
This is an exploratory prognostic cohort study27 with ten-years of register-based follow-up data from adults reporting chronic musculoskeletal pain.
Population
We included individuals from a population-based cohort who reported musculoskeletal pain for more than three months in any body region when the cohort was originally established in 2008. This cohort has been described in detail elsewhere.28–30 A baseline questionnaire was sent to 8517 people between 17 and 64 years of age of whom 5097 people responded. The baseline questionnaire covered a range of demographics, personal, work-related, psychosocial and health-related domains, including questions about pain. Duration of pain history was measured using the pain module of the Standard Evaluation Questionnaire (SEQ).31 SEQ is reliable and valid for the assessment of pain in population-based observational studies and the Danish version of the SEQ has acceptable reliability and convergent construct validity has been confirmed.31,32 We used the International Association for the Study of Pain (IASP) definition of chronic pain >3 months as it is a foundational criterion for the ICD-11 diagnosis of chronic pain.33 This definition has been widely used to define chronic pain populations in epidemiological studies across clinical diagnoses.34
Of the 5097 individuals (59.7%) returning the baseline questionnaire in 2008, 4871 (57.2%) were identifiable, alive, and living in Denmark during the follow-up period. We excluded 1816 individuals without chronic musculoskeletal pain at baseline and 126 with ambiguous answers about pain duration, leaving 2929 individuals with chronic musculoskeletal pain suitable for analysis (see Figure 1).
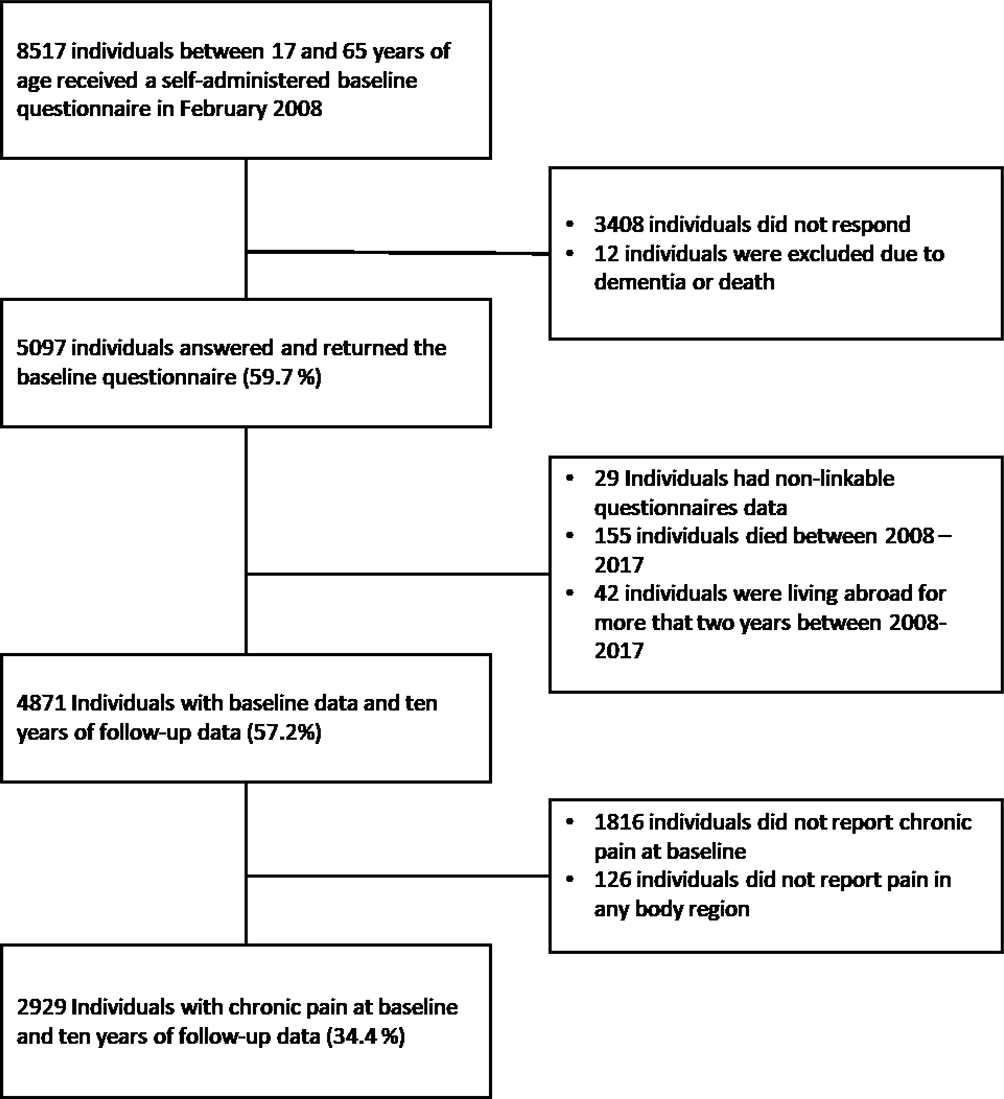 |
Figure 1 Flowchart. |
Healthcare Contacts
In order to generate trajectories of musculoskeletal healthcare utilization, we counted the annual number of face-to-face healthcare contacts for musculoskeletal conditions and the redeemed pain medication prescriptions for the entire cohort from 2008 to 2017 in Danish healthcare registers.35,36 In Denmark, nearly all healthcare is fully or partly funded by the state and therefore recorded at an individual person level across a number of registers by the national authorities. This Nordic tradition of record keeping results in extensive networks of inter-linkable longitudinal population-based registries suitable for epidemiological research. Using the unique Danish Civil Personal Register number assigned to all Danish residents, it is possible to link register data to other sources of data (like research questionnaires) at the individual person level.35 Data on musculoskeletal healthcare utilization was obtained from the National Patient Register, the National Health Insurance Service Register, the Register of Medicinal Product Statistics and the Rehabilitation According to “The Danish Act of Health §140” register (Rehab-register).
The National Patient Register is the central register for recording activity in the Danish secondary healthcare system. The National Patient Register contains information on hospital admissions since 1978 and all outpatient hospital contacts since 1994. Registration in the National Patient Register is based on the Healthcare Classification System,37 and diagnostic criteria are the International Statistical Classification of Diseases and Related Health Problems 10th Revision (ICD-10) diagnostic codes. In general, data from the National Patient Register are considered valid, but the positive predictive values of diagnostic codes can vary for different diseases and types of treatment.38
The National Health Insurance Service Register was established in 1990 and contains information on all fully or partly public founded primary healthcare services based on the week of reimbursement.39,40 A minor proportion of primary healthcare physiotherapy and chiropractic consultations are fully self-funded, hence not recorded in the National Health Insurance Service Register. This proportion of physiotherapy and chiropractor healthcare has been estimated to about 15% by the Danish Physiotherapist Association.41
The Register of Medicinal Product Statistics includes information about prescription medicinal products sold over-the-counter, as well as medication used for hospitalized patients. Information about sales of medicinal products in Denmark has been recorded since 1994.36,42,43
Rehab-register was established in 2007. According to Danish law, after hospital admission or outpatient encounters, patients can be referred to publicly funded physiotherapy and occupational therapy rehabilitation if medically indicated. The Rehab-register contains information about this type of rehabilitation.
The algorithm for counting annual number of musculoskeletal healthcare contacts is presented in Table 1 and supplementary material - Appendix A.
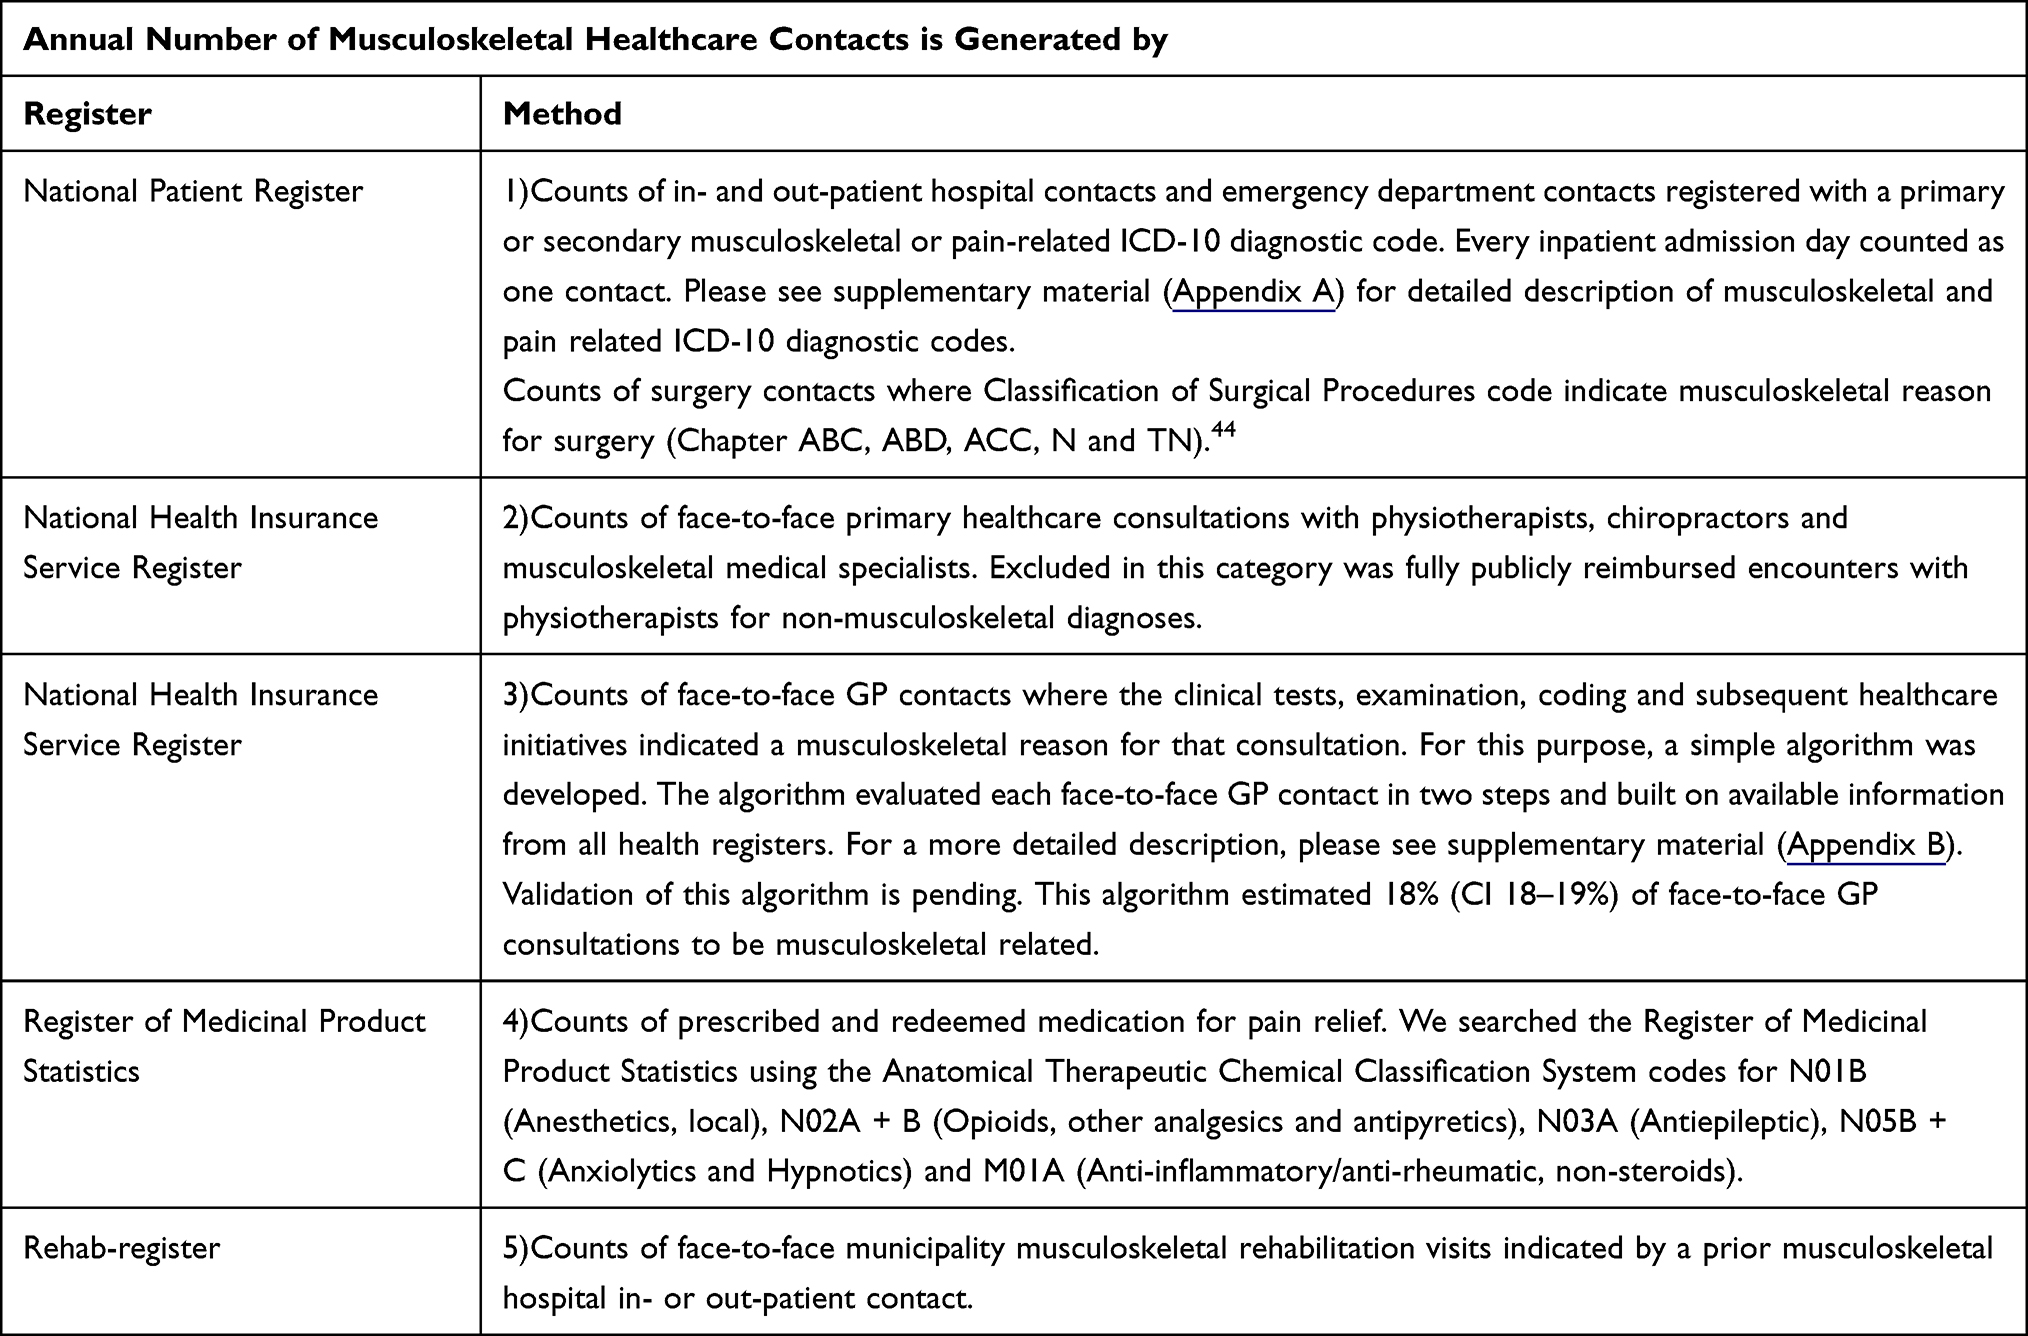 |
Table 1 Algorithm for Counting Annual Number of Musculoskeletal Healthcare Contacts |
Descriptive Profiling Variables
For descriptive multidimensional profiling, we use items and domains from the baseline questionnaire and national registers. As some variables may have different prognostic influence over time, we allowed for both baseline and longitudinal profiling variables. Variables measured at baseline will also be referred to as candidate prognostic factors.27 The following items were used:
Individual and Sociodemographic Factors
Data on sex and age at baseline was obtained from the Danish Civil Registration System.35,45,46 Age was analysed as a continuous variable.
Marital status and number of resident children under the age of eighteen were obtained from the Danish Civil Registration System.46 We combined these data for each follow-up year into the following four nominal categories: 1) Cohabitant with resident child/children, 2) Cohabitant without resident children, 3) Single with resident child/children, and 4) Single without resident children. As marital status might change over time, we extracted the most frequent status for each participant for the follow-up period. The Danish Civil Registration System contains complete information on sex, age and marital status.46
Highest achieved level of education was obtained from the Danish Education Register, and the validity and coverage of the Danish education registers have shown to be very high.47 Classification was based on “The International Standard Classification of Education”48 and categorized into three ordinal groups: 1) primary and lower secondary education or equivalent, 2) upper secondary education or skilled worker/short cycle tertiary education or equivalent, and 3) bachelor/master/doctoral or equivalent. We extracted the highest level of education for each participant for the entire follow-up period for the analysis.
The Big 5 Personality traits (extraversion, agreeableness, conscientiousness, neuroticism and openness) were derived from the 20-item Mini International Personality Item Pool.49,50 The Mini International Personality Item Pool is a psychometrically acceptable and practically measure of the Big Five personality traits.49 Each of these personality traits was measured by four items, with answers for each personality trait being summed to a 0–16 score and analysed as a continuous variable.
Health, Belief and Work-Related Factors
Body Mass Index (BMI) at baseline was calculated based on self-reported height and weight. Participants were categorized into four groups based on standard BMI categories for adults used by the World Health Organization (under/normal weight (<25), pre-obesity (25-<30), obesity class I (30-<35), obesity class II & III (≥35)).
The number of body regions with pain and pain intensity at baseline was measured within the pain module of the Standard Evaluation Questionnaire (SEQ).31 For these variables, participants were asked to state the intensity of pain on a 1–7 numeric ranking scale (1=no pain/7=worst imaginable pain) in seven different body regions (right/left upper and lower extremity, front and back of thorax and the head) within the last four weeks. For the analysis, we extracted highest reported pain intensity in any region and counted number of body regions with pain. Number of pain sites (range 1–7) and pain intensity (range 1–7) were analyzed as continuous variables.
Physical and mental health were measured by the physical (PCS) and mental (MCS) components of the Short Form 12 version 2 (SF12) questionnaire which is a validated measure of physical and mental health in the general population.51,52 The PCS and MCS were summed on a 0–100 scale according to the developed guideline algorithms53 and analysed separately as continuous variables.
Risk of depression, anxiety and health-related anxiety at baseline were measured with parts of the Common Mental Disorder Questionnaire.54 The Common Mental Disorder Questionnaire is a validated short case-finding questionnaire for mental disorders useable in primary healthcare setting and consists of subscales from the Symptom Checklist-90-R.54,55 For evaluation of risk of depression, the six-item depression sub-scale (SCL-DEP6) (range 0–24) from the Symptom Checklist-90-R was used and for risk of anxiety we used the four-item anxiety sub-scale (SCL-ANX4) (range 0–16) from the Symptom Checklist-90-R.54 For health anxiety, we used Whiteley-7 Index (range 0–28).56 Each of these variables was dichotomized based on clinical interpretation recommendations from the Danish College of General Practitioners (high risk of depression ≥5, high risk of anxiety ≥5, high risk of health anxiety ≥6).57
Participation restriction due to pain was measured with two novel questions. Participants were asked to rate how pain had influenced their 1) satisfaction and joy with participation in social and leisure-time activities and 2) their ability to participate in social and leisure-time activities on a 1–7 numeric ranking scale (1=No influence/7=Influenced a lot). The two items were summed (range 2–14), and the variable was dichotomized based on the median of score distribution (high participation restriction ≥4).
Fear avoidance beliefs were measured with four items on physical function from the Fear Avoidance Belief Questionnaire on a five-point Likert scale.58 In order to ensure that people with symptoms in any body site could answer, we made the following addition: “Physical activity might harm my back or other parts of my body”. This phrase has been validated in other studies.59 Furthermore, we added these questions: “How much do you agree with the following statement: It is important to seek medical care when you have pain” and “If you negate pain, you could be permanently damaged”. These six items were summed (range 0–24) and analysed as a continuous variable.
Comorbidity was obtained by applying an updated version of Charlson comorbidity index to ICD-10 diagnostic codes in the National Patient Register.60 The Charlson comorbidity index has been widely used as an indicator for comorbidity in research of various disease groups, including research on pain and pain-related outcomes.60 Using ICD-10 diagnostic codes with National Patient Register data for the Charlson comorbidity index has shown high accuracy.61 In this study, the comorbidity index was categorized into three groups (0 – no comorbidity, 1 – low level of comorbidity and ≥2 – high level of comorbidity). This categorization was based on the distribution of data. We calculated the Charlson comorbidity index for each participant at baseline and also at end-of-follow up.
Information on labor market status was obtained from “The Danish Register-based Evaluation of Marginalized Individuals” (DREAM).62 DREAM contains information on all Danish citizens who have received social benefits or any other public transfer income. This information is recorded on a weekly basis and provides valid data regarding labor-market status.62 Based on DREAM-data, we generated the following four groups: 1) working or student, 2) unemployed, 3) permanent or temporary health-related benefit, 4) retirement. For the analysis, participants were assigned to the group representing their status for the majority of the follow-up period.
Use of musculoskeletal healthcare services two years before baseline was derived by applying the algorithm for the dependent variable (Table A) on 2006 and 2007 data from the National Patient Register, the National Health Insurance Service Register, the Register of Medicinal Product Statistics and the Rehab-register. Musculoskeletal related healthcare services use for these years categorized based on quartile of score distribution.
Types of Musculoskeletal Healthcare
Primary healthcare contacts were summarized overall, and for the following disciplines: Physiotherapy, Chiropractors, Medical specialists and GP. Secondary healthcare contacts were summarized overall and for surgery contacts. The number of redeemed medications for pain relief were summarized overall, and for the following types: non-steroidal anti-inflammatory drugs (NSAID) and analgesics; opioids; and antidepressives, antiepileptics, anxiolytic and hypnotics. Municipality musculoskeletal rehabilitation contacts were summarized overall.
Statistics
Firstly, we used Latent Class Growth Analysis (LCGA)63 with a zero-inflated Poisson distribution model based on annual number of musculoskeletal contacts to explore trajectories of musculoskeletal healthcare utilization for people with chronic musculoskeletal pain. LCGA was chosen as it is a longitudinal technique that identify subgroups following similar progression according to the parameters of the individual growth curves.63 We tested models with one to ten groups to assess the optimal number of trajectory groups to describe long-term musculoskeletal healthcare utilization. Choice of the optimal number of groups was guided by 1) goodness-of-fit criteria Akaike Information Criterion (AIC) and Bayesian Information Criterion (BIC), 2) evaluation of distribution of participants with no less than 5% of the sample in one trajectory group, 3) average predicted posterior probability of group membership above 70%64 and 4) the clinical plausibility of trajectory groups and trajectories. To achieve convergence of LCGA models, high values of maximum number of annual musculoskeletal contacts were truncated to 30 visits per year (in the data of 3% of participants). Participants were assigned to the trajectory group for which their posterior probability of membership was highest. Selection of the order of parameters to describe each trajectory (intercept, slope, quadratic term) within each model was guided by the estimated coefficients and associated p-value, and goodness-of-fit criteria. As a sensitivity analysis, we also analysed data with repeated measured Latent Class Analysis (LCA) with a negative binomial distribution model which estimates classes based solely on the repeated measure over time instead of using time as a continuous measure and clustering on the growth (time) parameters.63,65
Secondly, we calculated the annual number and types of musculoskeletal primary healthcare contacts, musculoskeletal secondary healthcare contacts, redeemed medication for pain relief and musculoskeletal municipality rehabilitation contacts per year within identified trajectory groups and presented them using boxplots. Additionally, we also described differences in proportions of types of musculoskeletal healthcare contacts (primary healthcare, secondary healthcare, redeemed medication for pain relief and rehabilitation) within trajectory groups. This was done to explore the composites of the variables used to generate trajectories of musculoskeletal healthcare utilization.
Lastly, we profiled descriptive variables according to trajectory group membership. For optimal data management, we initially tabulated or visually inspected the distribution of descriptive profiling variables. Heavily skewed variables (eg, with zero-inflated distribution) were categorized or dichotomized as described in the ‘Descriptive profiling variables’ section. Overall differences between descriptive profiling variables and trajectory groups were tested by comparing means, medians, or percentages using analysis of variance (ANOVA), Kruskal–Wallis test or Pearson’s chi-squared test, respectively. If the overall test showed statistically significant differences between descriptive profiling variables and trajectory groups, we explored this in more detail by performing pairwise tests between the lowest/highest trajectory group and each other trajectory group using the Kruskal–Wallis test with Bonferroni correction to adjust for multiple testing, resulting in seven contrasts and p-value threshold at 0.007 (0.05/7). To meet the policy of Statistics Denmark and avoid potentially identifying individuals, minor adjustments of the categorization were made so that no descriptive profiling variable for any trajectory group contained less than 3 participants. For all analyses, we used STATA version 16 (StataCorp LLC).
Results
Register-based variables did not have missing data, but 16% of the sample had some missingness on one or more baseline questionnaire variables. Most missingness was in physical and mental health variables (SF12) and four percent had missingness on one of the twelve items from these two scales. The pattern of missingness on other baseline variables was diverse and random (missing completely at random test: p=0.09).66 Analysis was performed on full case, and missingness is reported when relevant. Number of missings per baseline variable is shown in Table 4 and
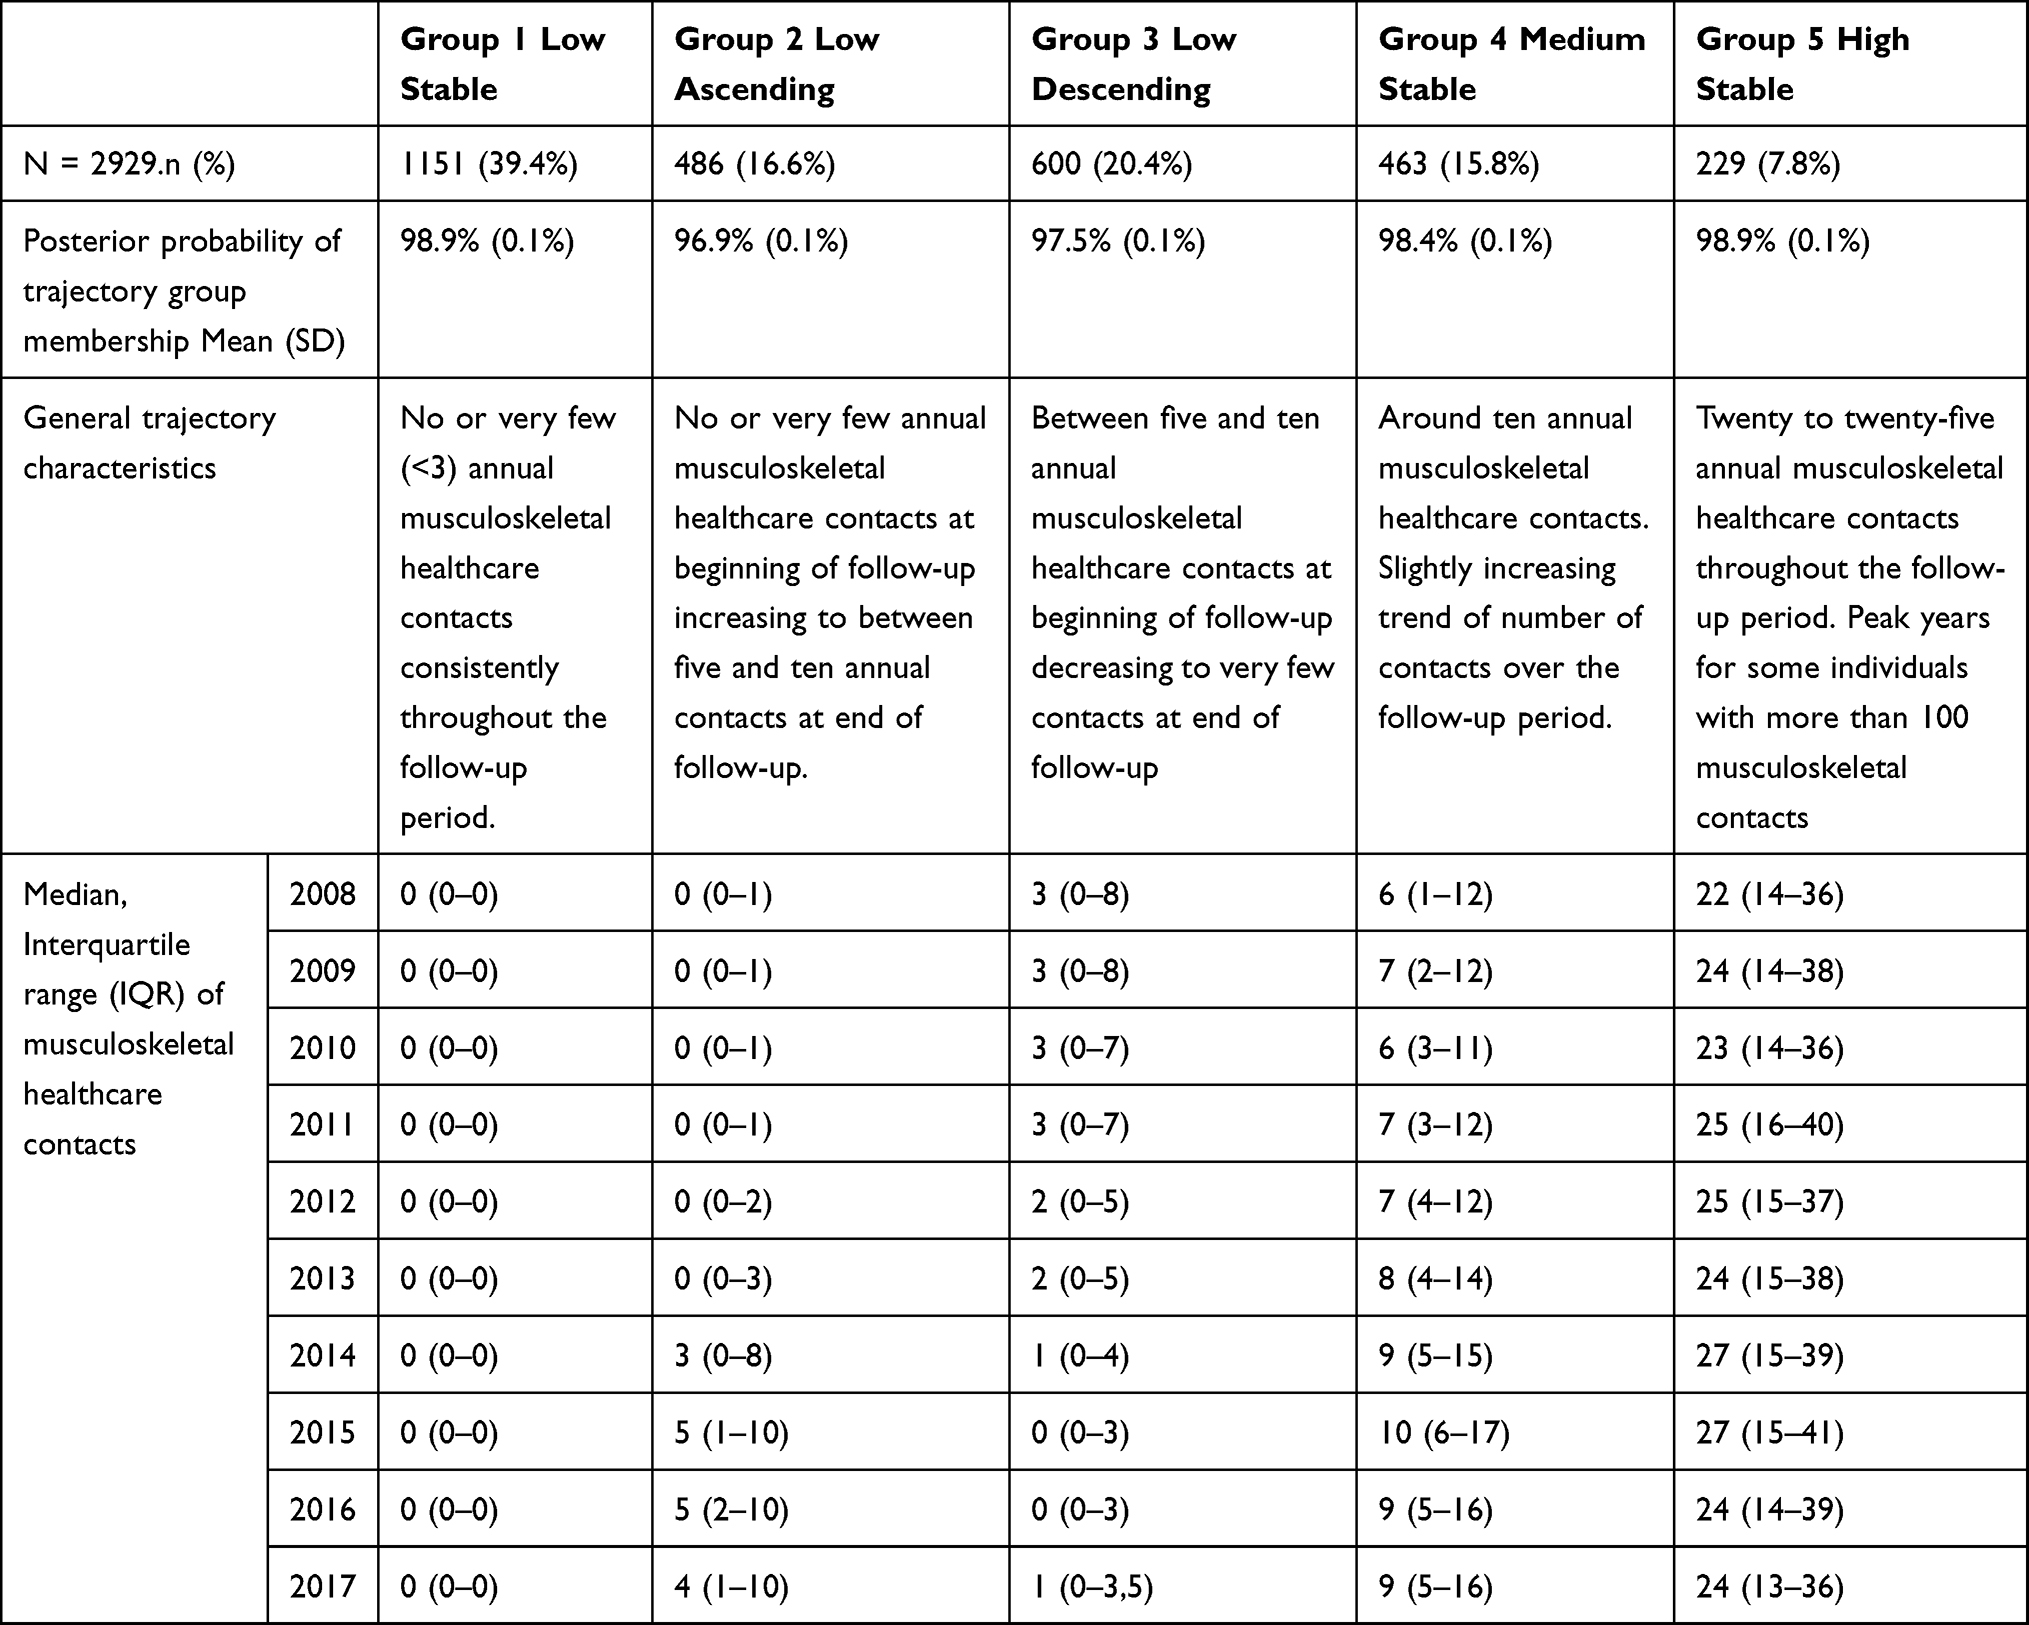 |
Table 2 Distribution of Participants and the Characteristics of Musculoskeletal Healthcare Utilization Trajectories for People Reporting Chronic Musculoskeletal Pain |
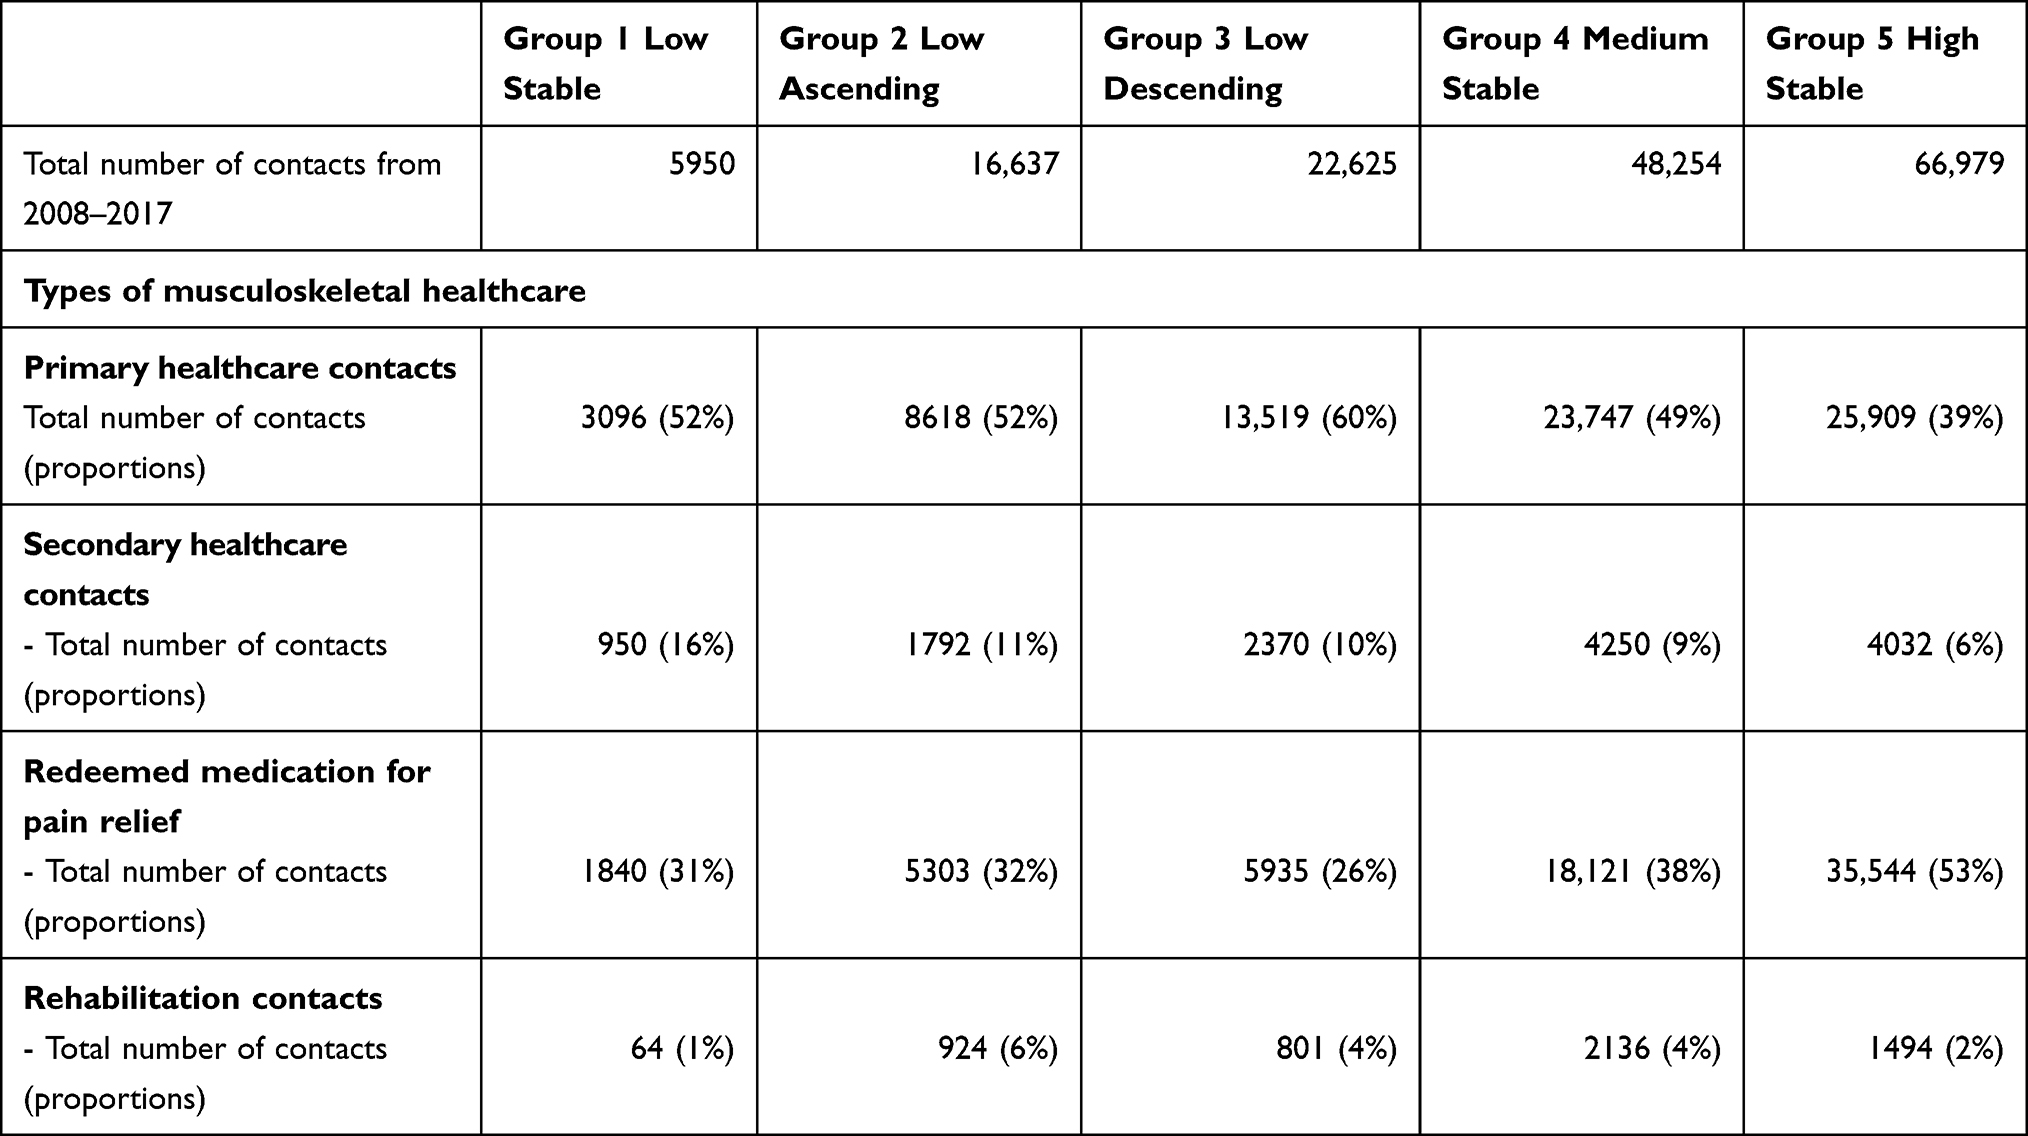 |
Table 3 Total Number of Contacts and Proportions of Number of Contacts in Primary and Secondary Healthcare, Redeemed Medication for Pain Relief and Rehabilitation Within Trajectory Groups |
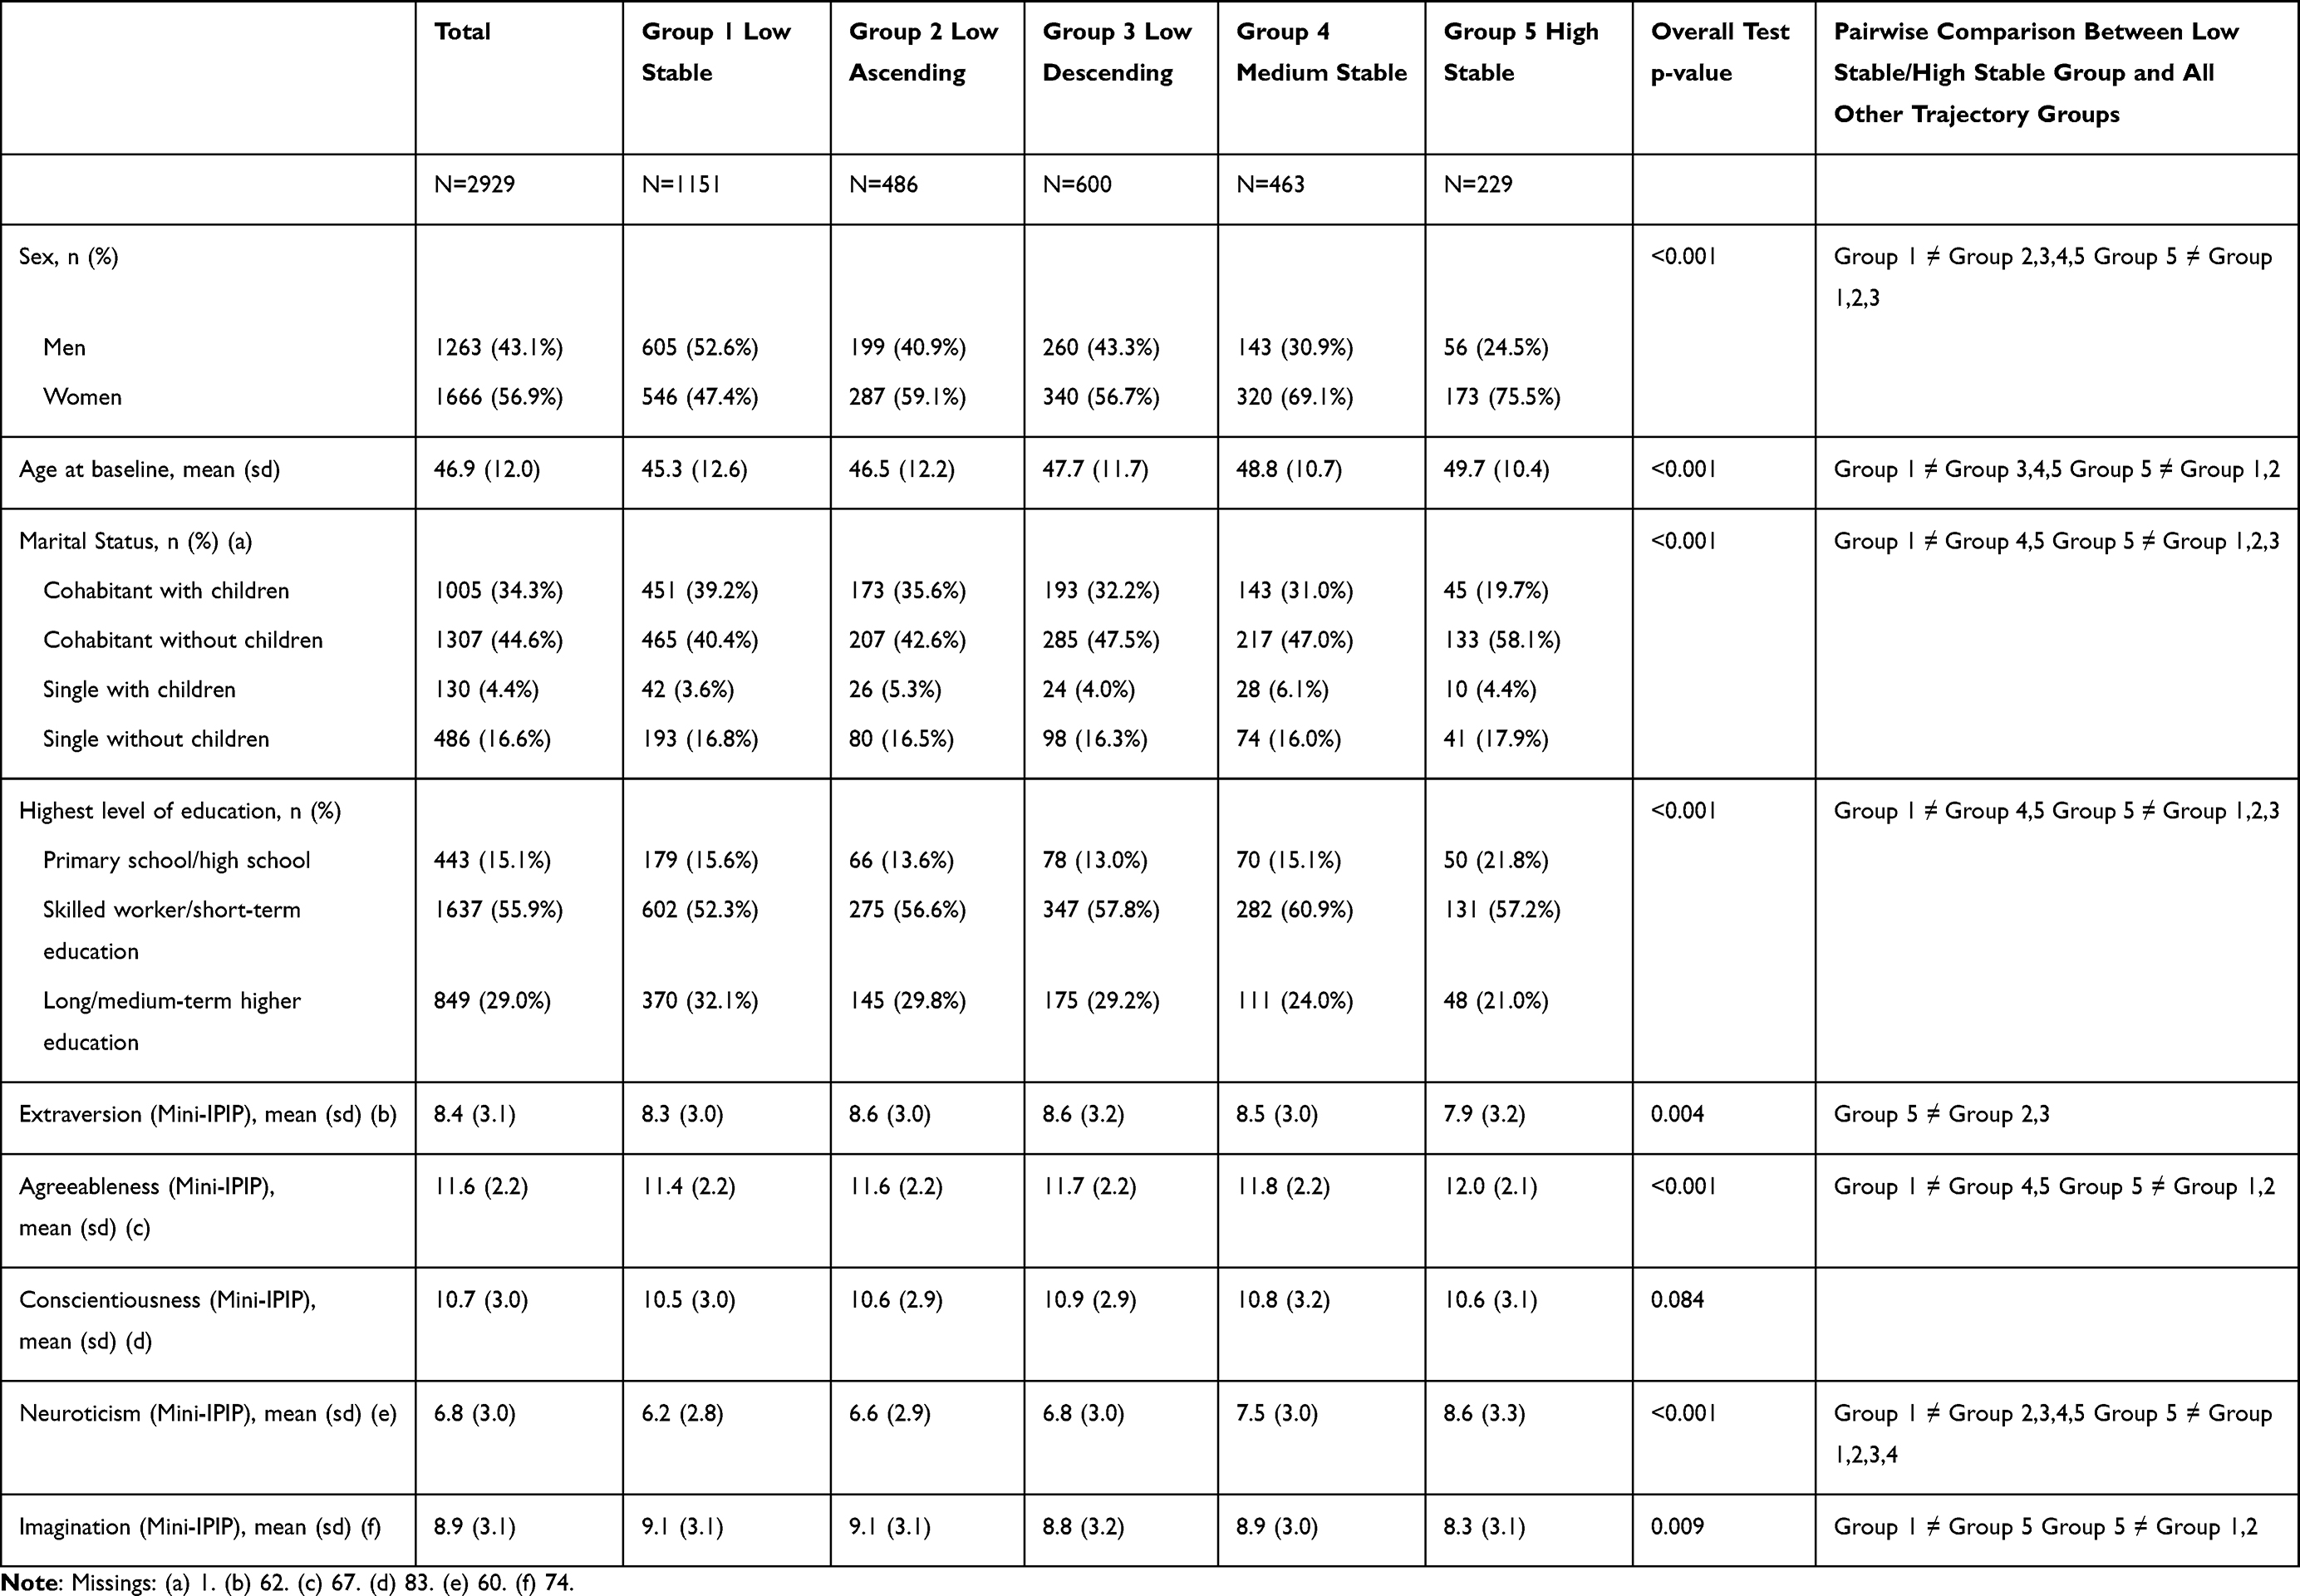 |
Table 4 Distribution of Individual and Sociodemographic Factors Across the Five Trajectory Groups |
Trajectories of Musculoskeletal Healthcare Use
Based on evaluation of the AIC and BIC performance statistics, distribution of participants and probability of group membership, the authorship team agreed that a five-group model was optimal to describe distinguishable trajectories of musculoskeletal healthcare utilization for this sample. Comparison of fit statistics from LCGA of models with one to ten classes is provided in supplementary material (Appendix C). The posterior probability of trajectory group membership in the five-group model was very high (mean posterior probability between 96.9% and 98.9% (Table 1)). The relative decrease in AIC and BIC between LCGA group models with more than five groups was small (<3%) and did not identify new distinguishable trajectories or facilitate the clinical interpretation of trajectory profiles. Models with seven or more groups resulted in strata with less than 5% of the sample (supplementary material – Appendix C). Long-term trajectories of musculoskeletal healthcare utilization for the five-group model are shown in Figure 2. Trajectories and number of groups were confirmed by the sensitivity analysis using LCA (supplementary material – Appendix D).
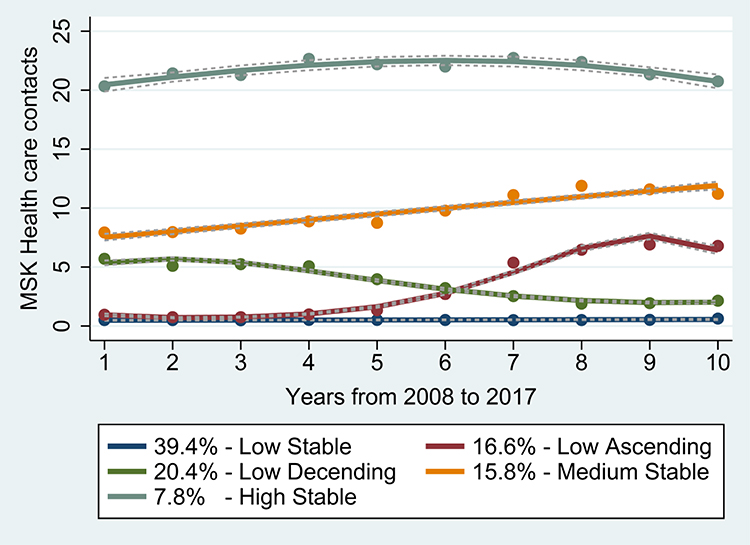 |
Figure 2 Trajectories of musculoskeletal (MSK) healthcare utilization for people reporting chronic musculoskeletal pain. |
The five-trajectory group model represents different and distinct trajectories of musculoskeletal healthcare utilization, as detailed in Table 4.
The high stable trajectory group (group 5) was estimated to include 7.8% of the sample and is clearly different compared to the other groups due to consistent high number of annual musculoskeletal healthcare contacts throughout the follow-up period. In contrast, the low trajectory group (group 1) was estimated to contain 39.4% of the sample had no or very few musculoskeletal healthcare contacts. In between, three trajectory groups were identified constituting the remaining 52.8% of the sample with different intermediate uses of musculoskeletal healthcare services (Figure 2). The low ascending group (group 2, 16.6%) demonstrated no or few annual musculoskeletal healthcare contacts in the first five years which initially increased and then plateaued to a low-moderate level in the subsequent five years. The low descending group (group 3, 20.4%) demonstrated a low-moderate level of annual musculoskeletal healthcare contacts in the first six years which later decreased to a very low level in the last four years. The medium stable group (group 4, 15.8%) demonstrated a stable moderate level of annual healthcare contacts throughout the entire follow-up period. The low stable and medium stable group were best described by linear terms, whereas the low ascending and low descending group fitted a cubic term and the high stable group a quadratic term.
Types of Musculoskeletal Healthcare Use Across Trajectories
Figure 3A displays the distribution of annual number of musculoskeletal primary healthcare contacts in total and by disciplines, stratified by trajectory groups. For primary healthcare contacts, we found significant overall differences across trajectory strata, with a pattern of increasing contacts from the low to the high stable group. This increasing pattern was observed for GP, physiotherapy and chiropractor contacts, whereas musculoskeletal medical specialist contacts were rare for all trajectory groups.
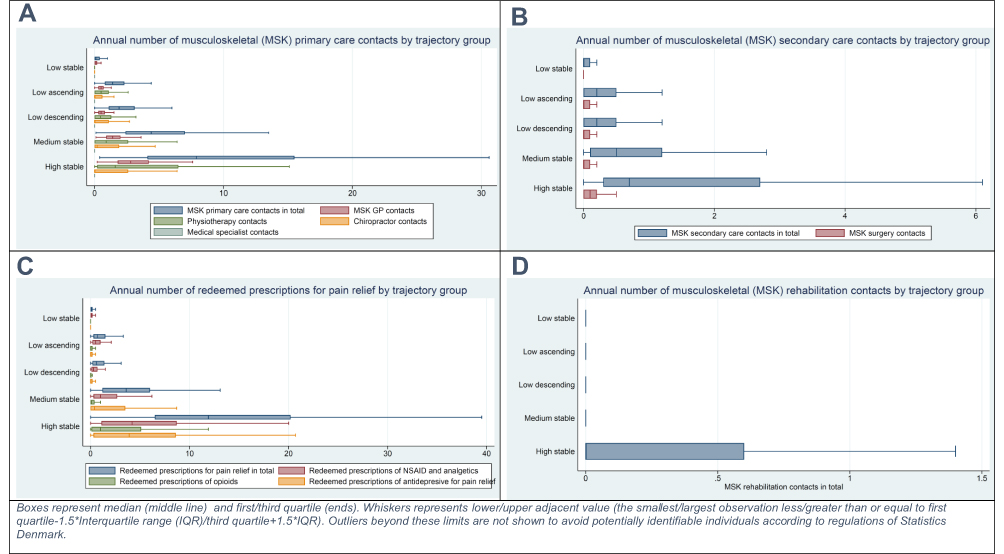 |
Figure 3 Annual number of musculoskeletal primary, secondary and rehabilitation healthcare contacts and annual number of redeemed medication prescriptions for pain relief stratified by trajectory groups. |
Figure 3B displays the distribution of annual number of musculoskeletal secondary healthcare contacts in total and musculoskeletal surgery contacts across trajectory groups. For secondary healthcare contacts, we found overall differences across trajectory strata in total secondary healthcare and surgery contacts, with a pattern of increasing contacts from the low to the high stable group even though musculoskeletal surgery contacts were rare for all trajectory groups.
Figure 3C presents the distribution of annual number of redeemed medications for pain relief, in total and by type stratified by trajectory groups. For redeemed medications for pain relief, we found overall differences across trajectory strata, with a pattern of increasing use of pain medication from the low to the high stable group. Opioids were almost exclusively prescribed for people in the high stable group (median (IQR) 1 (0.1–5.1)), whereas NSAID/analgesics and anti-depressive medication use were also found in the medium stable group (median (IQR) 0.4 (0–3.5)).
Figure 3D presents the distribution of the annual number of musculoskeletal municipality rehabilitation contacts. Again, we found overall differences across trajectory strata, with a pattern of increasing number of contacts from the low to the high stable group even though such contacts were rare and only visually observed in the high stable trajectory group.
Furthermore, we observed that Figure 3A–D show only slight differences in annual number of musculoskeletal healthcare contacts (all types) between the low ascending and low descending group.
Table 2 shows the total number of contacts and proportions of the different types of musculoskeletal healthcare service (primary and secondary healthcare, redeemed medication for pain relief and rehabilitation) within the five trajectory groups. Primary healthcare contacts account for the majority of services for groups 1–3 (52–60%) and about half of services in group 4 (49%) but only 39% in group 5. In contrast, redeemed medication for pain relief accounts for a much higher proportion in group 5 (53%) than in group 1–4 (ranging from 26% to 38%).
Multidimensional Profiling of Trajectories
Distribution for each descriptive profiling variable across the five trajectory groups data are detailed in Tables 3 and 5. Candidate prognostic factors measured at baseline are highlighted using asterisk.
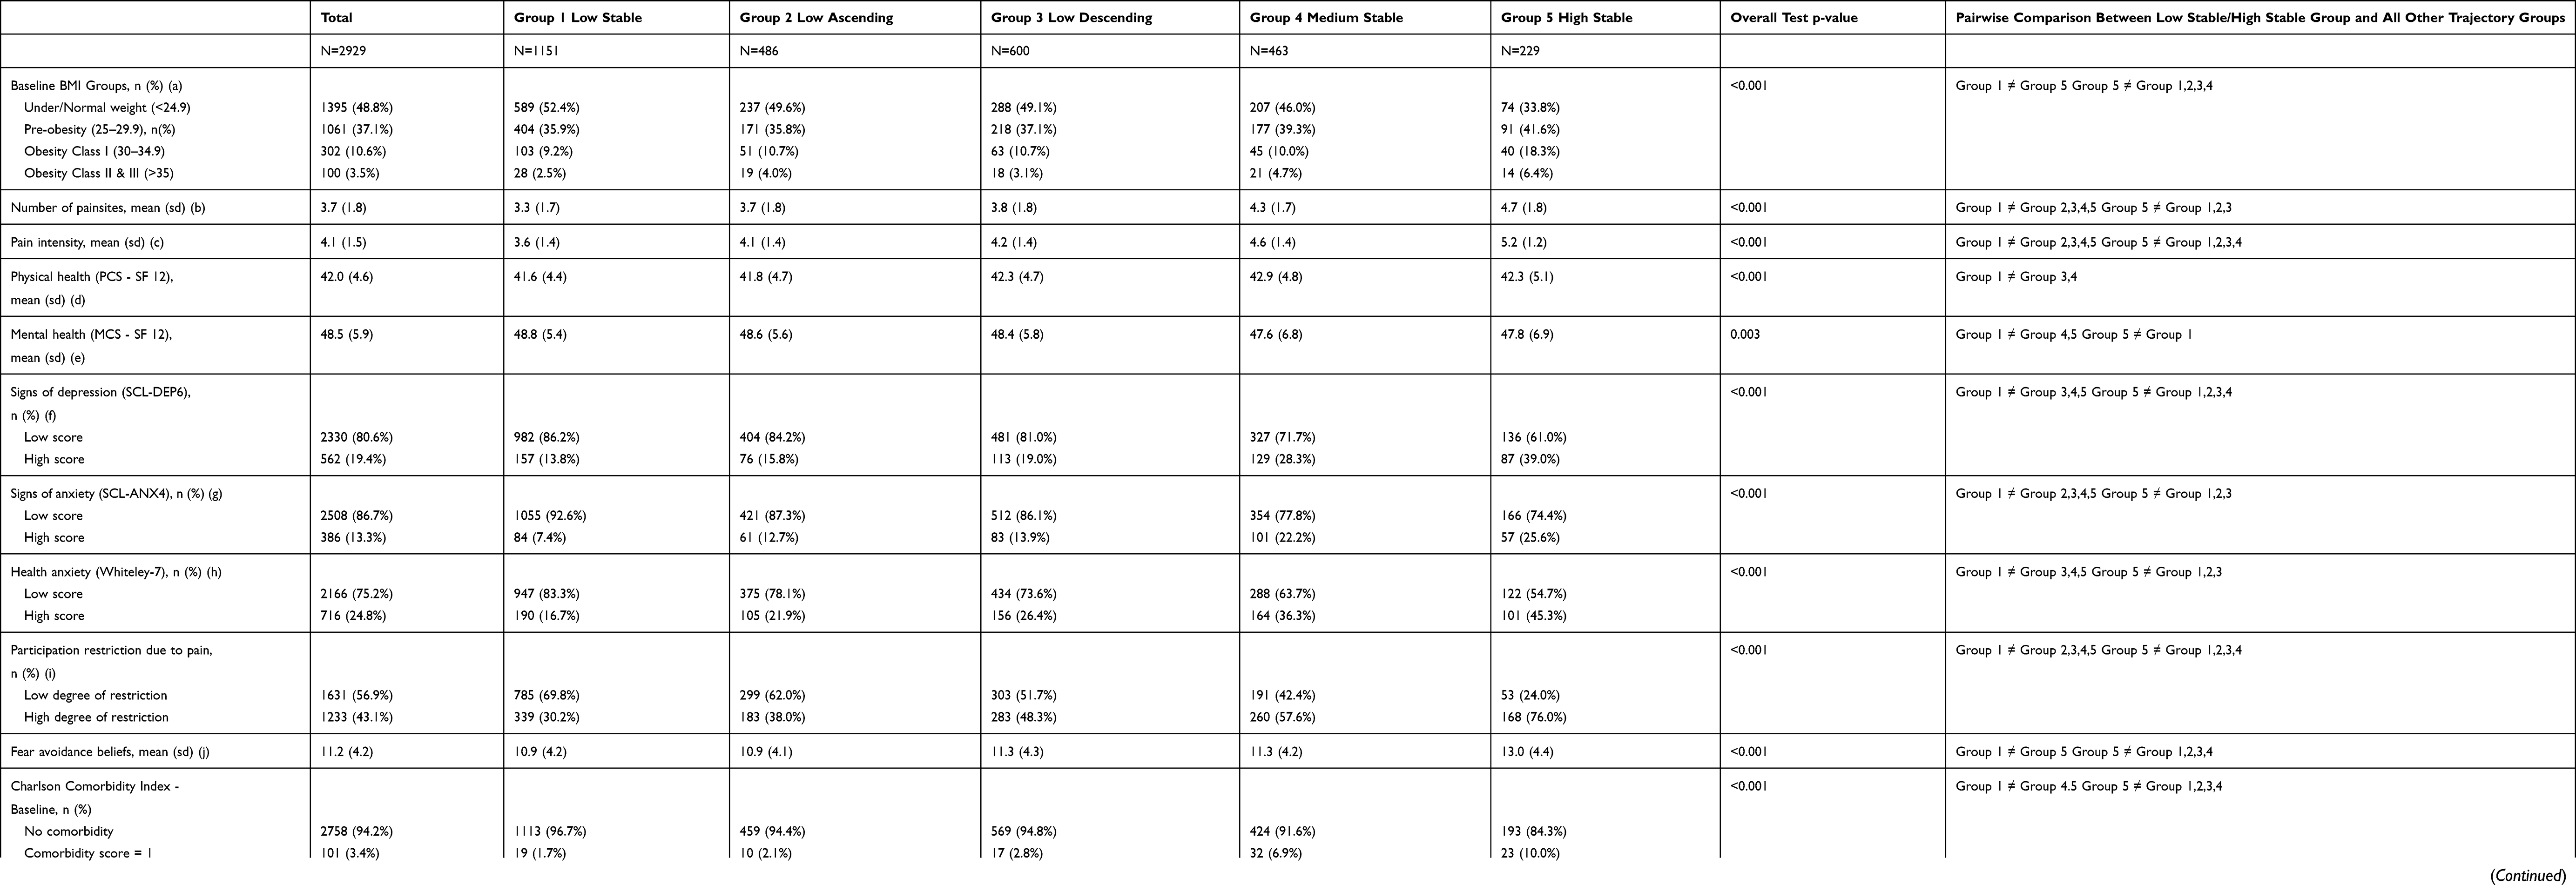 |
Table 5 Distribution of Health, Belief and Work-Related Factors Across the Five Trajectory Groups |
Individual and Sociodemographic Factors
Distribution of sociodemographic factors and personality measures is presented in Table 3. The majority of the sample were women (56.7%), and the mean age at baseline was 46.9 years (SD 12.0). The proportion of women ranged from 47.4% in the low stable group to 75.5% in the high stable group. Overall test showed significant differences across trajectory groups for all individual and sociodemographic descriptive profiling variables (p = <0.009) except for conscientiousness (p=0.084). Pairwise comparison showed that participants in the low stable group were significantly more often male and reported lower neuroticism scores compared to participants in group 2–5 (p < 0.006), whereas participants in the high stable trajectory group reported significantly higher neuroticism score compared to participants in group 1–4 (p < 0.006).
Health, Belief and Work-Related Factors
Distribution of health, belief and work-related factors is presented in Table 5. Except for physical and mental health, the level of exposure to health, pain and belief-related factors increased from the low stable group to the high stable group. Overall test showed significant differences across trajectory groups for all health, belief and work-related factors (p = <0.003). Pairwise comparison showed that participants in the low stable group reported significantly lower number of pain sites, lower pain intensity score, lower anxiety scores, a lower degree of participation restriction due to pain, had less comorbidity, used less musculoskeletal healthcare services two years before baseline and were more often working or student and less often retired compared to participants in group 2–5 (p < 0.006). Whereas participants in the high stable group reported significantly higher pain intensity score, higher BMI, higher depression score, higher degree of participation restriction due to pain, had more comorbidity, more musculoskeletal healthcare contacts before baseline and were less often working or student and did more often receive social health-related benefit compared to participants in group 1–4 (p < 0.006).
Discussion
Main Results
In this sample of people reporting chronic musculoskeletal pain, we identified and profiled five distinct trajectories of long-term musculoskeletal healthcare utilization (low stable, low ascending, low descending, medium stable and high stable). A low stable trajectory (39% of the sample) had no or almost no annual musculoskeletal contacts, and a high stable trajectory group (8%) had a consistent high number of annual musculoskeletal contacts. Between those groups were three groups with ascending (17%), descending (20%) and medium stable (16%) musculoskeletal contacts.
Overall, the annual number of contacts in subtypes of musculoskeletal healthcare (primary and secondary healthcare, redeemed medication for pain relief, and rehabilitation) increased across the five trajectory groups, but proportional use within trajectory groups appeared to differ. Redeemed prescriptions for pain medication (NSAID/analgesics, opioids and anti-depressives for pain relief) were primarily found in the medium stable and high stable trajectory groups and were the most common type of musculoskeletal healthcare in the high stable trajectory group. Redeemed medication for opioids was almost exclusively found in the high stable trajectory group. Primary and secondary healthcare contacts were the most common type of musculoskeletal healthcare in the trajectory groups with low use of healthcare. Surgery and musculoskeletal municipality rehabilitation contacts were rare and almost exclusively found in the high stable group.
Profiling the identified trajectories on individual, sociodemographic, health, belief and work-related factors showed differences across trajectory groups. Further studying differences between the low stable group and high stable group in particular could provide insights into drivers of healthcare-seeking behavior.
Musculoskeletal Healthcare Utilization Trajectories
In general, people reporting chronic pain have higher use of healthcare services than people without pain.6–8,10 Our results about the low stable (39%) and high stable (8%) trajectories suggest that the increased use of musculoskeletal healthcare resources due to chronic musculoskeletal pain is mainly driven by a relatively small group of ongoing high healthcare users and that the largest group of people reporting chronic musculoskeletal pain cope with no/few musculoskeletal healthcare consultations and no/very low use of pain medication.10,15,16 Also, noteworthy is that a descending trajectory of musculoskeletal healthcare utilization was only found for 21% of the participants and only for participants with relatively few annual musculoskeletal healthcare contacts (low descending), whereas a decreasing trajectory for participants with high/medium use of healthcare was not identified. Subsequent studies could explore what case management characteristics are associated with these downstream healthcare-seeking differences (eg, the timing of interventions; patient/healthcare professional characteristics; the receiving of a “sense-making” diagnosis and “thrive despite pain” messages; a loss of confidence that healthcare can help; or guideline adherent versus non-adherent healthcare).
One of the challenges of using methods such as LCGA is to balance model parsimony and interpretability versus identifying smaller groups, the existence of which may have important clinical implications. However, while for some research questions the addition of more trajectory groups to the five we identified might have been of interest, we found that adding more groups separated the low musculoskeletal healthcare users in more detail but did not generate distinct groups in terms of new trajectory shapes involving higher use nor change the high stable trajectory group.
Musculoskeletal Healthcare
Reassuringly, our findings about the use of different types of musculoskeletal healthcare align quite well with most musculoskeletal clinical guidelines, which recommend that the majority of non-specific musculoskeletal disorders should be managed in primary healthcare, pain medication prescribed for chronic pain patients should be restricted to NSAIDs and antidepressants, and discourage referral for secondary healthcare specialists or surgical interventions unless specific or serious pathology is suspected.13,67,68 Hence, our results do not support that healthcare-seeking pathways for people with chronic musculoskeletal pain often lead to consultations with surgeons as musculoskeletal surgery contacts were rare for all trajectory groups. Maybe also surprisingly, redeemed prescriptions for opioids were relatively rare and almost only found in the high stable trajectory group, which suggests that GPs generally follow recommendations of limited use of opioids for musculoskeletal pain. In pain populations around the world, high use of opioids been reported, and use of opioids in Denmark in generally is high compared to other Nordic countries.69
Most musculoskeletal clinical guidelines also encourage short-term use of healthcare,67 but in this study, we found a continuing use of healthcare services for 24% of the sample (medium stable and high stable trajectory group). We do not know if this long-term use is due to one condition or several musculoskeletal conditions, but higher numbers of pain sites and higher comorbidity index in the medium and high stable trajectory group compared to group 1–3 (Table 3) could suggest that more pain conditions could influence.
Multidimensional Profiling
Different trajectories of musculoskeletal healthcare utilization had different individual, sociodemographic, health, belief and work-related profiles. These findings align with previous prognostic studies analysing factors associated with general healthcare utilization.7,15,16,18,21–24 Notably, while the mean scores for neuroticism (and all other personality trait scores) for all trajectory groups were low compared to population norms,49 they were significantly higher in the high stable trajectory group than the other trajectory groups. Higher neuroticism reflects a tendency to experience negative emotions,70,71 and other studies have shown that neuroticism correlates with lower quality of life and reported severity of physical symptoms,72 both of which are independently associated with high healthcare utilization.7,15 Sixty-four percent of this sample were working for most of the follow-up period, but this was 29% in the high stable trajectory group and 46% in this trajectory group received health-related income benefits (Table 5). These findings could indicate that this trajectory of people finds it difficult to gain employment that accommodates their capacity and that facilitation of continuation or resumption of work requires continued social and therapeutic focus.
A subset of the profiling variables was measured at baseline and hence could be candidate prognostic factors (see Tables 3 and 5). The aim of this study was not to create a prediction model for musculoskeletal healthcare utilization or explore causal pathways, but future studies that aim to do so may consider including one or more of these candidate prognostic factors.
Strengths and Limitations
This study has several strengths, including the use of register-based information with ten-year complete person-level follow-up, high validity38,39,73 and no risk of lag time/recall bias. We also used a population-based cohort of people reporting chronic musculoskeletal pain, rather than a clinical cohort, as it includes people not seeking healthcare. This study used LCGA allowing assignment of individuals to trajectory groups with statistical evaluation of the model performance. LCGA has better accuracy at identifying latent classes63 compared to previously used methods.
However, some limitations should also be noted. This cohort derived from the 60% of eligible participants who responded to the baseline questionnaire in 2008, so we cannot exclude the potential for some unquantified selection bias. Ideally, prognostic studies occur in inception cohorts where participants are included at a uniform time, like the onset of a condition.27 We do not know the course or trajectory of pain symptoms in this sample, but it is likely to have included people with varying pain duration. Furthermore, chronic musculoskeletal pain ceases in some people,74 however studies exploring trajectories of pain symptoms indicate that people reporting chronic pain often continue to do so.74–76
The National Health Insurance Service Register does not contain information on diagnostic coding. This means that musculoskeletal contacts in primary healthcare were based on information about professional groups (eg, physiotherapists, chiropractors), where scope of practice indicates that most consultations relate to musculoskeletal complaints. For GP contacts, we developed an algorithm to identify musculoskeletal specific contacts (supplementary material – Appendix B). This approach may have led to some misclassification, although similar approaches have been applied and validated using National Health Insurance Service Register data for linking patients and general practices with promising results.77 Another limitation with the National Health Insurance Service Register database is that approximately 15% of chiropractors and physiotherapist consultations in primary healthcare are paid either fully out-of-pocket by patients or by insurance without any public reimbursement and hence not reported to the National Health Insurance Service Register.41 These consultations could therefore not be accounted for in our investigation and may have led to some underestimation of musculoskeletal healthcare use.
Conclusions
We found that people reporting chronic musculoskeletal pain have different trajectories of long-term musculoskeletal healthcare utilization. About 39% have no or almost no few annual musculoskeletal contacts, whereas almost 8% have a consistent high number of contacts. In between these trajectories, we found three groups with ascending (17%), descending (20%) and medium stable (16%) number of annual musculoskeletal contacts. Primary healthcare contacts were the most common type of musculoskeletal healthcare in the trajectory groups with low use of musculoskeletal healthcare and pain medication were primarily found in the medium stable and high stable trajectory groups, but opioids were almost exclusively found in the high healthcare trajectory group. Surgery was rare and almost exclusively found in the high healthcare trajectory group. Participants in the identified trajectories had different individual, sociodemographic, health, belief and work-related profiles.
Abbreviations
GP, General Practitioners; BMI, Body Mass Index; SEQ, Standard Evaluation Questionnaire; IASP, The International Association for the Study of Pain; ICD, The International Statistical Classification of Diseases and Related Health Problems; SF12, Short Form 12 questionnaire; PCS, Physical components score; MCS, Mental components score; SCL, The Symptom Checklist; DREAM, The Danish Register-based Evaluation of Marginalized Individuals; NSAID, Non-steroidal anti-inflammatory drugs; LCGA, Latent Class Growth Analysis; LCA, Latent Class Analysis; AIC, Akaike Information Criterion; BIC, Bayesian Information Criterion; ANOVA, Analysis of variance; MSK, Musculoskeletal.
Data Sharing Statement
Data from the Danish National Registers are available from the Danish National Health and Medicines Authority for researchers who meet the criteria for getting access to micro data. According to Danish regulations, researchers who are interested can only apply for access through an affiliation to a Danish authorized research environment and apply for data access directly at Statistics Denmark (https://www.dst.dk/en/TilSalg/Forskningsservice) and the Danish Data Protection Agency (https://www.datatilsynet.dk/english). Interested researchers may contact the corresponding author of this article for further guidance on this procedure.
Ethics Approval and Consent to Participate
All participants signed written informed consent forms at baseline. This study was approved by the Danish Data Protection Agency (project number 1-16-02-141-18). All data are collected, stored and handled according to Danish law. Under Danish law, non-intervention studies do not require approval by biomedical research ethics committees.78
Consent for Publication
All authors have approved submission of this article for publication in Clinical Epidemiology.
Acknowledgments
We would like to thank Jesper Medom Vestergaard for his assistance with the collection of register data and data management and Jens Christian Jensen for his contribution to baseline data collection.
Author Contributions
All authors contributed to data analysis, drafting or revising the article, gave final approval of the version to be published, agreed to the submitted journal, and agreed to be accountable for all aspects of the work.
Funding
This study is a part of a PhD project financially supported by VIA University College, Health Research Foundation of Central Denmark Region, the Danish Rheumatism Association, NIDO |Denmark and the Health Foundation. None of the authors received any specific grants for this publication.
Disclosure
Mr Søren Mose report grants from VIA University College, grants from Health Research Foundation of Central Denmark Region, grants from The Danish Rheumatism Association, grants from NIDO | Denmark, grants from the Danish Health Foundation, during the conduct of the study; the authors report no other conflicts of interest in this work.
References
1. Fayaz A, Ayis S, Panesar SS, Langford RM, Donaldson LJ. Assessing the relationship between chronic pain and cardiovascular disease: a systematic review and meta-analysis. Scand J Pain. 2016;13:76–90. doi:10.1016/j.sjpain.2016.06.005
2. Breivik H, Collett B, Ventafridda V, Cohen R, Gallacher D. Survey of chronic pain in Europe: prevalence, impact on daily life, and treatment. Eur J Pain. 2006;10(4):287–333. doi:10.1016/j.ejpain.2005.06.009
3. Tschudi-Madsen H, Kjeldsberg M, Natvig B, et al. A strong association between non-musculoskeletal symptoms and musculoskeletal pain symptoms: results from a population study. BMC Musculoskelet Disord. 2011;12. doi:10.1186/1471-2474-12-285
4. Blyth FM, Van Der Windt DA, Croft PR. Chronic disabling pain: a significant public health problem. Am J Prev Med. 2015;49(1):98–101. doi:10.1016/j.amepre.2015.01.008
5. Perrot S, Cohen M, Barke A, et al. The IASP classification of chronic pain for ICD-11: chronic secondary musculoskeletal pain. PAIN. 2019;160(1):77–82. doi:10.1097/j.pain.0000000000001389
6. Hartvigsen J, Davidsen M, Sogaard K, Roos EM, Hestbaek L. Self-reported musculoskeletal pain predicts long-term increase in general health care use: a population-based cohort study with 20-year follow-up. Scand J Public Health. 2014;42(7):698–704. doi:10.1177/1403494814542263
7. Beyera GK, O’Brien J, Campbell S. Health-care utilisation for low back pain: a systematic review and meta-analysis of population-based observational studies. Rheumatol Int. 2019;39(10):1663–1679. doi:10.1007/s00296-019-04430-5
8. Waxman R, Tennant A, Helliwell P. Community survey of factors associated with consultation for low back pain. BMJ. 1998;317(7172):1564–1567. doi:10.1136/bmj.317.7172.1564
9. Alexopoulos EC, Tanagra D, Konstantinou E, Burdorf A. Musculoskeletal disorders in shipyard industry: prevalence, health care use, and absenteeism. BMC Musculoskelet Disord. 2006;7:88. doi:10.1186/1471-2474-7-88
10. Eriksen J, Sjogren P, Ekholm O, Rasmussen NK. Health care utilisation among individuals reporting long-term pain: an epidemiological study based on Danish National Health Surveys. Eur j Pain. 2004;8(6):517–523.
11. Paananen MV, Taimela SP, Tammelin TH, et al. Factors related to seeking health care among adolescents with musculoskeletal pain. Pain. 2011;152(4):896–903. doi:10.1016/j.pain.2011.01.002
12. Andersson HI, Ejlertsson G, Leden I, Schersten B. Impact of chronic pain on health care seeking, self care, and medication. Results from a population-based Swedish study. J Epidemiol Community Health. 1999;53(8):503–509. doi:10.1136/jech.53.8.503
13. Lin I, Wiles L, Waller R, et al. What does best practice care for musculoskeletal pain look like? Eleven consistent recommendations from high-quality clinical practice guidelines: systematic review. Br J Sports Med. 2020;54(2):79–86. doi:10.1136/bjsports-2018-099878
14. Linton SJ. Been there, done that–what now? New avenues for dealing with chronic pain. Scandinavian J Pain. 2020;1:425–428.
15. Emilson C, Åsenlöf P, Demmelmaier I, Bergman S. Association between health care utilization and musculoskeletal pain. A 21-year follow-up of a population cohort. J Pain. 2017;23:533–543.
16. Lentz TA, Harman JS, Marlow NM, Beneciuk JM, Fillingim RB, George SZ. Factors associated with persistently high-cost health care utilization for musculoskeletal pain. PLoS One. 2019;14(11):e0225125. doi:10.1371/journal.pone.0225125
17. Walker BF, Muller R, Grant WD. Low back pain in Australian adults. health provider utilization and care seeking. J Manipulative Physiol Ther. 2004;27(5):327–335. doi:10.1016/j.jmpt.2004.04.006
18. Ferreira ML, Machado G, Latimer J, Maher C, Ferreira PH, Smeets RJ. Factors defining care‐seeking in low back pain–A meta‐analysis of population based surveys. Eur J Pain. 2010;14(7):
19. Esteve R, López-Martínez AE, Ruíz-Párraga GT, Serrano-Ibáñez ER, Ramírez-Maestre C. Pain acceptance and pain-related disability predict healthcare utilization and medication intake in patients with non-specific chronic spinal pain. Int J Environ Res Public Health. 2020;17(15):1–12. doi:10.3390/ijerph17155556
20. Nalamachu S, Robinson RL, Viktrup L, et al. Pain severity and healthcare resource utilization in patients with osteoarthritis in the United States. Postgrad Med. 2020;133:1–10.
21. Jonsdottir T, Jonsdottir H, Lindal E, Oskarsson GK, Gunnarsdottir S. Predictors for chronic pain-related health care utilization: a cross-sectional nationwide study in Iceland. Health Expect. 2015;18(6):2704–2719. doi:10.1111/hex.12245
22. Cornally N, McCarthy G. Help-seeking behaviour for the treatment of chronic pain. Br J Community Nurs. 2011;16(2):90–98. doi:10.12968/bjcn.2011.16.2.90
23. Huysmans E, Leemans L, Beckwée D, et al. The Relationship between Cognitive and Emotional Factors and Healthcare and Medication Use in People Experiencing Pain: a Systematic Review. J Clin Med. 2020;9(8):2486. doi:10.3390/jcm9082486
24. Clewley D, Rhon D, Flynn T, Koppenhaver S, Cook C. Health seeking behavior as a predictor of healthcare utilization in a population of patients with spinal pain. PLoS One. 2018;13(8):e0201348. doi:10.1371/journal.pone.0201348
25. Naylor B, Boag S, Gustin SM. New evidence for a pain personality? A critical review of the last 120 years of pain and personality. Scand J Pain. 2017;17:58–67. doi:10.1016/j.sjpain.2017.07.011
26. Adamson J, Hunt K, Nazareth I. The influence of socio-demographic characteristics on consultation for back pain–a review of the literature. Fam Pract. 2011;28(2):163–171. doi:10.1093/fampra/cmq085
27. Kent P, Cancelliere C, Boyle E, Cassidy JD, Kongsted A. A conceptual framework for prognostic research. BMC Med Res Methodol. 2020;20(1):172. doi:10.1186/s12874-020-01050-7
28. Mose S, Christiansen DH, Jensen JC, Andersen JH. Widespread pain - do pain intensity and care-seeking influence sickness absence? - A population-based cohort study. BMC Musculoskelet Disord. 2016;17(1). doi:10.1186/s12891-016-1056-1
29. Jensen JC Predictors of care-seeking in general practice for back pain and upper extremity pain: a Danish population based study. PhD thesis. Faculty of Health Sciences, University of Aarhus; 2012:V, 105 sider, ill.
30. Jensen JC, Haahr JP, Frost P, Andersen JH. The significance of health anxiety and somatization in care-seeking for back and upper extremity pain. Fam Pract. 2012;29(1):86–95. doi:10.1093/fampra/cmr046
31. Muller U, Tanzler K, Burger A, et al. A pain assessment scale for population-based studies: development and validation of the pain module of the Standard Evaluation Questionnaire. Pain. 2008;136(1–2):62–74. doi:10.1016/j.pain.2007.06.014
32. De Vos Andersen N-B, Kent P, Hjort J, Christiansen DH. Clinical course and prognosis of musculoskeletal pain in patients referred for physiotherapy: does pain site matter? BMC Musculoskelet Disord. 2017;18(1):1–11. doi:10.1186/s12891-017-1487-3
33. Treede RD, Rief W, Barke A, et al. A classification of chronic pain for ICD-11. Pain. 2015;156(6):1003–1007. doi:10.1097/j.pain.0000000000000160
34. Steingrimsdottir OA, Landmark T, Macfarlane GJ, Nielsen CS. Defining chronic pain in epidemiological studies: a systematic review and meta-analysis. Pain. 2017;158(11):2092–2107. doi:10.1097/j.pain.0000000000001009
35. Schmidt M, Pedersen L, Sorensen HT. The Danish Civil Registration System as a tool in epidemiology. Eur J Epidemiol. 2014;29(8):541–549. doi:10.1007/s10654-014-9930-3
36. Thygesen LC, Daasnes C, Thaulow I, Bronnum-Hansen H. Introduction to Danish (nationwide) registers on health and social issues: structure, access, legislation, and archiving. Scand J Public Health. 2011;39(7Suppl):12–16. doi:10.1177/1403494811399956
37. The Danish Health Data A. SKS-Browser; 2017.
38. Schmidt M, Schmidt SA, Sandegaard JL, Ehrenstein V, Pedersen L, Sorensen HT. The Danish National Patient Registry: a review of content, data quality, and research potential. Clin Epidemiol. 2015;7:449–490. doi:10.2147/CLEP.S91125
39. Andersen JS, Olivarius Nde F, Krasnik A. The Danish National Health Service Register. Scand J Public Health. 2011;39(7Suppl):34–37. doi:10.1177/1403494810394718
40. The Danish Health Data A. The National Health Service Register; 2018.
41. Christiansen DH, Frost P, Frich LH, Falla D, Svendsen SW. The use of physiotherapy among patients with subacromial impingement syndrome: impact of sex, socio-demographic and clinical factors. PLoS One. 2016;11(3):e0151077. doi:10.1371/journal.pone.0151077
42. Johansen AN, Stenzhorn AA, Rosenzweig M, Thirstrup S, Gazerani P. Prescribing patterns and safety monitoring of duloxetine using the Danish Register of Medicinal Product Statistics as a source. Scand J Public Health. 2013;41(8):866–873. doi:10.1177/1403494813496599
43. The Danish Health Data A. Register of Medicinal Product Statistics; 2016.
44. Nomesco N. NOMESCO Classification of Surgical Procedures (NCSP), version 1.14; 2009.
45. Mainz J, Hess MH, Johnsen SP. The Danish unique personal identifier and the Danish Civil Registration System as a tool for research and quality improvement. Int j Qual Health Care. 2019;mzz008. doi:10.1093/intqhc/mzz008
46. Pedersen CB. The Danish Civil Registration System. Scand J Public Health. 2011;39(7Suppl):22–25. doi:10.1177/1403494810387965
47. Jensen VM, Rasmussen AW. Danish education registers. Scand J Public Health. 2011;39(7_suppl):91–94. doi:10.1177/1403494810394715
48. UNESCO. International standard classification of education: ISCED 2011. UNESCO Institute for Statistics Montreal; 2012.
49. Donnellan MB, Oswald FL, Baird BM, Lucas RE. The mini-IPIP scales: tiny-yet-effective measures of the Big Five factors of personality. Psychol Assess. 2006;18(2):192. doi:10.1037/1040-3590.18.2.192
50. Goldberg LR, Johnson JA, Eber HW, et al. The international personality item pool and the future of public-domain personality measures. J Res Pers. 2006;40(1):84–96. doi:10.1016/j.jrp.2005.08.007
51. Luo X, George ML, Kakouras I, et al. Reliability, validity, and responsiveness of the short form 12-item survey (SF-12) in patients with back pain. Spine. 2003;28(15):1739–1745. doi:10.1097/01.BRS.0000083169.58671.96
52. Gandek B, Ware JE, Aaronson NK, et al. Cross-validation of item selection and scoring for the SF-12 Health Survey in nine countries: results from the IQOLA Project. International Quality of Life Assessment. J Clin Epidemiol. 1998;51(11):1171. doi:10.1016/S0895-4356(98)00109-7
53. Ware JE, Kosinski M, Keller SD. A 12-Item Short-Form Health Survey: construction of Scales and Preliminary Tests of Reliability and Validity. Med Care. 1996;34(3):220–233. doi:10.1097/00005650-199603000-00003
54. Christensen KS, Fink P, Toft T, Frostholm L, Ørnbøl E, Olesen F. A brief case-finding questionnaire for common mental disorders: the CMDQ. Fam Pract. 2005;22(4):448–457. doi:10.1093/fampra/cmi025
55. Derogatis LR, Unger R. Symptom Checklist-90-Revised. The Corsini Encyclopedia of Psychology. 1-2. doi:10.1002/9780470479216.corpsy0970.
56. Fink P, Ewald H, Jensen J, et al. Screening for somatization and hypochondriasis in primary care and neurological in-patients: a seven-item scale for hypochondriasis and somatization. J Psychosom Res. 1999;46(3):261–273.
57. DSAM. Recommendation for Common Mental Disorders Questionnaire CMDQ). The Danish College of General Practitioners. Available from: https://vejledninger.dsam.dk/funktionellelidelser/?mode=showPage&pageId=51.
58. Waddell G, Newton M, Henderson I, Somerville D, Main CJ. A Fear-Avoidance Beliefs Questionnaire (FABQ) and the role of fear-avoidance beliefs in chronic low back pain and disability. Pain. 1993;52(2):157–168. doi:10.1016/0304-3959(93)90127-B
59. Trolle N, Christiansen DH. Measurement properties of the Fear-Avoidance Belief Questionnaire for physical activity in patients with shoulder impingement syndrome. Patient Relat Outcome Meas. 2019;10:83–87. doi:10.2147/prom.s191782
60. Quan H, Li B, Couris CM, et al. Updating and validating the Charlson comorbidity index and score for risk adjustment in hospital discharge abstracts using data from 6 countries. Am J Epidemiol. 2011;173(6):676–682. doi:10.1093/aje/kwq433
61. Thygesen SK, Christiansen CF, Christensen S, Lash TL, Sorensen HT. The predictive value of ICD-10 diagnostic coding used to assess Charlson comorbidity index conditions in the population-based Danish National Registry of Patients. BMC Med Res Methodol. 2011;11:1–6. doi:10.1186/1471-2288-11-83.
62. Hjollund NH, Larsen FB, Andersen JH. Register-based follow-up of social benefits and other transfer payments: accuracy and degree of completeness in a Danish interdepartmental administrative database compared with a population-based survey. Scand J Public Health. 2007;35(5):497–502. doi:10.1080/14034940701271882
63. Twisk J, Hoekstra T. Classifying developmental trajectories over time should be done with great caution: a comparison between methods. J Clin Epidemiol. 2012;65(10):1078–1087. doi:10.1016/j.jclinepi.2012.04.010
64. Lennon H, Kelly S, Sperrin M, et al. Framework to construct and interpret latent class trajectory modelling. BMJ Open. 2018;8(7):e020683. doi:10.1136/bmjopen-2017-020683
65. Collins LM, Lanza ST. Latent Class and Latent Transition Analysis: With Applications in the Social, Behavioral, and Health Sciences. Vol. 718. John Wiley & Sons; 2009.
66. Ethics N. Act on Research Ethics Review of Health Research Projects. Available from: https://en.nvk.dk/rules-and-guidelines/act-on-research-ethics-review-of-health-research-projects.
67. Li C. Little’s test of missing completely at random. Stata J. 2013;13(4):795–809. doi:10.1177/1536867X1301300407
68. Oliveira CB, Maher CG, Pinto RZ, et al. Clinical practice guidelines for the management of non-specific low back pain in primary care: an updated overview. Eur Spine J. 2018;27(11):2791–2803. doi:10.1007/s00586-018-5673-2
69. Kjaer P, Kongsted A, Hartvigsen J, et al. National clinical guidelines for non-surgical treatment of patients with recent onset neck pain or cervical radiculopathy. Eur Spine J. 2017;26(9):2242–2257. doi:10.1007/s00586-017-5121-8
70. Nissen SK, Pottegård A, Ryg J. Trends of Opioid Utilisation in Denmark: a Nationwide Study. Drugs - Real World Outcomes. 2019;6(4):155–164. doi:10.1007/s40801-019-00163-w
71. Goldberg LR. An alternative “description of personality”: the big-five factor structure. J Pers Soc Psychol. 1990;59(6):1216–1229. doi:10.1037//0022-3514.59.6.1216
72. McCrae RR, Costa PT
73. McAndrew LM, Mora PA, Quigley KS, Leventhal EA, Leventhal H. Using the common sense model of self-regulation to understand the relationship between symptom reporting and trait negative affect. Int J Behav Med. 2014;21(6):989–994. doi:10.1007/s12529-013-9372-4
74. Nickelsen T. Data validity and coverage in the Danish National Health Registry. A literature review. Ugeskr Laeger. 2001;164(1):33–37.
75. Aili K, Campbell P, Michaleff ZA, et al. Long-term trajectories of chronic musculoskeletal pain: a 21-year prospective cohort latent class analysis. Pain. 2020;162:1511. doi:10.1097/j.pain.0000000000002137
76. Kamaleri Y, Natvig B, Ihlebaek CM, Benth JS, Bruusgaard D. Change in the number of musculoskeletal pain sites: a 14-year prospective study. Pain. 2009;141(1–2):25–30. doi:10.1016/j.pain.2008.09.013
77. Neupane S, Nygård CH, Prakash KC, et al. Multisite musculoskeletal pain trajectories from midlife to old age: a 28-year follow-up of municipal employees. Occup Environ Med. 2018;75(12):863–870. doi:10.1136/oemed-2018-105235
78. Kjaersgaard MIS, Vedsted P, Parner ET, et al. Algorithm linking patients and general practices in Denmark using the Danish National Health Service Register. Clin Epidemiol. 2016;8:273. doi:10.2147/CLEP.S108307
 © 2021 The Author(s). This work is published and licensed by Dove Medical Press Limited. The full terms of this license are available at https://www.dovepress.com/terms.php and incorporate the Creative Commons Attribution - Non Commercial (unported, v3.0) License.
By accessing the work you hereby accept the Terms. Non-commercial uses of the work are permitted without any further permission from Dove Medical Press Limited, provided the work is properly attributed. For permission for commercial use of this work, please see paragraphs 4.2 and 5 of our Terms.
© 2021 The Author(s). This work is published and licensed by Dove Medical Press Limited. The full terms of this license are available at https://www.dovepress.com/terms.php and incorporate the Creative Commons Attribution - Non Commercial (unported, v3.0) License.
By accessing the work you hereby accept the Terms. Non-commercial uses of the work are permitted without any further permission from Dove Medical Press Limited, provided the work is properly attributed. For permission for commercial use of this work, please see paragraphs 4.2 and 5 of our Terms.