")
Back to Journals » International Journal of Nanomedicine » Volume 9 » Issue 1
Toxicity evaluation of Gd2O3@SiO2 nanoparticles prepared by laser ablation in liquid as MRI contrast agents in vivo
Authors Tian X , Yang F , Yang C, Peng Y, Chen D, Zhu J, He F, Li L , Chen X
Received 14 April 2014
Accepted for publication 15 May 2014
Published 21 August 2014 Volume 2014:9(1) Pages 4043—4053
DOI https://doi.org/10.2147/IJN.S66164
Checked for plagiarism Yes
Review by Single anonymous peer review
Peer reviewer comments 4
Xiumei Tian,1,* Fanwen Yang,1,* Chuan Yang,2 Ye Peng,1 Dihu Chen,3 Jixiang Zhu,1 Fupo He,1 Li Li,2 Xiaoming Chen1
1Department of Biomedical Engineering, Guangzhou Medical University, Guangzhou, Guangdong Province, People’s Republic of China; 2State Key Laboratory of Oncology in South China, Imaging Diagnosis and Interventional Center, Sun Yat-sen University Cancer Center, Guangzhou, Guangdong Province, People’s Republic of China; 3State Key Laboratory of Optoelectronic Materials and Technologies, School of Physics and Engineering, Sun Yat-Sen University, Guangzhou, Guangdong Province, People’s Republic of China
*These authors contributed equally to this work
Abstract: Poor toxicity characterization is one obstacle to the clinical deployment of Gd2O3@SiO2 core-shell nanoparticles (Gd-NPs) for use as magnetic resonance (MR) imaging contrast agents. To date, there is no systematic toxicity data available for Gd-NPs prepared by laser ablation in liquid. In this article, we systematically studied the Gd-NPs’ cytotoxicity, apoptosis in vitro, immunotoxicity, blood circulation half-life, biodistribution and excretion in vivo, as well as pharmacodynamics. The results show the toxicity, and in vivo MR data show that these NPs are a good contrast agent for preclinical applications. No significant differences were found in cell viability, apoptosis, and immunotoxicity between our Gd-NPs and Gd in a DTPA (diethylenetriaminepentaacetic acid) chelator. Biodistribution data reveal a greater accumulation of the Gd-NPs in the liver, spleen, lung, and tumor than in the kidney, heart, and brain. Approximately 50% of the Gd is excreted via the hepatobiliary system within 4 weeks. Furthermore, dynamic contrast-enhanced T1-weighted MR images of xenografted murine tumors were obtained after intravenous administration of the Gd-NPs. Collectively, the single step preparation of Gd-NPs by laser ablation in liquid produces particles with satisfactory cytotoxicity, minimal immunotoxicity, and efficient MR contrast. This may lead to their utility as molecular imaging contrast agents in MR imaging for cancer diagnosis.
Keywords: gadolinium, molecular imaging, cytotoxicity, immunotoxicity
Introduction
Nanomaterials have tremendous biomedical applications at the molecular and cellular levels, especially for use as contrast agents in molecular imaging.1 As an important nonradioactive and noninvasive method with high spatial resolution, magnetic resonance imaging (MRI) has become a routine diagnostic tool in modern clinical medicine. However, amplification strategies are needed to overcome the inherently low sensitivity of MRI.2–4 One of conventional strategies uses gadolinium (Gd) (III) chelates5,6 but has been shown to have potential toxicity including nephrogenic systemic fibrosis.7 In this regard, it is thus crucial to develop efficient nanoparticles (NPs) lacking or having minimal toxicity in vitro and in vivo, including absorption, distribution, metabolism, excretion, and immunotoxiciy.8–11
Gd2O3 is an attractive T1-weighted MRI contrast agent due to its numerous unpaired electrons,12–14 but it is important to improve its biocompatibility and wettability by coating with silica.15 These Gd-NPs are traditionally prepared by complicated two-step chemical methods using Stober chemistry.16,17 In this paper, Gd-NPs are prepared by a simple and facile laser ablation in liquid (LAL) approach.18,19 LAL is a unique and efficient technique, which has been widely used to generate NPs.20–22 However, little attention has been given to the use of LAL to prepare NPs for biomedical applications especially the toxicity, biodistribution, and clearance of these probes.23–26 Characterization of the immune response to these agents is particularly relevant,27,28 especially in vivo.28–30 These studies are important to understand the relationship between NP structure and toxicity and thus provide the rational suggestions on the design of contrast agents in the future.8
To the best of our knowledge, we present here the most extensive characterization of LAL NP in vivo toxicity, pharmacokinetics, and pharmacodynamics. In our previous research, Gd-NPs have been successfully synthesized by LAL in a single step and shown to be sensitive MRI contrast agents.30 However, their toxicity, pharmacokinetics, and in vivo utility have not yet been investigated. Here we report the systematic evaluation of Gd-NP toxicity including cell viability and apoptosis, reactive oxygen species (ROS) assays, changes to lymphocyte populations, serum cytokine levels, pharmacokinetics, and pharmacodynamics. This characterization will bring these materials closer to clinical use.
Materials and methods
Synthesis and characterization of Gd-NPs
Synthesis
Laser ablation of Gd2O3 in liquid has been shown in our previous work.30 A Nd:YAG laser (wavelength λ=1,064 nm) with 6 μs pulse duration at 100 Hz was focused on the Gd2O3 target. The ablated samples were collected by centrifuge to exclude large particles prior to further applications in vitro and in vivo.
Characterization
Dimensions and structural details of the Gd-NPs were measured with transmission electron microscopy (TEM) (JEOL, Tokyo, Japan). Colloidal samples were dispersed in ethanol by ultrasonication, then dropped onto a holey carbon-copper grid, and dried at room temperature. The average diameter and particle size distribution were analyzed by Nano Measurer 1.2.5 image analysis software (Jie Xu, Fudan University, Shan hai, People’s Republic of China). The composition of the samples was measured by energy dispersive spectrometry (Oxford Instruments Analytical Ltd, Buckinghamshire, UK).
Phase-sensitive TI inversion recovery imaging
The concentration of Gd3+ was obtained by inductively coupled plasma atomic emission spectroscopy (CIROS VISION; SPECTRO Analytical Instruments, Kleve, Germany). Samples with various concentrations of Gd3+ (0.3, 0.2, 0.1, 0.05, 0.025, and 0 mM) in deionized water were placed into a 1.5 mL Eppendorf tube, and measured by using a 3.0 T Siemens Trio (Siemens Medical Solutions, Erlangen, Germany) MRI scanner. The longitudinal relaxation rate (1/T1, units of s-1) for Gd3+ at different concentrations was measured with inversion recovery pulse sequences with TR =2,000 ms and TI =500−1,400 ms. TI is fitted to an exponential T1 recovery model by the following nonlinear least square regression equation, from which 1/T1 of different Gd3+ concentration is determined.
| (1) |

where T1 is longitudinal relaxation rate, TR is recovery time, and TI is inversion time. SIR, gray-scale values of the MRI images, was provided by picture archiving and communication system (PACS) software (Numaris/4, version syngo MR B17; Siemens AG, Erlangen, Germany).
Longitudinal relaxivity (r1, units of s−1 mM−1) of the Gd-NPs was calculated according to the formula,
| (2) |

Toxicity of Gd-NPs in vitro
Cytotoxicity assay
The mouse fibrosarcoma L-929 cells were seeded in 96-well plates at a density of 4×10³/well. Cells in a logarithmic growth period were incubated with different concentrations of Gd-NPs (2× phosphate buffered saline [PBS], 10 μM, 1 μM, and 100 nM) in DMEM (Dulbecco’s modified Eagle’s medium) at 37°C, 5% CO2. The L-929 cells treated only with culture media served as negative controls, lipopolysaccharide (500 ng/mL) was used as the positive control. All groups were cultured for 24 and 48 hours post-treatment. We then added 20 μL of MTT (3-(4,5-dimethylthiazol-2-yl)-2, 5-diphenyltetrazolium bromide) to each well for another 4 hours of incubation, then removed the culture medium and replaced with 100 μL DMSO (dimethyl sulfoxide), followed by 10 minutes of incubation. The absorbance at 490 nm was measured by a microplate reader (Bio-Rad Laboratories Inc., Hercules, CA, USA).
Apoptosis assay
The murine macrophage line Raw264.7 cells were incubated with PBS (negative control), Gd-diethylenetriaminepentaacetic acid (DTPA) (500 nM), Gd-NPs (2× PBS buffer, 10 μM, 1 μM, 500 nM, and 100 nM) for 48 hours in 6-well plates. We used 4×10⁵ cells/mL in 200 μL binding buffer (1×). We then added 5 μL Annexin V-FITC (eBioscience, San Diego, CA, USA) into 195 μL cell suspension, mixed and incubated for 10 minutes at room temperature, washed cells twice in 200 μL binding buffer (1×), and resuspended in 190 μL binding buffer (1×). We then added 10 μL propidium iodide (20 μg/mL). Cells were analyzed on a FACScan (Becton Dickinson, Mountain View, CA, USA).
Immunotoxicity assay of Gd-NPs in vivo
Male BALB/c mice, 6–8 weeks old, were purchased from the animal experiment center of the Medical College, Sun Yat-sen University, People’s Republic of China. The mice were maintained in a specific pathogen-free environment. Twenty mice were divided into three groups at random: 1) PBS (100 μL, negative control), 2) Gd-DTPA (15 μmol/kg), and 3) Gd-NPs (2× PBS buffer, 15 μmol/kg).
ROS of neutrophils in peripheral blood
Peripheral blood (20 μL) was supplemented in a tube with heparin sodium (4 μL) by tail vein. Erythrocytes were removed by ammonium–chloride-potassium lysis buffer (2 mL) in the dark for 2 minutes. We then added 2 mL PBS and centrifuged at 1,200× g for 5 minutes at room temperature. H2DCFDA (Thermo Fisher Scientific, Waltham, MA, USA) was added to a final concentration of 5×10⁻⁶ mol/L. Cells were mixed in the dark for 20 minutes, and added to 400 μL PBS. Samples were measured by flow cytometry.
Expressions of representative CD markers of monocytes/macrophages in peripheral blood
Peripheral blood (20 μL) was collected into a tube supplemented with heparin sodium (4 μL) by vena ophthalmica. Cells were stained with anti-mouse F4/80 antigen APC, anti-mouse CD206-PE (eBioscience), anti-mouse CD40-PE, anti-mouse CD11b-FITC, anti-mouse CD80-PE, and anti-mouse CD86-PE (PharMingen; Becton Dickinson) in the dark for 30 minutes. Then 2 mL of erythrocytes were lysed in the dark for 2 minutes, followed by the addition of 2 mL PBS, which was subsequently centrifuged at 1,200× g for 5 minutes at room temperature. This was resuspended in 400 μL PBS. Samples were measured by flow cytometry.
Expression on CD69 of lymphocyte cells in peripheral blood
Peripheral blood (20 μL) was stained with anti-mouse CD69-FITC and anti-mouse CD3-PE (PharMingen; Becton Dickinson) in the dark for 30 minutes. Samples were processed by flow cytometry.
Expression of CD69 in peripheral lymphocytes
Mice were sacrificed by decapitation, and lymphocyte cells were isolated from the subclavicular, grounding submandibular, axillary, superficial inguinal, and mesenteric lymph nodes through 200 meshes under sterile conditions. Samples were centrifuged at 300× g for 5 minutes at room temperature and incubated with anti-mouse CD69-FITC and anti-mouse CD3-PE in the dark for 30 minutes. Samples were measured by flow cytometry.
Concentrations of cytokines including IL-1β, IL-2, and IL-4
Peripheral blood was collected in 1.5 mL Eppendorf tubes by vena ophthalmica in mice, at room temperature for 45 minutes. Samples were centrifuged at 3,000 rpm at 4°C for 10 minutes. The serum was transferred into new Eppendorf tubes and assayed by IL-1β, IL-2, and IL-4 ELISA (enzyme-linked immunosorbent assay) kits (RayBiotech, Inc., Norcross, GA, USA) according to the provided instructions. Calibration curves are in Figure S1 (https://www.dovepress.com/get_supplementary_file.php?f=supplementary_file_66164.pdf).
Statistical analyses
All data are expressed as mean ± SEM. Statistical analyses were performed by one-way ANOVA (analysis of variance) or one-sample t-test by using OriginPro v8.0 software (OriginLab Co., Northampton, MA, USA).
The half-life of the Gd-NPs
Animal experiments were performed according to the National Institutes of Health guidelines on the rules of animal research and our institution’s animal board. The half-life of the Gd-NPs in the circulation was measured by inductively coupled plasma mass spectrometry (ICP-MS) (n=3) in 36 Kunming white mice (50% males and 50% females). Peripheral blood (5–10 μL) was collected from the tail vein with heparin sodium (85 μL) in separate Eppendorf tubes at 5, 15, 30, 60, 120, 180, 240, 360, 480, and 720 minutes after tail-vein administration of the Gd-NPs (15 μmol/kg).
MRI in vivo
Animal experiments were performed according to the National Institutes of Health guidelines on the rules of animal research and our institution’s animal board. BALB/c nude mice (4–6 weeks old, weight of 18–22 g) were obtained from the animal experiment center of the Medical College, Sun Yat-sen University, People’s Republic of China, then maintained in a specific pathogen-free environment (Certificate No. 26-99S031). Mice were subcutaneously injected with nasopharyngeal carcinoma CNE-2 cells (5×10⁶ in 100 μL PBS). Mice were randomized after 10 days, at which time the tumors had reached 7 mm3.
Mice were anesthetized by intraperitoneal injection of 0.1 mebumalnatrium (10 μL per gram bodyweight), followed by tail-vein administration of 15 μmol/kg of the Gd-NPs. Scans used a 3.0 T Siemens Trio MRI scanner (Siemens Medical Solutions, Erlangen, Germany) and a 3-inch surface coil. The control group was injected with 100 μL saline solution by the tail vein.
T1-weighted images were obtained at 0, 15, 30, 60, 90, and 120 minutes after intravenous administration of the Gd-NPs in the axial orientations. The sequences were TSE (turbo spin echo) T1 axial (5% distance factor, slice thickness 2.0 mm, FOV [field of view] 64 mm, TE [echo time] 12 ms, TR [repetition time] 600 ms, with six averages). All data were analyzed by PACS software: Numaris/4 (version syngo mr b17; Siemens AG). The entire tumor was used to generate normalized histograms of signal intensity, and thus the results were not biased toward aberrantly enhanced regions.
Results and discussion
Morphology, component, and in vitro MRI of Gd-NPs
The Gd-NPs were synthesized in a single step via the pyrolysis of silica precursors caused by a laser-induced plasma plume. Typical TEM images (Figure 1A) of the Gd-NPs show a spherical, uniform, and mono-disperse morphology. As shown in Figure 1B and C, the average size of the NPs was 37.29±1.03 nm, while the thickness of the shell was 7.93±0.13 nm. The energy dispersive spectrometry results in Figure 1D and E show the atomic percentage of gadolinium and silicon in the core and the surface, respectively, indicating that the SiO2 was successfully assembled on the surface of the Gd2O3 core. In addition, the zeta potential of our Gd-NPs was −7.06±0.61 mV (Figure S11; https://www.dovepress.com/get_supplementary_file.php?f=supplementary_file_66164.pdf). This indicates that the NPs are not easy to combine with most proteins in the blood due to negative charge. Figure S2 (https://www.dovepress.com/get_supplementary_file.php?f=supplementary_file_66164.pdf) shows that r1 relaxivity of our NPs was higher than commercial MRI contrast agents using the DTPA chelator (Gd-DTPA),31 and indicates that the Gd-NPs are effective T1-weighted MRI contrast agents.
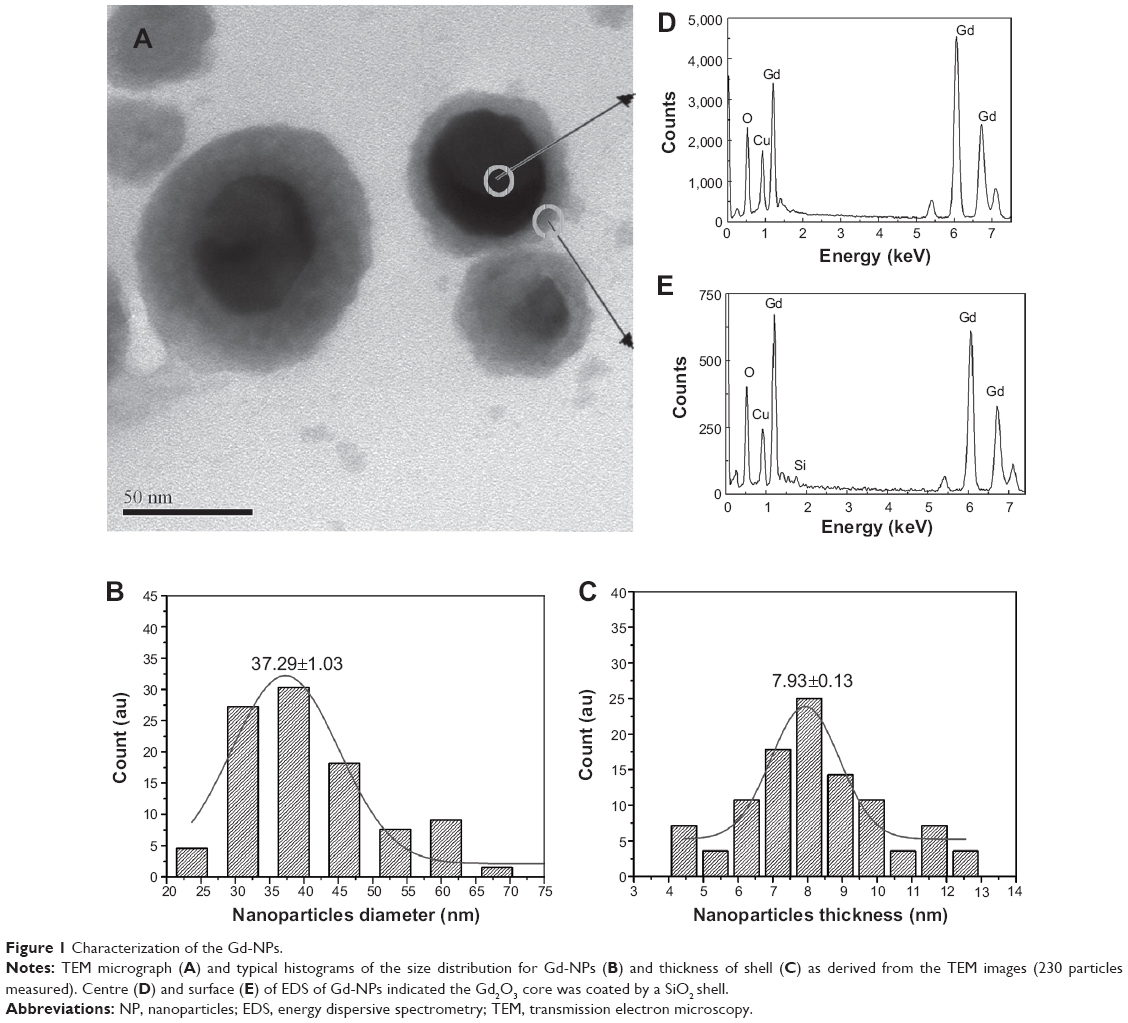 | Figure 1 Characterization of the Gd-NPs. |
Cell viability and apoptosis of Gd-NPs
Cell viability was evaluated with MTT assay and treated by culture media (negative controls) and lipopolysaccharide (500 ng/mL, positive control). As shown in Figure 2A, cell viability of the mouse fibrosarcoma L929 cells remained high after co-incubation with Gd-NPs for 24 and 48 hours, suggesting low cytotoxicity.
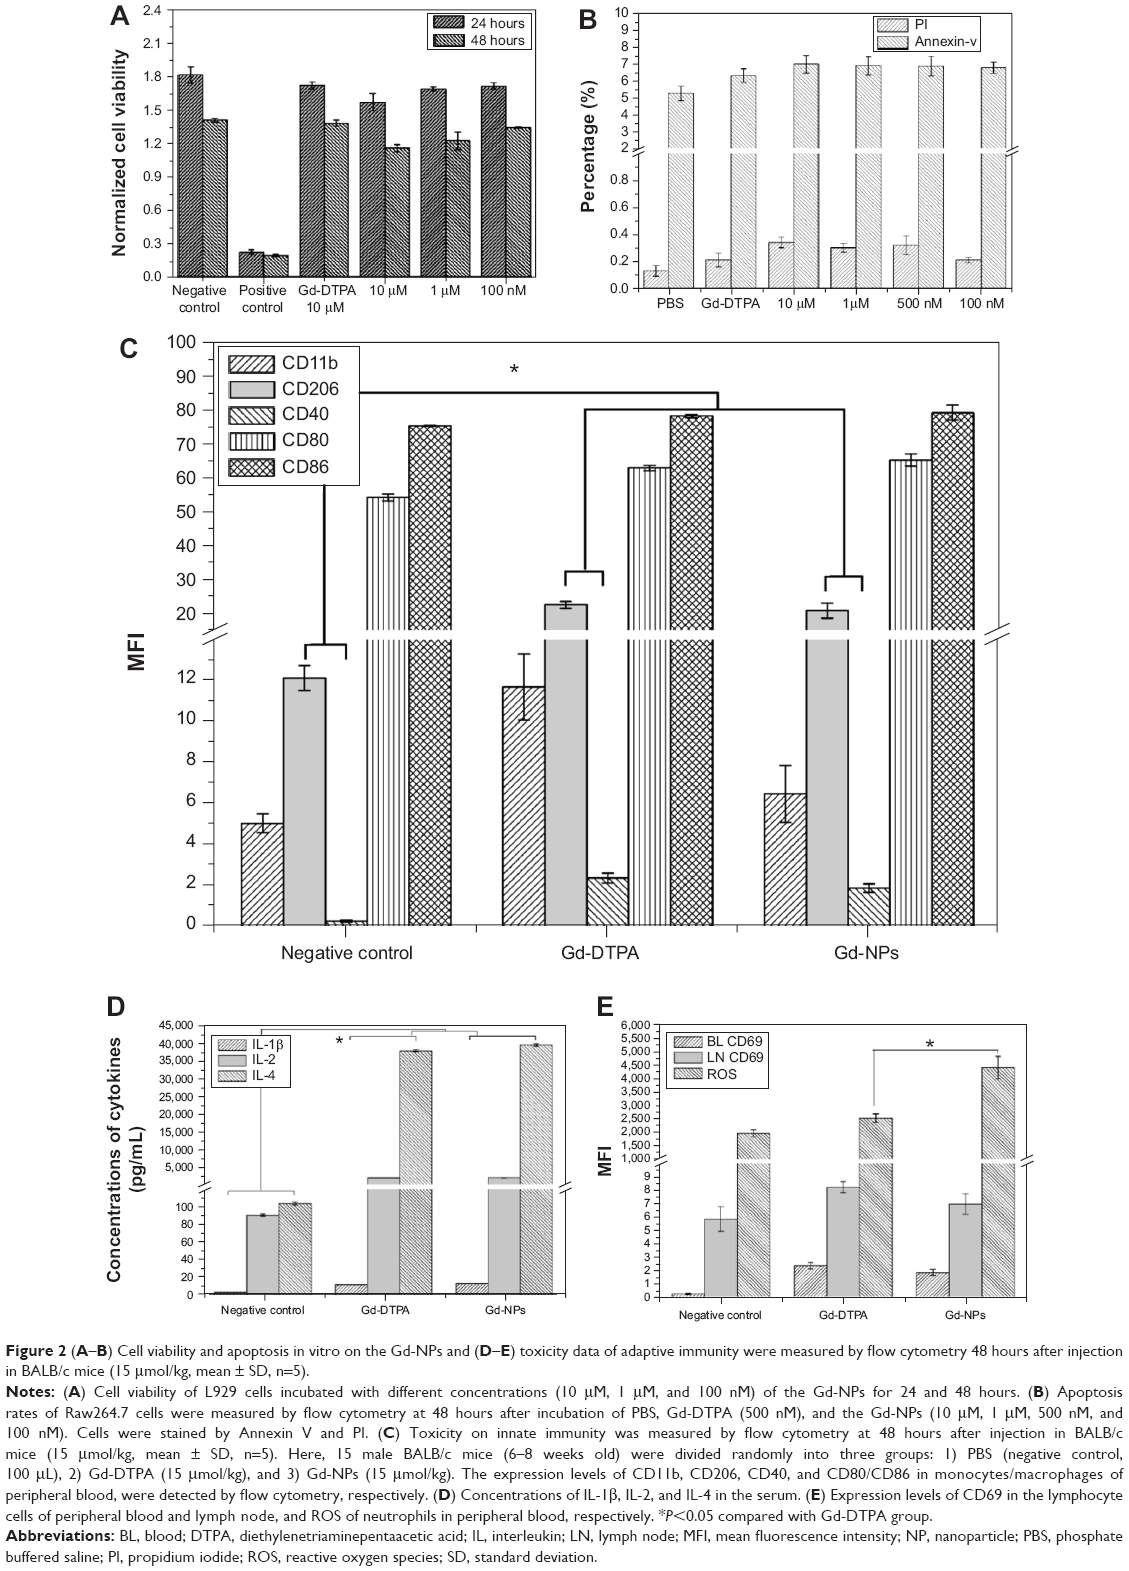 | Figure 2 (A–B) Cell viability and apoptosis in vitro on the Gd-NPs and (D–E) toxicity data of adaptive immunity were measured by flow cytometry 48 hours after injection in BALB/c mice (15 μmol/kg, mean ± SD, n=5). |
Apoptosis was studied with flow cytometry on Raw264.7 cells stained with Annexin-V/PI (PharMingen; Becton Dickinson). Cells were incubated with PBS (negative control), Gd-DTPA (500 nM, positive control), and Gd-NPs (500 nM) for 48 hours (Figure 2B). No significant differences were seen versus negative control between the Gd-DTPA and Gd-NPs suggesting that the Gd-NPs had no effect on macrophage survival. At 10 μM, 1 μM, and 500 nM there was more apoptosis than at 100 nM. There was no significant difference between Gd-DTPA and the Gd NPs at 500 nM. The results indicated that the percentage of apoptosis was increased due to the high concentration of Gd-NPs, but the generation of apoptosis could be regulated by the cells. Thus, the in vitro data showed a Gd-NP biocompatibility suitable for in vivo study.
Immunotoxicity of Gd-NPs in vivo
Immunotoxicity was investigated in BALB/c mice using ROS, CD markers, and cytokine production. We studied: ROS of neutrophil in the peripheral blood; CD markers of innate immunity including CD40, CD206, CD11b, and CD80/CD86 in peripheral blood monocytes/macrophages;32 CD marker of adaptive immunity including CD69 in peripheral blood lymphocytes and lymph nodes;33 and IL-1β, IL-2, and IL-4 in serum.
The results on the innate and adaptive immunotoxicity of the Gd-NPs are shown in Figures 2C–E and S3–S5. Although there is statistical difference between Gd-NPs and the negative control groups (PBS) on the expression levels of CD206, CD40, IL-1β, IL-2, and IL-4, there is no difference except the neutrophil ROS between the Gd-NP and Gd-DTPA groups (P=0.05). This suggests that both Gd-DTPA and our nanoprobes increase ROS generation 0.29% and 0.75%, respectively. In general, ROS is a vague and generalized mediator of immunity, and can trigger either the eradication of pathogens or immunosuppression during tissue-restoration processes.
However, as opposed to Gd-DTPA, our Gd-NPs did not stimulate the immune system. This suggests that the Gd-NPs may have minimal immunotoxicity, but within normal control of homeostasis. We thus conclude that the immunotoxicity of our nanoprobe is satisfactory.
Half-life, biodistribution, and excretion of Gd-NPs
We next assessed in vivo behavior including physicochemical characteristics.8 Thus, we first assessed the stability of Gd-NP in blood. The half-life of Gd was 72.45 (±10.24) minutes in the blood (Figure 3A), which was much longer than that of Gd-DTPA used in clinical applications (about 20 minutes).34 The longer serum half-life might indicate favorable stability in vivo because Gd-DTPA can be cleared renally, while the NP formulation is too big for renal clearance, which may improve the accumulation of nanoprobes in tumor tissue to enhance MRI sensitivity.
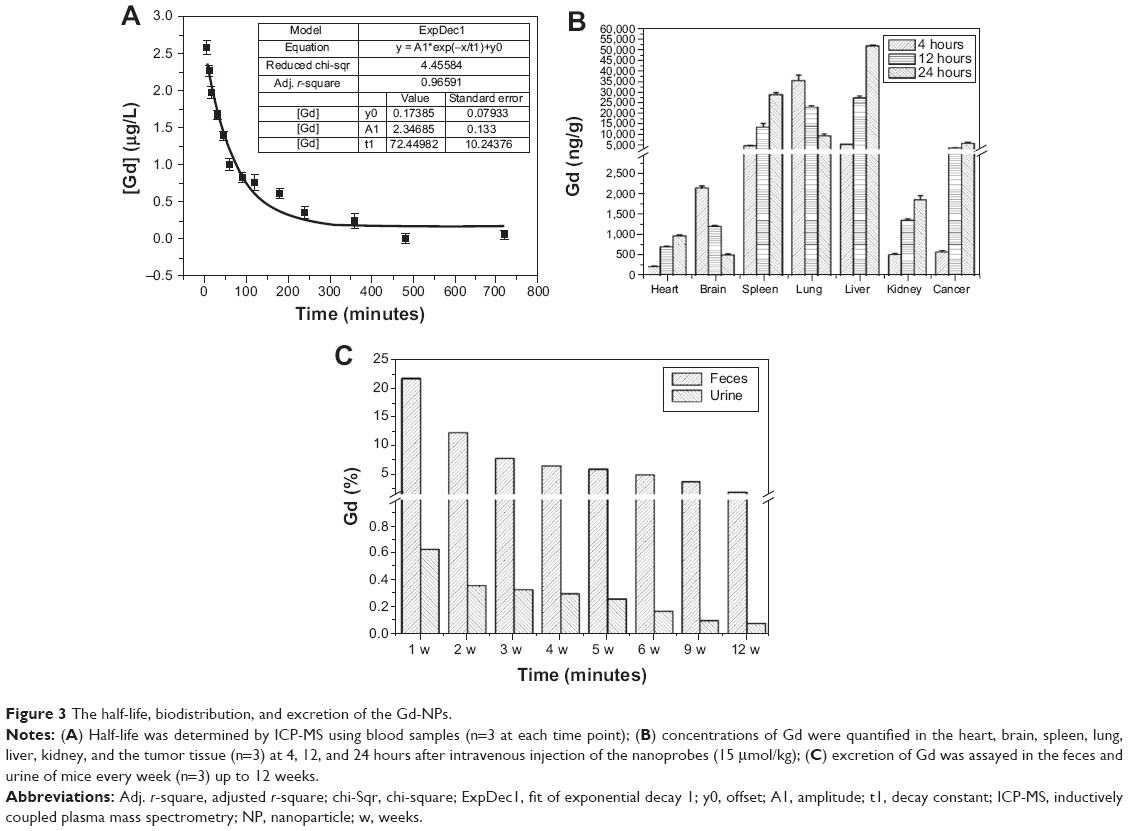 | Figure 3 The half-life, biodistribution, and excretion of the Gd-NPs. |
To further study the biodistribution and excretion of our Gd-NPs, we performed ICP-MS on representative organs and tumor tissues (15 μmol/kg) (Figure 3B). The concentrations of Gd in the heart, brain, spleen, lung, liver, kidney, and xenografted tumor were measured at 4, 12, and 24 hours after intravenous injection. The data indicated that the nanoprobes gradually accumulated in the spleen, lung, liver, and tumor tissue, whereas little Gd was found in the heart, brain, and kidney. The concentrations in the spleen and liver were 10.5-fold higher than in the kidney at 4 hours post-injection. Moreover, in the brain and lung there was a decrease, while in other organs there was a slight increase. Biodistribution is related to the characteristics of materials and the organ specificity.35,36 Different nanomaterials have different size, charge, and morphology, for example. This affects their biodistribution in tissues. Organ specificity also plays a role and includes the blood–brain barrier, hepatic circulation, and reticuloendothelial system. Notably, there was nearly as much Gd in the kidney as the tumor (about 50%). This may be due to three features: 1) diameter of the Gd-NPs was 37.29±1.03 nm – much larger than the size of renal filtration (<5.5 nm); 2) quantum dots smaller than 5.5 nm can be excreted rapidly and efficiently by renal clearance, but those larger than 15 nm accumulate in the liver and spleen;37,38 and 3) NPs easily accumulate in tumor due to the presence of endothelial gaps, high micro-vessel density, and high tumor blood flow.36,39 Interestingly, the Gd-NPs accumulate in tumor tissues via capillaries and repeated blood circulation, and indicate a potential use for passive tumor-targeting via the enhanced permeation and retention effect.
To further investigate this, the Gd-NP biodistribution was observed by TEM at the subcellular level (Figures 4A and S6; https://www.dovepress.com/get_supplementary_file.php?f=supplementary_file_66164.pdf), sections of the brain, lung, xenografted tumors, liver, and spleen were observed 4 hours after injection with the Gd-NPs. The nanoprobes were mainly localized in the cytoplasm of epithelial cells in the tumor tissue and in the lysosomes of live macrophages. The nanoprobes were dispersed inside the organs and exhibited little aggregation because they were located in the phagolysome.
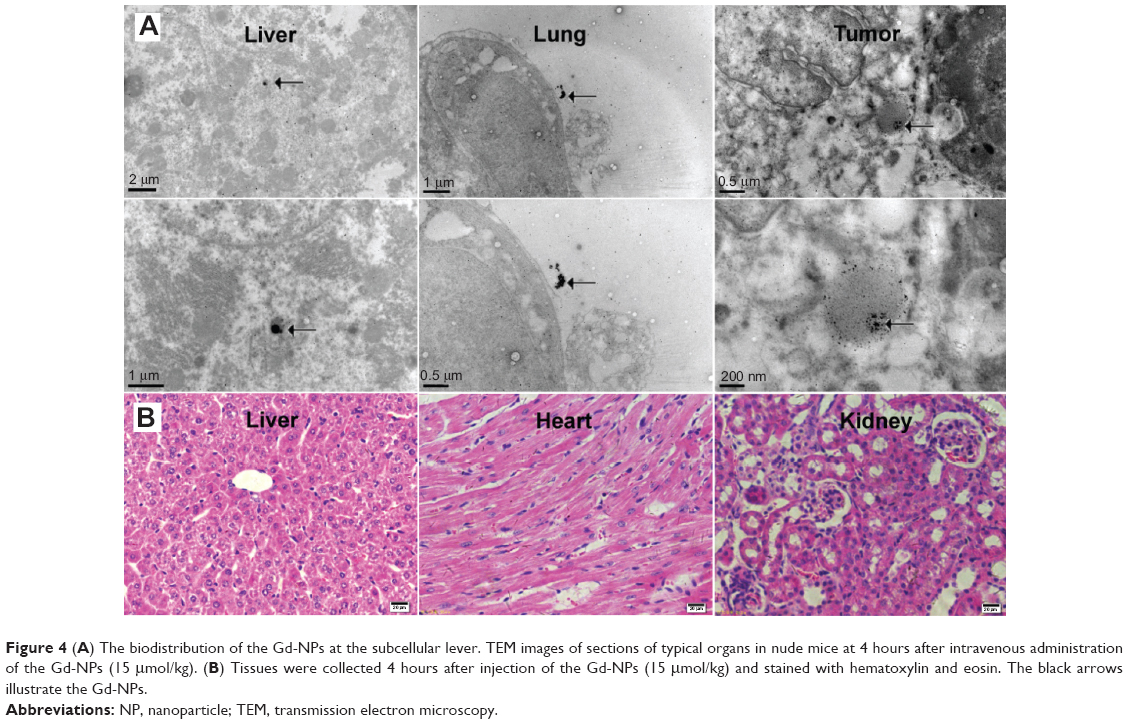 | Figure 4 (A) The biodistribution of the Gd-NPs at the subcellular lever. TEM images of sections of typical organs in nude mice at 4 hours after intravenous administration of the Gd-NPs (15 μmol/kg). (B) Tissues were collected 4 hours after injection of the Gd-NPs (15 μmol/kg) and stained with hematoxylin and eosin. The black arrows illustrate the Gd-NPs. |
To verify excretion of the Gd-NPs, the concentrations of Gd in the feces and urine of mice (n=3) were measured every week following nanoprobe injection (Figure 3C). About 50% of the Gd-NPs was excreted via the hepatobiliary transport system within 4 weeks. Although hepatobiliary excretion of our Gd-NPs is a slow process, it can still effectively decrease the occurrence of local or systemic toxicity due to the accumulation of NPs in tissues. In addition, no abnormalities were found in histological sections of the main organs, including brain, heart, and kidney (Figures 4B and S7; https://www.dovepress.com/get_supplementary_file.php?f=supplementary_file_66164.pdf). This suggested that cellular integrity and tissue morphology were not affected by the Gd-NPs.
In vivo assessment of pharmacodynamics of Gd-NPs
Finally, we studied the Gd-NPs for in vivo MRI. Dynamic contrast-enhanced T1-weighted MRI images of xenografted tumors (about 6.9±0.2 mm in diameter) in a nasopharyngeal carcinoma CNE-2 xenograft mouse model were obtained after intravenous administration of our nanoprobes (15 μmol/kg) (Figure 5A). T1-weighted images demonstrated 44.8% increased signal intensity at 30 minutes post-injection. The Gd-DTPA (15 μmol/kg) used in our previous research39 had a signal enhancement of 23% 5 minutes after injection. Moreover, the dynamic enhancement curve of xenografted tumor and liver demonstrated a “fast-in and fast-out” pattern (Figure 5B).40 Based on our previous studies,30,36,39 the optimized times for MRI imaging are a function of the probe and target tissue. Gd-DTPA quickly drops to baseline due to renal clearance. In contrast, the Gd-NPs accumulate in the tumor. It is more difficult for Gd-NPs to be excreted in tumor than in liver because there is no lymphatic system in the tumor. At 120 minutes, the concentration of Gd in tumor may be higher than at other times. The surface Gd (III) in Gd2O3 has seven unpaired 4f electrons – these may interfere with each other. In fact, the dynamic enhancement curve for T1 contrast in the liver is similar to that in the tumor. The delayed enhancement lasted more than 1.5 hours, which indicates that our Gd-NPs might be optimal for diagnosis of tumors via passively targeted accumulation. It is worth noting that the administered concentration of Gd (15 μmol/kg) in our MRI assessment was only between 3/40 and 3/20 of the standard clinical dose of Gd-DTPA (0.1–0.2 mmol/kg).34
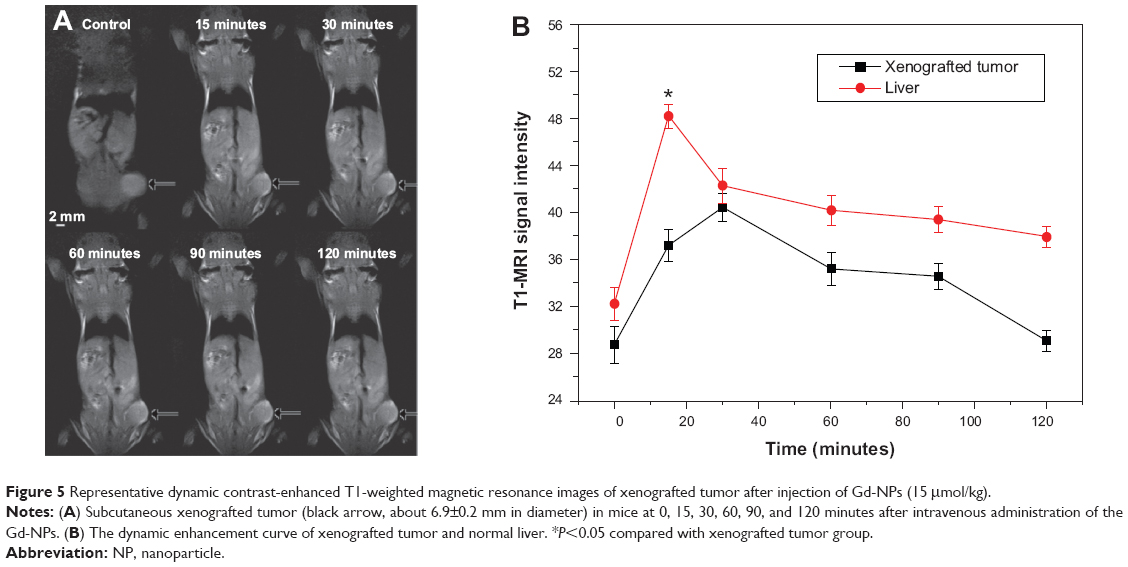 | Figure 5 Representative dynamic contrast-enhanced T1-weighted magnetic resonance images of xenografted tumor after injection of Gd-NPs (15 μmol/kg). |
Superparamagnetic iron oxide NPs (SPIONs) are a negative contrast agent, mainly used for blood-pool imaging. These signals can be easily confused with bleeding, metal deposits, etc. The SPIONs affect iron metabolism in the body and can have potential long-term toxicity effects.41–43
Conclusion
In summary, the Gd-NPs have satisfactory cytotoxicity, minimal apoptosis in vitro, and minimal immunotoxicity in vivo. While not completely free of toxicity concerns, Gd-NPs are at least as nontoxic as US Food and Drug Administration–approved Gd-DTPA and also boast better relaxivity. Meanwhile, Gd-NPs are an efficient contrast agent of MRI in vitro and in vivo, especially for passively targeted imaging. They increase contrast more than label-free imaging and hence could provide a potential platform for the diagnosis of cancer via MRI. Future work will explore further reductions in toxicity through the use of cloaking mechanisms such as polyethylene glycol or Trojan horse carriers.
Acknowledgments
This work was supported with funding from the National Nature Science Foundation of China (NSFC) (81071207, 81271622, and 81071264) and the Postdoctoral Science Foundation of China (No. 2014M552182).
Disclosure
The authors report no conflicts of interest. The authors alone are responsible for the content and writing of the paper.
References
McCarthy JR, Weissleder R. Multifunctional magnetic nanoparticles for targeted imaging and therapy. Adv Drug Deliv Rev. 2008;60: 1241–1251. | ||
Tassa C, Shaw SY, Weissleder R. Dextran-coated iron oxide nanoparticles: a versatile platform for targeted molecular imaging, molecular diagnostics, and therapy. Acc Chem Res. 2011;44:842–852. | ||
Aime S, Castelli DD, Crich SG, Gianolio E, Terreno E. Pushing the sensitivity envelope of lanthanide-based magnetic resonance imaging (MRI) contrast agents for molecular imaging applications. Acc Chem Res. 2009;42:822–831. | ||
Weissleder R, Mahmood U. Molecular imaging. Radiology. 2001;219: 316–333. | ||
Kim H, Jung H, Park J, Huh M, Jung J, Kim T. Gold nanoparticles coated with gadolinium-DTPA-bisamide conjugate of penicillamine (Au @ GdL) as a T1-weighted blood pool contrast agent. J Mater Chem. 2010;20:5411–5417. | ||
Shan L. Gold nanoparticles coated with dithiolated diethylenetriamine pentaacetic acid-gadolinium chelate. Molecular Imaging and Contrast Agent Database. (MICAD). Bethesda, MD: National Center for Biotechnology Information. [Internet]: 8–11. | ||
Marckmann P, Skov L, Rossen K, et al. Nephrogenic systemic fibrosis: suspected causative role of gadodiamide used for contrast-enhanced magnetic resonance imaging. J Am Soc Nephrol. 2006;17:2359–2362. | ||
Fischer HC, Chan WCW. Nanotoxicity: the growing need for in vivo study. Curr Opin Biotechnol. 2007;18:565–571. | ||
Dobrovolskaia MA, Germolec DR, Weaver JL. Evaluation of nanoparticle immunotoxicity. Nat Nanotechnol. 2009;4:411–414. | ||
Kagan VE, Bayir H, Shvedova AA. Nanomedicine and nanotoxicology: two sides of the same coin. Nanomedicine. 2005;1:313–316. | ||
Sung JH, Ji JH, Park JD, et al. Subchronic inhalation toxicity of gold nanoparticles. Part Fibre Toxicol. 2011;8:16. | ||
Anishur Rahman AT, Majewski P, Vasilev K. Gd2O3 nanoparticles: size-dependent nuclear magnetic resonance. Contrast Media Mol Imaging. 2013;8(1):92–95. | ||
Dixit S, Das M, Alwarappan S, et al. Phospholipid micelle encapsulated gadolinium oxide nanoparticles for imaging and gene delivery. RSC Adv. 2013;3(8):2727–2735. | ||
Azizian G, Riyahi-Alam N, Haghgoo S, et al. Synthesis route and three different core-shell impacts on magnetic characterization of gadolinium oxide-based nanoparticles as new contrast agents for molecular magnetic resonance imaging. Nanoscale Res Lett. 2012;7(1):549. | ||
Vivero-Escoto JL, Slowing II, Trewyn BG, Lin VS-Y. Mesoporous silica nanoparticles for intracellular controlled drug delivery. Small. 2010;6:1952–1967. | ||
Yi DK, Selvan ST, Lee SS, Papaefthymiou GC, Kundaliya D, Ying JY. Silica-coated nanocomposites of magnetic nanoparticles and quantum dots. J Am Chem Soc. 2005;127:4990–4991. | ||
Roberts D, Zhu WL, Frommen CM, Rosenzweig Z. Synthesis of gadolinium oxide magnetoliposomes for magnetic resonance imaging. J Appl Phys. 2000;87:6208–6210. | ||
Yang GW. Laser ablation in liquids: applications in the synthesis of nanocrystals. Prog Mater Sci. 2007;52:648–698. | ||
Yang GW. Laser Ablation in Liquids: principles and applications in the preparation of nanomaterials. Singapore: Pan Stanford Pub; 2012. | ||
Amendola V, Meneghetti M. Laser ablation synthesis in solution and size manipulation of noble metal nanoparticles. Phys Chem Chem Phys. 2009;11:3805–3821. | ||
Yan Z, Chrisey DB. Pulsed laser ablation in liquid for micro-/nanostructure generation. J Photochem Photobiol C. 2012;13:204–223. | ||
Online VA, Amendola V, Meneghetti M. What controls the composition and the structure of nano-materials generated by laser ablation in liquid solution? Phys Chem Chem Phys. 2013;15(7):3027–3046. | ||
Jokerst JV, Khademi C, Gambhir SS. Intracellular aggregation of multimodal silica nanoparticles for ultrasound-guided stem cell implantation. Sci Transl Med. 2013;5:177ra35. | ||
Kumar R, Roy I, Ohulchanskky TY, et al. In vivo biodistribution and clearance studies using multimodal organically modified silica nanoparticles. ACS Nano. 2010;4:699–708. | ||
Faraj AA, Cieslar K, Lacroix G, Gaillard S, Canet-soulas E, Cre Y. In vivo imaging of carbon nanotube biodistribution using magnetic resonance imaging. Nano Lett. 2009;9:1023–1027. | ||
Dobrovolskaia MA, McNeil SE. Immunological properties of engineered nanomaterials. Nat Nanotechnol. 2007;2:469–478. | ||
Oostingh GJ, Casals E, Italiani P, et al. Problems and challenges in the development and validation of human cell-based assays to determine nanoparticle-induced immunomodulatory effects. Part Fibre Toxicol. 2011;8:8. | ||
Nguyen KC, Seligy VL, Tayabali AF. Cadmium telluride quantum dot nanoparticle cytotoxicity and effects on model immune responses to Pseudomonas aeruginosa. Nanotoxicology. 2013;7:202–211. | ||
Schrand AM, Rahman MF, Hussain SM, Schlager JJ, Smith DA, Syed AF. Metal-based nanoparticles and their toxicity assessment. Wiley Interdiscip Rev Nanomed Nanobiotechnol. 2010;2:544–568. | ||
Luo NQ, Huang ZY, Li L, Shao YZ, Chen DH. Single-step fabrication of Gd2O3@SiO2 nanoparticles for use as MRI contrast agents by pulsed laser ablation in liquid. Chin Phys Lett. 2013;30(3):038101. | ||
Ananta JS, Godin B, Sethi R, et al. Geometrical confinement of gadolinium-based contrast agents in nanoporous particles enhances T1 contrast. Nat Nanotechnol. 2010;5:815–821. | ||
Kasturi SP, Skountzou I, Albrecht RA, et al. Programming the magnitude and persistence of antibody responses with innate immunity. Nature. 2011;470:543–547. | ||
Sancho D, Gómez M, Sánchez-Madrid F. CD69 is an immunoregulatory molecule induced following activation. Trends Immunol. 2005;26:136–140. | ||
Weinmann H, Brasch R, Press W, Wesbey G. Characteristics of gadolinium-DTPA complex: a potential NMR contrast agent. Am J Roentgenol. 1984;142:619–624. | ||
van Schooneveld MM, Vucic E, Koole R, et al. Improved biocompatibility and pharmacokinetics of silica nanoparticles by means of a lipid coating: a multimodality investigation. Nano Lett. 2008;8:2517–2525. | ||
Shao Y, Tian X, Hu W, et al. The properties of Gd2O3-assembled silica nanocomposite targeted nanoprobes and their application in MRI. Biomaterials. 2012;33:6438–6446. | ||
Choi HS, Liu W, Misra P, et al. Renal clearance of nanoparticles. Nat Biotechnol. 2007;25(10):1165–1170. | ||
Fischer HC, Liu L, Pang KS, Chan WCW. Pharmacokinetics of nanoscale quantum dots: in vivo distribution, sequestration, and clearance in the rat. Adv Funct Mater. 2006;16:1299–1305. | ||
Xiao J, Tian XM, Yang C, et al. Ultrahigh relaxivity and safe probes of manganese oxide nanoparticles for in vivo imaging. Sci Rep. 2013;3: 3424. | ||
Murakami T, Kim T, Takamura M, et al. Hypervascular hepatocellular carcinoma: detection with double arterial phase multi-detector row helical CT. Radiology. 2001;218:763–767. | ||
Li L, Jiang W, Luo K, et al. Superparamagnetic iron oxide nanoparticles as MRI contrast agents for non-invasive stem cell labeling and tracking. Theranostics. 2013;3(8):595–615. | ||
Lam T, Pouliot P, Avti PK, Lesage F, Kakkar AK. Superparamagnetic iron oxide based nanoprobes for imaging and theranostics. Adv Colloid Interface Sci. 2013;199–200:95–113. | ||
Ittrich H, Peldschus K, Raabe N, Kaul M, Adam G. Superparamagnetic iron oxide nanoparticles in biomedicine: applications and developments in diagnostics and therapy. Rofo. 2013;185(12):1149–1166. |
Supplementary materials
Refer to Web version for supplementary material, available from https://www.dovepress.com/get_supplementary_file.php?f=supplementary_file_66164.pdf.
 © 2014 The Author(s). This work is published and licensed by Dove Medical Press Limited. The full terms of this license are available at https://www.dovepress.com/terms.php and incorporate the Creative Commons Attribution - Non Commercial (unported, v3.0) License.
By accessing the work you hereby accept the Terms. Non-commercial uses of the work are permitted without any further permission from Dove Medical Press Limited, provided the work is properly attributed. For permission for commercial use of this work, please see paragraphs 4.2 and 5 of our Terms.
© 2014 The Author(s). This work is published and licensed by Dove Medical Press Limited. The full terms of this license are available at https://www.dovepress.com/terms.php and incorporate the Creative Commons Attribution - Non Commercial (unported, v3.0) License.
By accessing the work you hereby accept the Terms. Non-commercial uses of the work are permitted without any further permission from Dove Medical Press Limited, provided the work is properly attributed. For permission for commercial use of this work, please see paragraphs 4.2 and 5 of our Terms.