")
Back to Journals » International Journal of Nanomedicine » Volume 14
Toxicity and serum metabolomics investigation of Mn-doped ZnS quantum dots in mice
Authors Yang Y, Lv S , Wang F, An Y, Fang N, Zhang W, Zhao W, Guo X, Ji S
Received 15 April 2019
Accepted for publication 6 July 2019
Published 6 August 2019 Volume 2019:14 Pages 6297—6311
DOI https://doi.org/10.2147/IJN.S212355
Checked for plagiarism Yes
Review by Single anonymous peer review
Peer reviewer comments 2
Editor who approved publication: Dr Linlin Sun
Yanjie Yang,1 Shuangyu Lv,1 Fengling Wang,1 Yang An,1 Na Fang,1 Weijuan Zhang,1 Wei Zhao,1 Xiangqian Guo,1 Shaoping Ji1,2
1School of Basic Medical Sciences, Henan University, Kaifeng 475004, People’s Republic of China; 2Henan Provincial Engineering Centre of Tumor Molecular Diagnosis and Therapy & Kaifeng Municipal Key Laboratory of Cell Signal Transduction, Henan University, Kaifeng 475004, People’s Republic of China
Purpose: Mn-doped ZnS quantum dots (QDs) with special luminescent properties have been widely researched and applied in various fields. Thus, their release toxicity and security cannot be ignored.
Methods: In the present study, the toxicity and non-targeted metabolomics of Mn-doped ZnS QDs were investigated after single intravenous injection. Serum metabolites were evaluated based on gas chromatography–mass spectrometry together with multivariate statistical analyses [principal component analysis, partial least squares discriminant analysis, and orthogonal PLS-DA].
Results: The modified metabolites (variable importance in the projection (VIP) >1 and p<0.05) revealed that Mn-doped ZnS QDs exposure disturbed glycolysis, tricarboxylic acid cycle, ketoplasia, glutaminolysis, and amino acid and lipid metabolism. The behavior, coefficients of organs, and histological changes were the same as in the control group, and the disturbance of hematology and serum biochemistry was not dose- or time-dependent.
Conclusion: Our study provides a general observation regarding the toxicity and potential metabolic responses of mice exposed to Mn-doped ZnS QDs.
Keywords: Mn-doped ZnS QDs, toxicity, metabolomics, GC-MS, mice
Introduction
ZnS quantum dots (QDs) are IIB–VIA semiconductors and are considered to be good hosts when doped with Mn (3D transition metal ions).1 Depending on their special luminescence property, Mn-doped ZnS QDs have been used for the detection of various substances by different surface modifications, including metal ions [copper(II), Fe(II), manganese(VII), and Pb(II)],2–5 environmental hazards (halobenzoquinones, patulin, florfenicol, and nicosulfuron),6–9 cocaine and its metabolites,10–12 drugs (atropine),13 biological molecules (thrombin,14 serotonin/5-hydroxytryptamine,15 dopamine,16 xanthine oxidase,17 prostate-specific antigen,18 glycoproteins19 and DNA20), and cancer cells.21 The widespread use of Mn-doped ZnS QDs has raised many toxicological concerns.
Kuznetsova et al, reported that Mn-doped ZnS QDs modified by opposite ligand enantiomers had identical optical properties, but different cytotoxicity, where
The metabolome is the final downstream product of the genome, transcriptome, and proteome.25 Metabolomics is the study of the composition and variation of metabolic groups, and can reveal the overall metabolic response and dynamic changes induced by a variety of internal and external factors.26 Metabolomics profiles have shown that QDs functionalized with the antimicrobial peptide indolicidin induced gradual accumulation of reactive oxygen species and decreased antioxidant capacity over three generations of Daphnia magna.27 Non-targeted metabolomic analysis has been suggested as an unbiased tool for environmental risk assessment and underlying mechanisms research.28 After exposure to CdTe-QDs, estrogenic steroids, steroid hormone biosynthesis, lysine biosynthesis, and taurine and hypotaurine metabolism were disturbed according to non-targeted serum metabolomic analysis using 1H-nuclear magnetic resonance.29 Further non-targeted metabolomic investigation is needed to understand the toxicity mechanisms of QDs.
In order to avoid the complication of the absorption phase, we chose intravenous administration of Mn-doped ZnS QDs.30,31 Due to the relatively stable cores of QDs, the elimination of solid inorganic nanoparticles (NPs) is usually slowly.32 We investigated the animal response until 7 days after single intravenous injection. The behavior, body weight, and selected organs were measured and recorded. Blood samples were collected for hematological, serum biochemical, and metabolomics analyses. The histopathological changes were observed using an optical microscope.
Materials and methods
Materials
Mn-doped ZnS QDs were synthesized as described in our previous study.24 The average diameter of Mn-doped ZnS QDs was approximately 3.8 nm according to TEM, and their strong fluorescence centered at 580 nm and the excitation maximum located at 320 nm. Hematoxylin and eosin were obtained from Sigma (St. Louis, MO, USA). Ethanol and formalin were supplied by Sinopharm Chemical Reagent Co. Ltd. (Shanghai, China). Phosphate-buffered saline (PBS) was supplied by Mediatech Inc. (Manassas, VA, USA). Deionized water was prepared by Millipore (Bedford, MA, USA).
Animals and treatment
Male BALB/c mice aged 6–8 weeks (body weight 22–24 g) were supplied by Vital River Laboratory Animal Technology Co. Ltd. (Beijing, China). The animals were housed (4–5/cage) in a controlled environment at 22±1°C and 50–60% humidity with food and water ad libitum, under a 12-hr light–dark cycle. This study and protocol (The pharmacokinetics and toxicity of Mn-doped ZnS QDs with different surface coating in mice) were approved by the Committee of Medical Ethics and Welfare for Experimental Animals of Henan University School of Medicine (Number HUSOM2016-119).
Animals were randomly divided into the following groups of 24: control; low dose (2 mg/kg) Mn-doped ZnS QD; and high dose (20 mg/kg) Mn-doped ZnS QDs. Every eight mice were sacrificed at 1 hr (H), 24 hrs (D), and 7 days (W) after injection, and we designated CH, CD, and CW for the control group; LH, LD, and LW for the low dose Mn-doped ZnS QDs group; and HH, HD, and HW for the high dose Mn-doped ZnS QDs group. The QDs were sterilized by UV irradiation for 30 mins and suspended in PBS before administration via the tail vein. Body weight was measured and blood was collected before the mice were sacrificed by cervical dislocation at 1 hr, 24 hrs, and 7 days.
Coefficients of organs
After death, the tissues and organs, such as heart, liver, spleen, lung, and kidneys, were carefully removed and weighed accurately. The coefficients of organs to body weight were calculated as the ratio of organs (wet weight, mg) to body weight (g).
Hematological analysis
Twenty microliters of fresh blood was diluted and analyzed using the Catalyst Dx biochemical autoanalyzer (IDEXX, USA). The investigated hematological parameters were: red blood cell count , hemoglobin (HGB), hematocrit, mean corpuscular volume, mean corpuscular hemoglobin, mean corpuscular hemoglobin concentration, platelet count (PLT), mean platelet volume (MPV), thrombocrit (PCT), white blood cell count, lymphocyte count (Lym), monocyte count (Mon), neutrophil count (Neu), eosinophil count (Eos), and basophil count (Bas).
Blood biochemical assays
Serum was obtained by centrifugation of ~0.8 mL collected blood at 3000 rpm for 10 mins (H1650-W, Xiangyi, China), and then stored at −20°C until measurement. The typical blood biochemical markers were analyzed by the C501 biochemical autoanalyzer (Roche, Switzerland). The serum levels of alanine aminotransferase (ALT), aspartate aminotransferase (AST), total bilirubin levels (TBIL), alkaline phosphatase (ALP), albumin (ALB), lactate dehydrogenase (LDH), urea (UREA), and creatinine (CREA) were determined.
Histopathological examinations
After weighing, tissue pieces (approximately 0.5×0.5×0.3 cm) were immediately immersed in 10% formalin solution containing neutral PBS. Tissue pieces were dehydrated in concentrated ethanol, cleaned in xylene and finally embedded in paraffin blocks. Five-micrometer sections were cut, stained with hematoxylin and eosin, and observed under an optical microscope (NI-U; Nikon, Japan).
Metabolomics research
Serum metabolites were analyzed by gas chromatography–mass spectrometry (GC–MS). Serum was obtained by centrifugation at 3000 rpm for 10 mins, followed by centrifugation at 4°C and 12 ,000 rpm for 10 mins (5810R; Eppendorf, German), then stored at −80°C until measurement. Thawed serum (20 μL) and 80 μL cold methanol (containing 5 μg/mL
For GC–MS, the derivatized samples were analyzed using an Agilent 7890A GC system coupled to an Agilent 5975C inert MSD system (Agilent Technologies Inc., Santa Clara, CA, USA). We used an OPTIMA® 5 MS Accent fused-silica capillary column (30 m ×0.25 mm ×0.25 μm; Macherey-Nagel, Düren, German). Helium (>99.999%) was used as the carrier gas at a constant flow rate of 1.0 mL/min through the column. The initial oven temperature was held at 60°C for 1 min, ramped to 240°C at a rate of 12°C/min, to 320°C at 40°C/min, and finally held at 320°C for 4 mins. The injection volume was 1 μL in a split ratio of 2:1. The temperatures of injector, transfer line, and electron impact ion source were set to 250°C, 260°C, and 230°C, respectively. The electron ionization energy was 70 eV, data were acquired in a full scan mode (m/z 50–600), and the solvent delay time was set to 5 mins. The QC samples were injected at regular intervals (every 10 samples) throughout the analytical run.
The peak picking, alignment, deconvolution, and further processing of raw GC–MS data were performed as described previously.33 The data were normalized against total peak abundances, and then imported into SIMCA version 14.1 (Umetrics, Umeå, Sweden), where principal component analysis (PCA), partial least squares discriminant analysis (PLS-DA), and orthogonal PLS-DA (OPLS-DA) were performed. For univariate statistical analysis, the normalized data were calculated by the unpaired Student’s t-test in Excel. The altered metabolites were selected based on variable importance in the projection (VIP) values of OPLS-DA model >1 and p-values of the Student’s t-test <0.05, respectively. The structural identification of metabolites was achieved by purified mass spectra automatically matched with an in-house standard library (including retention time and mass spectra), Golm Metabolome Database, and Agilent Fiehn GC/MS Metabolomics RTL Library.
Statistical analysis
All the data are presented as mean ± standard error of mean (S.E.M.). Multiple group comparisons of the means were evaluated by one-way analysis of variance using SPSS 16.0 and p<0.05 was considered statistically significant.
Results
Coefficients of organs
No abnormal behavior, including eating, drinking, or physical activity, was found in mice treated with Mn-doped ZnS QDs. Table 1 shows the body weight and coefficients of lung, liver, spleen, heart, and kidney at 24 hrs and 7 days after injection. Administration of Mn-doped ZnS QDs did not influence body weight at the two doses and time points. Coefficients of lung, heart, or kidney were not influenced by Mn-doped ZnS QDs, while the coefficient of spleen was slightly decreased at 24 hrs (CD: 3.65±0.36 mg/g, LD: 3.16±0.33 mg/g, HD: 3.21±0.21 mg/g) and increased at 7 days in the 20 mg/kg group (CW: 3.55±0.13 mg/g, HW: 4.93±0.71 mg/g). The coefficient of heart was increased at 24 hrs (CD: 7.25±0.14 mg/g, LD: 7.67±0.25 mg/g, HD: 7.85±0.29 mg/g) and 7 days (CW: 6.90±0.30 mg/g, LW: 7.49±0.37 mg/g, HW: 7.11±0.43 mg/g). Neither changes in the spleen nor heart were significant.
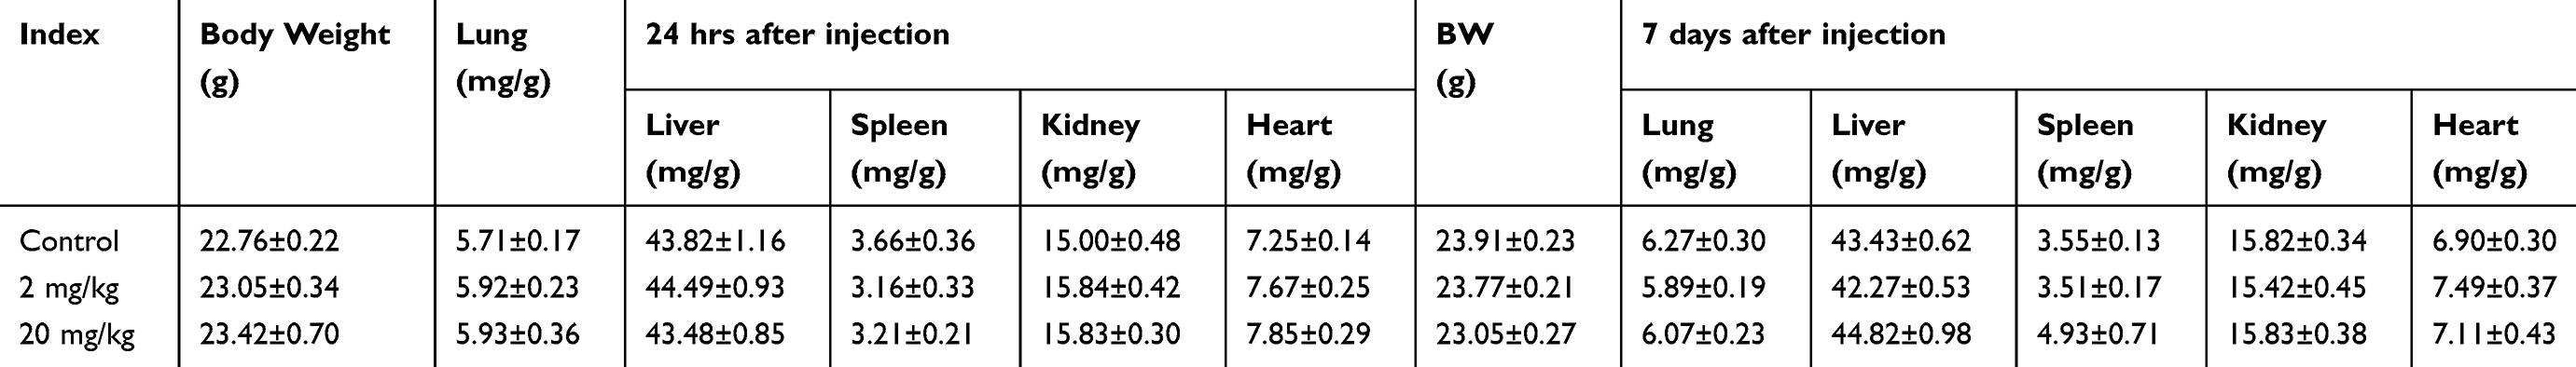 |
Table 1 Coefficients of organs to body weight (BW) of mice at 24 hrs and 7 days after intravenously injected of Mn-doped ZnS QDs |
Hematology, blood biochemistry, and histopathological analysis
Hematology and blood biochemical indicators were analyzed to assess the influence of the Mn-doped ZnS QDs on blood. Representative hematological markers were determined and are shown in Table 2. Mn-doped ZnS QDs at 20 mg/kg increased Neu at 1 hr (CH: 0.69±0.07, HH: 1.14±0.17, p<0.01) and decreased Bas at 1 hr and 7 days (CH: 0.09±0.03, HH: 0.02±0.01, p<0.01; CW: 0.11±0.02, HW: 0.04±0.01, p<0.01). Other hematological markers were comparable to those in the control groups.
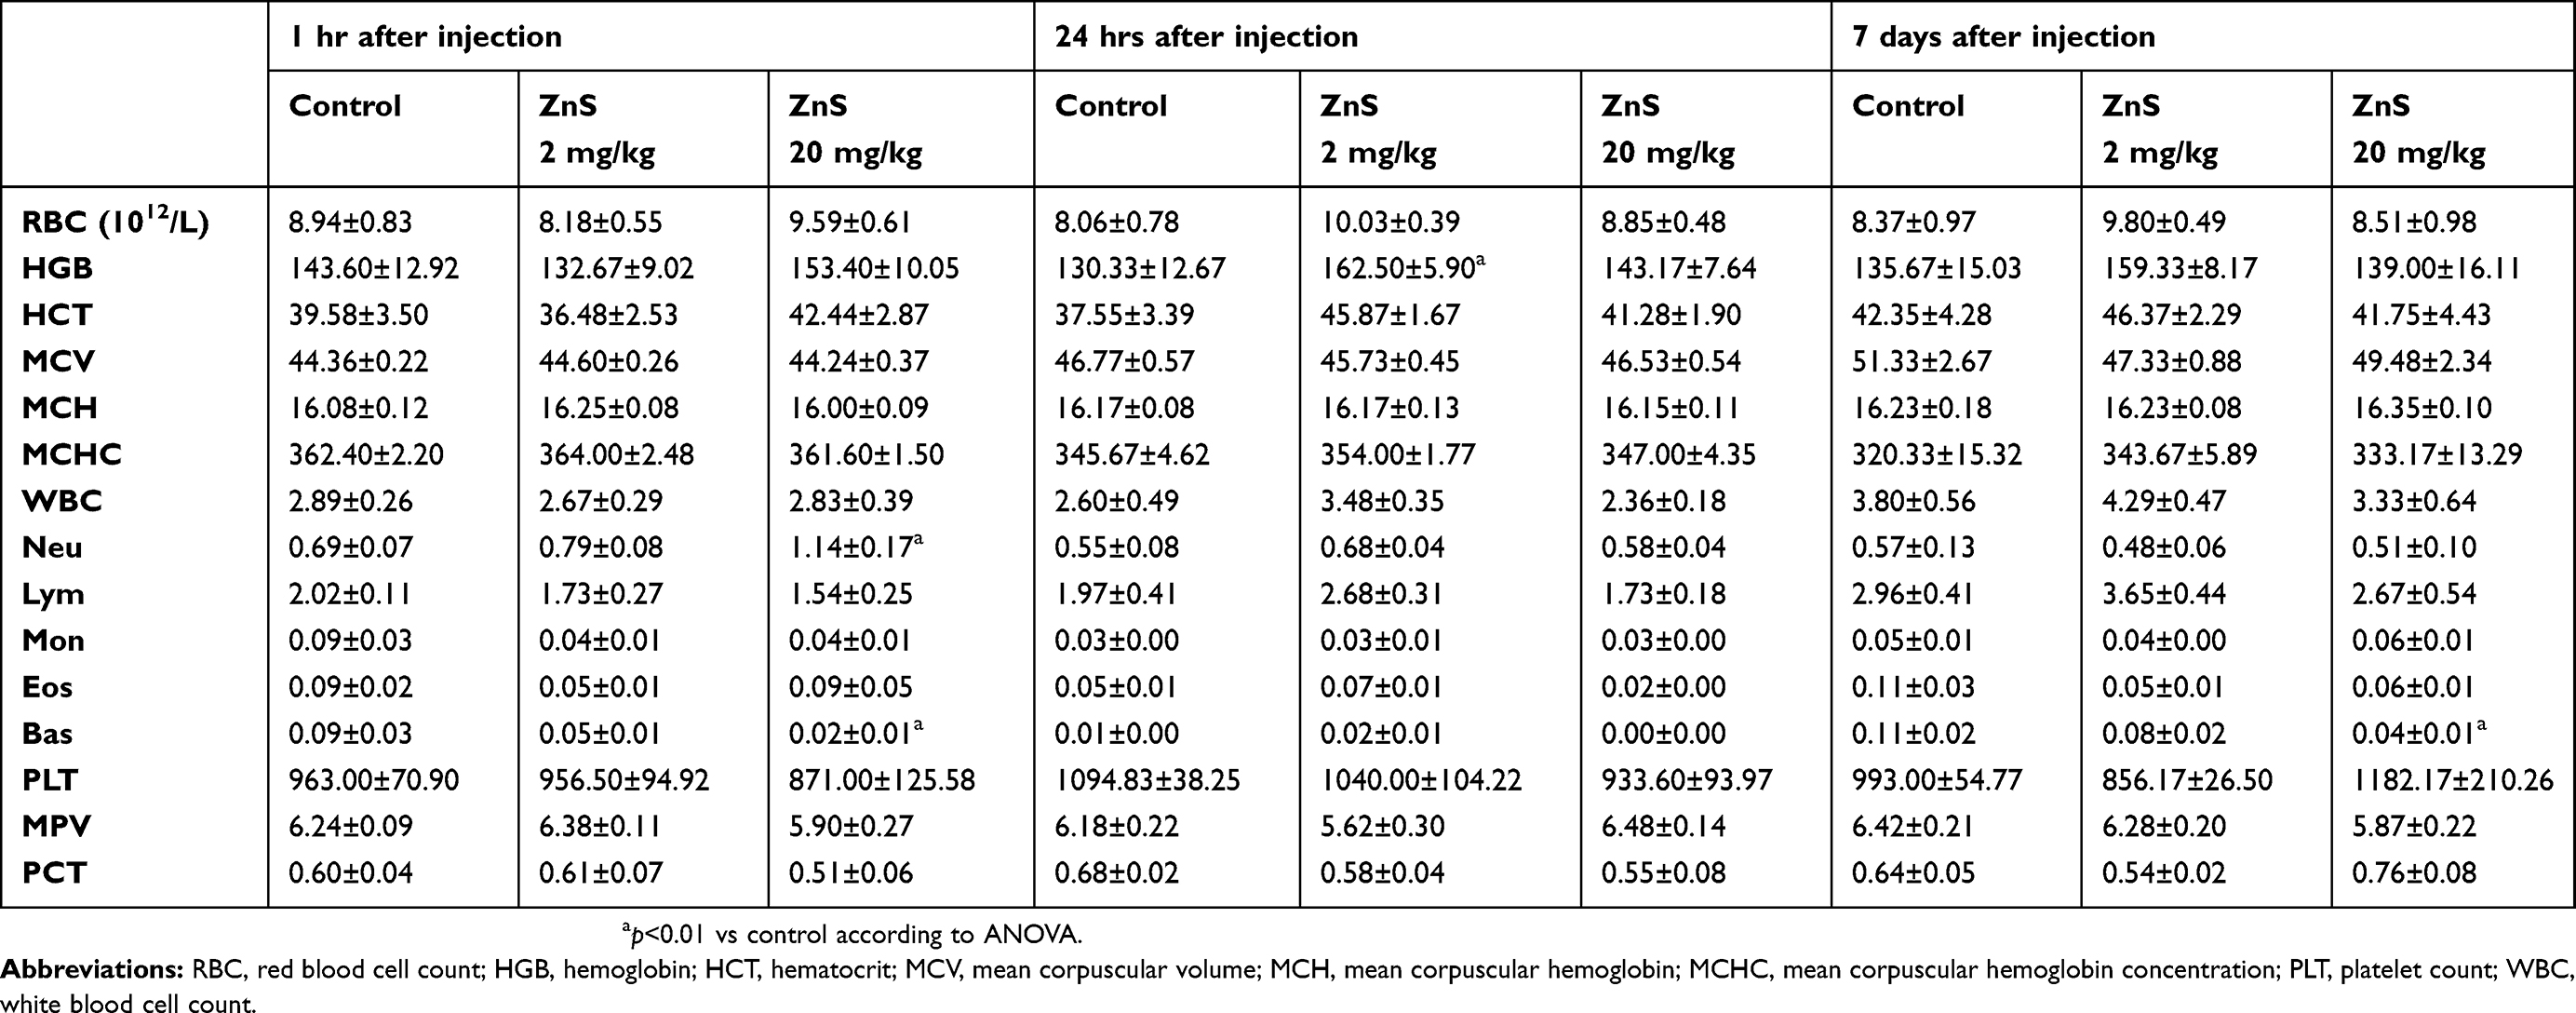 |
Table 2 Relative hematology results after injection of Mn-doped ZnS QDs |
The typical blood biochemical parameters were detected and are shown in Figure 1. Compared with the controls, 20 mg/kg Mn-doped ZnS QDs reduced serum LDH at 1 hr (p<0.01), increased AST at 24 hrs (p<0.01), and increased LDH (p<0.05) and UREA (p<0.001) at 7 days. Moreover, 2 mg/kg Mn-doped ZnS QDs decreased UREA at 24 hrs (p<0.05) and LDH at 1 hr (p<0.05) and 7 days (p<0.05).
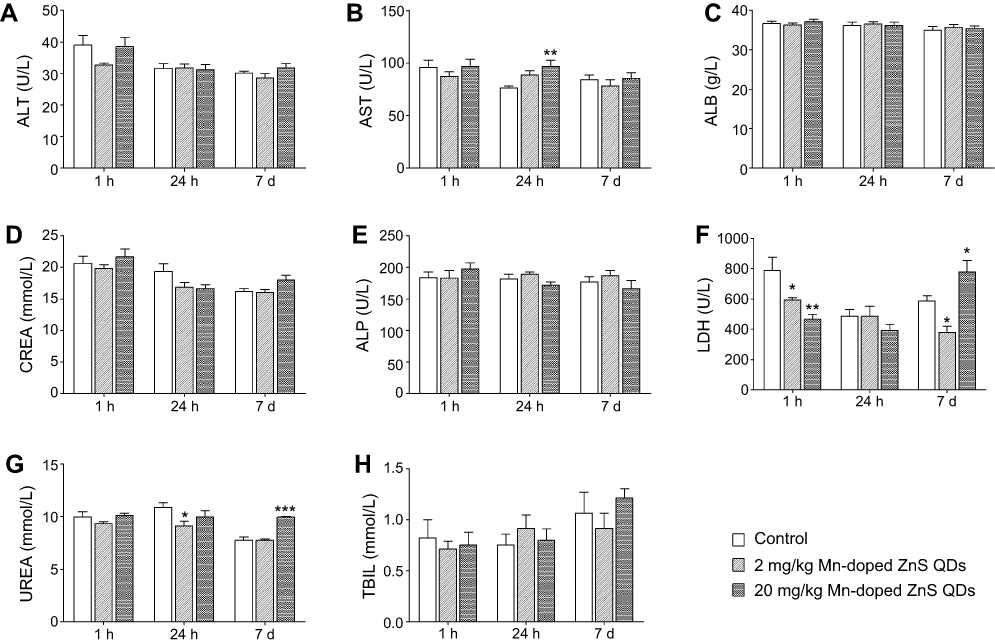 |
Figure 1 Blood biochemical parameters after intravenous injection of Mn-doped ZnS QDs. (A) Alanine aminotransferase, (B) aspartate aminotransferase, (C) albumin, (D) creatinine, (E) alkaline phosphatase, (F) lactate dehydrogenase, (G) urea, and (H) total bilirubin levels. All data are presented as mean S.E.M. (n=6). p<0.05, p<0.01,and p<0.001 vs control according to ANOVA. Abbreviations: QDs, quantum dots; ANOVA, analysis of variance. |
The representative histological results of lung, liver, spleen, heart, and kidney are shown in Figure 2. Intravenous injection of Mn-doped ZnS QDs did not induce obvious histopathological lesions or abnormalities (ie, tissue damage, inflammation, or lesions) at the two doses and time points.
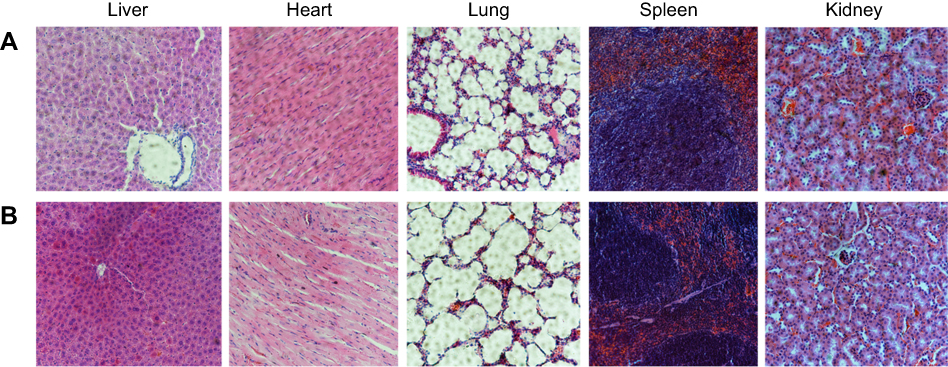 |
Figure 2 Histological analyses of organs after intravenous injection of Mn-doped ZnS QDs at 7 days. (A) control, (B) 20 mg/kg Mn-doped ZnS QDs. Abbreviation: QDs, quantum dots. |
Multivariate analysis of Mn-doped ZnS QDs-treated and control mice
Representative total ion current chromatographs from controls and mice treated with 2 and 20 mg/kg Mn-doped ZnS QDs are shown in Figure S1. QC samples were all together in one place of Figure S2, suggesting favorable reproducibility of the method. The major spectrum can be assigned to specific metabolites by matching with an in-house standard library, Golm Metabolome Database, and Agilent Fiehn GC/MS Metabolomics RTL Library. Unsupervised PCA and supervised PLS-DA were used to analyze the metabolic differences among controls and mice treated with 2 and 20 mg/kg Mn-doped ZnS QDs. In PCA score plots, all samples were located within the 95% confidence interval both at 24 hrs (Figure 3A, 5 PCs, R2X=0.605) and 7 days (Figure 3D, 5 PCs, R2X=0.605), and all of which were used in the following analysis to obtain the maximum information. The PLS-DA score scatter plots are shown in Figure 3B for 24 hrs (2 PCs, R2X=0.242, R2Y=0.630, Q2=0.194) and Figure 3E for 7 days (2 PCs, R2X=0.317, R2Y=0.777, Q2=0.454). In the PLS-DA model, we found obvious separation among controls and mice treated with 2 mg/kg and 20 mg/kg Mn-doped ZnS QDs at 24 hrs and 7 days. Permutation test suggests that the PLS-DA model was not random and overfitting, and it was reliable for explaining and predicting the variations (Figure 3C and F).
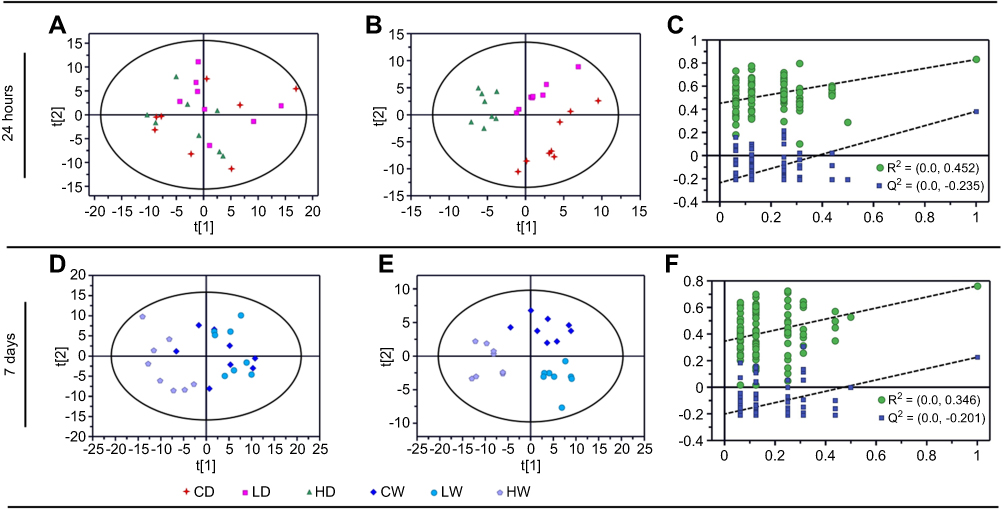 |
Figure 3 Discriminating plots of control and Mn-doped ZnS QDs groups obtained from GC–MS analysis: (A) and (D) score plots of the PCA model, (B) and (E) score plots of the PLS-DA model, (C) and (F) plot of the permutation test (200 times) of the PLS-DA model.Abbreviations: QDS, quantum dots; GC–MS, gas chromatography–mass spectrometry; PCA, principal component analysis; PLS-DA, partial least squares discriminant analysis. |
Multivariate analysis between dose- or time-related Mn-doped ZnS QDs-treated groups and controls
Neither the 2 mg/kg Mn-doped ZnS QDs group (Figure 4A, R2X=0.528) nor the 20 mg/kg Mn-doped ZnS QDs group (Figure 4B, R2X=0.515) was separated from the control group for PCA score plots at 24 hrs. In contrast, good separation was obtained in the PLS-DA model (Figure 4E: 2 PCs, R2X=0.431, R2Y=0.984, Q2=0.817; Figure 4F: 3 PCs, R2X=0.401, R2Y=0.994, Q2=0.798), and the permutation test validated the PLS-DA model was reliable (Figure 4I and J). There were differences between the 2 mg/kg Mn-doped ZnS QDs and control groups, and between the 20 mg/kg Mn-doped ZnS QDs and control groups.
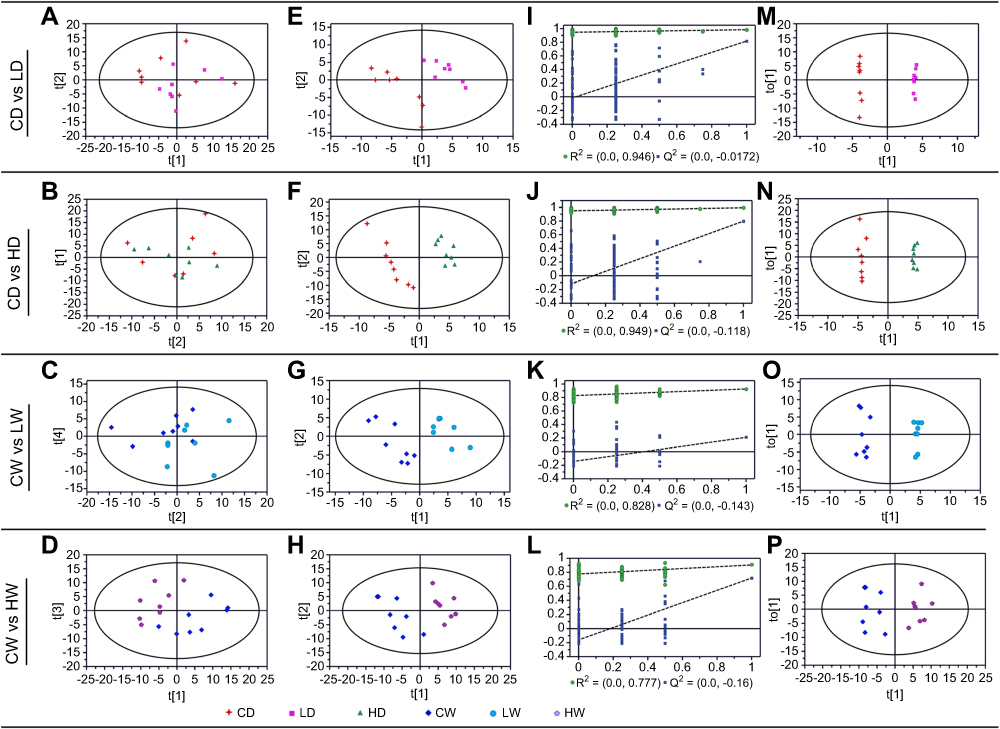 |
Figure 4 Metabolic profiling between different dosage of Mn-doped ZnS QDs and controls at 24 hrs and 7 d. (A–D) score plots of the PCA model, (E–H) score plots of the PLS-DA model, (I–L) plot of the permutation test (200 times) of the PLS-DA model, (M–P) scores plot of the OPLS-DA model. Abbreviations: QDS, quantum dots; PCA, principal component analysis; PLS-DA, partial least squares discriminant analysis; OPLS-DA, orthogonal PLS-DA. |
At 7 days after injection, there was an obvious separation tendency between the 2 mg/kg Mn-doped ZnS QDs and control groups (Figure 4C, R2X=0.600), and clear separation between the 20 mg/kg Mn-doped ZnS QDs and control groups (Figure 4D, R2X=0.593) in the PCA model. PLS-DA score scatter plots showed better separation (Figure 4G: 2 PCs, R2X=0.242, R2Y=0.926, Q2=0.209, Figure 4H: 3 PCs, R2X=0.409, R2Y=0.905, Q2=0.718), suggesting a significant difference between the 2 mg/kg Mn-doped ZnS QDs and control groups, and between the 20 mg/kg Mn-doped ZnS QDs and control groups at 7 days. The reliability of the PLS-DA model was validated using the permutation test and is shown in Figure 4K and L.
To identify the altered metabolites, supervised OPLS-DA was performed (Figure 4M–P). The parameters were 1 PC, R2X=0.578, R2Y=0.999, Q2=0.497 (Figure 4M); 1 PC, R2X=0.401, R2Y=0.994, Q2=0.664 (Figure 4N); 1 PC, R2X=0.488, R2Y=0.984, Q2=0.413 (Figure 4O); and 1 PC, R2X=0.409, R2Y=0.905, Q2=0.763 (Figure 4P), respectively. Significantly changed metabolites were identified based on VIP >1 from the OPLS-DA and p<0.05 from the Student’s t-test (Table 3). There were ten and nine metabolites that were successfully annotated from the 2 and 20 mg/kg Mn-doped ZnS QDs groups, respectively, at 24 hrs, but only 2 metabolites (glycerol-3-phosphate and cholesterol) were changed in both treated groups (Figure 5, Table 3). After 7 days, 14 and 44 metabolites were identified for the 2 and 20 mg/kg Mn-doped ZnS QDs groups, respectively. Decanoic acid, aspartic acid, glutamine, mannitol, methyl palmitate, methyl stearate, serotonin, and 2-palmitoylglycerol were significantly changed in both groups. Treatment with 2 mg/kg Mn-doped ZnS QDs induced changes in three metabolites (ribose, glutamine, and methyl stearate) at 24 hrs and 7 days, while 6 metabolites (glycerol-3-phosphate,
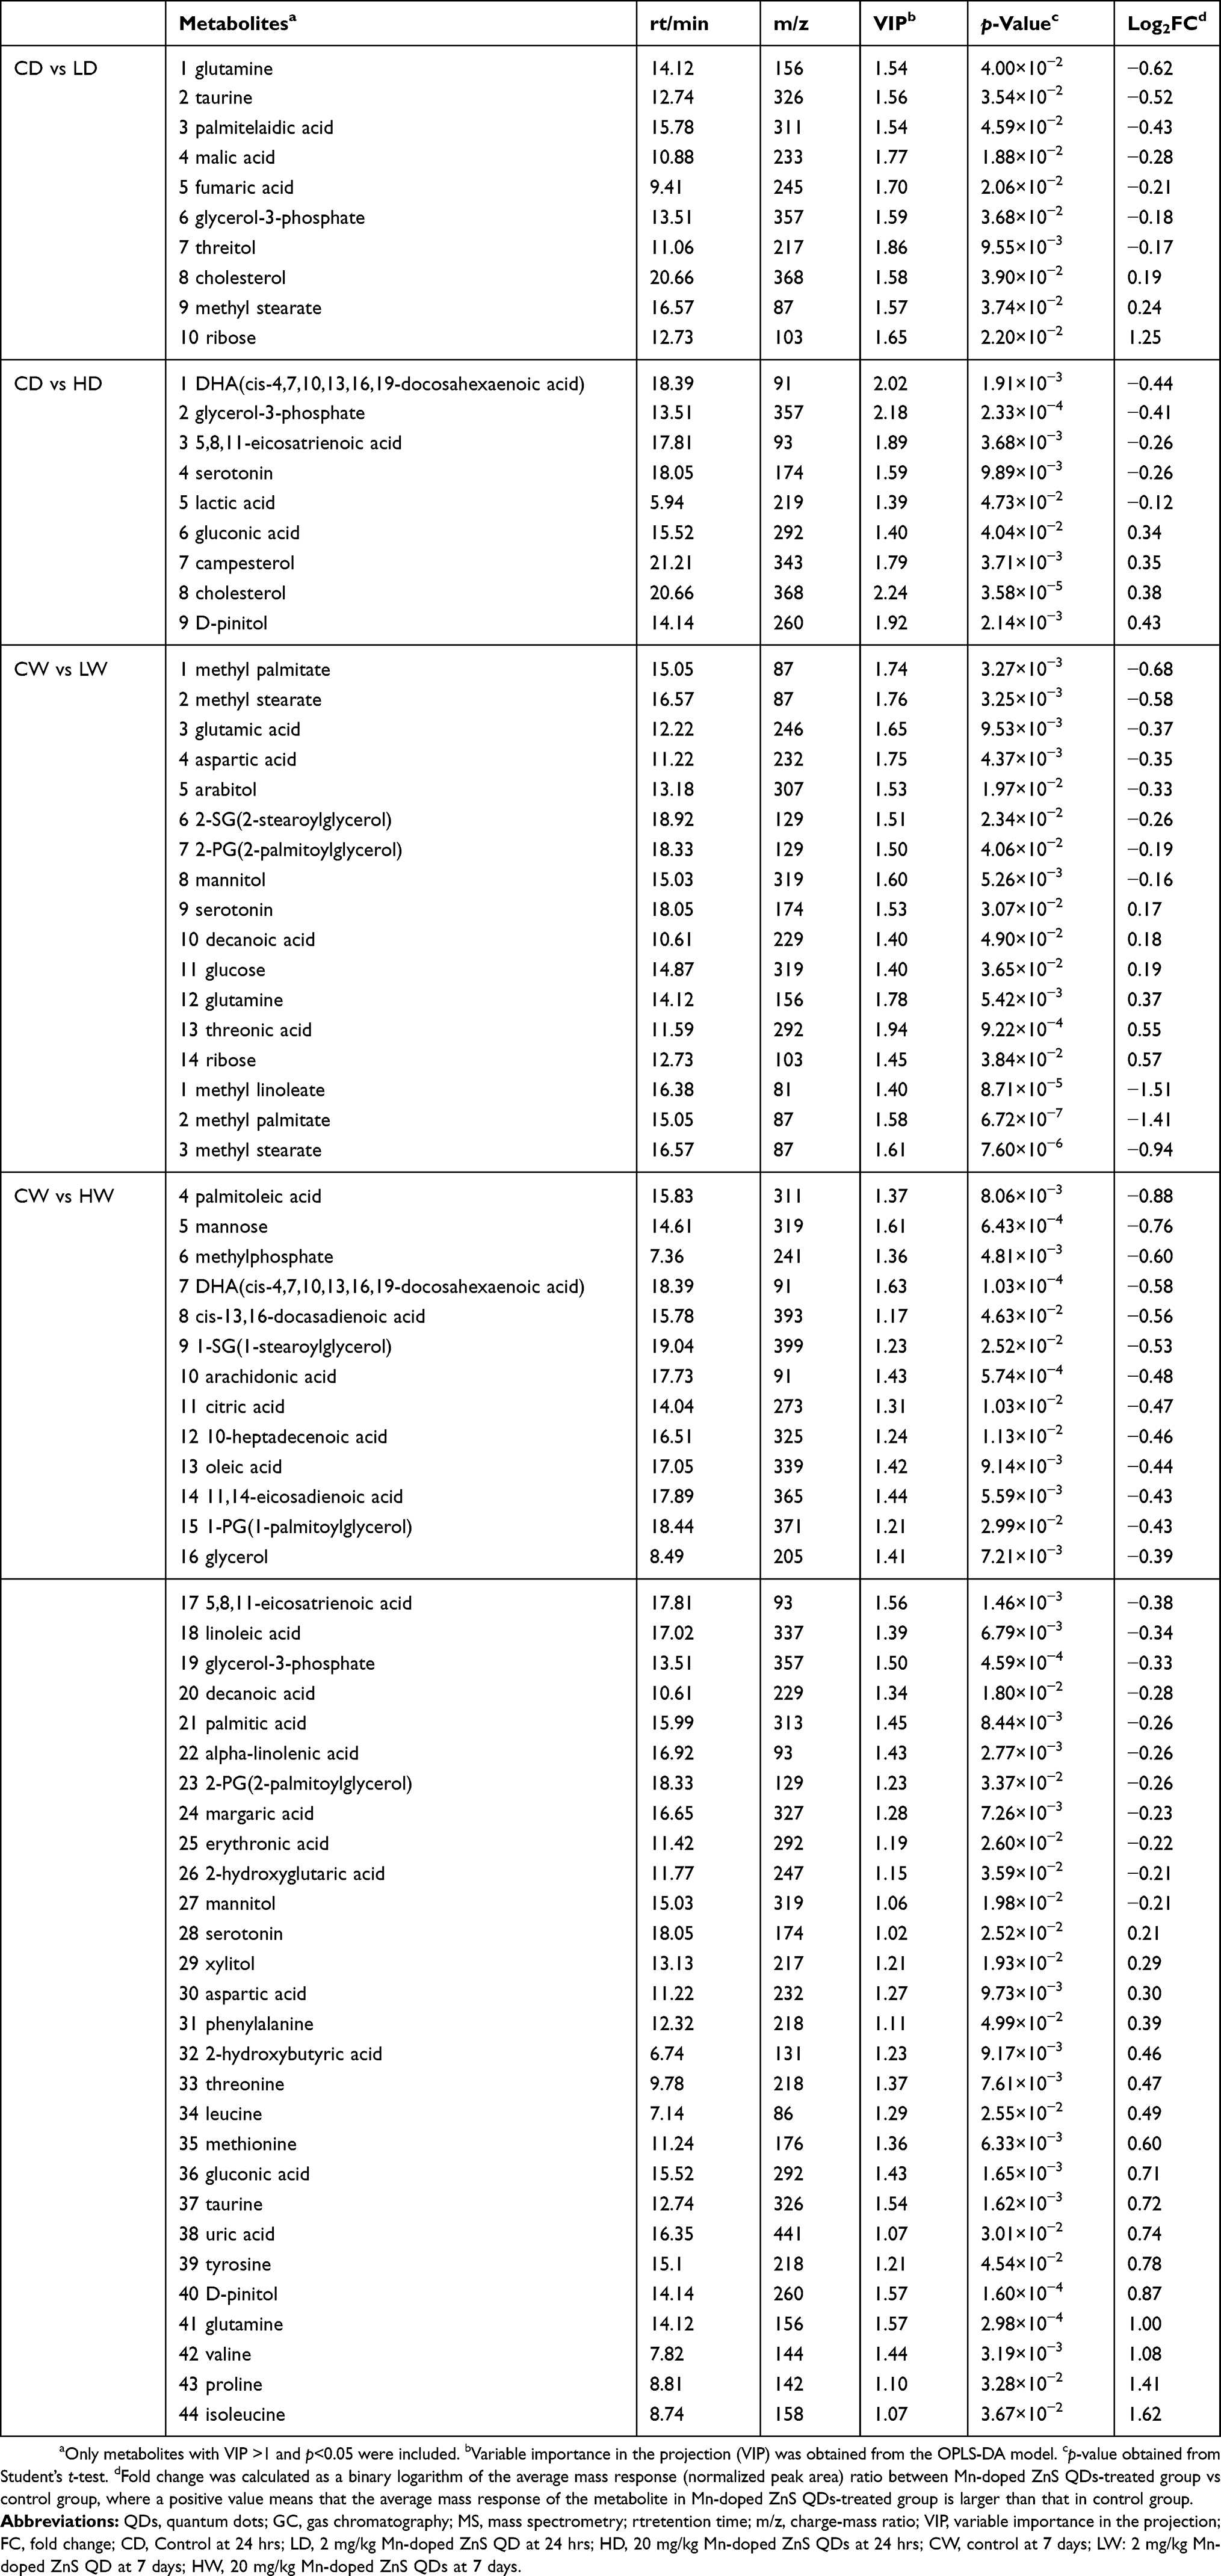 |
Table 3 Significantly changed metabolites found in GC/MS-based metabolomic profiling |
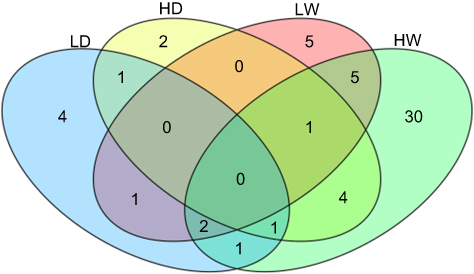 |
Figure 5 Venn diagrams showing the overlap of changed metabolites between different dosage of Mn-doped ZnS QDs and controls at 24 hrs and 7 days.Abbreviations: QDS, quantum dots; LD: 2 mg/kg Mn-doped ZnS QD at 24 hrs; HD, 20 mg/kg Mn-doped ZnS QDs at 24 hrs; LW: 2 mg/kg Mn-doped ZnS QD at 7 days; HW, 20 mg/kg Mn-doped ZnS QDs at 7 days. |
Discussion
Despite widespread research and application of Mn-doped ZnS QDs, their safety remains to be determined. In this study, we assessed the toxicity and metabolic responses of Mn-doped ZnS QDs in mice 1 hr, 24 hrs, and 7 days after intravenous injection. Body weight is an important indicator for qualitatively assessing toxicity,34 but it was not affected by Mn-doped ZnS QDs treatment in our study. The measurement of blood parameters is useful for assessments of physiological, nutritional, and pathological status of vertebrates.35 There had only three hematological parameters (HGB, Neu and Bas) significantly changed in statistics within a small range. The typical biochemical markers related to liver and kidney function were also measured, and no apparent dose- or time-dependent effects were observed in our study. Histological analysis of organs is performed to provide macroscopic and visual evidence of toxicity.34 We found that Mn-doped ZnS QDs did not induce tissue damage, inflammation, or metastatic lesions.
We also investigated whether Mn-doped ZnS QDs induced changes in the level of serum small-molecule metabolites. To explore the possible connections among these metabolites, we constructed a simplified metabolic network map (Figure 6) based on all of the disturbed metabolites and information obtained from the Kyoto Encyclopedia of Genes and Genomes Website (www.genome.jp/kegg/), which could provide an overview of the effects of Mn-doped ZnS QDs at different doses and times. The altered metabolic pathways include glycolysis (glucose and lactate), tricarboxylic acid (TCA) cycle (citrate, malate and fumarate), ketoplasia (β-hydroxybutyrate), glutaminolysis (glutamine and glutamate), amino acid metabolism (aspartate, methionine, leucine, isoleucine, phenylalanine, proline, threonine, tyrosine and valine), and lipid metabolism.
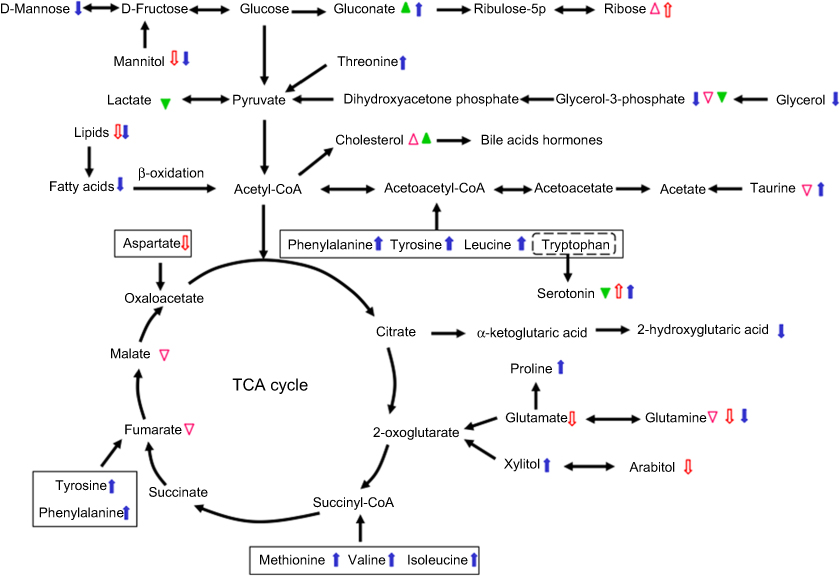 |
Figure 6 Map illustrating the most predominant disturbed metabolic pathway of significantly changed metabolites between different dosage of Mn-doped ZnS QDs and controls at 24 hrs and 7 days. LD: empty triangle, HD: filled triangle, LW: empty arrow and HW: filled arrow. The up shapes represent up-regulation and down shapes represent down-regulation of the metabolites in Mn-doped ZnS QDs-treated mice. Abbreviations: QDS, quantum dots; CoA, coenzyme A; TCA, tricarboxylic acid cycle; LD: 2 mg/kg Mn-doped ZnS QD at 24 hrs; HD, 20 mg/kg Mn-doped ZnS QDs at 24 hrs; LW: 2 mg/kg Mn-doped ZnS QD at 7 days; HW, 20 mg/kg Mn-doped ZnS QDs at 7 days. |
The main pathway of cellular energy production is carbohydrate metabolism, in which carbohydrates are hydrolyzed into glucose or other intermediates that enter the glycolysis pathway and TCA cycle.36 The TCA cycle is a metabolic hub for energy supply.37 In our study, the levels of intermediates of the TCA cycle, including citrate, malate, and fumarate were down-regulated, indicating that the TCA cycle was perturbed by Mn-doped ZnS QDs. According to our previous reports, Mn-doped ZnS QDs enter the mitochondria,24 which may be related to their disturbance of the TCA cycle. The decrease in citrate may be due to Zn2+ release from Mn-doped ZnS QDs, which can inhibit enzyme activity in the TCA cycle.28 TiO2 NPs also reduce intermediates of the TCA cycle, such as α-ketoglutarate, citrate, and succinate.37
An increase in blood glucose level and a decrease in lactate were observed. Lactate is the endpoint product of glycolysis, and its reduction suggested a decrease in anaerobic glycolysis. Glycolysis is also inhibited by impairment of the mitochondrial TCA cycle.37 The results suggest that the energy metabolism was disturbed by the exposure of Mn-doped ZnS QDs.
Glutaminolysis is an alternative source of energy production via the TCA cycle, especially when glycolytic energy production is at a low state. Glutamine can also sustain de novo fatty acid synthesis through decreasing glutamine metabolism. The amino group from glutamine can be used for the biosynthesis of other non-essential amino acids and nucleotides.38 The reduction of serum glutamine in mice treated with Mn-doped ZnS QDs may relate to the result of the increased other amino acids, decreased TCA activity and fatty acid synthesis, where glutamine was utilized as an alternative energy, carbon, or nitrogen source for cells.
Generally, excess amino acids cannot be stored or excreted. Increased levels of amino acids (including aspartate, methionine, leucine, isoleucine, phenylalanine, proline, threonine, tyrosine, and valine) were observed in mice treated with Mn-doped ZnS QDs, indicating that proteins were degraded to amino acids to regulate biological functions such as cholesterol metabolism, inflammatory response, gene transcriptions or cell-cycle progression.39 Branched-chain amino acids (BCAAs, including valine, leucine, and isoleucine) that cannot be synthesized by animals, are considered to be essential amino acids.28 The increased level of BCAAs in our study also reflected an increase in protein digestion. Amino acid production is a general response to toxicant exposure.40 Zhang et al, also detected elevated levels of BCAA after ZnO NPs administration.28 Nano-sized TiO2 and ultra-small superparamagnetic particles of iron oxides were also reported to lead to an increase in amino acids.36,39
Uric acid as the terminal product of purine metabolism41 was increased in mice treated with Mn-doped ZnS QDs. The increased purine metabolism would be due to the induction of oxidative stress concomitant with DNA degradation.
In conclusion, intravenous injection of Mn-doped ZnS QDs had no influence on body weight or coefficients of organs. The changes in hematological parameters and biochemical markers were generally subtle and not in a dose- or time-dependent manner. Histological analysis revealed no tissue damage, inflammation, or lesions. There were 10 and 14 metabolites significantly changed after exposure to 2 mg/kg Mn-doped ZnS QDs for 24 hrs and 7 days, while 9 and 44 metabolites obviously influenced after exposure to 20 mg/kg Mn-doped ZnS QDs for 24 hrs and 7 days. In addition, Mn-doped ZnS QDs disturbed metabolic pathways, including glycolysis, TCA, ketoplasia, glutaminolysis, and amino acid and lipid metabolism. Our study revealed a widespread mechanistic alteration in metabolomics after exposure to Mn-doped ZnS QDs.
Acknowledgments
This study was supported by the research funds from the Key Scientific Research Program for Universities of Henan Province (Grant No. 17A330001), the Key Science and Technology Program of Henan Province in China (Grant No. 182102310593, 192102310080), the National Natural Science Foundation of China (Grant No. 81600974), the Key Science and Technology Program of Kaifeng City in China (Grant No. 1903083, 1903019, 1803034), and the Scientific Research Foundation of Henan University (Grant No. 2015YBZR053).
Disclosure
The authors report no conflicts of interest in this work.
References
1. Touaylia S, Labiadh H. Effect of the exposure to Mn-doped ZnS nanoparticles on biomarkers in the freshwater western mosquitofish Gambusia affinis. Int J Environ Health Res. 2019;29(1):60–70. doi:10.1080/09603123.2018.1508648
2. He L, Bao Z, Zhang K, et al. Ratiometric determination of copper(II) using dually emitting Mn(II)-doped ZnS quantum dots as a fluorescent probe. Microchim Acta. 2018;185(11):511. doi:10.1007/s00604-018-3043-8
3. Jing W, Lu Y, Wang F, He L, Sun J, Liu Y. Time-resolved determination of Fe(II) ions using cysteine-bridged Mn-doped ZnS quantum dots as a phosphorimetric probe. Microchim Acta. 2018;185(6):298. doi:10.1007/s00604-018-2813-7
4. Deng P, Lu L-Q, Cao W-C, Tian X-K. Phosphorescence detection of manganese(VII) based on Mn-doped ZnS quantum dots. Spectrochim Acta A Mol Biomol Spectrosc. 2017;173:578–583. doi:10.1016/j.saa.2016.10.032
5. Chen J, Zhu Y, Zhang Y. Glutathione-capped Mn-doped ZnS quantum dots as a room-temperature phosphorescence sensor for the detection of Pb2+ ions. Spectrochim Acta A Mol Biomol Spectrosc. 2016;164:98–102. doi:10.1016/j.saa.2016.04.014
6. Jiao Z, Zhang P, Chen H, et al. Halobenzoquinone-mediated assembly of amino acid modified Mn-doped ZnS quantum dots for halobenzoquinones detection in drinking water. Anal Chim Acta. 2018;1026:147–154. doi:10.1016/j.aca.2018.04.017
7. Zhang W, Han Y, Chen X, et al. Surface molecularly imprinted polymer capped Mn-doped ZnS quantum dots as a phosphorescent nanosensor for detecting patulin in apple juice. Food Chem. 2017;232:145–154. doi:10.1016/j.fondchem.2017.03.156
8. Sadeghi S, Jahani M, Belador F. The development of a new optical sensor based on the Mn doped ZnS quantum dots modified with the molecularly imprinted polymers for sensitive recognition of florfenicol. Spectrochim Acta A Mol Biomol Spectrosc. 2016;159:83–89. doi:10.1016/j.saa.2016.01.043
9. Ren X, Chen L. Preparation of molecularly imprinted polymer coated quantum dots to detect nicosulfuron in water samples. Anal Bioanal Chem. 2015;407(26):8087–8095. doi:10.1007/s00216-015-8982-x
10. Pilar Chantada-Vazquez M, de-Becerra-Sanchez C, Fernandez-del-Rio A, et al. Development and application of molecularly imprinted polymer-Mn-doped ZnS quantum dot fluorescent optosensing for cocaine screening in oral fluid and serum. Talanta. 2018;181:232–238. doi:10.1016/j.talanta.2018.01.017
11. Pilar Chantada-Vazquez M, Sanchez-Gonzalez J, Pena-Vazquez E, et al. Simple and sensitive molecularly imprinted polymer-Mn-doped ZnS quantum dots based fluorescence probe for cocaine and metabolites determination in urine. Anal Chem. 2016;88(5):2734–2741. doi:10.1021/acs.analchem.5b04250
12. Pilar Chantada-Vazquez M, Sanchez-Gonzalez J, Pena-Vazquez E, et al. Synthesis and characterization of novel molecularly imprinted polymer-coated Mn-doped ZnS quantum dots for specific fluorescent recognition of cocaine. Biosens Bioelectron. 2016;75:213–221. doi:10.1016/j.bios.2015.08.022
13. Abbasifar J, Samadi-Maybodi A. Selective determination of atropine using poly dopamine-coated molecularly imprinted Mn-doped ZnS quantum dots. J Fluoresc. 2016;26(5):1645–1652. doi:10.1007/s10895-016-1853-9
14. Xiong Y, Liang M, Cheng Y, Zou J, Li Y. An “off-on” phosphorescent aptasensor for the detection of thrombin based on PRET. Analyst. 2018;144(1):161–171. doi:10.1039/c8an01571f
15. Wang Z, Zhang Y, Zhang B, Lu X. Mn2+ doped ZnS QDs modified fluorescence sensor based on molecularly imprinted polymer/sol-gel chemistry for detection of serotonin. Talanta. 2018;190:1–8. doi:10.1016/j.talanta.2018.07.065
16. Diaz-Diestra D, Thapa B, Beltran-Huarac J, Weiner BR, Morell G. L-cysteine capped ZnS:mn quantum dots for room-temperature detection of dopamine with high sensitivity and selectivity. Biosens Bioelectron. 2017;87:693–700. doi:10.1016/j.bios.2016.09.022
17. Tang D, Zhang J, Zhou R, et al. Phosphorescent inner filter effect-based sensing of xanthine oxidase and its inhibitors with Mn-doped ZnS quantum dots. Nanoscale. 2018;10(18):8477–8482. doi:10.1039/c8nr01355a
18. Garcia-Cortes M, Teresa Fernandez-Arguelles M, Costa-Fernandez JM, Sanz-Medel A. Sensitive prostate specific antigen quantification using dihydrolipoic acid surface-functionalized phosphorescent quantum dots. Anal Chim Acta. 2017;987:118–126. doi:10.1016/j.aca.2017.08.003
19. Chang L, Wu H, He X, Chen L, Zhang Y. A highly sensitive fluorescent turn-on biosensor for glycoproteins based on boronic acid functional polymer capped Mn-doped ZnS quantum dots. Anal Chim Acta. 2017;995:91–98. doi:10.1016/j.aca.2017.09.037
20. Gong Y, Fan Z. Room-temperature phosphorescence turn-on detection of DNA based on riboflavin-modulated manganese doped zinc sulfide quantum dots. J Fluoresc. 2016;26(2):385–393. doi:10.1007/s10895-015-1699-6
21. Sung Y-M, Gayam SR, Hsieh P-Y, Hsu H-Y, Diau EW-G, Wu S-P. Quinone-modified Mn-doped zns quantum dots for room-temperature phosphorescence sensing of human cancer cells that overexpress NQO1. ACS Appl Mater Interfaces. 2015;7(46):25961–25969. doi:10.1021/acsami.5b09244
22. Kuznetsova VA, Visheratina AK, Ryan A, et al. Enantioselective cytotoxicity of ZnS:Mn quantum dots in A549 cells. Chirality. 2017;29(8):403–408. doi:10.1002/chir.22713
23. Swift BJF, Baneyx F. Microbial uptake, toxicity, and fate of biofabricated ZnS:Mn nanocrystals. PLoS One. 2015;10(4):e0124916. doi:10.1371/journal.pone.0124916
24. Yang Y, Lv S-Y, Yu B, et al. Hepatotoxicity assessment of Mn-doped ZnS quantum dots after repeated administration in mice. Int J Nanomedicine. 2015;10:5787–5796. doi:10.2147/ijn.s88789
25. Lindeque JZ, Matthyser A, Mason S, Louw R, Taute CJF. Metabolomics reveals the depletion of intracellular metabolites in HepG2 cells after treatment with gold nanoparticles. Nanotoxicology. 2018;12(3):251–262. doi:10.1080/17435390.2018.1432779
26. Xie J, Dong W, Liu R, Wang Y, Li Y. Research on the hepatotoxicity mechanism of citrate-modified silver nanoparticles based on metabolomics and proteomics. Nanotoxicology. 2018;12(1):18–31. doi:10.1080/17435390.2017.1415389
27. Falanga A, Mercurio FA, Siciliano A, et al. Metabolomic and oxidative effects of quantum dots-indolicidin on three generations of Daphnia magna. Aquat Toxicol. 2018;198:158–164. doi:10.1016/j.aquatox.2018.03.001
28. Zhang W, Zhao Y, Li F, et al. Zinc oxide nanoparticle caused plasma metabolomic perturbations correlate with hepatic steatosis. Front Pharmacol. 2018;9:57. doi:10.3389/fphar.2018.00057
29. Khoshkam M, Baghdadchi Y, Arezumand R, Ramazani A. Synthesis, characterization and in vivo evaluation of cadmium telluride quantum dots toxicity in mice by toxicometabolomics approach. Toxicol Mech Methods. 2018;28(7):539–546. doi:10.1080/15376516.2018.1471635
30. Lee JH, Gulumian M, Faustman EM, Workman T, Jeon K, Yu IJ. Blood biochemical and hematological study after subacute intravenous injection of gold and silver nanoparticles and coadministered gold and silver nanoparticles of similar sizes. Biomed Res Int. 2018;2018:8460910. doi:10.1155/2018/8460910
31. Yang RH, Chang LW, Wu J-P, et al. Persistent tissue kinetics and redistribution of nanoparticles, quantum dot 705, in mice: ICP-MS quantitative assessment. Environ Health Perspect. 2007;115(9):1339–1343. doi:10.1289/ehp.10290
32. Yaghini E, Turner H, Pilling A, Naasani I, MacRobert AJ. In vivo biodistribution and toxicology studies of cadmium-free indium-based quantum dot nanoparticles in a rat model. Nanomedicine. 2018;14(8):2644–2655. doi:10.1016/j.nano.2018.07.009
33. Gao X, Pujos-Guillot E, Sébédio JL. Development of a quantitative metabolomic approach to study clinical human fecal water metabolome based on trimethylsilylation derivatization and GC/MS analysis. Anal Chem. 2010;82(15):6447–6456. doi:10.1021/ac1006552
34. Su Y, Peng F, Jiang Z, et al. In vivo distribution, pharmacokinetics, and toxicity of aqueous synthesized cadmium-containing quantum dots. Biomaterials. 2011;32(25):5855–5862. doi:10.1016/j.biomaterials.2011.04.063
35. Ugbogu EA, Ude VC, Elekwa I, Arunsi UO, Uche-Ikonne C, Nwakanma C. Toxicological profile of the aqueous-fermented extract of Musa paradisiaca in rats. Avicenna J Phytomed. 2018;8(6):478–487.
36. Zhang Z, Liang ZC, Zhang JH, et al. Nano-sized TiO2 (nTiO(2)) induces metabolic perturbations in physarum polycephalum macroplasmodium to counter oxidative stress under dark conditions. Ecotoxicol Environ Saf. 2018;154:108–117. doi:10.1016/j.ecoenv.2018.02.012
37. Jin C, Liu Y, Sun L, et al. Metabolic profiling reveals disorder of carbohydrate metabolism in mouse fibroblast cells induced by titanium dioxide nanoparticles. J Appl Toxicol. 2013;33(12):1442–1450. doi:10.1002/jat.2808
38. Jin H, Qiao F, Chen L, Lu C, Xu L, Gao X. Serum metabolomic signatures of lymph node metastasis of esophageal squamous cell carcinoma. J Proteome Res. 2014;13(9):4091–4103. doi:10.1021/pr500483z
39. Feng J, Liu H, Zhang L, Bhakoo K, Lu L. An insight into the metabolic responses of ultra-small superparamagnetic particles of iron oxide using metabonomic analysis of biofluids. Nanotechnology. 2010;21(39):395101. doi:10.1088/0957-4484/21/39/395101
40. Zhang B, Zhang H, Du C, et al. Metabolic responses of the growing Daphnia similis to chronic AgNPs exposure as revealed by GC-Q-TOF/MS and LC-Q-TOF/MS. Water Res. 2017;114:135–143. doi:10.1016/j.watres.2017.02.046
41. Hadrup N, Lam HR, Loeschner K, Mortensen A, Larsen EH, Frandsen H. Nanoparticulate silver increases uric acid and allantoin excretion in rats, as identified by metabolomics. J Appl Toxicol. 2012;32(11):929–933. doi:10.1002/jat.2779
Supplementary materials
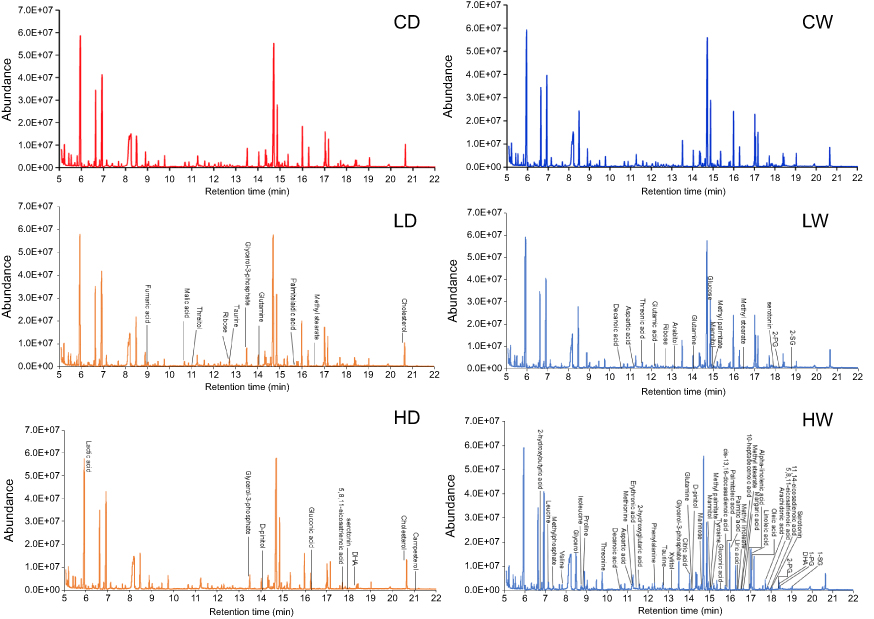 |
Figure S1 Representative total ion current (TIC) chromatographs from control, 2 and 20 mg/kg Mn-doped ZnS QDs-treated groups. Abbreviation: QDs, quantum dots. |
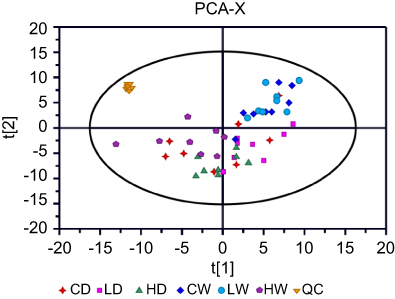 |
Figure S2 Score plots of the PCA model of all serum samples and QC samples. The parameters of PCA were 8 PC, R2X=0.709. QC samples were all together in one place, suggesting favorable reproducibility of the method. Abbreviations: PCA, principal component analysis; QC, quality control. |
 © 2019 The Author(s). This work is published and licensed by Dove Medical Press Limited. The full terms of this license are available at https://www.dovepress.com/terms.php and incorporate the Creative Commons Attribution - Non Commercial (unported, v3.0) License.
By accessing the work you hereby accept the Terms. Non-commercial uses of the work are permitted without any further permission from Dove Medical Press Limited, provided the work is properly attributed. For permission for commercial use of this work, please see paragraphs 4.2 and 5 of our Terms.
© 2019 The Author(s). This work is published and licensed by Dove Medical Press Limited. The full terms of this license are available at https://www.dovepress.com/terms.php and incorporate the Creative Commons Attribution - Non Commercial (unported, v3.0) License.
By accessing the work you hereby accept the Terms. Non-commercial uses of the work are permitted without any further permission from Dove Medical Press Limited, provided the work is properly attributed. For permission for commercial use of this work, please see paragraphs 4.2 and 5 of our Terms.