")
Back to Journals » Therapeutics and Clinical Risk Management » Volume 17
To Find Out the Relationship Between Levels of Glycosylated Hemoglobin with Meibomian Gland Dysfunction in Patients with Type 2 Diabetes
Authors Fan F, Li X, Li K, Jia Z
Received 11 June 2021
Accepted for publication 21 July 2021
Published 6 August 2021 Volume 2021:17 Pages 797—807
DOI https://doi.org/10.2147/TCRM.S324423
Checked for plagiarism Yes
Review by Single anonymous peer review
Peer reviewer comments 2
Editor who approved publication: Dr Deyun Wang
Fang Fan,1 Xiaodan Li,2 Kejun Li,1 Zhiyang Jia1
1Department of Ophthalmology, Hebei General Hospital, Shijiazhuang, 050051, People’s Republic of China; 2Department of Ophthalmology, Shijiazhuang People’s Hospital, Shijiazhuang, 050000, People’s Republic of China
Correspondence: Zhiyang Jia
Department of Ophthalmology, Hebei General Hospital, No. 348 Hepingxi Road, Xinhua District, Shijiazhuang, Hebei, 050051, People’s Republic of China
Tel +86-13933120759
Email [email protected]
Aim: The aim of this study was to investigate the relationship between levels of glycosylated hemoglobin (HbA1c) with meibomian gland dysfunction (MGD) in patients with type 2 diabetes mellitus (T2DM) and to further explore the related influencing factors.
Methods: Totally, 167 patients with T2DM and 68 non-diabetic subjects were selected. Further, T2DM patients were divided into 2 groups based on 7% HbA1c. Standard patient evaluation of eye dryness (SPEED), lipid layer thickness (LLT), partial blink (PB) ratio, percentage of partial glands (MGP), meibomian gland yielding liquid secretion (MGYLS), meibomian gland yielding secretion score (MGYSS), line of marx (LOM), tear break up time (TBUT), tear meniscus height (TMH) and Schirmer I test (SIT) were applied to evaluate meibomian gland function. Finally, the correlation between HbA1c and various indicators was also analyzed.
Results: Between HbA1c≥ 7% group and HbA1c< 7% group, the differences in LLT (P=0.003), MGP (P< 0.001), MGYLS (P=0.014) and TBUT (P=0.015) were all statistically significant. Compared with the non-diabetic group, LLT (P=0.020), MBP (P< 0.001), MGYS (P< 0.001), TBUT (P< 0.001), SIT (P=0.001), TMH (P=0.017) and LOM (P< 0.001) were significantly different in HbA1c≥ 7% group, while the differences of MBP (P=0.031), MGYSS (P< 0.001), SIT (P=0.001) and LOM (P< 0.001) in HbA1c≤ 7% group were statistically significant. Besides, the prevalence of MGD in HbA1c≥ 7% group was evidently higher than that in non-diabetic group (P=0.002). Correlation analysis showed that HbA1c was significantly associated with the LTT and MGP.
Conclusion: HbA1c≥ 7% is likely to result in meibomian gland function dysfunctions in T2DM patients, especially related to LLT and MGP.
Keywords: diabetes mellitus, type 2 diabetes mellitus, glycosylated hemoglobin, lipid layer thickness, percentage of partial glands
Introduction
Diabetes mellitus (DM) is a chronic metabolic disease characterized by hyperglycemia and caused by multiple causes. It can lead to neuropathy, nephropathy, microvascular disease and other complications, and is a major cause of death and social and economic burden worldwide.1,2 According to reports, the number of patients worldwide is expected to increase to 366 million by 2030, of which type 2 diabetes mellitus (T2DM) accounts for more than 90%.3,4 As the incidence of DM is increasing year by year, ocular complications related to diabetes have gradually attracted the attention of ophthalmologists, and ocular surface lesions caused by diabetes have become a new hot spot in ophthalmology research.5–7 Additionally, diabetes is one of the leading causes of blindness worldwide.8
As we all know, T2DM and its complications are the main causes of mortality and morbidity, and patients with T2DM are more prone to abnormal tear film stability9 The tear film is composed of a lipid layer, a water-like layer and a mucin layer from the outside to the inside. Among them, lipids are secreted by the largest sebaceous gland in the human body-meibomian glands, and the lipids secreted play an important role in the formation of the surface tension of the tear film, the stability of the tear film, and the prevention of tear evaporation. Therefore, the abnormalities and dysfunction of the meibomian glands are likely to cause ocular surface diseases, and in severe cases, it may damage the cornea and affect visual function.10 Previously, it had confirmed that the morphological changes and dysfunction of the meibomian glands in diabetic patients are more pronounced than those in non-diabetic patients 11 At present, a large number of studies have discussed the relationship between diabetes and ocular surface abnormalities, for example, diabetic ocular surface abnormalities are related to punctate keratitis on the surface, abnormal corneal function and the severity of diabetic retinopathy.12 Besides, data has also shown that dry eye in diabetic patients is related to the course of diabetes and the degree of blood sugar control2 Lyu and Baek et al conducted research on tear film function with 7.8% glycosylated hemoglobin (HbA1c) as the boundary.13,14 However, there are few reports on the study of meibomian gland function based on the HbA1c level of T2DM patients.
According to the 2018 American Diabetes Association (ADA) criteria for the diagnosis and treatment of T2DM, a reasonable HbA1c control index for adults is<7% 15 Therefore, in this study, T2DM patients with different HbA1c levels were grouped, and differences in meibomian gland function were analyzed through different indicators, and correlation analysis was also conducted on related ocular surface parameters. This will provide a strong basis for the early clinical diagnosis of T2DM with meibomian gland dysfunction (MGD).
Patients and Methods
Experimental Design
A total of 167 patients with T2DM diagnosed in the Hebei Provincial People’s Hospital from May 2018 to December 2018 and 68 non-diabetic subjects recruited during the same period were selected as the study subjects. Among them, there are 107 T2DM patients with HbA1c≥7%, 62 males and 45 females; 60 T2DM patients with HbA1c<7%, 36 males and 24 females. The mean patient age was 57.79±11.14 (range from 20 to 80 years old). This study was approved by the ethics committee of our Hospital and consistent with the Declaration of Helsinki. Written informed consent was obtained from each patient. All evaluations were performed by the same ophthalmologist.
The sample size of this study was estimated based on previous studies. Currently, related studies on MGD in Asia have reported that the incidence of MGD is 40–68%,16–19 and is based on the hypothesis that the incidence of MGD is high in patients with type 2 diabetes.11 Therefore, with a significance level of 0.05 and 80% power (α=0.05; β=0.1), a sample size of at least 60 patients will be required for each group. Patients are not involved in the problem of lost follow-up, and additional sample size is not required. A total of 180 eligible participants are therefore planned assuming.
The inclusion criteria were: 1) Age 20–80 years old, no gender limit; 2) According to the 1999 World Health Organization and ADA standards on diabetes, patients diagnosed with T2DM 15 3) No diabetic retinopathy. The exclusion criteria were: 1) A recent history of topical or systemic use of medications; 2) A recent history of wearing contact lenses; 3) Eye surface abnormalities, including history of eye allergy, eye acute inflammatory reaction, heat burn, radiation injury, etc; 4) Eyelid abnormalities, such as entropion, ectropion, eyelid tumor, eyelid edema, eyelid spasm, etc; 5) Autoimmune system diseases and diseases affecting tear film function testing; 6) A history of head nerve injury; 7) Unable to complete related inspections.
Standard Patient Evaluation of Eye Dryness (SPEED)
The SPEED questionnaire was used to evaluate and quantify the symptoms of patients. All subjects completed the SPEED questionnaire under the guidance of the same physician, which rated the frequency and severity of dry eye symptoms, respectively. Symptoms of dry eye are to ask patients whether they have “dry eyes or foreign body sensation,” “eye pain or soreness,” “eyes feel burning or watery eyes,” and “eye fatigue.” The frequency of dry eye symptoms was graded from 0 to 3, which were “never”, “some of the time”, “most of the time” and “all of the time”, with scores of 0, 1, 2 and 3, respectively. The severity of dry eye symptoms was rated from 0 to 4, with scores of 0, 1, 2, 3 and 4, respectively, as “not having any effect”, “temporarily tolerable”, “uncomfortable and not affecting daily life”, “tingling and affecting daily life” and “not functioning normally”. The total score of dry eye symptoms was calculated with a score of 0–28 points. The criteria were: asymptomatic (total score=0), mild to moderate symptoms (total score=1–9), and severe symptoms (total score≥10 points).20,21
Measurement of Lipid Layer Thickness (LLT) and Partial Blink (PB) Ratio by Ocular Surface Interferometer Lipiview
The lower jaw and forehead are placed on the head frame of the instrument, so that the outer canthus of the eyes and the scale line on the instrument are at the same level.
During the examination process (about 20 s), there are flashing light sources on both sides and patients were instructed to look at the indicator point in front and blink normally to adjust the focus. When the reflection of the lower eyelid eyelash is clear (if there is no lower eyelid eyelash, the tear film image is clear as the judgment standard), the image is captured and stored. The results are judged as follows: ICU value represents the amount of grease distribution, the thicker the better and the unit of measurement is 1nm. Confidence factor (CF) represents the quality of the measured data. To ensure the accuracy of the data, it needs to be re-measured when CF<0.8. The normal value of LLT is≥100nm, the probability of MGD occurring at 60–100nm is 50%, and the probability of MGD occurring at≤60 nm is 90%. PB ratio≥40% is regard as abnormal22 (Figure 1).
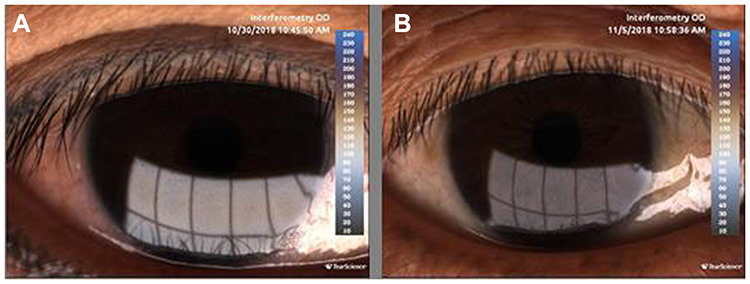 |
Figure 1 The LLT were performed by Lipiview® ocular surface interferometry. (A) Avg LLT=100 nm; (B) Avg LLT=43 nm. Abbreviation: LLT, lipid layer thickness. |
Measurement of Percentage of Partial Glands (MGP)
Briefly, the meibomian gland photography was used to observe the morphology of the upper and lower meibomian glands of subjects respectively. The images were captured and stored, and the Image J software was used to semi-automatically analyze the missing area and the total area of the meibomian glands. The percentage of the missing area of the meibomian glands in the total area of the meibomian glands was named MGP, and the average value was calculated by repeated measurements three times (Figure 2).
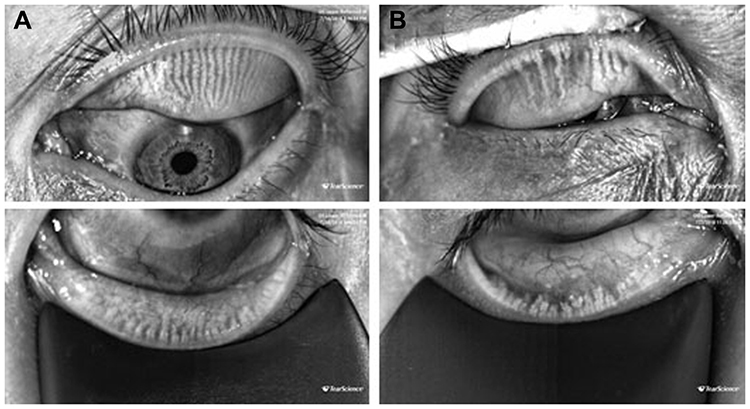 |
Figure 2 Meibography of the upper eyelids and lower eye lids were performed by Lipiview® ocular surface interferometry. (A) MGP=0%; (B) MGP= 90%. MGP, percentage of partial glands. |
Measurement of Meibomian Gland Yielding Liquid Secretion (MGYLS) and Meibomian Gland Yielding Secretion Score (MGYSS)
First, the palpebral edge of the examined eye was wiped with a sterile cotton swab under a slit lamp, and the meibomian glands on the nasal side, middle side and temporal side of the lower eyelid was calculated by meibomian gland evaluator (MGE) under constant pressure. The pressure position should be 1–2mm below the eyelid margin. Meanwhile, the eyelid margin is partially turned out from the inside to the outside so that MGYLs can be clearly seen. Observe and record the number of 15 MGYLS. Then the pressure was continued for 10 to 15 s, and the color and character of the grease secreted from each opening in 3 locations (nasal, middle and temporal) were recorded and evaluated. The scoring criteria are as follows: liquid clear grease, 3 points; Sticky white or light yellow grease, 2 points; Concentrated toothpaste-like grease, 1 point; No oil secretion of any character, 0 points. MGYLS≤6 or MGYSS≤18 indicated the dysfunction of the meibomian glands to secrete clear grease23 (Figure 3).
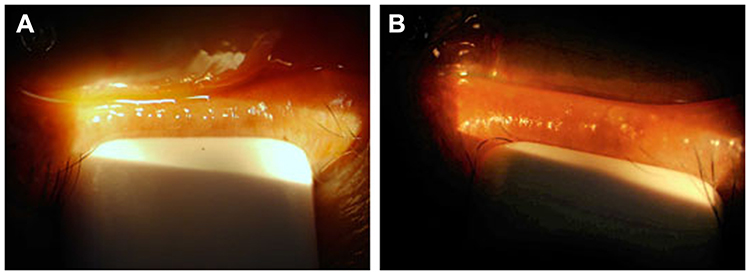 |
Figure 3 The meibomian gland yielding secretion was assessed by MGE. (A) Meibomian gland secretions are clear oils; (B) The opening of the meibomian glands is blocked. Abbreviation: MGE, meibomian gland evaluator. |
Evaluation of Line of Marx (LOM) Position
The relative relationship between the position of LOM and the opening of the meibomian glands is divided into four grades. Grade 0, The entire LOM is completely behind the meibomian gland opening; Grade 1, part of the LOM touches the meibomian gland opening; Grade 2, LOM passes through the meibomian gland opening; Grade 3, LOM is in front of the meibomian gland opening; The higher the grade, the worse it is.
Tear Break Up Time (TBUT)
TBUT were detected after instillation of 2 µL of 1% fluorescein solution into the cornea using a micropipette and observed by a cobalt blue filter (Chongqing Kanghua Ruiming Technology Co., Ltd., China). TBUT was recorded from the moment when the patient opened his eyes and continued observation until the first black spot (tear film defect) appeared on the cornea. TBUT was measured for three consecutive times in each eye and the mean value was recorded. A TBUT value less than 10 s was accepted as “abnormal”.
Tear Meniscus Height (TMH)
Optical Coherence Tomography (OCT) (Visante 1000, Zeiss) was used to evaluate the TMH. Keep the eyes on the target light ahead and adjust the fixation angle so that the visual axis is consistent with the optical axis. The scanning line was adjusted perpendicular to the lacrimal river below the center of the cornea. When a highly reflective light marking the center of the cornea appears on the screen, the subjects were asked to blink their eyes. After the image was stable, the image were captured and stored immediately. Measurement tools were used to measure the height of the river of tears below the three images respectively, and the average value was recorded. TMH is the straight-line distance between the two ends of the lacrimal river boundary (the height of the lower eyelid lacrimal river is the distance from the corneal starting point of the lower eyelid lacrimal river to the palpebral border), and the distance≤0.35 mm is diagnosed as “dry eye” (Figure 4).
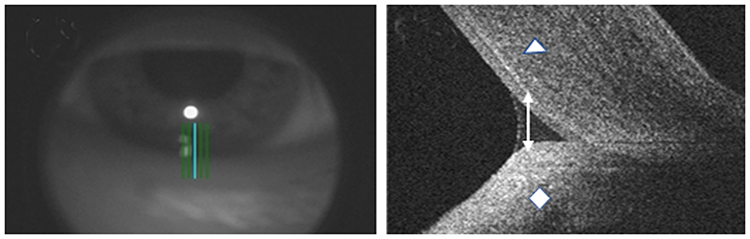 |
Figure 4 The anterior segment of OCT was used to scan the lower tear meniscus. ◇ indicated lower eyelid; Δ indicated cornea; Two-way arrows indicated the TMH. Abbreviation: TMH, tear meniscus height. |
Schirmer Test I (SIT)
In SIT, a 35 mm×5 mm strip of filter paper (Tianjin Jingming New Technology Development Co., Ltd., China) was used to measure the amount of tears produced over a period of 5 min under ambient light. The strip was placed at the junction of the middle and lateral thirds of the lower eyelid without anesthetic eye drops. The eyes of the patient remained closed throughout the test and the wetting values less than 5mm was accepted as “dry eye”.
Statistical Analysis
SPSS 21.0 (SPSS Inc, USA) was applied to analyze all data. Kolmogorov–Smirnov test was used to verify the normality of each indicator. The indicators conforming to the normal distribution were represented by mean ± standard deviation, while those with non-normal distribution or uneven variance were represented by the median and interquartile range (IQR). The Kruskal–Wallis H-test was used for comparison between multiple groups. The prevalence of MGD was tested by Pearson’s chi-square test, and the Bonferroni correction was used for pairwise comparison. The correlation between the indicators used Spearman rank correlation analysis. Values of P<0.05 were considered statistically significant.
Result
Demographic and Clinical Characteristics
Totally, 238 subjects who met the inclusion and exclusion criteria were included in the study, with an average age of 57.79±11.14 years old. Among them, there were 131 males with an average age of 55.45±11.25 years old and 104 females with an average age of 60.73±10.34 years old. According to whether they have T2DM and the level of HbA1c, the subjects were divided into non-diabetic group (68 cases), HbA1c≥7% group (107 cases) and HbA1c<7% group (60 cases). Statistically, there were no significant differences in gender (P=0.353) and average age (P=0.242) in the non-diabetic group (M/F: 33/35; 58.44±13.63), HbA1c≥7% (M/F: 62/45; 56.76±9.97) group and HbA1c<7% (M/F: 36/24; 58.88±9.98) group.
Standard Patient Evaluation of Eye Dryness (SPEED)
The results of the SPEED showed that 59 subjects (25.11%) had no dry eye symptoms and 176 subjects (74.89%) had dry eye symptoms. Specifically, 86 cases (80.37%) of HbA1c≥7% group had dry eye symptoms, 44 cases (73.33%) of HbA1c<7% group had dry eye symptoms, and 46 cases (67.65%) of non-diabetic group had dry eye symptoms. In addition, the SPEED score showed that the scores of HbA1c≥7% group, HbA1c<7% group and non-diabetic group were 3, 2 and 2, respectively. Further statistical analysis showed that there was no significant statistical difference between the three groups (P=0.209, Table 1).
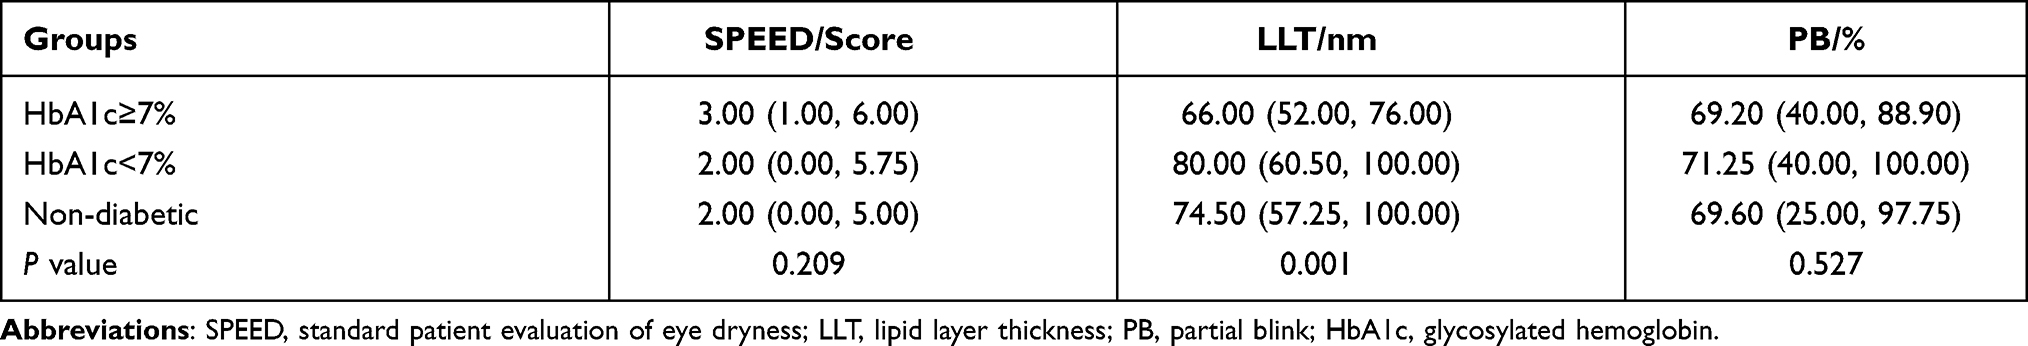 |
Table 1 The Comparison of SPEED Score, LLT and PB Among Three Groups |
Lipid Layer Thickness (LLT) and Partial Blink (PB) Ratio
As shown in Table 1, the LLT of the HbA1c≥7% group was 66.00 (52.00, 76.00) nm, that of the HbA1c<7% group was 80.00 (60.50, 100.00) nm, and that of the non-diabetic group was 74.50 (57.25, 100.00) nm. Obviously, we observed that the LLT of HbA1c<7% group was lower than HbA1c<7% and non-diabetic groups. Further, the statistical analysis indicated that the differences between the HbA1c≥7% group and the non-diabetic group or the HbA1c<7% group were statistically significant (vs non-diabetic group, P=0.020; vs HbA1c<7% group, P=0.003). However, there was no significant difference in LLT between the HbA1c<7% group and the non-diabetic group (P=0.505). For PB, the PB of HbA1c≥7% group, the HbA1c<7% group and the non-diabetic group were 69.20 (40.00, 88.90), 71.25 (40.00, 100.00) and 69.60 (25.00, 97.75), respectively. There was no statistical difference in PB among the three groups (P=0.527, Table 1).
Percentage of Partial Glands (MGP)
Table 2 showed the MGP data for each group. The MGP in the HbA1c≥7% group, HbA1c<7% group and non-diabetic group were 26.26 (19.29, 32.90)%, 14.29 (9.45, 20.60)% and 9.45 (3.60, 15.83)%, respectively. Among them, the MGP was the highest in the HbA1c≥7% group, and the lowest in the non-diabetic group, with significant statistical difference among the three groups (P<0.001). Specifically, statistical analysis showed that any pairwise comparison between the three groups was statistically significant (HbA1c≥7% vs HbA1c<7%, P<0.001; HbA1c≥7% vs non-diabetic, P<0.001; HbA1c<7% vs non-diabetic, P=0.031).
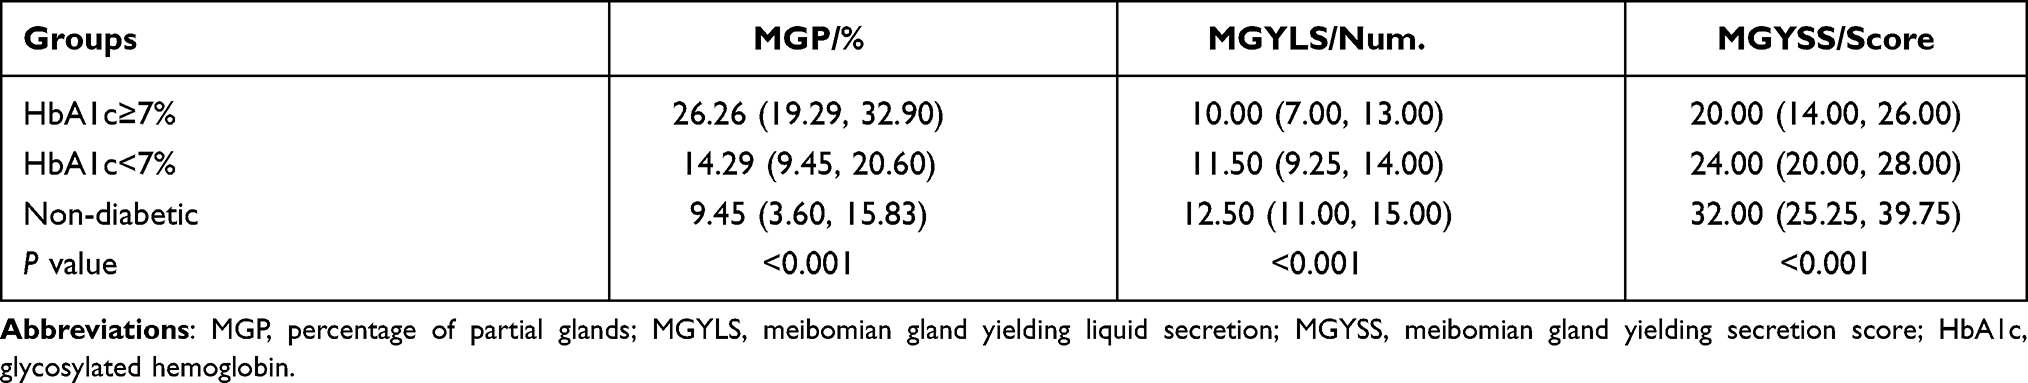 |
Table 2 The Comparison of MGP, MGYLS and MGYSS Among Three Groups |
Meibomian Gland Yielding Liquid Secretion (MGYLS) and Meibomian Gland Yielding Secretion Score (MGYSS)
As shown in Table 2, the MGYLS of the HbA1c≥7% group was 10.00 (7.00, 13.00), the MGYLS of the HbA1c<7% group was 11.50 (9.25, 14.00), and the non-diabetic group was 12.5 (11.00, 15.00). Compared with HbA1c<7% group and non-diabetic group, MGYLS was lower in HbA1c≥7% group, and the difference was statistically significant (vs HbA1c<7% group, P=0.014; vs non-diabetic group, P<0.001). However, there was no statistically significant difference between the HbA1c<7% group and the non-diabetic group (P=0.152).
For MGYSS, the MGYSS of the HbA1c≥7% group was 20.00 (14.00, 26.00), of the HbA1c<7% group was 24.00 (20.00, 28.00), and of the non-diabetic group was 32.00 (25.25, 39.75). Compared with the non-diabetic group, MGYSS was lower in both HbA1c≥7% group and HbA1c<7% group, with a statistically significant difference (P<0.001). However, there was no statistically significant difference between HbA1c≥7% group and HbA1c<7% group (Table 2).
Line of Marx (LOM) Position
Compared with the non-diabetic group, the differences in Marx position assessment of the HbA1c≥7% group and the HbA1c<7% group were statistically significant (P<0.001). However, there was no significant difference between HbA1c≥7% group and HbA1c<7% group (P=0.545). The Marx position assessment is divided into four grades: Grade 0, Grade 1, Grade 2, and Grade 3. Except for “Grade 0”, all other grades are abnormal. As shown in Table 3, the abnormal rate of HbA1c≥7% group was 87.85%, the abnormal rate of HbA1c<7% group was 91.67%, with the highest abnormal rate, and the abnormal rate of non-diabetic group was 55.88%, with the lowest abnormal rate.
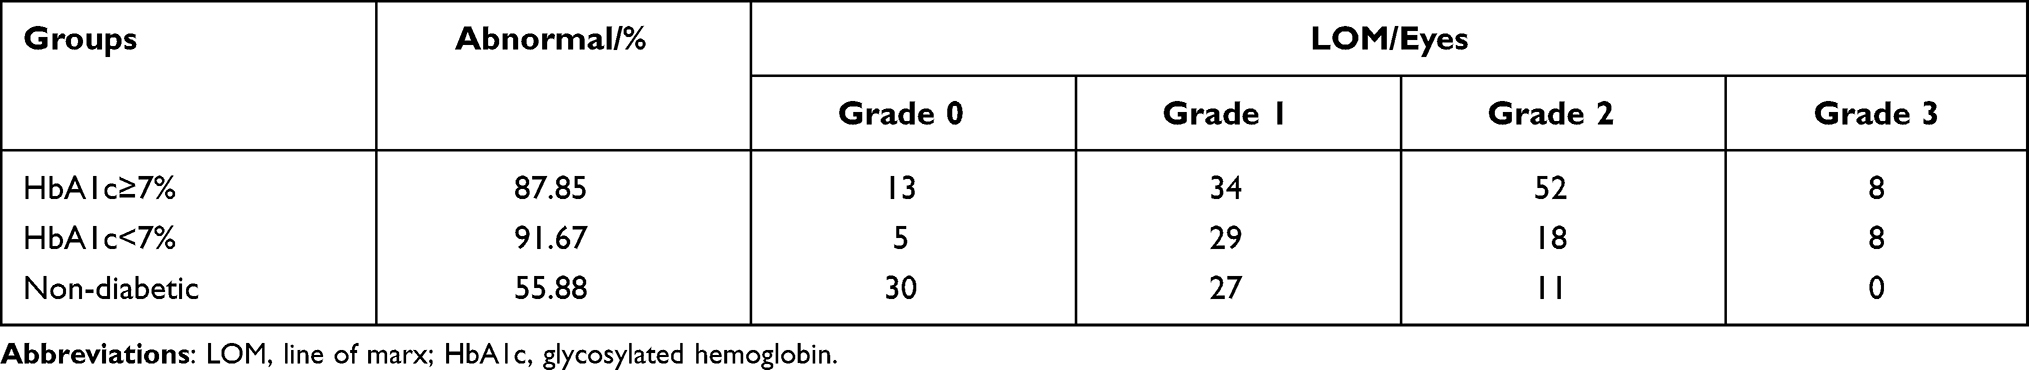 |
Table 3 The Comparison of LOM Among Three Groups |
Tear Break Up Time (TBUT)
The TBUT of the HbA1c≥7% group was 3.00 (2.00, 4.00), of the HbA1c <7% group was 3.00 (3.00, 6.00), and of the non-diabetic group was 3.50 (3.00, 6.00). The TBUT of the HbA1c≥7% group was significantly lower than that of the HbA1c<7% group and the non-diabetic group, the difference was statistically significant (vs HbA1c<7% group, P=0.015; vs non-diabetic group, P<0.001). However, there was no significant difference between the HbA1c<7% group and the non-diabetic group (P=0.399, Table 4).
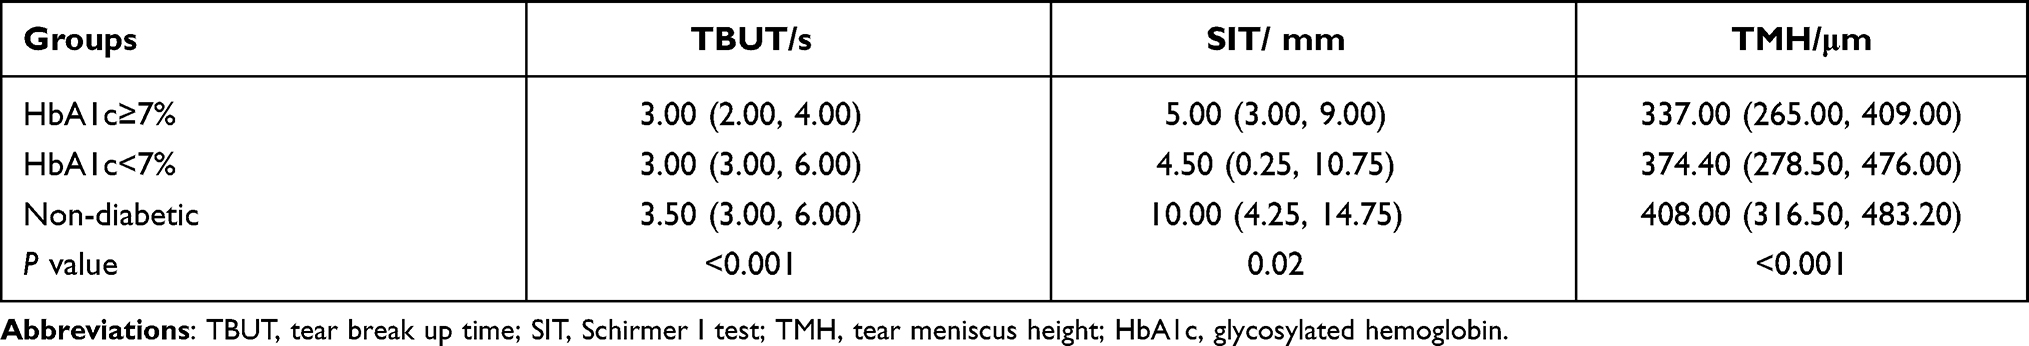 |
Table 4 The Comparison of TBUT, SIT and TMH Among Three Groups |
Tear Meniscus Height (TMH)
The TMH of the HbA1c≥7% group was 337.00 (265.00, 409.00) μm, of the HbA1c<7% group was 374.40 (278.50, 476.00) μm, and of the non-diabetic group was 408.00 (316.50, 483.20) μm. The TMH of the HbA1c≥7% group was significantly lower than that of the non-diabetic group, with an obvious statistical differences (P=0.017). However, the HbA1c<7% group has no significant difference compared with the HbA1c≥7% group and the non-diabetic group (P=0.494, P=0.740, Table 4).
Schirmer Test I (SIT)
As shown in Table 4, the SIT results of HbA1c≥7% group, HbA1c<7% group and non-diabetic group were 5.00 (3.00, 9.00) mm, 4.50 (0.25, 10.75) mm and 10.00 (4.25, 14.75) mm, respectively. Compared with the non-diabetic group, the SIT results were lower both in the HbA1c≥7% group and HbA1c<7% group. Further, the statistical results revealed that there were significant differences between the non-diabetic group and HbA1c≥7% (P=0.001) group, and between non-diabetic group and HbA1c<7% group (P=0.001). However, there was no statistically significant difference between the HbA1c≥7% group and the HbA1c<7% group (P=0.558).
Prevalence of MGD
As shown in Table 5, there were 107 cases in the HbA1c≥7% group, of which 82 cases (76.64%) developed MGD. There were 60 cases in the HbA1c<7% group, of which 42 cases (70.00%) developed MGD. There were 68 cases in the non-diabetic group, of which 37 cases (54.41%) developed MGD. The difference between the three groups was statistically significant (P=0.008). Paired comparison results showed that the prevalence of MGD in the HbA1c≥7% group was significantly higher than that in the non-diabetic group (P=0.002), while the prevalence of MGD in the HbA1c≥7% group was not significantly different from that in the HbA1c<7% group (P=0.347), and there was also no significant difference between the HbA1c<7% group and the non-diabetic group (P=0.070).
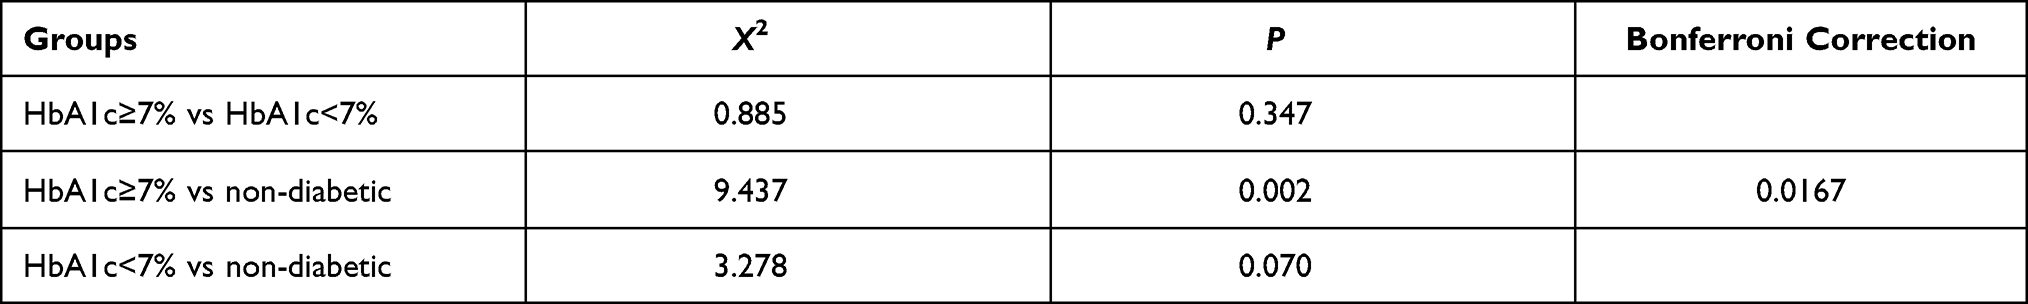 |
Table 5 The Comparison of MGD Prevalence Among Three Groups |
Correlation Analysis of HbA1c and Other Index
As shown in Table 6, the correlation analysis results indicated that among the indicators related to MGD, HbA1c was significantly correlated with LLT (P<0.0001) and the MGP (P<0.0001), respectively, but not significantly correlated with SPEED score (P=0.492), PB (P=0.463), MGYLS (P=0.256), MGYSS (P=0. 656), LOM (P=0.761), TBUT (P=0.205), SIT (P=0.866) and TMH (P=0.100).
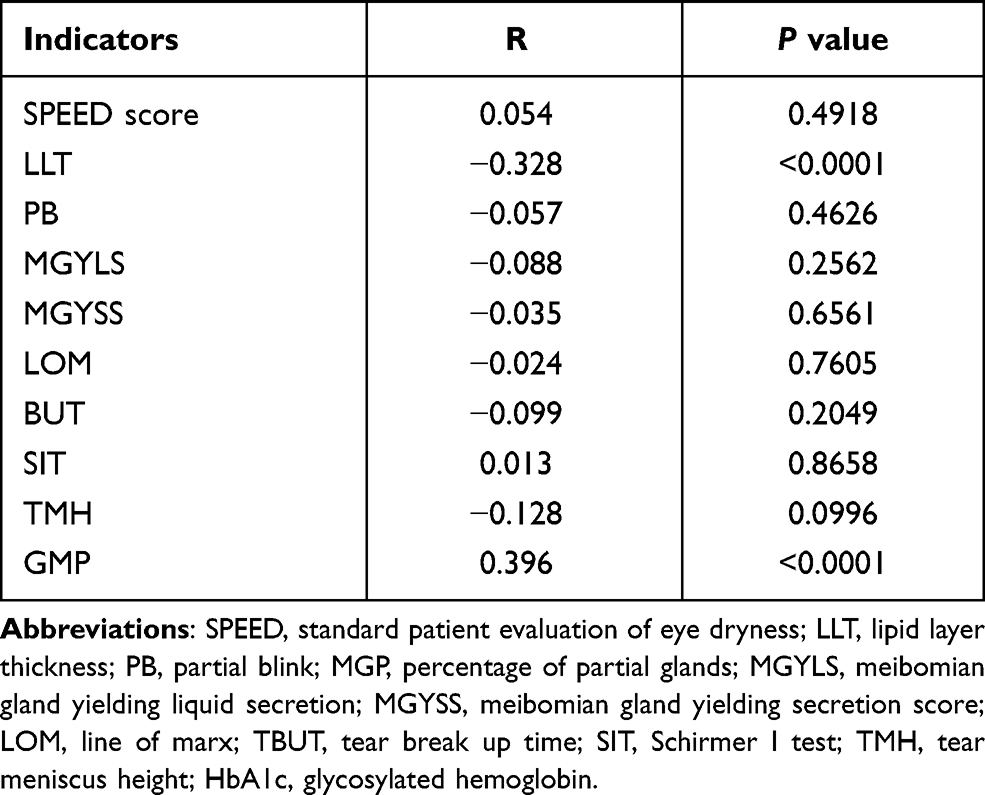 |
Table 6 Correlation Analysis of HbA1c and Various Indicators |
Discussion
Viso et al showed that although patients with diabetes often had uncomfortable symptoms such as eye surface burning or foreign body sensation, there was no significant difference as comparison to non-diabetic patients.24 In this study, the SPEED score revealed no statistically significant difference between the three groups, suggesting that the ocular discomfort symptoms of patients with T2DM were not significantly increased or reduced compared with the non-diabetic group, which may be related to the increased neurosensory threshold and decreased corneal sensitivity of patients with diabetes. In addition, we found that there was no statistical difference in PB among all groups, and there was no significant correlation between the HbA1c level and PB, which was consistent with the results of Yu et al.25 For the above results, we speculated that blinking may be affected by multiple factors such as eye diseases, systemic diseases, and even psychological and environmental factors.
Lipid is secreted by the meibomian gland, which can keep the eye surface lubricate, block the infection of microorganism and sebaceous gland secretions, delay the evaporation of tear water on the eye surface and maintain the stability of tear film. Meanwhile, it also has the functions of refractive, maintaining optical interface and preventing tear overflow26 Lipid layer is the outermost layer of tear film, and the MGD could cause the destruction of the structure and function of lipids, leading to changes in the quality and quantity of the secretion of the meibomian gland27 Yu et al found that the LLT of diabetic patients was significantly lower than that of non-diabetic patients25 Consistently, out data indicted the LLT of HbA1c≥7% group was significantly lower than that of HbA1c<7% group, and with the gradual increase of HbA1c, LLT gradually thinned, indicating that the degree of HbA1c control had a significant impact on the distribution of the tear film lipid layer. Of note, correlation analysis showed a significant correlation between HbA1c and LLT.
Meibomian glands are the main source of human tear film lipids and the secretions are composed of a complex mixture of various polar and non-polar lipids. The eyelid esters that spread to the eye surface can slow down the evaporation of tears, maintain a transparent optical surface, and protect the eyes from microorganisms, dust, pollen and other organic matter.28 In the study of Baudouin et al, the obstruction and the secretions of the meibomian glands in the diabetic group were significantly worse than those in the non-diabetic group.29 Besides, Lin et al also found that compared with non-diabetic patients, the secretion of meibomian glands was worse, the MGYLS was less, and the abnormalities of eyelid edge were more obvious.11 In the current study, the meibomian gland secretion of T2DM patients was significantly worse than that of the non-diabetic patients, and the MGYLS in the HbA1c≥7% group was evidently less than that in the non-diabetic group. Moreover, the MGYLS in the HbA1c≥7% group was significantly less than that in the HbA1c<7% group, indicating that diabetes can lead to the injury of the meibomian glands, and long-term high level of HbA1c will accelerate the atrophy and injury of the meibomian glands. However, correlation analysis data represented that there was no significant correlation between HbA1c and MGYLS and MGYSS, suggesting that HbA1c affected dysfunction not directly by affecting secretions.
Previous study on the effect of hyperglycemia on human meibomian gland epithelial cells suggested that hyperglycemia has a toxic effect on human meibomian gland epithelial cells. Long-term high glucose levels caused significant morphological changes and gradual loss of human blepharoidal epithelial cells, suggesting that high blood glucose is the cause of MGD in diabetic patients.30 For example, Lin et al found that patients with diabetes had more obvious loss of meibomian glands, and worse lipid layer thickness and color structure.11 Interestingly, our data also revealed serious loss of meibomian glands in T2DM patients, especially in the HbA1c≥7% group. In the comparison of the prevalence of MGD, the prevalence of MGD was the highest in the HbA1c≥7% group and the lowest in the non-diabetic group, showing a significant statistical difference. In addition, the prevalence of MGD in HbA1c≥7% group was significantly higher than that of HbA1c<7% although there was no significant statistical difference, indicating that HbA1c has a significant impact on the function of the meibomian glands. Further correlation analysis confirmed this conclusion.
A number of studies have shown that the TUBT of diabetic patients was abnormal, and lower than that of non-diabetic patients.1,13 In this study, we also found that the TBUT of HbA1c≥7% group was significantly lower than that of non-diabetic group and HbA1c<7% group. However, there was no significant difference in TBUT between HbA1c<7% group and non-diabetic group. We speculated that the possible reason was that long-term high blood glucose level lead to oxidative stress and changes in glycation metabolites, thereby causing peripheral neuropathy. Further, peripheral neuropathy lead to decreased sensitivity of the cornea and blocked nerve conduction, resulting in lacrimal gland secretion disorders. Similarly, we observed that the SIT of patients with T2DM decreased sharply compared with the non-diabetic group, which was highly consistent with the previous findings.31 In the study of Ozdemir et al, they showed that the degree of blood glucose in diabetic patients was related to tear function,32 and the results of SIT in diabetic patients with poor blood glucose control were worse. However, our data showed no statistically significant difference in SIT between HbA1c≥7% group and HbA1c<7% group. Of note, Baek previous compared the HbA1c of T2DM patients at 7.8%, and also found that HbA1c level had no significant effect on the SIT.13 These results suggested that multiple mechanisms may simultaneously influence tear secretion. In the detection of TMH, it was found that the TMH of HbA1c≥7% group was significantly lower than those in the non-diabetic group, while TMH in the HbA1c<7% group was not significantly different from those in the non-diabetic group. For this, we speculated that the possible reason is that long-term hyperglycemia causes peripheral neuropathy, which causes lacrimal gland secretion disorders, resulting in a decrease in tear film stability, which in turn leads to a decrease in TMH. In addition, the correlation analysis results showed that there was no significant correlation between HbA1c and TUBT, STI and TMH in patients with T2DM, which may be due to a variety of mechanisms affecting the secretion of tears, of which HbA1c is only one factor.
Conclusion
Compared with T2DM patients with HbA1c<7%, T2DM patients with HbA1c≥7% have more serious meibomian gland loss, and are more likely to show signs of deterioration of meibomian gland function, such as reduced MGYLS, decreased LTT, tear film instability, etc., eventually leading to MGD and even dry eyes. Correlation analysis showed that HbA1c was significantly associated with the LTT and MGP. There are some limitations to this study. First, the sample size of this study is small, which may have a certain impact on the research results. Second, although we have found the relevant factors of HbA1c affecting eyelid function, how they affect meibomian gland function through HbA1c still needs further study.
Abbreviations
T2DM, Type 2 diabetes mellitus; HbA1c, hemoglobin; SPEED, standard patient evaluation of eye dryness; LLT, lipid layer thickness; PB, partial blink; MGP, percentage of partial glands; MGYLS, meibomian gland yielding liquid secretion; MGYSS, meibomian gland yielding secretion score; LOM, line of marx; TBUT, tear break up time; TMH, tear meniscus height; SIT, Schirmer I test (SIT).
Ethical Declaration
This study was approved by the ethics committee of Hebei General Hospital and consistent with the Declaration of Helsinki.
Informed Consent
Written informed consent was obtained from each patient.
Funding
The study was supported by Key Research and Development Project of Hebei Province (18277753D).
Disclosure
The authors declare that they have no conflict of interests.
References
1. Yu T, Shi WY, Song AP, Gao Y, Dang GF, Ding G. Changes of meibomian glands in patients with type 2 diabetes mellitus. Int J Ophthalmol. 2016;9(12):1740–1744.
2. Ma A, Mak MS, Shih KC. Association of long-term glycaemic control on tear break-up times and dry eye symptoms in Chinese patients with type 2 diabetes. Clin Experiment Ophthalmol. 2018;46(6):608–615.
3. Wild S, Roglic G, Green A, Sicree R, King H. Global prevalence of diabetes: estimates for the year 2000 and projections for 2030. Diabetes Care. 2004;27(5):1047–1053. doi:10.2337/diacare.27.5.1047
4. Chung IM, Rajakumar G, Subramanian U, Venkidasamy B, Khanna VG, Thiruvengadam M. Insights on the current status and advancement of diabetes mellitus type 2 and to avert complications: an overview. Biotechnol Appl Biochem. 2020;67(6):920–928.
5. Threatt J, Williamson JF, Huynh K, Davis RM, Hermayer K. Ocular disease, knowledge and technology applications in patients with diabetes. Am J Med Sci. 2013;345(4):266–270. doi:10.1097/MAJ.0b013e31828aa6fb
6. Chan JC, Malik V, Jia W, et al. Diabetes in Asia: epidemiology, risk factors, and pathophysiology. JAMA. 2009;301(20):2129–2140. doi:10.1001/jama.2009.726
7. Shih KC, Lam KS, Tong L. A systematic review on the impact of diabetes mellitus on the ocular surface. Nutr Diabetes. 2017;7(3):e251. doi:10.1038/nutd.2017.4
8. Esteghamati A, Momeni A, Abdollahi A, et al. Serum fibroblast growth factor 21 concentrations in type 2 diabetic retinopathy patients. Ann Endocrinol. 2016;77(5):586–592. doi:10.1016/j.ando.2016.01.005
9. Najafi L, Malek M, Valojerdi AE, Khamseh ME, Aghaei H. Dry eye disease in type 2 diabetes mellitus; comparison of the tear osmolarity test with other common diagnostic tests: a diagnostic accuracy study using STARD standard. J Diabetes Metab Disord. 2015;14(1):39. doi:10.1186/s40200-015-0157-y
10. Palamar M, Kiyat P, Ertam I, Yagci A. Evaluation of dry eye and meibomian gland dysfunction with meibography in vitiligo. Eye. 2017;31(7):1074–1077. doi:10.1038/eye.2017.38
11. Lin X, Xu B, Zheng Y, et al. Meibomian gland dysfunction in type 2 diabetic patients. J Ophthalmol. 2017;2017:3047867.
12. Misra SL, Patel DV, McGhee CN, et al. Peripheral neuropathy and tear film dysfunction in type 1 diabetes mellitus. J Diabetes Res. 2014;2014:848659. doi:10.1155/2014/848659
13. Baek J, Doh SH, Chung SK. Assessment of the tear meniscus using optical coherence tomography in patients with type 2 diabetes mellitus. Cornea. 2015;34(12):1534–1540. doi:10.1097/ICO.0000000000000651
14. Lyu Y, Zeng X, Li F, Zhao S. The effect of the duration of diabetes on dry eye and corneal nerves. Cont Lens Anterior Eye. 2019;42(4):380–385. doi:10.1016/j.clae.2019.02.011
15. Association American Diabetes. Updates to the standards of medical care in diabetes-2018. Diabetes Care. 2018;41(9):2045–2047. doi:10.2337/dc18-su09
16. Lekhanont K, Rojanaporn D, Chuck RS, Vongthongsri A. Prevalence of dry eye in Bangkok, Thailand. Cornea. 2006;25(10):1162–1167. doi:10.1097/01.ico.0000244875.92879.1a
17. Lin PY, Tsai SY, Cheng CY, Liu JH, Chou P, Hsu WM. Prevalence of dry eye among an elderly Chinese population in Taiwan: the Shihpai Eye Study. Ophthalmology. 2003;110(6):1096–1101. doi:10.1016/S0161-6420(03)00262-8
18. Jie Y, Xu L, Wu YY, Jonas JB. Prevalence of dry eye among adult Chinese in the Beijing Eye Study. Eye. 2009;23(3):688–693. doi:10.1038/sj.eye.6703101
19. Siak JJ, Tong L, Wong WL, et al. Prevalence and risk factors of meibomian gland dysfunction: the Singapore Malay eye study. Cornea. 2012;31(11):1223–1228. doi:10.1097/ICO.0b013e31823f0977
20. Ngo W, Situ P, Keir N, Korb D, Blackie C, Simpson T. Psychometric properties and validation of the standard patient evaluation of eye dryness questionnaire. Cornea. 2013;32(9):1204–1210. doi:10.1097/ICO.0b013e318294b0c0
21. Asiedu K. Rasch analysis of the standard patient evaluation of eye dryness questionnaire. Eye Contact Lens. 2017;43(6):394–398. doi:10.1097/ICL.0000000000000288
22. Finis D, Pischel N, Schrader S, Geerling G. Evaluation of lipid layer thickness measurement of the tear film as a diagnostic tool for meibomian gland dysfunction. Cornea. 2013;32(12):1549–1553. doi:10.1097/ICO.0b013e3182a7f3e1
23. Tang Y, Liu R, Tu P, et al. A retrospective study of treatment outcomes and prognostic factors of intense pulsed light therapy combined with meibomian gland expression in patients with meibomian gland dysfunction. Eye Contact Lens. 2021;47(1):38–44. doi:10.1097/ICL.0000000000000704
24. Viso E, Rodríguez-Ares MT, Abelenda D, Oubiña B, Gude F. Prevalence of asymptomatic and symptomatic meibomian gland dysfunction in the general population of Spain. Invest Ophthalmol Vis Sci. 2012;53(6):2601–2606. doi:10.1167/iovs.11-9228
25. Yu L. Clinical analysis of 216 children with blinking syndrome. Chin J Strabismus Pediatr Ophthalmol. 2013;4:40–41.
26. Korb DR, Blackie CA. Meibomian gland diagnostic expressibility: correlation with dry eye symptoms and gland location. Cornea. 2008;27(10):1142–1147. doi:10.1097/ICO.0b013e3181814cff
27. Arita R, Fukuoka S, Morishige N. New insights into the lipid layer of the tear film and meibomian glands. Eye Contact Lens. 2017;43(6):335–339. doi:10.1097/ICL.0000000000000369
28. Liang W, Zhao S. Changes in meibomian glands morphology and function and its effect on ocular surface in patients with type 2 diabetes. J Tianjin Med Univ. 2018;24(06):83–86.
29. Baudouin C, Messmer EM, Aragona P. Revisiting the vicious circle of dry eye disease: a focus on the pathophysiology of meibomian gland dysfunction. Br J Ophthalmol. 2016;100(3):300–306.
30. Shamsheer RP, Arunachalam C. A clinical study of meibomian gland dysfunction in patients with diabetes. Middle East Afr J Ophthalmol. 2015;22(4):462–466. doi:10.4103/0974-9233.167827
31. Kesarwani D, Rizvi SWA, Khan AA, Amitava AK, Vasenwala SM, Siddiqui Z. Tear film and ocular surface dysfunction in diabetes mellitus in an Indian population. Indian J Ophthalmol. 2017;65(4):301–304. doi:10.4103/ijo.IJO_939_15
32. Ozdemir M, Buyukbese MA, Cetinkaya A, Ozdemir G. Risk factors for ocular surface disorders in patients with diabetes mellitus. Diabetes Res Clin Pract. 2003;59(3):195–199. doi:10.1016/S0168-8227(02)00244-9
 © 2021 The Author(s). This work is published and licensed by Dove Medical Press Limited. The full terms of this license are available at https://www.dovepress.com/terms.php and incorporate the Creative Commons Attribution - Non Commercial (unported, v3.0) License.
By accessing the work you hereby accept the Terms. Non-commercial uses of the work are permitted without any further permission from Dove Medical Press Limited, provided the work is properly attributed. For permission for commercial use of this work, please see paragraphs 4.2 and 5 of our Terms.
© 2021 The Author(s). This work is published and licensed by Dove Medical Press Limited. The full terms of this license are available at https://www.dovepress.com/terms.php and incorporate the Creative Commons Attribution - Non Commercial (unported, v3.0) License.
By accessing the work you hereby accept the Terms. Non-commercial uses of the work are permitted without any further permission from Dove Medical Press Limited, provided the work is properly attributed. For permission for commercial use of this work, please see paragraphs 4.2 and 5 of our Terms.