")
Back to Journals » OncoTargets and Therapy » Volume 13
To Develop and Validate the Combination of RNA Methylation Regulators for the Prognosis of Patients with Gastric Cancer
Authors Zhang J, Piao H, Wang Y, Meng X , Yang D, Zhao Y, Zheng Z
Received 12 August 2020
Accepted for publication 16 September 2020
Published 23 October 2020 Volume 2020:13 Pages 10785—10795
DOI https://doi.org/10.2147/OTT.S276239
Checked for plagiarism Yes
Review by Single anonymous peer review
Peer reviewer comments 2
Editor who approved publication: Dr William C. Cho
Jun Zhang,1 Hai-yan Piao,2 Yue Wang,1 Xiang-yu Meng,1 Dong Yang,1 Yan Zhao,1 Zhi-chao Zheng1
1Gastric Cancer Department, Liaoning Province Cancer Hospital & Institute (Cancer Hospital of China Medical University), Shenyang City, Liaoning Province 110042, People’s Republic of China; 2Medical Oncology Department of Gastrointestinal Cancer, Liaoning Province Cancer Hospital & Institute (Cancer Hospital of China Medical University), Shenyang City, Liaoning Province 110042, People’s Republic of China
Correspondence: Zhi-chao Zheng Professor of Gastric Cancer Department
Liaoning Province Cancer Hospital and Institute (Cancer Hospital of China Medical University), No. 44 Xiaoheyan Road, Dadong District, Shenyang, Liaoning Province 110042, People’s Republic of China
Tel +86-24-31916823
Fax +86-24-24315679
Email [email protected]
Background: Gastric cancer (GC) accounts for high mortality. RNA methylation has recently gained interest as markers in specific tumors. This study aimed to uncover the function of the roles of 25 RNA methylation regulators in GC.
Methods: RNA sequence and clinical data were downloaded from The Cancer Genome Atlas (TCGA) database. “STRING” and R were performed to analyze the correlation among the methylase. COX and LASSO were performed to screen for prognostic associated RNA methylation regulators. A prognostic model was established based on the expression of methylase. RT-PCR and immunohistochemistry detected the expression of methylase in GC cells and tissue. Kaplan–Meier curve and Cox analysis were applied to evaluate the effectiveness of the model.
Results: The prediction model was established based on the expression of m6A RNA methylation regulators FTO (fat mass and obesity-associated) and RBM15 (RNA binding motif protein 15). Based on the model, GC patients were divided into “high risk” and “low risk” groups to compare the differences in survival. The model was re-evaluated with the clinical data of our center.
Conclusion: The two-methylase combination model was an independent prognostic factor of GC.
Keywords: gastric cancer, prognosis, least absolute shrinkage and selection operator, survival analysis, RNA methylation
Introduction
Gastric cancer (GC) is the fourth most common cancer and the second leading cause of cancer-related death worldwide, with a high incidence rate recorded in East Asia.1 In China, GC remains the second most prevalent cancer, with approximately 679,100 new cases and 498,000 deaths in 2015.2 Most patients are diagnosed at the advanced stage, and due to chemoresistance and recurrence, an overall 5-year survival rate is less than 25%.3 Therefore, a novel and reliable prognostic stratification system which could be applied to clinical risk assessment. It would be of great significance for the treatment and follow-up of GC patients.
The central dogma explains how information flows from DNA to mRNA to protein. However, with the development of Next-Generation Sequencing, researchers gradually discovered the critical role of non-coding RNA in epigenetic, transcriptional, and post-transcriptional modification. And epitranscriptomics (post-translational RNA modifications) are conserved throughout the evolutionary process and serve as a heritable element for acquired traits.4,5 Among them, it is methylation of N6-methyladenosine (m6A) that the most abundant RNA modification form in eukaryotes.6 In the previous study, we reported m6A regulators’ Involvement in the expression of lncRNA NEAT1 in GC.7 Besides, studies had also reported N1-methyladenosine (m1A) and 5-methylcytosine (m5C) modifications in coding and non-coding RNAs.8 Similar to DNA epigenetics, RNA modification dynamically encodes RNA by “writer” and “eraser” and then decodes RNA by “reader,” thus causing subsequent changes in biological function. However, the role of RNA methylation in the development and prognosis of GC is not fully understood.
Given the significance of RNA methylation in cancer, we wondered whether RNA methylation enzymes could be used to predict the occurrence and development of GC. We first collected and identified enzymes involved in m6A, m1A, and m5C. “Writer” of m6A: KIAA1429, METTL3, METTL14, RBM15, WTAP, ZC3H13; “reader” of m6A: HNRNPC, YTHDC1, YTHDC2, YTHDF1, YTHDF2; “eraser” of m6A: ALKBH5, FTO. “Writer” of m5C: NSUN2, TRDMT1; “reader” of m5C: ALYREF; “eraser” of m5C: TET1, TET2, TET3. “Writer” of m1A: TRMT61B, TRMT61A, TRMT6, RRP8; “eraser” of m1A: ALKBH1 and ALKBH3. Unfortunately, the “reader” of m1A is mainly unknown. Subsequently, we explored the expression patterns of RNA methylation-related genes through the bioinformatics analysis of data from TCGA (The Cancer Genome Atlas) database. We found that RNA methylation regulators played an essential role in GC progression and established prognostic risk prediction models for GC based on two regulators. And the model was validated by the clinical data of our center.
Methods
Data Preprocessing
RNA sequencing and matching medical data were acquired from TCGA (https://portal.gdc.cancer.gov/). Raw data was obtained through the RTCGA Toolbox package (R platform). Overall, 406 samples, including 375 GC and 31 normal tissues, were analyzed. The expression of mRNA was acquired from Illumina HiSeq_RNASeq platforms. Perl and R were utilized to evaluate findings.
Package “limma” (P<0.05) was performed to pre-treat the data and obtained the expression matrix of the 25 methylated related genes (Supplement Table 1). In addition, the clinical data of the samples were shown in Supplement Table 2. Based on these two data tables, we would assess the correlation between RNA methylation regulatory genes’ expression and the clinical data of the samples. This study was carried out according to the flow chart (Figure 1).
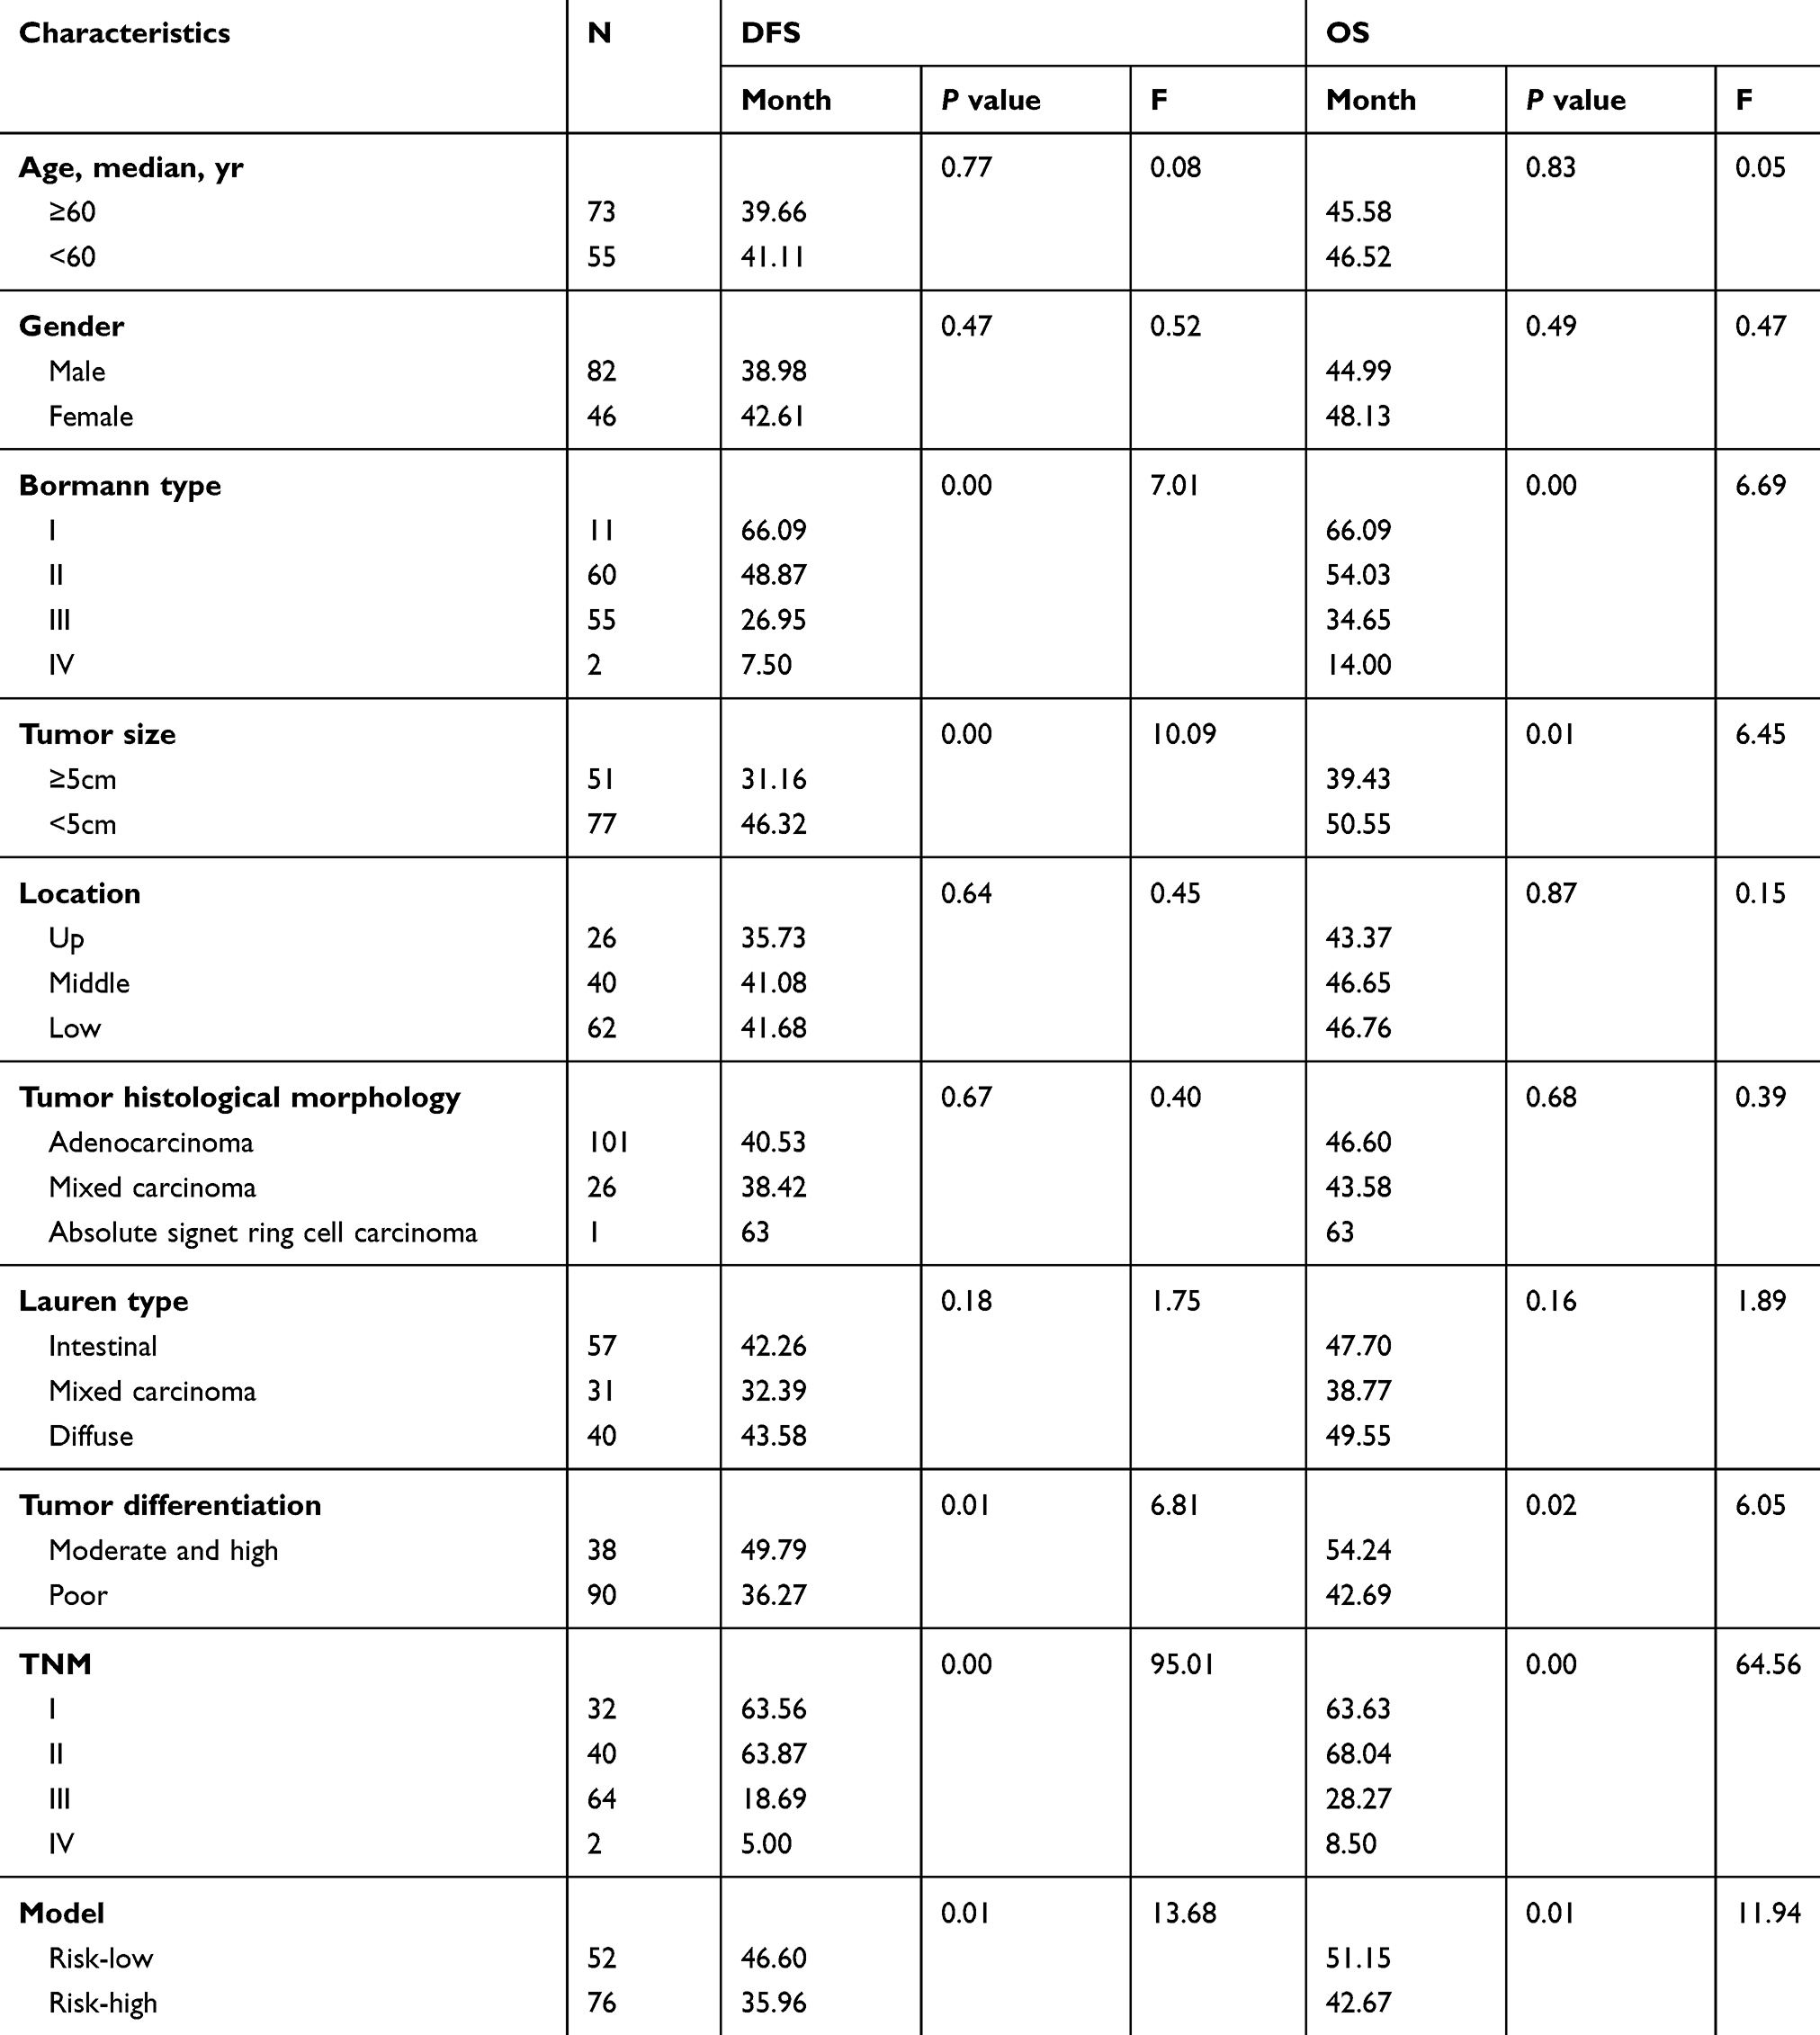 |
Table 1 Patients Characteristics and Univariate Analysis |
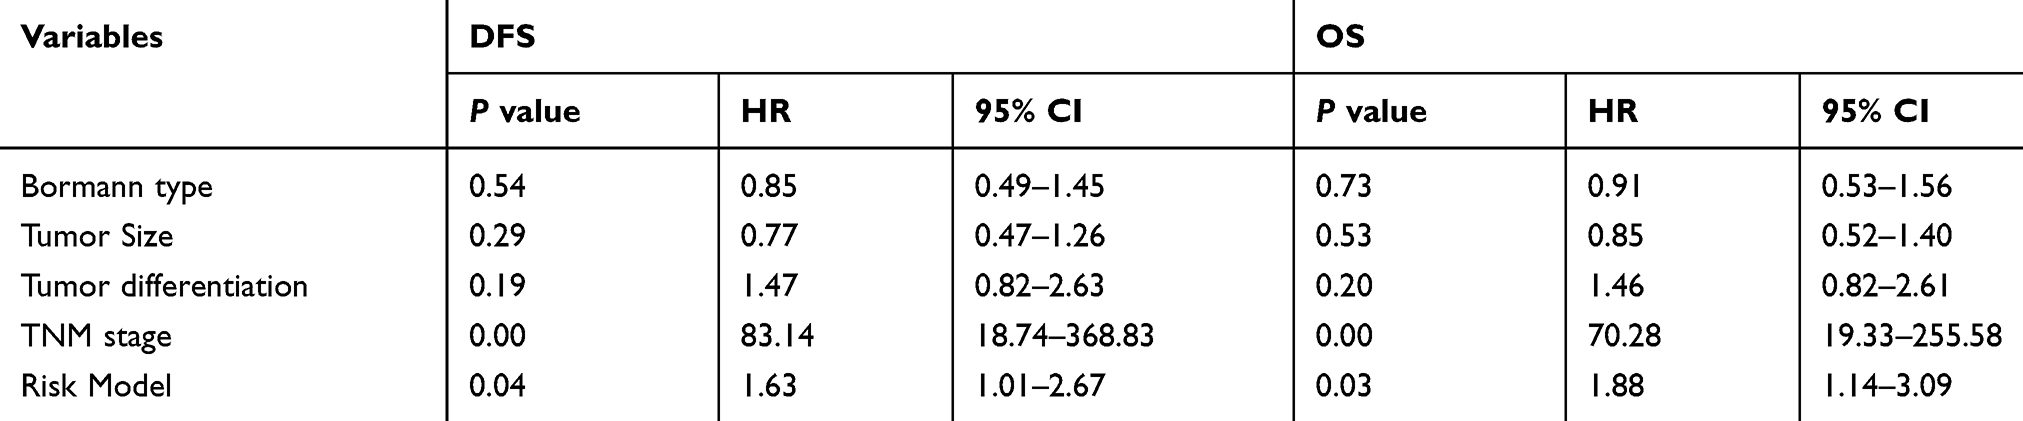 |
Table 2 Multivariate Analysis of Significant Prognostic Factor for Survival in Gastric Cancer Patients |
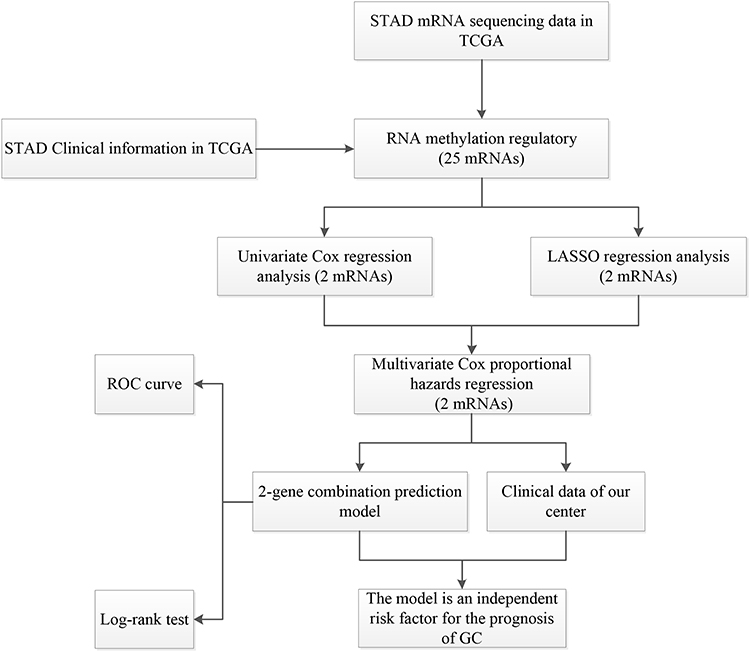 |
Figure 1 The workflow of the study. |
Data Analyses
The R package “pheatmap” and “vioplot” visualized the expression of RNA methylated. Genes in tumor and normal tissue. The correlation among the RNA methylated genes was constructed based on the Search Tool for the Retrieval of Interacting Genes (STRING, http://string.embl.de/). R package “corrplot” analyzed and visualized the relationship between every two genes.
Cell Culture and Tissue Samples
Gastric cancer cells and gastric epithelial cells were purchased from ATCC. The cell culture method was the same as previous studies.7 A total of 128 patients were included in this study. All patients signed informed consent before surgery. Ethics Committee of Liaoning Provincial Cancer Hospital &Institute approved this study. See the previous study for patient information and follow-up.9
Real‑time Reverse Transcription Polymerase Chain Reaction (RT‑PCR)
The steps of RT‑PCR were performed as formerly described.7 Te following primers were used: FTO, forward 5ʹ-GAGCAGCCTACAACGTGACT-3ʹ and reverse 5ʹ- GAAGCTGGACTCGTCCTCAC-3ʹ; RBM15, forward 5ʹ- TACTTCTGTGCCTGCTTAC-3ʹ and reverse 5ʹ- GTGCTTCCTATCTCGTTCA-3ʹ; U6, forward 5ʹ-TTATGGGTCCTAGCCTGAC-3ʹ and reverse 5ʹ-CACTATTGCGGGCTGC-3ʹ.
Immunohistochemistry (IHC) Analysis
Following the proteolytic digestion and BCA blocking, the slices were incubated with polyclonal RSF1 antibody (ab244374, Abcam, USA), FTO (bs-7056R, Bioss, China) or at 4°C overnight. The steps of immunohistochemistry were performed as formerly described.10 The ultimate immunoreactivity scores (IRS) were calculated consistent with the scores of the ratio of positive dyed cells, as previously described.10
Results
Expression of RNA Methylated Genes in Tissues
To better explore the role of RNA methylation in tumor formation and development, we analyzed the expression of these 25 genes in both tumors and normal tissues. The heatmap showed that most RNA methylation regulators were significantly correlated with tumor status (Figure 2A). Twenty-one RNA methylation regulators were significantly abnormally expressed in GC tissue samples compared with normal tissue samples (Figure 2B). Such as all of the “writer” of m6A (except METTL14), all of the m6A “reader”; the “writer”: NUSUN2, “reader”: TRDNT1, and “eraser”: TET3 in m5C; and all of the “writer” in m1A and “eraser”: ALKBH1.
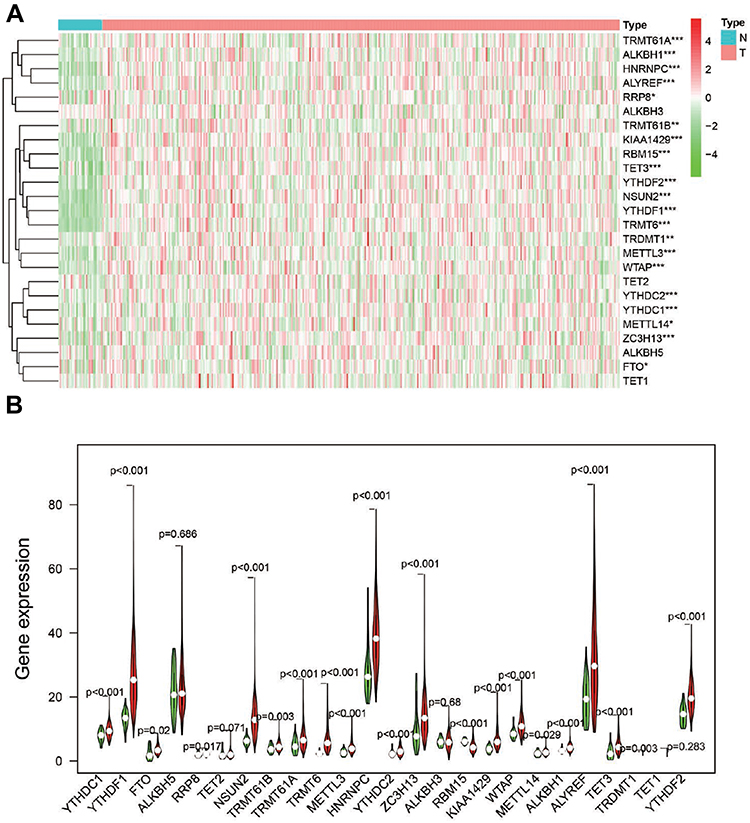 |
Figure 2 The expression of RNA methylation regulators in GC. (A). Heatmap showed the expression of the RNA methylation regulators in 375 GC and 32 para-carcinoma tissues; *P<0.05, **P<0.01, ***P<0.001. (B). Vioplot visualized the expression of 25 RNA methylation regulators in different tissue samples in GC and para-carcinoma tissues. |
Interaction and Correlation of 25 RNA Methylation Enzymes in GC
The interaction information of the 25 RNA methylase was obtained from the STRING database and built protein-protein interaction (PPI) network based on their expression relationship (Figure 3A). There were apparent interactions among the six “writers” of m6A, except WTP and ZC3H13, WTAP, and METTL14. In the m6A “readers,” YTHDC2 did not have a clear correlation between HNRNPC and YTHDF1. It also exhibited a definite correlation between “erasers” FTO and LAKBH5. There was a clear relationship between m5C “writers”: NSUN2 and TRDMT1. Relationships between m5C “erasers” were also widespread, except for TET1 and TET2. In m1A, “writer” TRMT61A and TRMT61B, TRMT6 and RRP8 did not show a relationship, and the “erase” ALKBH1 and ALKBH3 was the same (Figure 3B). Compared with m6A and m5C, the relationship between m1A methylated enzymes was weaker. Since the “reader” of m1A was also unclear, further study and discovery of m1A methylation related enzymes may be required.
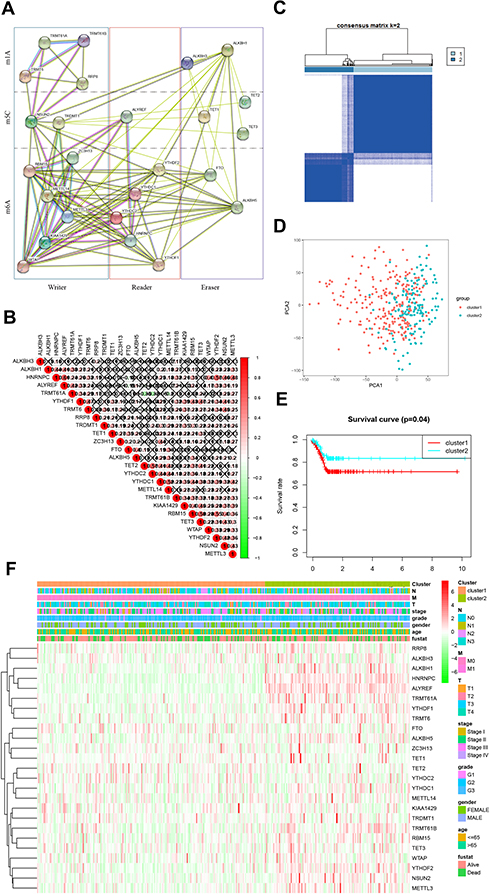 |
Figure 3 Identification of co-expressed gene clusters of RNA methylation regulators. (A). Protein-protein interaction network constructed by STING database. (B). Spearman analyzed the correlation of RNA methylation modified regulator in GC; Spearman correlation analysis of the 13 m6A modification regulators in gastric cancer. (C). RNA methylated genes could be clustered into two consistency matrices. (D). The principal component analysis was performed on the expression profile of total mRNA in the TCGA dataset. (E). The Kaplan–Meier curve was used to analyze the overall survival of the two subgroups. (F). The heatmap showed the correlation between the two subgroups and clinicopathological data. |
It was worth pointing out that the positive correlation between HNRNPC and ALTREF, RBM15, and TET3, RBM15, and YTHDF2 need further focused. And the negative relationship between TRMT61A, and TET2, TRMT61A and YTHDC2 also required attention.
We then performed a cluster analysis of 25 genes. Clustering worked best when the consensus matrix was 2 (Figure 3C, Supplement Figure 1). The clustering results were supported by principal component analysis (PCA, Figure 3D). There were also significant differences in survival time between the two groups (Figure 3E). The heatmap exhibited the correlation between the cluster and the clinicopathological characteristics in GC (Figure 3F). It indicated that the methylated gene expression classification is significant for clinical prognosis.
The Prognostic Value of RNA Methylation Regulatory Genes and the Prognostic Prediction Model of GC Based on Two m6A RNA Methylation Regulatory Genes
Based on the expression of the above genes in TCGA, we performed univariate Cox regression analysis to evaluate the prognostic value of these 25 RNA methylated regulators in GC. Thus, we found that two of the 25 factors were firmly related to overall survival (OS). Among them, the Hazard Ration (HR) of FTO was more significant than 1, which was considered as an oncogene. The HR of RBM15 was less than 1, which was a protective gene (Figure 4A).
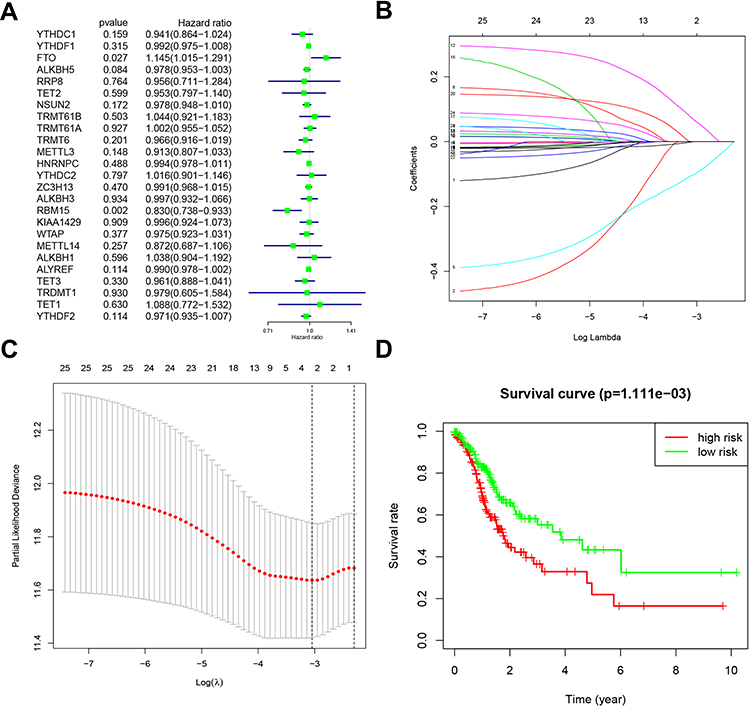 |
Figure 4 Risk signature with 25 RNA methylation regulators. (A). Univariate Cox regression calculated the hazard ratios (HR) and 95% confidence intervals (CI) of RNA methylation regulators. (B). LASSO coefficient values of the 25 RNA methylation regulators in the TCGA cohort. (C). L1-penalty of LASSO-COX regression. The dotted vertical lines at optimal log(Lambda) value: 2. (D). Patients were divided into high-risk and low-risk groups based on risk scores, and survival curves were plotted. |
To minimize the overfitting caused by univariate Cox regression, the least absolute shrinkage and selection operator (LASSO) Cox regression analysis was performed to the 25 RNA methylated-associated gene (Figure 4B). The LASSO model’s result identified two methylated regulators, RBM15 and FTO, which was consistent with univariate Cox regression (Figure 4C). So, we obtained 2-gene combination prognostic model for GC patients: “Risk score = −0.101 x RBM15 + 0.066 x FTO”. Then we conducted the Kaplan Meier plotter to verify the prognostic values of the Risk score model, and the median was set as the cut-off value. The results showed that GC patients with high-Risk scores had a bad prognosis (Figure 4D, P<0.01), which was enhanced the reliability of our results.
We used the ROC (Receiver Operating Characteristic) to assess the risk prediction model’s role in predicting survival. The Area under the curve (AUC) was 0.714 (Figure 5A). It suggested that the model was of great value in predicting the prognosis of GC patients. We then assessed the relevance of the Risk model to the clinical data. Unsurprisingly, the model was closely related to T stage (P<0.001), N stage (P<0.001), M stage (P<0.05), TNM stage (P<0.001), and prognosis (P<0.05, Figure 5B). We combined this model with clinical data to establish a univariate Cox regression analysis. The tumor stage, T stage, N stage, M stage, and TNM stage were all adverse prognostic factors for GC, but the Risk low was a protective factor (Figure 5C). And these five factors were extracted for Multivariate Cox regression analysis. The forest plot showed that Risk low was an independent risk factor for poor prognosis in GC (Figure 5D). This series of analyses proved the clinical significance of the risk model.
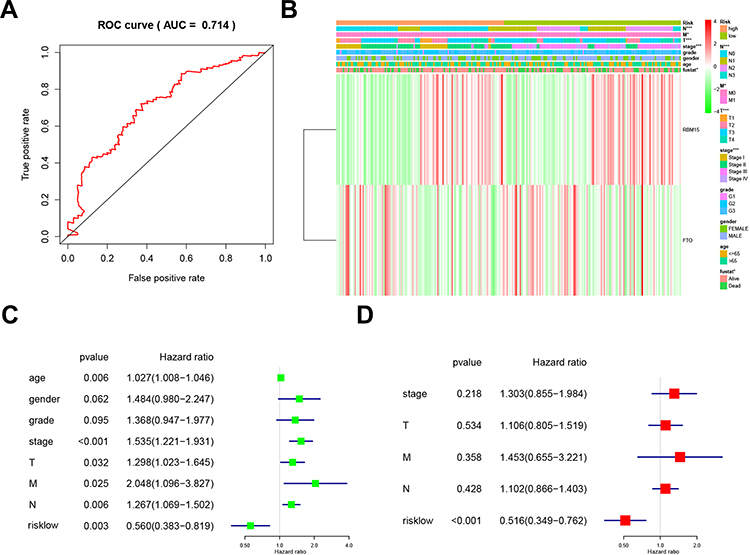 |
Figure 5 Relationship between risk prediction model and clinicopathological features and prognostic value. (A). The ROC curve evaluates the predictive efficiency of the risk prediction model. (B). Heatmap showed the expression of two m6A RNA methylation regulators in GC. The distribution of clinicopathological features was compared between high-risk and low-risk groups. (C). Univariate Cox regression analysis of clinicopathological factors and risk score associated with OS. (D). Univariate Cox regression analysis of clinicopathological factors and risk score associated with OS. |
The Expression of RBM15 and FTO in Gastric Cancer Cells and Tissue Samples
We then tested the expression of RBM15 and FTO in GC cells. The RT-PCR result exhibited that FTO was overexpressed in all GC cells compared to it in GES-1 (Figure 6A). On the contrary, RBM15 was weak-expressed in GC cells (Figure 6B). Similarly, the mRNA of FTO was up-regulated in 128 GC patients; the mRNA of RBM15 was down-regulated (Figure 6C and D). The IHC was performed to evaluate the protein level of FTO and RBM15 in GC tissue and adjacent tissue. Consistent with RT-PCR results, the expression of FTO expression in cancer tissues was significantly higher than in adjacent tissues (Figure 6E a and b). Besides, RBM15 was highly expressed in adjacent tissues and weakly expressed in cancer tissues (Figure 6E c and d).
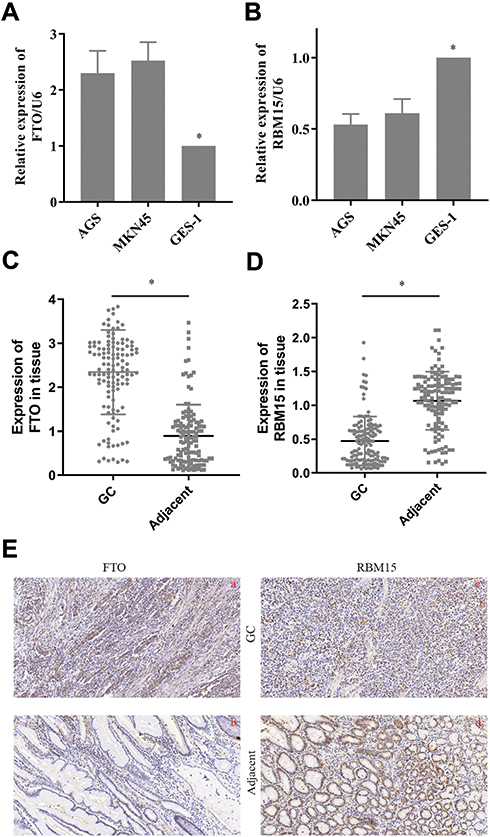 |
Figure 6 The expression of FTO and RBM15 in GC cells and tissue. (A). FTO was overexpressed in GC cells. (B). RBM15 was weak-expressed in GC cells. (C). FTO was overexpressed in GC tissue. (D). RBM15 was weak-expressed in GC tissue. (E). Typical IHC images showed FTO was overexpressed in GC tissues and weakly expressed in para-cancer groups (a vs b). Typical IHC images showed RBM15 was weak-expressed in GC tissues and overexpressed in para-cancer groups (c vs d). Magnifications are 200×. Data are shown as the mean±SD, n=3. The Student’s t-test assessed the statistical significance of the data. *P<0.05. |
In the following survival analysis, we mainly used the mRNA expression of FTO and RBM15 in GC for evaluation. The first reason was that RNA expression in transcriptome data was mainly used in our prediction process (Median= −0.0391). And the other reason was that the coefficients such as −0.101 and 0.066 were relatively small, if the IHC score was used for calculation, a good distinction may not be formed.
Validation of the Prognostic Performance of the FTO-RBM15 Combination
Then we enrolled 128 patients to verify the effectiveness of the FTO-RBM15 combination risk prediction model. The disease free survival (DFS) range 5–85 months, overall survival (OS) range 7–85 months, a total of 75 (58.6%) patients died and 6 (5%) were lost to follow-up. The bormann type, tumor size, tumor differentiation, TNM, Risk model were all associated with the poor DFS and OS (Table 1, P<0.05). The DFS between Risk-low and Risk-high was 46.60 months vs 35.96 months (Figure 7A). The difference between OS was 51.15 months vs 42.67 months (Figure 7B).
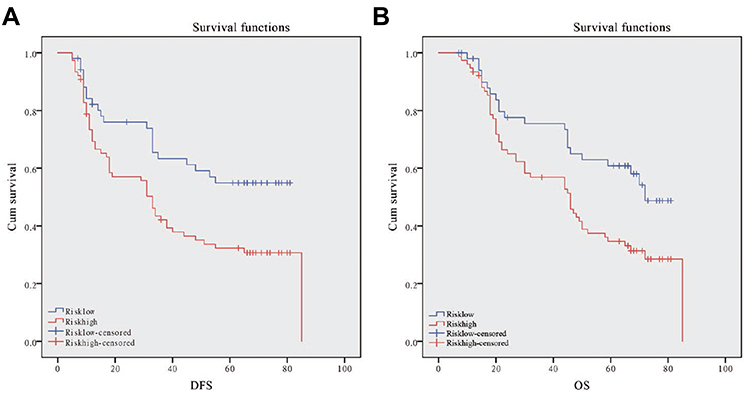 |
Figure 7 Kaplan-Meier DFS and OS curve for GC patients in the high-risk and low-risk group. (A): Disease-free survival curves stratified by risk signature. (B): Overall survival curves stratified by risk signature. |
The mentioned clinicopathologic characteristics with statistical differences were included in the multivariate analysis. Both of the TNM stage (DFS: P=0.00, HR=83.14, 95% CI: 18.74–368.83; OS: P=0.00, HR=70.28, 95% CI: 19.33–255.58, Table 2) and Risk model (DFS: P=0.04, HR=1.63, 95% CI: 1.01–2.67; OS: P=0.03, HR=1.88, 95% CI: 1.14–3.09, Table 2) contributed to the poor survival of GC.
Discussion
More and more research has been devoted to elucidating the genetic and epigenetic mechanisms involved in the progression of GC, but the pathogenesis of GC is still not fully understood.11 With the continuous progress of sequencing technology, it was widely accepted that RNA in gene expression, genome stability, and defense against foreign genetic elements.12 RNA modifications, which could be inherited and dynamic throughout life, was a research area of great concern.13 So far, there were more than 140 kinds of RNA modifications. These modifications were not only related to structural RNA (tRNA and rRNA),14 but also affected the transcription and expression of information carrier RNA (mRNA and noncoding RNA).15 Among them, the RNA m6A, m1A, and m5C modification had been studied most deeply. And all of them were firmly related to the occurrence and development of GC.16,17
In the present study, we checked the expression of “writer,” “reader,” and “eraser” of RNA m6A, m1A, and m5C modification in GC and normal tissue. And twenty-one RNA methylation regulators were abnormally expressed in GC tissue: TRMT61A, ALKBH1, HNRNPC, ALYREF, RRP8, TRMT61B, KIAA1429, RBM15, TET3, YTHDF2, NSUN2, YTHDF1, TRMT6, TRDMT1, METTL3, WTAP, YTHDC2, YTHDC1, METTL14, ZC3H13, and FTO. Among them, all factors except RBM15 were overexpressed in the tumor and play as an oncogene role. Through a series of bioinformatics analysis of the TCGA database, we obtained a prognostic risk prediction model for GC based on two m6A RNA methylation regulatory genes, RBM15 and FTO.
Patients were divided into the high and low groups based on the expression levels of the RBM15 and FTO. The data from both the training and validation sets showed that the model had practical prognostic efficacy. The survival time of the Risk-high group was significantly shortened.
m6A is the most extensive mRNA and ncRNA modification in eukaryotes and involved in various biological processes.18,19 m6A could be installed by the nuclear methyltransferase complex, the “writer,” and uninstall by FTO and ALKBH5, the “eraser.” As a dioxygenase, FTO requires vitamin C to have sufficient catalytic activity.20 In addition, FTO is significantly associated with metabolic disease, which is different from ALKBH5. Zhi et al highlighted the potential of the FTO/m6A/MYC axis in the targeted epigenetic modification treatment of GC.21 The overexpressed FTO reduced m6A modification and promoted the activation of the Wnt/PI3K-Akt pathway, thus participates in the malignant phenotype of GC.22 Furthermore, FTO was also contributed to the occurrence and prognosis of GC.23
RBM15 is a member of the Split Ends (SPEN) family who is conserved RNA-binding proteins. The family is closely related to the transcriptional regulation of NOTCH, WNT, and MAPK signal pathways.24 m6A methylation mediated by RBM15 is critical for XIST-mediated X chromosome inactivation.25 In RBM15 knockout mouse, it showed that RBM15 played an essential role in developing of a variety of tissues, especially in the maintenance of long-term hematopoietic stem cell homeostasis and the differentiation of megakaryon and B cells.26,27 In addition, it also contributed to chromosomal translocation in acute megakaryocytic leukemia.28 However, so far, there have been no reports on the mechanism of RBM15 involvement in the malignant phenotype of GC.
At present, the epigenetics of RNA is attracting more and more attention and has gradually become an attractive research field. Many studies had established prognostic models based on the expression of m6A regulatory genes in multiple tumors. Although m6A was the most intensively studied, other RNA methylation modifiers could not be ignored. Then we extend the previous study. In the present study, we analyzed the expression of methylation regulators related to m6A, m5C, and m1A in GC, and discussed their correlation with clinical prognosis. This is the first study to include as many RNA methylation-related factors as possible. We found that risk models based on FTO and RBM15 had crucial clinical significance for predicting GC’s prognosis. It may bring new ideas for the follow-up targeted therapy of gastric cancer. In addition, LASSO is a kind of regression analysis introduced in statistics and machine learning.29,30 It effectively minimizes the overfitting caused by Univariate COX regression.31,32 LASSO improved the prediction accuracy and interpretability through variable selection and regularization. The LASSO regression evaluation process included relationship to ridge regression, best subset selection, the connections between lasso coefficient estimates, and soft thresholding.33,34 Besides, the mechanisms of FTO and RBM15 in GC still need to be actively explored. Other RNA methylases need to be identified.
Clinicians can obtain the expression levels of FTO and RBM15 in tissue samples respectively by RT-PCR and calculate the corresponding risk values (Risk score = −0.101 x RBM15 + 0.066 x FTO). And then it can evaluate the prognosis of patients. Besides, we can visualize the model and other related risk factors to assess the modification’s effectiveness in future clinical work.
Ethical Approval and Consent
All patients included in the study signed informed consent forms before surgery at the Liaoning Province Cancer Hospital & Institute. The study protocol was approved by the Faculty of Science Ethics Committee at Liaoning Cancer Hospital & Institute (Cancer Hospital of China Medical University)(20181226). All participants provided expressed consent for publication of their details. All personal information has been made anonymous.
Author Contributions
All authors made substantial contributions to conception and design, acquisition of data, or analysis and interpretation of data; took part in drafting the article or revising it critically for important intellectual content; agreed to submit to the current journal; gave final approval of the version to be published; and agree to be accountable for all aspects of the work.
Funding
Cancer Research Program of National Cancer Center (NCC2017A14); Medical-Industrial Cross research Fund (LD202025, LD202027)
Disclosure
No potential conflicts of interest were disclosed by the authors for this work.
References
1. Siegel RL, Miller KD, Jemal A. Cancer statistics, 2020. CA Cancer J Clin. 2020;70(1):7–30. doi:10.3322/caac.21590
2. Chen W, Zheng R, Baade PD, et al. Cancer statistics in China, 2015. CA Cancer J Clin. 2016;66(2):115–132. doi:10.3322/caac.21338
3. Van Cutsem E, Sagaert X, Topal B, et al. Gastric cancer. Lancet. 2016;388(10060):2654–2664. doi:10.1016/S0140-6736(16)30354-3
4. Liebers R, Rassoulzadegan M, Lyko F. Epigenetic regulation by heritable RNA. PLoS Genet. 2014;10(4):e1004296. doi:10.1371/journal.pgen.1004296
5. Davalos V, Blanco S, Esteller M. SnapShot: messenger RNA Modifications. Cell. 2018;174(2):498. doi:10.1016/j.cell.2018.06.046
6. Liu N, Pan T. N6-methyladenosine-encoded epitranscriptomics. Nat Struct Mol Biol. 2016;23(2):98–102. doi:10.1038/nsmb.3162
7. Zhang J, Guo S, Piao HY, et al. ALKBH5 promotes invasion and metastasis of gastric cancer by decreasing methylation of the lncRNA NEAT1. J Physiol Biochem. 2019;75(3):379–389. doi:10.1007/s13105-019-00690-8
8. Sanchez-Vasquez E, Alata Jimenez N, Vazquez NA, et al. Emerging role of dynamic RNA modifications during animal development. Mech Dev. 2018;154:24–32. doi:10.1016/j.mod.2018.04.002
9. Piao HY, Guo S, Wang Y, et al. Long noncoding RNA NALT1-induced gastric cancer invasion and metastasis via NOTCH signaling pathway. World J Gastroenterol. 2019;25(44):6508–6526. doi:10.3748/wjg.v25.i44.6508
10. Zhang J, Wu Y, Lin YH, et al. Prognostic value of hypoxia-inducible factor-1 alpha and prolyl 4-hydroxylase beta polypeptide overexpression in gastric cancer. World J Gastroenterol. 2018;24(22):2381–2391. doi:10.3748/wjg.v24.i22.2381
11. Raimondi A, Nichetti F, Peverelli G, et al. Genomic markers of resistance to targeted treatments in gastric cancer: potential new treatment strategies. Pharmacogenomics. 2018;19(13):1047–1068. doi:10.2217/pgs-2018-0077
12. Houri-Zeevi L, Rechavi OA. Matter of Time: small RNAs Regulate the Duration of Epigenetic Inheritance. Trends Genet. 2017;33(1):46–57. doi:10.1016/j.tig.2016.11.001
13. Roundtree IA, Evans ME, Pan T, et al. Dynamic RNA Modifications in Gene Expression Regulation. Cell. 2017;169(7):1187–1200. doi:10.1016/j.cell.2017.05.045
14. Zhang X, Cozen AE, Liu Y, et al. Small RNA Modifications: integral to Function and Disease. Trends Mol Med. 2016;22(12):1025–1034. doi:10.1016/j.molmed.2016.10.009
15. Delaunay S, Frye M. RNA modifications regulating cell fate in cancer. Nat Cell Biol. 2019;21(5):552–559. doi:10.1038/s41556-019-0319-0
16. Mei L, Shen C, Miao R, et al. RNA methyltransferase NSUN2 promotes gastric cancer cell proliferation by repressing p57(Kip2) by an m(5)C-dependent manner. Cell Death Dis. 2020;11(4):270. doi:10.1038/s41419-020-2487-z
17. Yue B, Song C, Yang L, et al. METTL3-mediated N6-methyladenosine modification is critical for epithelial-mesenchymal transition and metastasis of gastric cancer. Mol Cancer. 2019;18(1):142. doi:10.1186/s12943-019-1065-4
18. Dominissini D, Moshitch-Moshkovitz S, Schwartz S, et al. Topology of the human and mouse m6A RNA methylomes revealed by m6A-seq. Nature. 2012;485(7397):201–206.
19. Shi H, Wei J, Where HC. When, and How: context-Dependent Functions of RNA Methylation Writers, Readers, and Erasers. Mol Cell. 2019;74(4):640–650. doi:10.1016/j.molcel.2019.04.025
20. Jia G, Fu Y, Zhao X, et al. N6-methyladenosine in nuclear RNA is a major substrate of the obesity-associated FTO. Nat Chem Biol. 2011;7(12):885–887. doi:10.1038/nchembio.687
21. Yang Z, Jiang X, Zhang Z, et al. HDAC3-dependent transcriptional repression of FOXA2 regulates FTO/m6A/MYC signaling to contribute to the development of gastric cancer. Cancer Gene Ther. 2020. doi:10.1038/s41417-020-0193-8
22. Zhang C, Zhang M, Ge S, et al. Reduced m6A modification predicts malignant phenotypes and augmented Wnt/PI3K-Akt signaling in gastric cancer. Cancer Med. 2019;8(10):4766–4781. doi:10.1002/cam4.2360
23. Xu D, Shao W, Jiang Y, et al. FTO expression is associated with the occurrence of gastric cancer and prognosis. Oncol Rep. 2017;38(4):2285–2292. doi:10.3892/or.2017.5904
24. Nagel S, Venturini L, Przybylski GK, et al. NK-like homeodomain proteins activate NOTCH3-signaling in leukemic T-cells. BMC Cancer. 2009;9(1):371. doi:10.1186/1471-2407-9-371
25. Patil DP, Chen CK, Pickering BF, et al. m(6)A RNA methylation promotes XIST-mediated transcriptional repression. Nature. 2016;537(7620):369–373. doi:10.1038/nature19342
26. Xiao N, Laha S, Das SP, et al. Ott1 (Rbm15) regulates thrombopoietin response in hematopoietic stem cells through alternative splicing of c-Mpl. Blood. 2015;125(6):941–948. doi:10.1182/blood-2014-08-593392
27. Raffel GD, Chu GC, Jesneck JL, et al. Ott1 (Rbm15) is essential for placental vascular branching morphogenesis and embryonic development of the heart and spleen. Mol Cell Biol. 2009;29(2):333–341. doi:10.1128/MCB.00370-08
28. Mercher T, Coniat MB, Monni R, et al. Involvement of a human gene related to the Drosophila spen gene in the recurrent t(1;22) translocation of acute megakaryocytic leukemia. Proc Natl Acad Sci U S A. 2001;98(10):5776–5779. doi:10.1073/pnas.101001498
29. Santosa F, Symes WW. Linear Inversion of Band-Limited Reflection Seismograms. J Cancer. 1986;7(4):1307–1330.
30. Tibshirani R. Regression Shrinkage and Selection via the Lasso. J Royal Statistical Soc Series B. 1996;58(1):267–288. doi:10.1111/j.2517-6161.1996.tb02080.x
31. Yin XH, Yu LP, Zhao XH, et al. Development and validation of a 4-gene combination for the prognostication in lung adenocarcinoma patients. J Cancer. 2020;11(7):1940–1948. doi:10.7150/jca.37003
32. Yang Z, Shang J, Li N, et al. Development and validation of a 10-gene prognostic signature for acute myeloid leukaemia. J Cell Mol Med. 2020;24(8):4510–4523. doi:10.1111/jcmm.15109
33. Tibshirani R. The lasso method for variable selection in the Cox model. Stat Med. 1997;16(4):385–395. doi:10.1002/(SICI)1097-0258(19970228)16:4<385::AID-SIM380>3.0.CO;2-3
34. Liu Y, Wu WH, Hong S, et al. Lasso Proteins: modular Design, Cellular Synthesis and Topological Transformation. Angew Chem Int Ed Engl. 2020;2:125.
 © 2020 The Author(s). This work is published and licensed by Dove Medical Press Limited. The full terms of this license are available at https://www.dovepress.com/terms.php and incorporate the Creative Commons Attribution - Non Commercial (unported, v3.0) License.
By accessing the work you hereby accept the Terms. Non-commercial uses of the work are permitted without any further permission from Dove Medical Press Limited, provided the work is properly attributed. For permission for commercial use of this work, please see paragraphs 4.2 and 5 of our Terms.
© 2020 The Author(s). This work is published and licensed by Dove Medical Press Limited. The full terms of this license are available at https://www.dovepress.com/terms.php and incorporate the Creative Commons Attribution - Non Commercial (unported, v3.0) License.
By accessing the work you hereby accept the Terms. Non-commercial uses of the work are permitted without any further permission from Dove Medical Press Limited, provided the work is properly attributed. For permission for commercial use of this work, please see paragraphs 4.2 and 5 of our Terms.