")
Back to Journals » Journal of Inflammation Research » Volume 15
TNF-α and IL-1β Promote Renal Podocyte Injury in T2DM Rats by Decreasing Glomerular VEGF/eNOS Expression Levels and Altering Hemodynamic Parameters
Authors Wang J , Feng Y , Zhang Y, Liu J , Gong L , Zhang X , Liao H
Received 6 October 2022
Accepted for publication 30 November 2022
Published 9 December 2022 Volume 2022:15 Pages 6657—6673
DOI https://doi.org/10.2147/JIR.S391473
Checked for plagiarism Yes
Review by Single anonymous peer review
Peer reviewer comments 2
Editor who approved publication: Professor Ning Quan
Jufang Wang,1 Yating Feng,2 Yan Zhang,3 Jing Liu,2 Le Gong,2 Xiaohong Zhang,1 Hui Liao4
1Department of Ultrasonic Diagnosis, Fifth Hospital of Shanxi Medical University (Shanxi Provincial People’s Hospital), Taiyuan, People’s Republic of China; 2School of Pharmacy, Shanxi Medical University, Taiyuan, People’s Republic of China; 3Department of Nephrology, Fifth Hospital of Shanxi Medical University (Shanxi Provincial People’s Hospital), Taiyuan, People’s Republic of China; 4Department of Pharmacy, Fifth Hospital of Shanxi Medical University (Shanxi Provincial People’s Hospital), Taiyuan, People’s Republic of China
Correspondence: Xiaohong Zhang, Department of Ultrasonic Diagnosis, Fifth Hospital of Shanxi Medical University (Shanxi Provincial People’s Hospital), Taiyuan, People’s Republic of China, Email [email protected] Hui Liao, Department of Pharmacy, Fifth Hospital of Shanxi Medical University (Shanxi Provincial People’s Hospital), No. 29 Shuangtasi Street, Taiyuan, Shanxi Province, People’s Republic of China, Email [email protected]
Purpose: Diabetic nephropathy (DN) is a serious microvascular complication in those with type 2 diabetes mellitus (T2DM). Evidence confirms that serum tumor necrosis factor-α (TNF-α) and interleukin-1β (IL-1β) in the T2DM stage are proposed as prognostic markers for DN development, but it is unclear how they affect renal podocyte-associated nephrin and WT-1 expression. In the presence of podocyte injury, glomerular vascular endothelial growth factor (VEGF), endothelial nitric oxide synthase (eNOS) and hemodynamic parameters are dysregulated. The current research aimed to clarify the relationship of TNF-α and IL-1β with podocyte injury by altering VEGF/eNOS expression and hemodynamic parameters.
Methods: A high-fat diet/streptozotocin-induced DN rat model was established. Serum TNF-α and IL-1β levels were tracked in the pre-T2DM, T2DM and DN stages. In the DN stage, the mRNA and protein expression levels of renal TNF-α, IL-1β, VEGF, eNOS, nephrin and WT-1 were studied. Renal hemodynamic parameters, including peak systolic velocity, end-diastolic flow velocity and mean velocity were measured with a color Doppler ultrasound technique.
Results: Compared to those in the normal control (CTL) group, serum TNF-α and IL-1β levels increased significantly in the pre-T2DM stage (obesity, insulin resistance and hyperlipidemia), T2DM stage (hyperglycemia) and DN stage (abnormal renal functions) (all: P < 0.05) in the DN group. Serum TNF-α and IL-1β levels in the T2DM stage were significantly higher than those in the pre-T2DM stage (two: P < 0.05). Compared to the CTL group, renal nephrin, WT-1, TNF-α, IL-1β, eNOS and VEGF expression and hemodynamic parameters in the DN stage all showed significant differences separately (all: P < 0.05).
Conclusion: Increased serum and renal TNF-α and IL-1β levels played important roles in reducing renal nephrin and WT-1 expression levels, which may be related to the fact that the former affected renal VEGF/eNOS expression and blood flow parameters in the DN rats.
Keywords: TNF-α, IL-1β, podocyte injury, vascular endothelial growth factor, endothelial nitric oxide synthase, hemodynamic parameters
Introduction
According to the International Diabetes Federation, the number of adults diagnosed with diabetes increased 1.62-fold to 463 million in 2019 compared to 2009, and 95% of those were people with type 2 diabetes mellitus (T2DM).1 T2DM is a chronic syndrome that includes obesity, insulin resistance (IR), impaired glucose metabolism and dyslipidemia and is clinically characterized by a set of vascular risk factors.2 As one of the most common microvascular complications in DM patients, diabetic nephropathy (DN) is characterized by a progressive decline in renal function, including abnormalities in serum creatinine (SCr), blood urea nitrogen (BUN), and 24 h urinary total protein (24h-UP) levels and the estimated glomerular filtration rate (eGFR).3
During the development of DN, inflammatory processes play an important role in damaging the kidney.4 Clinical studies have confirmed that serum inflammation markers such as tumor necrosis factor-α (TNF-α) and interleukin-1β (IL-1β) have been proposed as prognostic markers for the development of T2DM and its complications.5 Five clinical studies of 3316 subjects also suggested that circulating TNF receptors are independently associated with a higher risk of renal disease progression and mortality in patients with diabetes and might contribute to clinical risk assessment in the future.6
On the other hand, the pathological state of DN further amplifies the activation of the inflammatory cascade, with significant effects on vascular structure, function and hemodynamics.7 Studies on DN have identified complex interactions among various players, including inflammation, microvascular remodeling and abnormal hemodynamics.8 A question of interest to us is when circulating inflammatory factors begin their journey regarding the DN process and when they become involved in microvascular abnormalities and podocyte injury.
Thus, we established a progressive renal function decline rat model induced with a high-fat diet (HFD)/streptozotocin (STZ) according to our previous study.9 In the current manuscript, serum TNF-α and IL-1β levels were tracked in the pre-T2DM, T2DM and DN stages in HFD/STZ-induced rats. When abnormal SCr, BUN and 24h-UP levels were observed in the DN stage, renal TNF-α and IL-1β expression levels, glomerular endothelial nitric oxide synthase (eNOS) and vascular endothelial growth factor (VEGF) expression levels, and renal podocyte-associated nephrin and WT-1 expression levels were compared. Additionally, renal Doppler ultrasound (RDUS) was used to detect the hemodynamics of the main renal artery, segmental arteries and interlobar arteries. This research may increase the knowledge of the roles of TNF-α and IL-1β in DN processes and provide a comprehensive understanding of circulating inflammation, microvascular abnormalities and podocyte injury.
Materials and Methods
Animals
Sprague–Dawley rats (5 weeks old, male) were purchased from the Experimental Animal Center of Shanxi Province Key Laboratory of Kidney Disease (Taiyuan, China). All animal experimental procedures were performed in accordance with the guidelines of the Ethical Committee for the Experimental Use of Animals at Shanxi Provincial People’s Hospital (Approval No. 2021–121). The rats were acclimated in a controlled temperature (25 ± 1)°C and humidity (50 ± 5)% and had free access to food and water. After adaptive feeding for one week, the rats were randomly divided into two groups (n = 6 per group).
Pre-T2DM Confirmation
Obesity Confirmation
The rats were fed high-fat chow (Boaigang Biotechnology Company, Beijing, China) for 8 weeks. The energy ratio of the high-fat chow was as follows: 35.5% fat, 20.6% protein and 43.9% carbohydrates. Body weight (BW) was recorded weekly, and obese rats weighed at least 20% more than normal rats.10
IR Confirmation
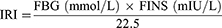
The fasting insulin (FINS) and fasting blood glucose (FBG) levels of the rats were measured, and the insulin resistance index (IRI) was calculated according to the homeostatic model assessment of insulin resistance (HOMA-IR).11
The FINS and FBG were analyzed using Roche ACCU-CHEK Performa (Roche Diabetes Care GmbH, Mannheim, Germany).
Hyperlipidemia Confirmation
Plasma triglyceride (TG) and total cholesterol (TC) were measured with an AU5800 with ISE biochemistry analyzers (Beckman Coulter, Germany).
T2DM Confirmation
After obesity, IR and hyperlipidemia were confirmed, model rats were injected intraperitoneally with a single dose of 35 mg/kg streptozotocin (STZ, Sigma, USA). Rats were identified as successful T2DM models when their random blood glucose (RBG) levels were ≥16.7 mmol/L after 3, 5 and 7 days of STZ injection.12,13 Subsequently, the model rats were fed high-fat chow during STZ injection and for an additional four weeks. RBG was analyzed using Roche ACCU-CHEK Performa (Roche Diabetes Care GmbH, Mannheim, Germany).
DN Confirmation
Each rat was placed in a metabolic cage for 24 h to collect the urine, without food but with water. The 24 h urine volume (UV) was recorded, and the collected urine was stored in a −80°C freezer for later analysis. The 24h-UP and urine creatinine (UCr) levels were measured with commercial kits (Jiancheng Bioengineering Company, Nanjing, China), and the serum SCr and BUN levels14 were determined with AU5800 ISE biochemistry analyzers (Beckman Coulter, Germany).
Based on the UCr, SCr, UV and BW findings, the estimated creatinine clearance (CrCl) value of each rat was measured as follows:15

Normal Control (CTL) Group
CTL rats were fed ordinary chow (Boaigang Biotechnology Company, Beijing, China) for a total of 13 weeks, while DN rats were fed an HFD. The energy ratio of the ordinary chow was as follows: 12.0% fat, 20.6% protein and 67.4% carbohydrates. The rats were given an intraperitoneal injection of buffer solution in an equivalent volume when DN rats were given STZ. The above experimental design is summarized in Figure 1.
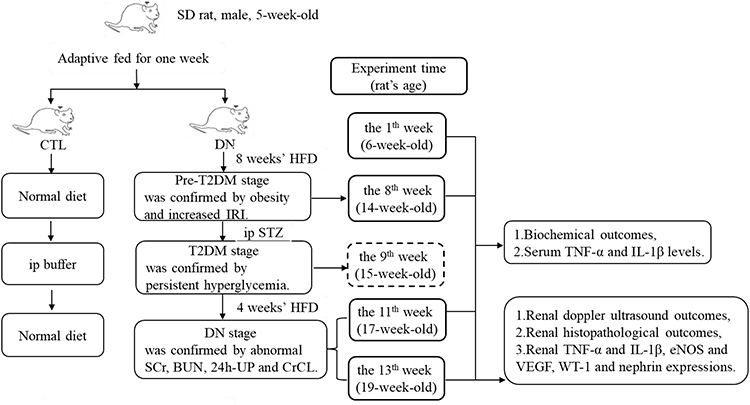 |
Figure 1 Establishment of an HFD/STZ-induced DN rat model. Abbreviations: CTL, normal control; DN, diabetic nephropathy; HFD, high-fat diet; IRI, insulin resistance index; STZ, streptozotocin; DM, diabetes mellitus; T2DM, type 2 diabetes mellitus; TNF-α, tumor necrosis factor-α; IL-1β, interleukin-1β; eNOS, endothelial nitric oxide synthases; VEGF, vascular endothelial growth factor; WT-1, Wilms’ tumor-1; SCr, serum creatinine; BUN, blood urea nitrogen; 24h-UP, 24 h urinary total protein; CrCl, estimated creatinine clearance. |
Determination of Renal Hemodynamic Parameters with RDUS
The RDUS technique, which is considered to be the first clinical imaging technique with the hallmarks of being readily available, safe and noninvasive,16 was used to detect renal hemodynamic parameters of blood flow changes after the DN stage was confirmed.
At the end of the 13th week, the rats were fasted but with water overnight and anesthetized with intraperitoneal injection of 35 mg/kg pentobarbitone sodium (Solarbio Technology Company, Beijing, China) in the morning. Doppler ultrasound examination (MyLab 60 equipment (Esaote, Genova, Italy) with a 4~13 MHz transducer (LA523)) of the left kidney was performed by two experienced sonographers. The examination was performed as follows: the abdomen was depilated and cleaned, and the ultrasonic coupling agent was applied appropriately. To display the kidney well, the sonographer adjusted the probe angle, image depth, gain, and focus. When the color Doppler procedure was activated, the sonographer adjusted the probe angle again so that the main renal artery and intrarenal branches, including segmental arteries and interlobar arteries, were displayed well. Hemodynamic parameters were measured by pulse Doppler with a sampling volume of 0.5 mm and an angle less than 60°.
After obtaining a stable flow spectrum, peak systolic velocity (PSV), end-diastolic flow velocity (EDV) and mean velocity (MV) were measured in the main, segmental and interlobar arteries. The pulsatility index (PI) was calculated based on the above indices.17

The resistive index (RI) was also calculated based on the above indices.18

PSV, EDV and MV were measured three times in each rat, and the mean value was calculated. PI and RI were calculated from the three measurements, and the mean value was taken.
Determination of the Renal Index
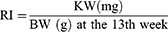
After the rats were sacrificed at the end of the 13th week, the right and left kidneys were weighed together (KW) (JA3003 precision electronic balance, accuracy 0.001 g). The renal index (RI) of each rat was calculated as follows.19
Determination of Serum and Renal TNF-α and IL-1β Levels
At the end of the 4th, 8th, 11th and 13th weeks, the levels of serum TNF-α and IL-1β were measured in sextuplicate. At the end of the experiment, the levels of TNF-α and IL-1β in renal tissue homogenate (100 mg tissue/mL homogenate) were measured in sextuplicate. TNF-α (Lot No. MM-0132M1) and IL-1β ELISA kits (Lot No. MM-0040M1) were purchased from Meimian Industrial Company (Jiangsu, China).
Renal Histological Analysis
The dissected fresh kidney tissue was fixed in neutral formalin buffer (10%) and embedded in paraffin. The embedded tissue was cut into 3 μm sections with a Leica Microtome and stained with periodate-Schiff reagent. Glomerulus morphological changes were observed with a KF-PRO-005-EX digital scanner (Motic, Xiamen, China).
The images were selected randomly in which the glomerulus number was no more than twenty. Each image should have vascular and/or urinary poles. The selected images were analyzed with K-Viewer (1.5.3.1) image analysis software (×400, KFMI, China).
The area without Bowman space was selected, the two longest vertical diameters in μm in each glomerular capillary plexus were measured, and the average value was calculated from the measurements obtained in 10 images. Additionally, the areas of the glomerular mesangial zone and capillary tuft were measured. The relative area of the mesangial zone (%) was calculated according to the formula.20

Renal mRNA Expression Analysis
Thirty milligrams of renal cortical tissue was cut into small pieces on ice. TRIzol reagent (Ambion, USA) was used to extract renal RNA. An RNA-to-cDNA PCR kit (Takara, Beijing, China) was used to reverse transcribe 1 μg of RNA. Rat gene PCR primer sets for nephrin, WT-1, TNF-α, IL-1β, eNOS and VEGF were obtained commercially (SABiosciences, Germantown, MD). The Power SYBR Green PCR Master Mix and the step-one-plus real-time PCR system (Applied Biosystems) were used together.
The protocol included denaturing for 15 min at 95°C and 40 cycles of three-step PCR, including denaturing, annealing, extension, detection and melting. The cDNA samples (25 ng) were analyzed in quadruplicate in parallel with ribosomal protein lateral stalk subunit p1 (RPLP1)/3 controls. Standard curves were then obtained from a series of log dilutions of standard cDNA (threshold 1 cycle vs log 2 pg cDNA, reverse transcribed from rat renal mRNA). Initial quantities of experimental mRNA were then calculated based on the standard curves, and the average was calculated with SA Bioscience software. Normalized to the CTL, the ratio of the above six marker genes to RPLP1/3 mRNA was calculated.
Renal Protein Expression Analysis
Thirty milligrams of rat kidney cortical tissue was cut into small pieces on ice. RIPA lysis buffer (Solarbio Science & Technology, Beijing, China) with 1% protease inhibitor was added at a ratio of 1:10 (mg:μL). The cut tissue was broken by mechanical homogenization and then ultrasonicated for 30s on ice. After the tissue was lysed for 30 min on ice, the mixture was centrifuged at 4°C for 20 min at 12,000 rpm. The protein concentrations were detected with commercial kits (Meimian Industrial Company, Jiangsu, China).
Samples containing 50 μg of protein were detected with sodium dodecyl sulfate‒polyacrylamide gel electrophoresis and transferred to polyvinylidene fluoride membranes in a buffer tank with platinum wire electrodes. The membranes were immersed in nonfat dried milk for 2 h to block nonspecific binding and incubated with a primary antibody against nephrin (catalog no. Ab216341, Abcam, USA) at a 1:2000 dilution, a primary antibody against WT-1 (catalog no. 12609-1-AP) and against eNOS (catalog no. 20116-1-AP, Proteintech, Wuhan, China) at a 1:1000 dilution, and a primary antibody against TNF-α (catalog no. bs-2081R) and against VEGF (catalog no. bs-1313R, Bioss, Beijing, China) and a primary antibody against IL-1β (catalog no. #12242, Cell Signaling Technology, USA) at a 1:1000 dilution at 4°C overnight. The membranes were washed and then incubated with the corresponding secondary IgG conjugated to HRP antibody (catalog no. SA00001-2, Proteintech, Wuhan, China) for 1 h. The results were finally analyzed with the Quantity One analysis system (Bio-Rad, Hercules, CA, USA). GAPDH (catalog no. 10494-1-AP, Proteintech, Wuhan, China) was used as the internal loading control at a 1:5000 dilution.
Statistical Analysis
SPSS 23.0 software (IBM, NY, USA) was used for statistical analysis. All the data are expressed as the mean ± standard deviation. The two-group comparison was conducted with Student’s t-test. All the reported P values were two-tailed, and P < 0.05 was considered to indicate statistical significance.
Results
BW, KW and RI
As shown in Figure 2A, the BW of the DN and CTL groups at the 0th week were not significantly different (P = ns). The BW of the DN group was significantly higher than that of the CTL group at the 4th, 8th, 11th and 13th weeks (Four: P < 0.01). The rats in the DN group were considered obese and weighed 28.4%, 23.5%, 29.7% and 20.6% more than those in the CTL group at the above four testing points.
Figure 2 Continued. Figure 2 Biological parameters of the CTL group and the DN group at the different experimental weeks. (A) BW. (B) KW. (C) RI. (D) FINS. (E) FBG. (F) IRI. (G) RBG. (H) TG. (I) TC. (J) SCr. (K) BUN. (L) 24h-UP. (M) UCr. (N) CrCl. Data were presented as mean ± SD. *P < 0.05, vs the CTL group at the same week. Abbreviations: CTL, normal control; DN, diabetic nephropathy; BW, body weight; KW, kidney weight; RI, renal index; FINS, fasting insulin; FBG, fasting blood glucose; IRI, insulin resistance index; RBG, random blood glucose; TG, triglyceride; TC, total cholesterol; SCr, serum creatinine; BUN, blood urea nitrogen; 24h-UP, 24 h urinary protein; UCr, urea creatinine; CrCl, creatinine clearance.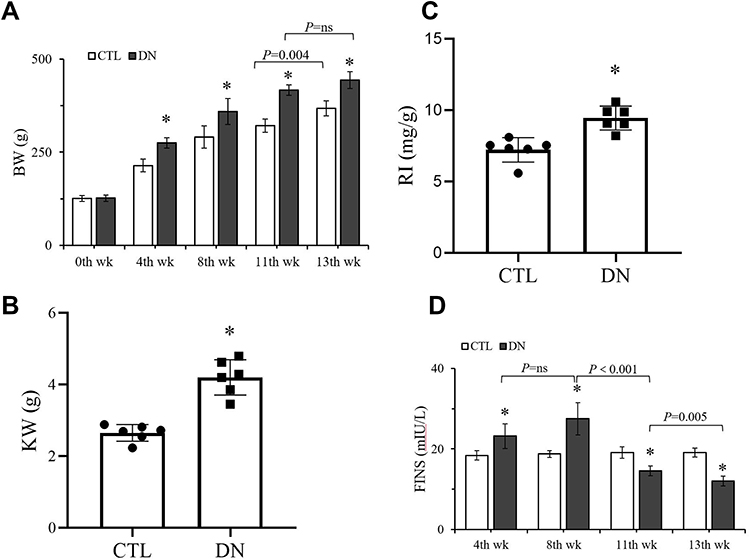
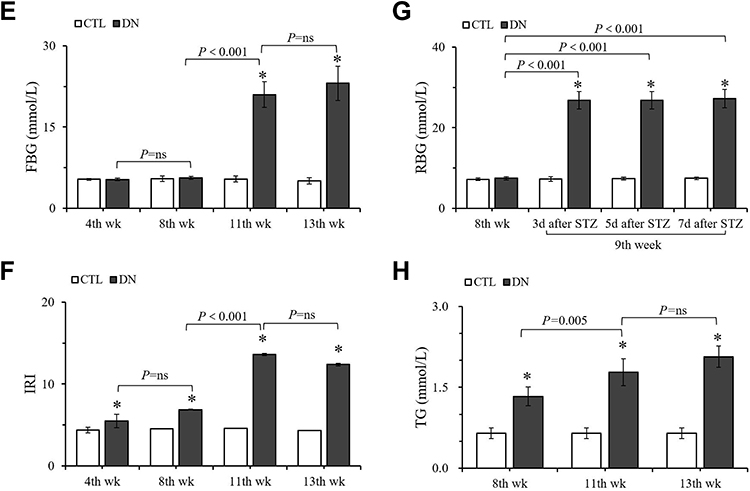
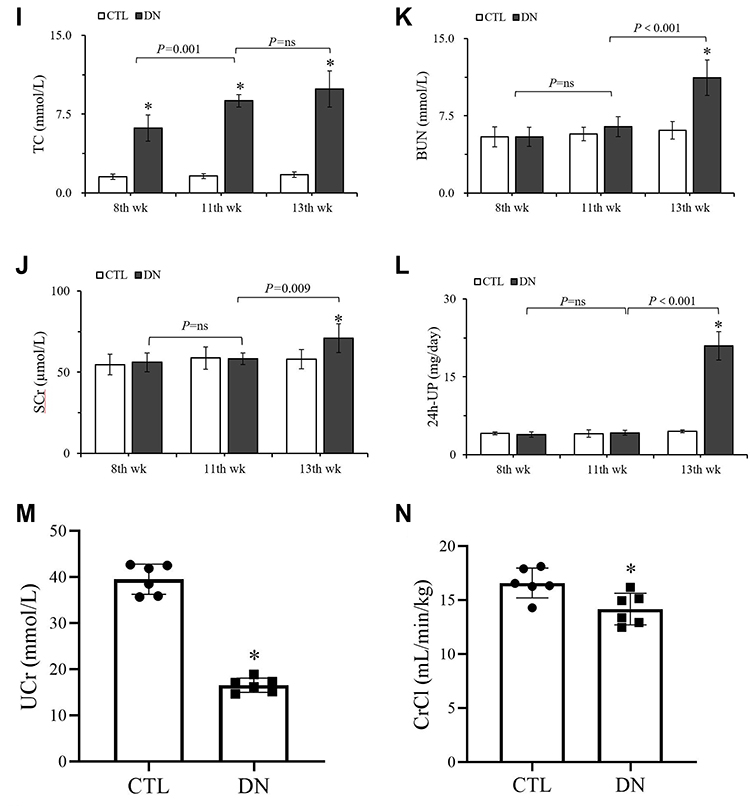
Figure 2B shows that the KW value of the DN group was significantly higher than that of the CTL group (P < 0.01). Figure 2C shows that the RI of the DN group was significantly higher than that of the CTL group (P = 0.001).
The above results showed that an HFD promoted an increase in BW in the DN rats in the first eight weeks and that an HFD combined with STZ further elevated BW, KW and RI in the DN rats in the following experimental weeks.
FINS, FBG, IRI and RBG
The results of FINS, FBG and IRI are shown in Figure 2D–F. After HFD feeding, the FINS of the DN group increased significantly at the 4th and 8th weeks when compared with the CTL group at the same experimental time points (two: P < 0.01). After T2DM confirmation at the 9th week, the FINS of the DN group decreased significantly at the 11th and 13th weeks when compared to the CTL group (two: P < 0.01).
Before STZ injection, the FBG levels of the DN group at the 4th and 8th weeks were not significantly different from those of the CTL group (two: P = ns). After STZ injection, the FBG levels of the DN at the 11th and 13th weeks increased significantly compared to those of the CTL group (two: P < 0.001).
The IRI levels were distinctly higher in the DN group than in the CTL group, which started from the 4th week (P = 0.003) and lasted until the 8th week (P < 0.001), the 11th week (P < 0.001) and the 13th week (P < 0.001).
The RBG results are shown in Figure 2G. No significant differences in the RBGs were seen in the CTL group before and after the rats were given an injection of buffer solution (all: P = ns). After 3 d, 5 d and 7 d of STZ injection, the RBG levels of the DN group were all higher than 16.7 mmol/L12,13,21 and were significantly higher than those before STZ injection (three: P < 0.001).
The above results suggested that an HFD affected normal FINS and IRI values and that the increased persistent RBGs in the DN rats were due to the injection of STZ.
TG and TC
The TG levels of the DN group at the 8th, 11th and 13th weeks were all significantly higher than those of the CTL group at the same experimental week (three: P < 0.001). The TC results showed a similar trend as the TG results. The TCs of the DN group at the above testing weeks were significantly higher than those of the CTL group separately (three: P < 0.001).
Another similar elevated trend in TG and TC could be seen in the DN group in Figure 2H and I. Both TG and TC levels increased significantly at the 11th week compared to the 8th week (two: P < 0.01).
The above results indicated that an HFD combined with STZ promoted significantly high levels of TG and TC in DN rats.
SCr, BUN, 24h-UP, UCr and CrCl Levels
The SCr, BUN and 24h-UP levels of the DN group at the 13th week were significantly higher than those of the CTL group at the 13th week (three: P < 0.05) and those of the DN group at the 11th week (three: P < 0.05). The above results are shown in Figure 2J–L.
At the end of the experiment, the UCr level of the DN group was significantly lower than that of the CTL group (P < 0.001). Similarly, the calculated CrCl level of the DN group ((14.2 ± 1.7) mL/min/kg) was significantly lower than that of the CTL group ((16.6 ± 1.5) mL/min/kg, P = 0.015). The results are shown in Figure 2J–N.
The above results suggested that abnormal renal function occurred as the disease progressed in the T2DM model.
Serum and Renal TNF-α Levels and IL-1β Levels
In the CTL group, serum TNF-α levels in Figure 3A show no significant difference among the 4th, 8th, 11th, and 13th week (all: P = ns). Figure 3B also shows that there was no significant difference in serum IL-1β levels at the above four testing points (all: P = ns).
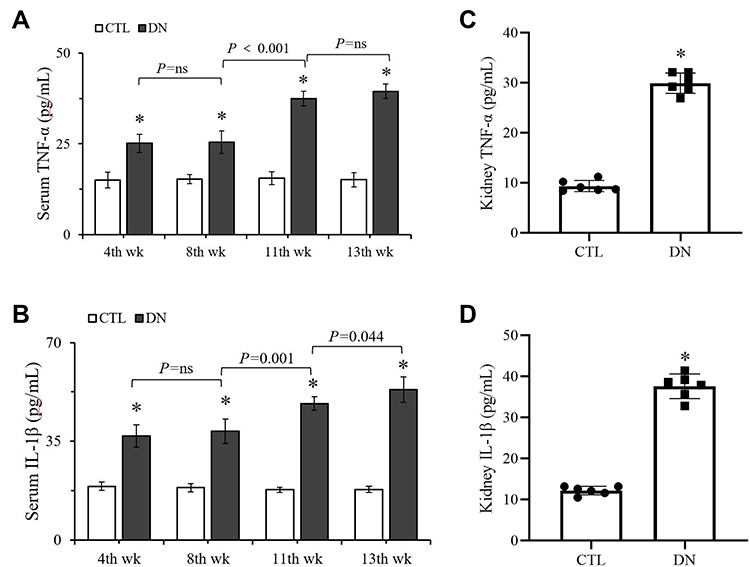 |
Figure 3 Comparison of TNF-α and IL-1β levels in serum and kidney tissue. (A) TNF-α levels in serum. (B) IL-1β levels in serum. (C) TNF-α levels in kidney. (D) IL-1β levels in kidney. Data are expressed as the mean ± standard deviation (n=6). *P < 0.05, vs the CTL group at the same week. Abbreviations: TNF-α, tumor necrosis factor-α; IL-1β, interleukin-1β; CTL, normal control; DN, diabetic nephropathy. |
At the 4th, 8th, 11th and 13th weeks, the serum TNF-α level and serum IL-1β level of the DN group increased significantly when compared to those of the CTL group (eight: P < 0.001).
In the DN group, there was no significant difference in serum TNF-α levels or IL-1β levels between the 4th week and the 8th week (two: P = ns). After STZ injection, both serum TNF-α and IL-1β levels at the 11th week were significantly higher than those at the 8th week (P < 0.001 and P = 0.001). Furthermore, the serum IL-1β level at the 13th week ((53.3 ± 4.6) pg/mL) was significantly higher than that at the 11th week ((48.4 ± 2.4) pg/mL) (P = 0.044).
Kidney TNF-α levels are shown in Figure 3C, and kidney IL-1β levels are shown in 3D. They both showed significant differences from the CTL group (two: P < 0.001).
The above results demonstrated that serum and renal TNF-α and IL-1β levels increased due to HFD feeding and STZ injection.
Renal Hemodynamic Parameters
Figure 4A shows the locations of the main, segmental (including the superior segmental, anterior superior segmental, inferior segmental and anterior inferior segmental) and interlobar arteries of the left kidney.22 Figure 4B and C show the RDUS images of the main artery of the two groups separately, while 4D and 4E show the segmental artery, and 4F and 4G show the interlobar artery.
Figure 4 Continued.
Figure 4 Evaluation of renal hemodynamics of left kidney by color Doppler spectrum ultrasound. (A) Schematic diagram of main artery, segmental artery and interlobar artery. (B) The main artery of the CTL group. (C) The main artery of the DN group. (D) The segmental artery of the CTL group. (E) The segmental artery of the DN group. (F) The interlobar artery of the CTL group. (G) The interlobar artery of the DN group. (H) Comparison of PSV, MV and EDV in the two groups. (I) Comparison of RI and PI in the two groups. All data were obtained from left kidney of rats. Data are expressed as the mean ± standard deviation (n=6). *P < 0.05, comparison in the main artery of the CTL group and the DN group. #P < 0.05, comparison in the interlobar artery of the CTL group and the DN group. Abbreviations: CTL, normal control; DN, diabetic nephropathy; PSV, peak systolic velocity; MV, mean velocity; EDV, end-diastolic velocity; RI, resistive index; PI, pulsation index.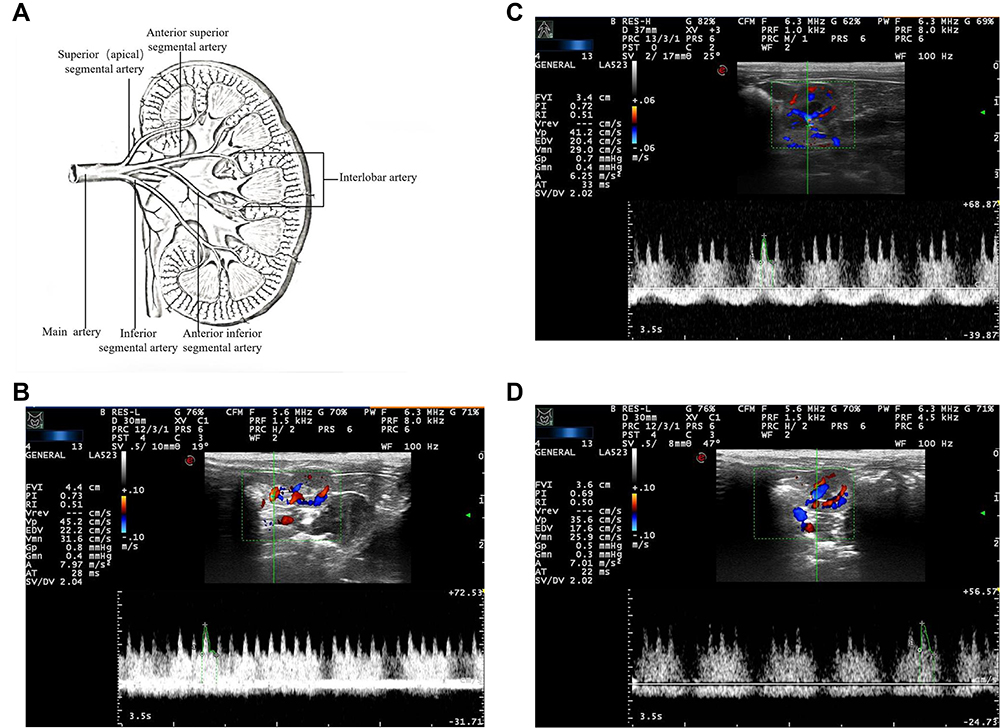
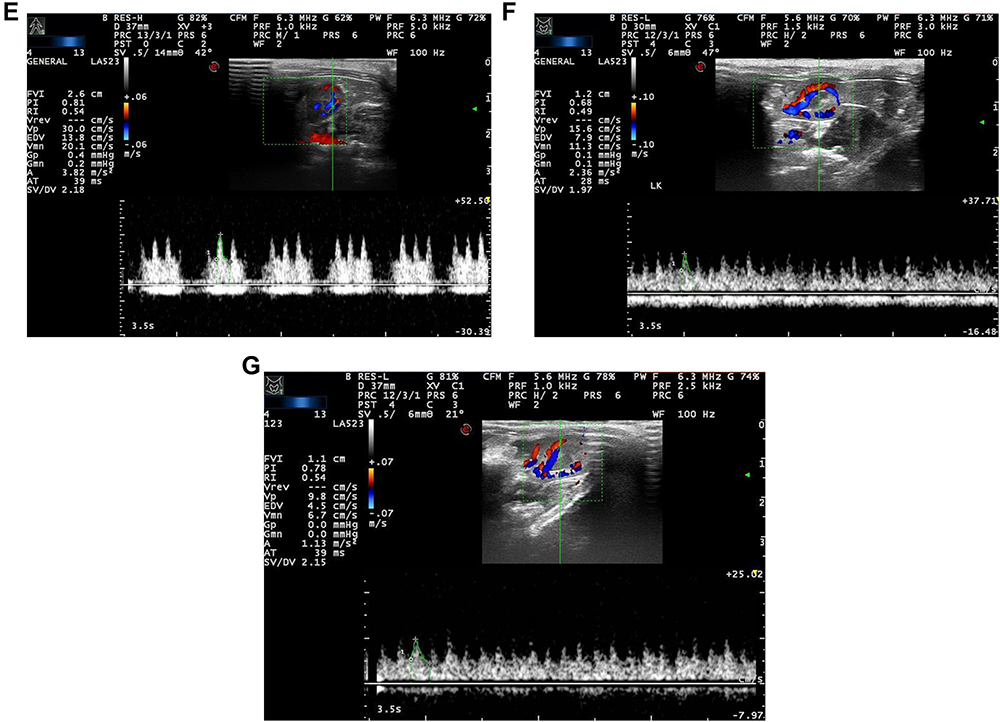
The renal artery hemodynamic parameters of the two groups are compared in Figure 4H. The values of PSV, EDV and MV of the main and interlobar arteries in the DN group were all significantly lower than those in the CTL group (six: P < 0.05). The PSV, EDV, and MV values of the segmental artery in the DN group were also lower than those in the CTL group, but no significant differences were observed (three: P = NS).
As important predictive markers of incipient renal impairment,23 the increased RI and PI values of the interlobar artery in the DN group showed a significant difference compared to those in the CTL group (P = 0.022 and P = 0.025) in Figure 4I. Compared to the CTL group, the RI and PI values in the main and segmental regions of the DN group also increased but had no significant differences (four: P = NS).
The above results suggested abnormal hemodynamics in the kidneys of DN rats.
Histological Results
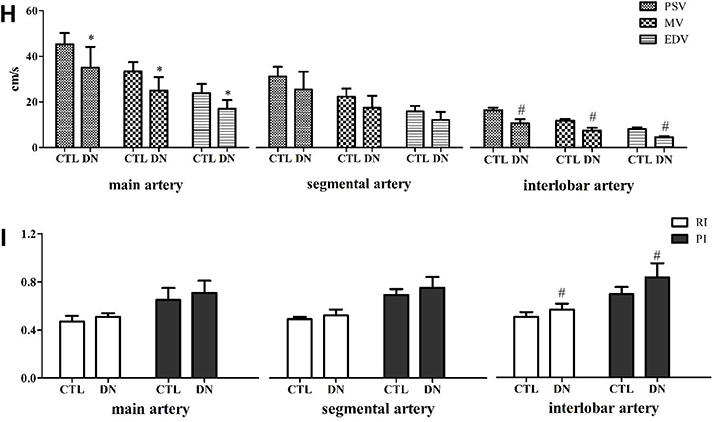
Histopathological glomerulus staining images of the CTL and DN groups are shown in Figure 5A and B, respectively. Compared to Figure 5A, Figure 5B shows obvious glomerular hypertrophy and mesangial matrix expansion in the DN group. The mean glomerular size was significantly larger in the DN group than in the CTL group ((129.1 ± 2.0) μm vs (114.8 ± 1.7) μm, P < 0.001) as shown in Figure 5C. Figure 5D shows that the relative area of the mesangial zone in the DN group increased significantly compared to that in the CTL group ((7.3 ± 0.4) % vs (3.8 ± 0.2) %, P < 0.001).
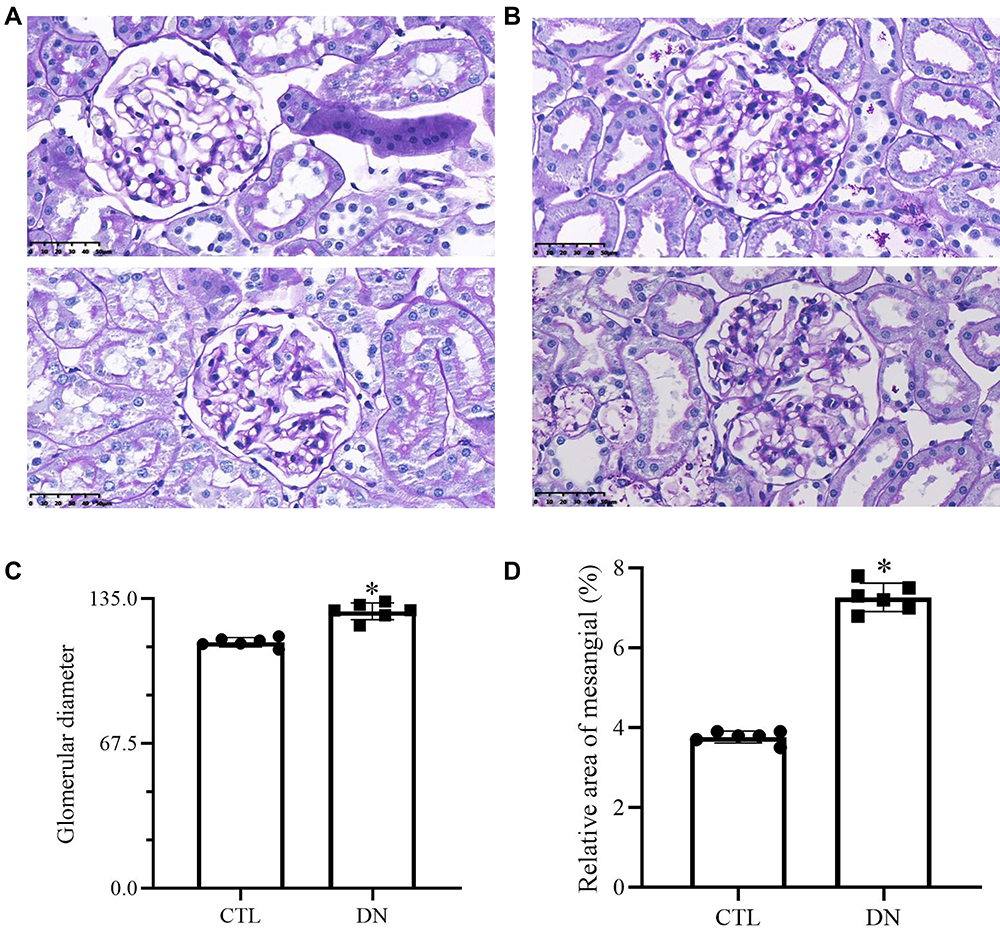 |
Figure 5 Histological results with light microscopy (×400). (A) Glomerulus of the CTL group. (B) Glomerulus of the DN group. (C) Comparison of the glomerular diameter. (D) Comparison of the relative area of mesangial. All data were obtained from left kidney of rats. Data are expressed as the mean ± standard deviation (n=6). *P < 0.05, vs the CTL group. Abbreviations: CTL, normal control; DN, diabetic nephropathy. |
The above results suggested that the glomerular structure of the kidneys in the DN rats was abnormal.
Renal mRNA and Protein Expression Levels
Figure 6A and B show the mRNA expression levels of renal nephrin and WT-1. They both decreased significantly in the DN group compared to the CTL group (two: P < 0.01). In contrast, the TNF-α and IL-1β levels as illustrated in Figure 6C and D, respectively, increased significantly in the DN group compared to the CTL group (P = 0.002 and P < 0.001). The mRNA expression levels of eNOS (Figure 6E) and VEGF (Figure 6F) in the DN group were significantly decreased compared to those in the CTL group (two: P < 0.01).
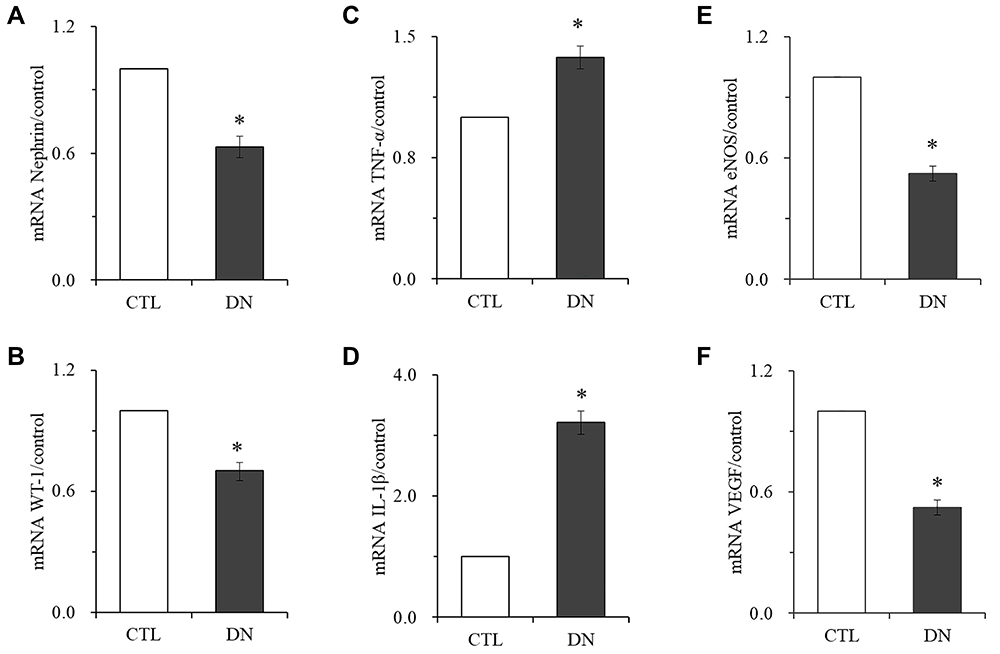 |
Figure 6 Comparison of Nephrin, WT-1, TNF-α, IL-1β, eNOS and VEGF mRNA expression levels of kidney. (A) Nephrin expressions. (B) WT-1 expressions. (C) TNF-α expressions. (D) IL-1β expressions. (E) eNOS expressions. (F) VEGF expressions. Data are expressed as the mean ± standard deviation (n=6). *P < 0.05, vs the CTL group. Abbreviations: CTL, normal control; DN, diabetic nephropathy; WT-1, Wilms’ tumor-1; TNF-α, tumor necrosis factor-α; IL-1β, interleukin-1β; eNOS, endothelial nitric oxide synthases; VEGF, vascular endothelial growth factor. |
Compared to the CTL group, nephrin, WT-1, eNOS and VEGF protein expression levels in the DN group decreased significantly (four: P < 0.05), while the TNF-α and IL-1β levels increased significantly (two: P < 0.05). The protein expression results are shown in Figure 7A‒D.
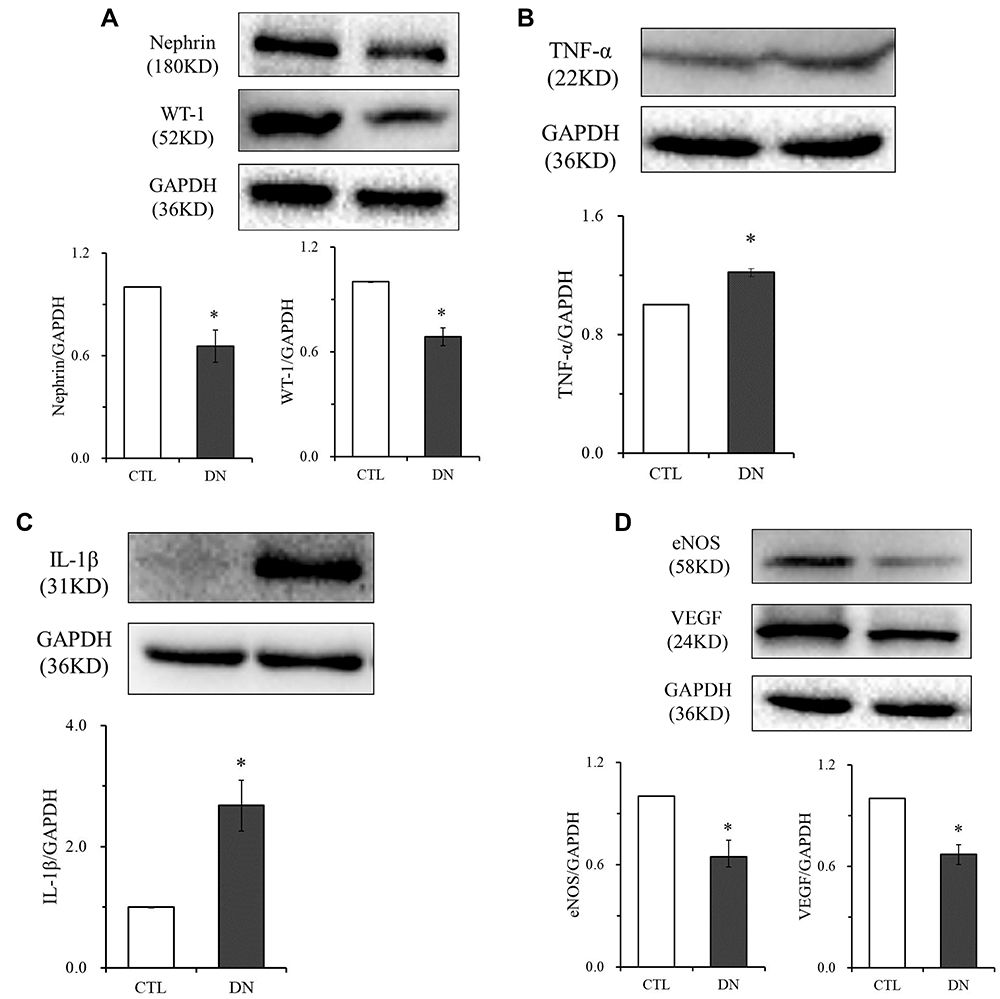 |
Figure 7 Comparison of Nephrin, WT-1, TNF-α, IL-1β, eNOS and VEGF protein expression levels of kidney. (A) Nephrin and WT-1 expressions. (B) TNF-α expressions. (C) IL-1β expressions. (D) eNOS and VEGF expressions. Data are expressed as the mean ± standard deviation (n=6). *P < 0.05, vs the CTL group. Abbreviations: CTL, normal control; DN, diabetic nephropathy; WT-1, Wilms’ tumor-1; TNF-α, tumor necrosis factor-α; IL-1β, interleukin-1β; eNOS, endothelial nitric oxide synthases; VEGF, vascular endothelial growth factor. |
These results demonstrated that the structure and function of renal podocytes and the function of renal epithelial cells in DN rats were abnormal, which was accompanied by increased expression of renal inflammatory factors.
Discussion
T2DM is a serious public health issue with significantly increasing rates across the world.24 As one of the most significant microvascular complications in diabetic patients, DN is considered a metabolic and hemodynamic glomerular disease initiated by hyperglycemia,25 and the overproduction of various inflammatory factors is involved in the pathogenesis of DN.26
The current understanding of diabetes-driven vascular complications as well as therapeutic interventions has arisen from studying disease pathogenesis in animal models. The choice of an appropriate animal model is important.27 In this study, a DN rat model was established from the pre-T2DM stage, which was characterized by obesity, hyperlipidemia, and an increased IRI.28,29 Persistent hyperglycemia induced by STZ was confirmed as T2DM stage,12,13 and abnormal renal function due to podocyte injury was considered the DN stage.14 Serum TNF-α and IL-1β were tracked and compared in the above three stages.
Obesity, increased IRI and hyperlipidemia are interrelated metabolic disorders in the pre-T2DM stage.30 Our research showed that four weeks of an HFD promoted obesity and an increase in the IRI in the model rats, and hyperlipidemia was observed after the next four weeks of an HFD, thereby contributing to the further development of diabetes.31 A growing body of evidence is emerging to show that metabolic syndrome is intimately related to chronic inflammation.32 Our study confirmed that metabolic syndrome in the pre-T2DM stage, such as elevated BW, abnormal FINS levels, and increased TG and TC levels, coincided with increased serum TNF-α and IL-1β levels.
Persistent hyperglycemia was induced by STZ injection, and the T2DM rat model was confirmed according to the current definition of diabetic models.33 It has been reported that the total antioxidant capacity is lower in STZ-induced diabetic rats than in normal control rats.34 An inflammatory state of T2DM is characterized mainly by an increase in the serum concentrations of IL-1β and TNF-α, originating from chronically inflamed adipose tissue and associated with oxidative stress.2 Our research confirmed that STZ not only increased RBG, FBG and IRI and significantly increased TG and TC in the pre-T2DM stage to a higher level in the T2DM stage but also significantly promoted an increase in serum TNF-α and IL-1β levels.
The persistence of hyperglycemia and oxidative stress in diabetic patients ultimately leads to clinical DN.35 The clinical features of DN include an increase in persistent albumin excretion and/or a progressive decrease in the renal glomerular filtration rate, eventually leading to the development of end-stage renal disease.36 BUN and SCr levels and proteinuria were used to determine renal function and evaluate clinical efficacy.37 These renal function indices have also been widely used to determine renal injury in DN animal models.38 The clinical diagnosis and staging of DN are based on albuminuria and eGFR reduction. The eGFR value is calculated based on the SCr and UCr values of patients and their clinical age and sex.39 In animal models, CrCl has been used extensively and is normally calculated with SCr and UCr values, urine volume and BW.15,40 A clinical study showed that after dapagliflozin treatment in DN patients, the serum TNF-α level decreased significantly, while eGFR values increased significantly when compared with the levels before treatment.39 Our study confirmed that the decrease in the CrCl value and the increase in proteinuria during the DN stage were associated not only with high levels of TNF-α and IL-1β in the serum but also with significantly higher expression of TNF-α and IL-1β in the kidney. Additionally, the impairment of renal vascular endothelial function was confirmed by the decreased CrCl value according to some clinical research.37
VEGF and nitric oxide (NO) derived from eNOS are essential for normal vascular endothelial function and glomerular filtration barrier homeostasis but are dysregulated in DN.41,42 A study demonstrated that in the setting of bioavailable NO deficiency caused by DM or by eNOS knockout, podocyte VEGF knockdown results in diffuse glomerulosclerosis and proteinuria of increasing severity, leading to renal failure in eNOS−/−:VEGFKD mice.41 According to the above research, we focused not only on the expression of eNOS and VEGF but also on podocyte-associated nephrin and WT-1 under renal inflammatory stress. As unique, highly specialized, terminally differentiated cells in the kidney, podocytes are restricted to a postmitotic state with limited ability to repair or regenerate.43 It was reported that in lipopolysaccharide-treated mice, the inflammation of renal glomeruli decreased WT-1 expression, leading to acute kidney damage.44 The in vitro research confirmed that the increased TNF-α and IL-1β levels affected nephrin and WT-1 expression in high-glucose-induced MPC-5 cells.45 Our research clarified for the first time that the persistence of increased serum TNF-α and IL-1β levels in the pre-T2DM stage and T2DM stage contributed to podocyte injury via renal abnormal eNOS/VEGF and hemodynamic parameters in DN rats.
eNOS genes have been implicated in renal hemodynamics as potent regulators of vascular tone.46 In this study, to understand the multiple, overlapping factors that affect renal hemodynamics, ultrasonography was used to provide a real-time and dynamic assessment of renal cortex microvascular perfusion and hemodynamic characteristics.47 Several studies have shown that progressive exacerbation of DN is accompanied by a decrease in renal artery blood flow velocity and an increase in renal artery resistance.48 Currently, the importance of EDV, PSV, MV, RI, and PI have been described from the perspective of different researchers. Some researchers believe that EDV and RI might be the two best indices for evaluating renal function.49,50 Other experiments have shown that renal function shows a significant positive correlation with PSV and EDV levels in the intrarenal artery and a negative correlation with RI and PI.51,52 Some investigators have suggested that the change in MV should be a more sensitive indicator because MV varies with hemodynamic resistance, which is consistent with Poiseuille’s law.53 Our study showed for the first time that the parameters PSV, MV, EDV and RI and PI obtained in the interlobar renal arteries of DN rats were more significantly altered than those obtained in the main and segmental arteries. This finding was consistent with the microvascular pathological changes in glomeruli in the renal cortex. As a commonly used technique for evaluating renal function in clinical practice,54 RDUS has shown its particular advantages in the assessment of microvascular hemodynamics in animal models.
Conclusions
To understand the overlapping process of multiple pathological states, including the inflammatory process, metabolic disorders, microvascular dysfunction and abnormal hemodynamics, in the development of DN, a rat model was established of the pre-T2DM, T2DM and DN stages. Our study showed that the inflammatory process, represented by elevated serum levels of TNF-α and IL-1β, has already started when metabolic disturbances due to an HFD occurred in the pre-T2DM period. The increased serum TNF-α level and serum IL-1β level further lasted in the T2DM stage and DN stage. Finally, renal podocyte injury, as indicated by pathological changes in renal histology, abnormal renal hemodynamics and endothelial function, decreased clinical renal function indicators, and decreased nephrin and WT-1 expression levels, was closely associated with increased serum and renal TNF-α and IL-1β expression levels.
Acknowledgments
The authors thank the staff of the Shanxi Provincial Key Laboratory of Nephrology and the Laboratory Animal Center for providing SPF-quality rats rearing services in this experiment.
Funding
This study was supported by Medical Key Research Projects of Shanxi Province (No. 2020XM02), Local Science and Technology Development Funds Projects Guided by Central Government (No. YDZJSX2021C027), Basic Research Program of Shanxi Province (No. 202103021224370), Key R & D Project of Shanxi Province (International Scientific and Technological Cooperation, Independent Topics, No. 201903D421061) and Wu Jieping Medical Foundation (No. 320.6750.2021-08-10).
Disclosure
All the authors of this manuscript declare that there has no financial and personal relationships with other people or organizations that could inappropriately influence (bias) their work, and no conflict of interest regarding the publication of this manuscript.
References
1. Wong YH, Wong SH, Wong XT, Yi Yap Q, Yip KY, Wong LZ. Genetic associated complications of type 2 diabetes mellitus: a review. Panminerva Med. 2022;64(2):274–288. doi:10.23736/S0031-0808.21.04285-3
2. Silveira Rossi JL, Barbalho SM, Reverete de Araujo R, Bechara MD, Sloan KP, Sloan LA. Metabolic syndrome and cardiovascular diseases: going beyond traditional risk factors. Diabetes Metab Res Rev. 2022;38(3):e3502. doi:10.1002/dmrr.3502
3. Han Q, Zhu H, Chen X, Liu Z. Non-genetic mechanisms of diabetic nephropathy. Front Med. 2017;11(3):319–332. doi:10.1007/s11684-017-0569-9
4. Luo W, Chen X, Ye L, et al. Kaempferol attenuates streptozotocin-induced diabetic nephropathy by downregulating TRAF6 expression: the role of TRAF6 in diabetic nephropathy. J Ethnopharmacol. 2021;268:113553. doi:10.1016/j.jep.2020.113553
5. Reinehr T. Inflammatory markers in children and adolescents with type 2 diabetes mellitus. Clin Chim Acta. 2019;496:100–107. doi:10.1016/j.cca.2019.07.006
6. Cheng D, Fei Y, Saulnier PJ, Wang N. Circulating TNF receptors and risk of renal disease progression, cardiovascular disease events and mortality in patients with diabetes: a systematic review and meta-analysis. Endocrine. 2020;68(1):32–43. doi:10.1007/s12020-019-02153-y
7. Inserra F, Forcada P, Castellaro A, Castellaro C. Chronic kidney disease and arterial stiffness: a two-way path. Front Med. 2021;8:765924. doi:10.3389/fmed.2021.765924
8. Barsom SH, Glasstetter LM, Siddiqi S, Rajagopalan KS, Eirin A, Lerman LO. Emergent players in renovascular disease. Clin Sci. 2022;136(3):239–256. doi:10.1042/CS20210509
9. Zhang Y, Liao H, Shen D, et al. Renal protective effects of Inonotus obliquus on high-fat diet/streptozotocin-induced diabetic kidney disease rats: biochemical, color Doppler ultrasound and histopathological evidence. Front Pharmacol. 2022;12:743931. doi:10.3389/fphar.2021.743931
10. Liu JY, Mu S, Zhang SP, et al. Roux-en-Y gastric bypass surgery suppresses hypothalamic PTP1B protein level and alleviates leptin resistance in obese rats. Exp Ther Med. 2017;14(3):2536–2542. doi:10.3892/etm.2017.4801
11. Xu LL, Gao W, Chen ZM, et al. Relationships between diabetic nephropathy and insulin resistance, inflammation, Trx, Txnip, CysC and serum complement levels. Eur Rev Med Pharmacol Sci. 2020;24(22):11700–11706. doi:10.26355/eurrev_202011_23815
12. Zhang KQ, Tian T, Hu LL, Wang HR, Fu Q. Effect of probucol on autophagy and apoptosis in the penile tissue of streptozotocin-induced diabetic rats. Asian J Androl. 2020;22(4):409–413. doi:10.4103/aja.aja_89_19
13. Wilson RD, Islam MS. Fructose-fed streptozotocin-injected rat: an alternative model for type 2 diabetes. Pharmacol Rep. 2012;64(1):129–139. doi:10.1016/s1734-1140(12)70739-9
14. Li Y, Guo S, Yang F, Liu L, Chen Z. Huayu tongluo recipe attenuates renal oxidative stress and inflammation through the activation of AMPK/Nrf2 signaling pathway in streptozotocin- (STZ-) induced diabetic rats. Evid Based Complement Alternat Med. 2021;2021:5873007. doi:10.1155/2021/5873007
15. Zou C, Jiao Y, Li X, et al. Differences between healthy adults and patients with type 2 diabetes mellitus in reactivity of toe microcirculation by ultrasound combined with a warm bath test. Medicine. 2017;96(22):e7035. doi:10.1097/MD.0000000000007035
16. Maksoud AAA, Sharara SM, Nanda A, Khouzam RN. The renal resistive index as a new complementary tool to predict microvascular diabetic complications in children and adolescents: a groundbreaking finding. Ann Transl Med. 2019;7(17):422. doi:10.21037/atm.2019.08.65
17. Markus B, Patsalis N, Chatzis G, et al. Impact of microaxillar mechanical left ventricular support on renal resistive index in patients with cardiogenic shock after myocardial infarction: a pilot trial to predict renal organ dysfunction in cardiogenic shock. Eur Heart J Acute Cardiovasc Care. 2020;9(2):158–163. doi:10.1177/2048872619860218
18. Wang C, Hou XX, Rui HL, et al. Artificially cultivated ophiocordyceps sinensis alleviates diabetic nephropathy and its podocyte injury via inhibiting P2X7R expression and NLRP3 inflammasome activation. J Diabetes Res. 2018;2018:1390418. doi:10.1155/2018/1390418
19. Zeng JY, Wang Y, Miao M, Bao XR. The effects of rhubarb for the treatment of diabetic nephropathy in animals: a systematic review and meta-analysis. Front Pharmacol. 2021;12:602816. doi:10.3389/fphar.2021.602816
20. Yang GM, Wang ZY, Chen LL, Wang P, Lu Y, Zhang LY. Establishment of some biological indexes in SPF SD rats. Lab Anim Sci. 2008;25(4):19–22.
21. Netter FH. Atlas of Human Anatomy.
22. Gross JL, de Azevedo MJ, Silveiro SP, Canani LH, Caramori ML, Zelmanovitz T. Diabetic nephropathy: diagnosis, prevention, and treatment. Diabetes Care. 2005;28(1):164–176. doi:10.2337/diacare.28.1.164
23. Vatankhah Yazdi K, Kalantar SM, Houshmand M, et al. SLC30A8, CDKAL1, TCF7L2, KCNQ1 and IGF2BP2 are associated with type 2 diabetes mellitus in Iranian patients. Diabetes Metab Syndr Obes. 2020;13:897–906. doi:10.2147/DMSO.S225968
24. Kim H, Kim M, Lee HY, Park HY, Jhun H, Kim S. Role of dendritic cell in diabetic nephropathy. Int J Mol Sci. 2021;22(14):7554. doi:10.3390/ijms22147554
25. Huang T, Li X, Wang F, et al. The CREB/KMT5A complex regulates PTP1B to modulate high glucose-induced endothelial inflammatory factor levels in diabetic nephropathy. Cell Death Dis. 2021;12(4):333. doi:10.1038/s41419-021-03629-4
26. Choi JSY, de Haan JB, Sharma A. Animal models of diabetes-associated vascular diseases: an update on available models and experimental analysis. Br J Pharmacol. 2022;179(5):748–769. doi:10.1111/bph.15591
27. Cuthbertson DJ, Koskinen J, Brown E, et al. Fatty liver index predicts incident risk of prediabetes, type 2 diabetes and non-alcoholic fatty liver disease (NAFLD). Ann Med. 2021;53(1):1256–1264. doi:10.1080/07853890.2021.1956685
28. Kwanbunjan K, Panprathip P, Phosat C, et al. Association of retinol binding protein 4 and transthyretin with triglyceride levels and insulin resistance in rural Thais with high type 2 diabetes risk. BMC Endocr Disord. 2018;18(1):26. doi:10.1186/s12902-018-0254-2
29. Suriano F, Manca C, Flamand N, et al. Exploring the endocannabinoidome in genetically obese (ob/ob) and diabetic (db/db) mice: links with inflammation and gut microbiota. Biochim Biophys Acta Mol Cell Biol Lipids. 2022;1867(1):159056. doi:10.1016/j.bbalip.2021.159056
30. Tian B, Zhao J, Xie X, et al. Anthocyanins from the fruits of Lycium ruthenicum Murray improve high-fat diet-induced insulin resistance by ameliorating inflammation and oxidative stress in mice. Food Funct. 2021;12(9):3855–3871. doi:10.1039/d0fo02936j
31. Scheen AJ, Esser N, Paquot N. Antidiabetic agents: potential anti-inflammatory activity beyond glucose control. Diabetes Metab. 2015;41(3):183–194. doi:10.1016/j.diabet.2015.02.003
32. Brosius FC, Alpers CE, Bottinger EP, et al. Mouse models of diabetic nephropathy. J Am Soc Nephrol. 2009;20(12):2503–2512. doi:10.1681/ASN.2009070721
33. Faisal Lutfi M, Abdel-Moneim AH, Alsharidah AS, et al. Thymoquinone lowers blood glucose and reduces oxidative stress in a rat model of diabetes. Molecules. 2021;26(8):2348. doi:10.3390/molecules26082348
34. Xu J, Wang Y, Wang Z, Guo L, Li X. Fucoidan mitigated diabetic nephropathy through the downregulation of PKC and modulation of NF-κB signaling pathway: in vitro and in vivo investigations. Phytother Res. 2021;35(4):2133–2144. doi:10.1002/ptr.6966
35. Expert Group of Chinese Society of Nephrology. Chinese guidelines for diagnosis and treatment of diabetic kidney disease. Chin J Nephrol. 2021;37(3):255–304.
36. Chen L, Wu J, Xu H, Chen J, Xie X. Effects of tanshinone combined with valsartan on hypertensive nephropathy and its influence on renal function and vascular endothelial function. Am J Transl Res. 2021;13(5):4788–4795.
37. Hu X, Zhang X, Jin G, Shi Z, Sun W, Chen F. Geniposide reduces development of streptozotocin-induced diabetic nephropathy via regulating nuclear factor-kappa B signaling pathways. Fundam Clin Pharmacol. 2017;31(1):54–63. doi:10.1111/fcp.12231
38. Ma F, Yadav GP, Cang YQ, et al. Contrast-enhanced ultrasonography is a valid technique for the assessment of renal microvascular perfusion dysfunction in diabetic Goto-Kakizaki rats. Nephrology. 2013;18(12):750–760. doi:10.1111/nep.12159
39. Yang J, Yang S, Xu Y, et al. Evaluation of renal oxygenation and hemodynamics in patients with chronic kidney disease by blood oxygenation level-dependent magnetic resonance imaging and intrarenal Doppler ultrasonography. Nephron. 2021;145(6):653–663. doi:10.1159/000516637
40. Abe M, Akaishi T, Miki T, et al. Influence of renal function and demographic data on intrarenal Doppler ultrasonography. PLoS One. 2019;14(8):e0221244. doi:10.1371/journal.pone.0221244
41. Veron D, Aggarwal PK, Li Q, Moeckel G, Kashgarian M, Tufro A. Podocyte VEGF-A knockdown induces diffuse glomerulosclerosis in diabetic and in eNOS knockout mice. Front Pharmacol. 2022;12:788886. doi:10.3389/fphar.2021.788886
42. Roumeliotis S, Mallamaci F, Zoccali C. Endothelial dysfunction in chronic kidney disease, from biology to clinical outcomes: a 2020 update. J Clin Med. 2020;9(8):2359. doi:10.3390/jcm9082359
43. Zhan P, Zhang Y, Shi W, et al. Myeloid-derived growth factor deficiency exacerbates mitotic catastrophe of podocytes in glomerular disease. Kidney Int. 2022;102(3):546–559. doi:10.1016/j.kint.2022.04.027
44. Arellano-Rodríguez M, Zapata-Benavides P, Arellano-Rodríguez NC, et al. The inflammatory process modulates the expression and localization of WT1 in podocytes leading to kidney damage. In Vivo. 2021;35(6):3137–3146. doi:10.21873/invivo.12608
45. Liu XQ, Jiang L, Li YY, et al. Wogonin protects glomerular podocytes by targeting Bcl-2-mediated autophagy and apoptosis in diabetic kidney disease. Acta Pharmacol Sin. 2022;43(1):96–110. doi:10.1038/s41401-021-00721-5
46. Padhi UN, Mulkalwar M, Saikrishna L, Verma HK, Bhaskar L. NOS3 gene intron 4 a/b polymorphism is associated with ESRD in autosomal dominant polycystic kidney disease patients. J Bras Nefrol. 2022;44(2):224–231. doi:10.1590/2175-8239-JBN-2021-0089
47. Di Nicolò P, Granata A. Renal intraparenchymal resistive index: the ultrasonographic answer to many clinical questions. J Nephrol. 2019;32(4):527–538. doi:10.1007/s40620-018-00567-x
48. Gao J, Perlman A, Kalache S, et al. Multiparametric quantitative ultrasound imaging in assessment of chronic kidney disease. J Ultrasound Med. 2017;36(11):2245–2256. doi:10.1002/jum.14209
49. Sener TE, Tanidir Y, Bin HS, et al. Effects of flexible ureteroscopy on renal blood flow: a prospective evaluation. Scand J Urol. 2018;52(3):213–218. doi:10.1080/21681805.2018.1437770
50. Zheng HP, Qin RJ. Comparative analysis of hemorheology property of blood in vitro and in vivo. Chin J Med Phys. 2017;34(10):1051–1057. doi:10.3969/j.issn.1005-202X.2017.10.017
51. Meyer S, Fuchs D, Meier M. Ultrasound and photoacoustic imaging of the kidney: basic concepts and protocols. Methods Mol Biol. 2021;2216:109–130. doi:10.1007/978-1-0716-0978-1_7
52. Wetzel MD, Gao T, Stanley K, Cooper TK, Morris SM, Awad AS. Enhancing kidney DDAH-1 expression by adenovirus delivery reduces ADMA and ameliorates diabetic nephropathy. Am J Physiol Renal Physiol. 2020;318(2):F509–F517. doi:10.1152/ajprenal.00518.2019
53. Katulka EK, Hirt AE, Kirkman DL, Edwards DG, Witman MAH. Altered vascular function in chronic kidney disease: evidence from passive leg movement. Physiol Rep. 2019;7(8):e14075. doi:10.14814/phy2.14075
54. Coutinho MN, Carvalho AB, Dalboni MA, et al. There is no impact of diabetes on the endothelial function of chronic kidney disease patients. J Diabetes Res. 2018;2018:7926473. doi:10.1155/2018/7926473
 © 2022 The Author(s). This work is published and licensed by Dove Medical Press Limited. The full terms of this license are available at https://www.dovepress.com/terms.php and incorporate the Creative Commons Attribution - Non Commercial (unported, v3.0) License.
By accessing the work you hereby accept the Terms. Non-commercial uses of the work are permitted without any further permission from Dove Medical Press Limited, provided the work is properly attributed. For permission for commercial use of this work, please see paragraphs 4.2 and 5 of our Terms.
© 2022 The Author(s). This work is published and licensed by Dove Medical Press Limited. The full terms of this license are available at https://www.dovepress.com/terms.php and incorporate the Creative Commons Attribution - Non Commercial (unported, v3.0) License.
By accessing the work you hereby accept the Terms. Non-commercial uses of the work are permitted without any further permission from Dove Medical Press Limited, provided the work is properly attributed. For permission for commercial use of this work, please see paragraphs 4.2 and 5 of our Terms.