")
Back to Journals » Cancer Management and Research » Volume 11
TMEFF1 overexpression and its mechanism for tumor promotion in ovarian cancer
Authors Nie X, Liu C, Guo Q , Zheng M , Gao L, Li X, Liu D, Zhu L , Liu J, Lin B
Received 1 September 2018
Accepted for publication 26 November 2018
Published 17 January 2019 Volume 2019:11 Pages 839—855
DOI https://doi.org/10.2147/CMAR.S186080
Checked for plagiarism Yes
Review by Single anonymous peer review
Peer reviewer comments 3
Editor who approved publication: Dr Kenan Onel
Xin Nie,1,2 Cong Liu,3 Qian Guo,1,2 Ming-jun Zheng,1,2 Ling-ling Gao,1,2 Xiao Li,1,2 Da-wo Liu,1,2 Lian-cheng Zhu,1,2 Juan-juan Liu,1,2 Bei Lin1,2
1Department of Obstetrics and Gynaecology, Shengjing Hospital Affiliated to China Medical University, Liaoning, China; 2Key Laboratory of Maternal-Fetal Medicine of Liaoning Province, Key Laboratory of Obstetrics and Gynecology of Higher Education of Liaoning Province, Liaoning, China; 3Department of Obstetrics and Gynaecology, Wuxi Materal and Child Health Hospital, Jiangsu, China
Background: Transmembrane protein with epidermal growth factor-like and two follistatin-like domains 1 (TMEFF1) has an anticarcinogenic effect in brain tumors. However, little is known about the role of TMEFF1 in epithelial ovarian cancer (EOC).
Materials and methods: TMEFF1 expression in EOC was detected by immunohistochemistry; its relationship with clinical pathological parameters and its influence on prognosis were analyzed. The MTT, scratch, Transwell assays, and flow cytometry were used to assess the malignant behavior of ovarian cancer cell. Changes in node proteins in MAPK and PI3K/AKT signaling pathways and the expression of epithelial–mesenchymal transformation markers were measured by Western blot. The regulatory effect of p53 on TMEFF1 was verified by chromatin immunoprecipitation (ChIP) assay and Western blot.
Results: TMEFF1 expression was higher in the EOC group than in the borderline and benign tumor groups and normal ovary group; its high expression was significantly related to International Federation of Gynecology and Obstetrics stage (P=0.024) and independently predicted shorter overall survival (P<0.01). TMEFF1 overexpression in ovarian cancer cells induced increased cellular proliferation, migration, and invasion but reduced apoptosis. In addition, the percentage of phosphorylated node proteins in MAPK and PI3K/AKT signaling pathways increased significantly. The expression of E-cadherin decreased but that of vimentin and N-cadherin increased. After the addition of MAPK (PD98059) and PI3K (GDC-0941) pathway inhibitors, ovarian cancer cells overexpressing TMEFF1 showed suppressed malignant behavior. TMEFF1 protein expression in an ovarian cancer cell lines (CAOV3 and ES-2) was downregulated after the inhibition of TP53. The transcription factor, p53, bound the promoter region of the TMEFF1 gene according to ChIP.
Conclusion: TMEFF1 is a carcinogenic gene in ovarian cancer and can be regulated by p53 transcription. Through MAPK and PI3K/AKT signaling pathways, TMEFF1 promotes the malignant behavior in EOC. Therefore, TMEFF1 may be considered as a potential therapeutic target for ovarian cancer.
Keywords: TMEFF1, ovarian cancer, MAPK, PI3K, p53
Introduction
Epithelial ovarian cancer (EOC) is the most common malignant gynecological tumor. Consequently, EOC is ranked first among malignant tumors of the female reproductive system in terms of fatalities.1 At present, EOC is difficult to diagnose early; when diagnosed, most patients with EOC are an advanced stage and show extensive metastasis. EOC also tends to recur and acquire drug resistance after surgery. In current clinical practice, the progression of ovarian cancer is followed by measuring a CA125 biomarker; yet, this has low specificity and can be highly expressed even in various benign lesions. Therefore, identifying new tumor markers of EOC will play an important role in the early diagnosis of ovarian cancer, as well as in evaluating the prognosis and exploring target therapy for ovarian cancer. As shown by recent studies, cancer–testis antigen (CTA) participates in the occurrence and progression of tumors; it is expressed in various tumor tissues but is not expressed in normal tissues (except the testis). CTA has become a hot topic in research on the immunological diagnosis/treatment of ovarian cancer; as a tumor marker or treatment target, it possesses great prospects for the early diagnosis and treatment of this cancer.2,3
TMEFF1 (tomoregulin-1, TR-1, or M7365) is a member of the CTA family (CT 120-1).4 As a transmembrane protein, TMEFF1 was found to be highly expressed in the human embryo and nerve tissues. Early studies mainly concentrated on its participation in the middle/late development stage of the embryo and its regulation on the central nervous system.5 TMEFF1 was initially found with differential expression in brain tissues and brain tumors, and its anticarcinogenic effect was verified in brain tumors.6 Subsequently, TMEFF1 was found expressed in tumor cell lines, such as breast cancer and colonic cancer,7,8 but the role was still unknown. Studies on its correlation with ovarian cancer are lacking. Based on our early results obtained by gene chromatin immunoprecipitation (ChIP) technique, TMEFF1 expression was upregulated significantly in EOC cell lines with the properties of high metastasis and drug resistance, indicating that TMEFF1 is associated with malignant biological behaviors of ovarian cancer.9 In order to further verify the correlation of TMEFF1 with the occurrence and progression of ovarian cancer, the expression and clinical significance of TMEFF1 in EOC were measured using clinical samples in our study. Specifically, this study aimed to explore the influence of TMEFF1 on the malignant biological behaviors of ovarian cancer cells, identify activation pathways and regulation factors of TMEFF1, and provide new ideas for research about early diagnosis, efficacy judgment, postoperative follow-up, and biotherapy on ovarian cancer.
Materials and methods
Source of samples and clinical data
A total of 118 cases of ovarian tissues were selected from paraffin-embedded surgical samples of inpatients hospitalized in the Gynecology Department of our hospital during the period 2008–2012. All tissue sections were re-examined by pathologists, and diagnoses were confirmed. Cases were randomly divided into the following four groups: EOC group (malignant tumor group, n=80); borderline epithelial ovarian tumor (borderline tumor group, n=11); benign epithelial ovarian tumor (benign tumor group, n=12); and normal ovarian tissue (normal ovary group, n=15). Chemotherapy, radiotherapy, and hormone therapy were not implemented before surgery for all patients. The age distribution was as follows: 47.93 years (18–77 years; all patients); 36–71 years (median: 52 years; malignant tumor group); 26–50 years (median: 46 years; borderline tumor group); 22–76 years (median: 46 years; benign tumor group); and 35–65 years (median: 43 years; normal ovary group). Among the four groups, age was not significantly different (P>0.05). In ovarian epithelial serous cystadenocarcinoma, 2, 26, and 52 cases of high, middle, and low differentiations, respectively, existed. Each clinical surgical pathological stage was judged according to the relevant criteria of the International Federation of Gynecology and Obstetrics (FIGO, 2009): stages I–II (27 cases) and stages III–IV (53 cases). In 79 patients, comprehensive phased exploratory and cytoreductive surgeries for ovarian cancer were performed in early and advanced stages, respectively; pelvic and paraaortic lymph node metastasis was judged as follows: no metastasis (42 cases), metastasis (19 cases), and no lymphadenectomy (18 cases). The study was approved by the Ethics Committee of China Medical University. Written informed consent was obtained from all participants.
Cell culture
Both ovarian cancer cell lines (CAOV3, SKOV3, OVCAR3, and ES-2) and normal ovary epithelial cells (HOSEpiC) were purchased from the Institute of Biochemistry and Cell Biology, Chinese Academy of Sciences (Shanghai, China). The cells were cultured routinely in RPMI 1640 culture medium containing 10% FBS (Thermo Fisher Scientific, Waltham, MA, USA) at 37°C, 5% CO2, and in saturated humidity.
Immunohistochemistry and immunocytochemistry
Continuous sections (5 µm thick) were cut from ovarian tissues. TMEFF1 expression was detected using a streptavidin–peroxidase method. For each batch, the following two types of sections were also used: positive control sections (sections of epididymis tissues with positive TMEFF1 expression) and negative control sections (sections of ovarian malignant tumor tissues but PBS was used instead of primary antibody). Anti-TMEFF1 (polyclonal antibody against TMEFF1; dilution 1:70; Santa Cruz Biotechnology Inc., Dallas, TX, USA) was used to determine the expression of TMEFF1 and its clinical significance in ovarian epithelial serous tumors. Staining procedures were performed according to the manual of the SP kit. Immunocytochemistry was used to stain cell monolayers on cover glasses, which were prepared using cells in the logarithmic growth phase. After the cell monolayer grew, cells were washed twice with cold PBS and then fixed with 4% paraformaldehyde for 30 minutes. Other procedures were same as those used for immunohistochemistry. A brown-yellow stain in the cell membrane and cytoplasm was considered as a positive stain. The pigmentation degree was evaluated as follows: not pigmented (0 score); light yellow (1 score); brown-yellow (2 scores); and dark brown (3 scores). The percentage of pigmented cells in the visual field was as follows: <5 (0 score); 6–25 (1 score); 26–50 (2 scores); 51–75 (3 scores); and >75 (4 scores). The final score was obtained by multiplying the score of the two items mentioned above: 0–2 scores (–), 3–4 scores (+), 5–8 scores (++), and 9–12 scores (+++). Cell stain images were examined by two observers separately to control for errors.
Transfection of cells and construction of stable transfection cell lines
Using the liposome method, pc-TMEFF1-GFP plasmid was transfected into OVCAR3 cell line and ES-2 cell line. The plasmid was transfected using the Lipofectamine 3000 Transfection Kit (Thermo Fisher Scientific), and the target cells were screened with G418. Then, the following cell lines of stably high TMEFF1 expression were constructed: OVCAR3-TMEFF1-H cell line and its control cell line (OVCAR3-TMEFF1-H-Mock) and ES-2-TMEFF1-H cell line and its control cell line (ES-2-TMEFF1-H-Mock).
CAOV3 cell line and SKOV3 cell line were transfected through the virus mediation. Then, the cells were screened using the Pour method. The following cell lines of stably low TMEFF1 expression were constructed: CAOV3-TMEFF1-L cell line and its control cell line (CAOV3-TMEFF1-L-Mock) and SKOV3-TMEFF1-L cell line and its control cell line (SKOV3-TMEFF1-L-Mock). With the liposome method, siRNA of TMEFF1 was transfected into CAOV3 cell line. After 72 hours transfection using the Lipofectamine 3000 Transfection Kit, the interference effect was detected. The cells of <72 hours transfection were used for detecting the apoptosis by flow cytometry. TMEFF1 shRNAs (Hanbio, Shanghai, China) sequences were as follows: top strand:5′-GatccGAGGAGTCTGTAAAGAAGATGGAGATTCAAGAGATCTCCATCTTCTTTACAGACTCCTCTTTTTTC-3′; bottom strand: 5′-aattgAAAAAAGAGGAGTCTGTAAAGAAGATGGAGATCTCTTGAATCTCCATCTTCTTTACAGACTCCTCg-3′. TMEFF1 siRNA (GenePharma, Shanghai, China ) sequences were as follows: sense: 5′-GCUCACUCAUGUUCUUAUUTT-3′; antisense: 5′-AAUAAGAACAUGAGUGAGCTT-3′.
Real-time (RT) quantitative PCR
Total RNA was extracted with TRIzol according to the manufacturer’s instructions, and the purity/concentration of RNA was examined by ultraviolet spectrophotometry. Using a RT-qPCR kit for a Super Script III First-Strand Synthesis System (Takara, Kusatsu, Japan), RNA was reverse transcribed into cDNA. The TMEFF1 forward primer was 5′-TTGTTGGGAAAGAAAGATGATGGA-3′, and the TMEFF1 reverse primer was 5′-GATGCAGTAAC- CATTGAGGTTTT-3′. The amplification conditions were as follows: denaturation at 95°C for 30 seconds, extension at 95°C for 5 seconds, and annealing at 60°C for 31 seconds, total 40 cycles. The internal reference was GAPDH. RT-qPCR amplification was implemented using a Light Cycler PCR system, and the Ct value of each template was measured. After the completion of amplification, dissolution curve analysis was performed and calculations made using the 2−∆∆CT method. The above test was repeated three times.
Western blot
Cells were lysed with RIPA lysis buffer at 4°C for 30 minutes. After centrifugation for 30 min (4°C, centrifugal force: 12,000× g), the supernatant was collected. The protein concentration was detected using a bicinchoninic acid method. After separation using 10% SDS-PAGE, denatured protein was blot-transferred to a polyvinylidene fluoride membrane (EMD Millipore, Billerica, MA, USA) and blocked with 5% milk or BSA for 2 hours. Each primary antibody was incubated overnight at 4°C: anti-TMEFF1 (1:200; Santa Cruz Biotechnology Inc.); anti-PI3K p85 (1:1,000; CST, Danvers, MA, USA); anti-phospho-PI3K p85 (Ser458) (1:1,000; CST); anti-AKT (1:1,000; CST); anti-phospho-AKT (Ser473) (1:1,000; CST); anti-MEK1/2 (1:300; Santa Cruz Biotechnology Inc.); anti-phospho-MEK 1/2 (1:300; Bioss, Beijing, China); anti-ERK1/2 (1:500; Bioss); anti-phospho-ERK 1/2 (1:300; Bioss); anti-RAF (1:1,000; CST); anti-phospho-RAF (1:1,000; CST); anti-PCNA (1:1,000; CST); anti-bcl2 (1:1,000; Proteintech, Rosemont, PA, USA); anti-bax (1:1,000; Proteintech); anti-E-cadherin (1:1,000; Proteintech); anti-vimentin (1:1,000; Proteintech); anti-N-cadherin (1:1,000; CST); anti-metalloproteinase (MMP) 2 (1:1,000; Proteintech); anti-MMP9 (1:1,000; Proteintech); and anti-GAPDH (1:2,000; Zsgb Bio, Beijing, China). After washing with Tris-buffered saline, 0.1% Tween 20 (TBST), secondary antibody (1:5,000; Zsgb Bio) was incubated for 2 hours and then washed with TBST. Protein bands were developed using the ECL reagent (Thermo Fisher Scientific). The above test was repeated three times. Protein bands were obtained using the ECL reagent and a gel electrophoresis image analyzer GDS8000 (Thermo Fisher Scientific).
Detection of cell proliferation by MTT assay
A 96-well microplate was inoculated with 2,000 cells/well, with a blank well set aside. Cells adhered after 6 hours cell culture, and this was regarded as the “0 time points”. MTT solution (20 µL; 5 µg/mL; Solarbio, Beijing, China) was added to each well. After 4 hours incubation at 37°C, the culture medium was removed and 150 µL of DMSO was added. After shaking for 10 minutes, the OD was measured using a universal microplate reader at 0, 24, 48, 72, and 96 hours. For each treatment, three parallel wells were used for statistical analysis. The above test was repeated three times.
Detection of cell apoptosis by flow cytometry
Cell apoptosis after the addition of pathway inhibitors in TMEFF1-overexpressing ovarian cancer cell lines was measured using an Annexin-V-phycoerythrin (PE)/7-aminoactinomycin D (7AAD) double-stain method. In each group, three controls were set: blank, PE single-stain control, and 7AAD single-stain control. In each group, cells were digested with EDTA-free pancreatin. After centrifugation, the supernatant was disposed of and after washing twice with PBS, the cell pellet was collected. Cells were re-suspended in the binding buffer solution of an apoptosis kit (BD, Franklin Lakes, NJ, USA). Staining agents (5 µL of 7AAD and 5 µL of PE) were added successively, and the solution was mixed uniformly. After 5 minutes incubation in the dark, flow cytometry (BD) was used to measure apoptotic cells. Experiments were repeated three times. The ovarian cancer cell line with TMEFF1 expression inhibited by virus showed green fluorescence, which was so strong, and it influenced the Annexin-V-PE/7AAD stain detected by flow cytometry. The expression of TMEFF1 was therefore inhibited using a fluorescence-free siRNA, and apoptotic cells were detected by Annexin-V-APC/propidium iodide (PI) double staining according to the above procedures.
Detection of cell migration by scratch assay
Cells in the logarithmic growth phase were prepared as a single-cell suspension and inoculated in a six-well microplate. After the cell monolayer reaching 90%, the microplate was scratched gently with a 100-µL pipette tip. After gently rinsing twice with PBS, the serum-free culture medium was replaced. The width of scratch mark was observed under the microscope. After 24 hours culturing in serum-free culture medium, the width of each scratch was measured under the microscope. Experiments were repeated three times.
In vitro cell invasion assay
Matrigel (70 µL; BD) was spread onto the upper wells of Transwell chambers (Corning Incorporated, Corning, NY, USA) and dried overnight in a 37°C incubator. Culture medium (500 µL) containing 5% FBS was added to the lower chambers, and a cell suspension (2×10⁵) in 200 µL of serum-free culture medium was added to each upper chamber. After 72 hours incubation at 37°C, Transwell chambers were emptied and fixed with 4% paraformaldehyde at room temperature for 30 minutes. After 30 minutes staining with crystal violet, the surface of each upper chamber was wiped gently with a cotton swab. The tumor cells infiltrating the filter membrane on the surface of the lower chamber were then counted under a microscope. Experiments were repeated three times.
Cell cycle test
For each group, cells were collected and washed twice with PBS. After fixation with 70% glacial ethanol at 4°C overnight, cells were centrifuged and washed three times with cold PBS, RNase A solution (100 µL) was added, and cells were incubated for 30 minutes at 37°C. A PI staining solution (KeyGen Biotech, Nanjing, China) was added to give a final concentration of 400 µL, and then, the solution was mixed uniformly. After 30 minutes staining at 4°C in the dark, fluorescence detection was performed by flow cytometry. Experiments were repeated three times.
Pathway inhibitors
Cells were treated separately with MAPK (PD98059; Selleck Chemicals, Houston, TX, USA) and PI3K (GDC-0941; Selleck Chemicals) pathway inhibitors. A 35-mm culture dish was inoculated with 2×10⁵ cells, and cells were cultured for 36 hours. The culture was then continued for 72 hours using the following solutions: 20 μmol/L of PD98059 culture medium (containing 0.1% DMSO); 25 μmol/L of GDC-0941 culture medium (containing 0.1% DMSO); and 0.1% DMSO of the same concentration (control group). Cells were then collected. Experiments were repeated three times.
ChIP assay
Ovarian cancer cells (CAOV3 and ES-2) in the logarithmic growth phase were collected. ChIP assay was carried out using a commercially available kit (9004; CST) and p53 antibody (2527s; CST), following the manufacturer’s instructions. RT-qPCR detection was performed following the above procedures: forward primer F at the promoter region of TMEFF1: 5′-ATGGCTAGAGTCAGAACTTG-3′; reverse primer R: 5′-TGAGTCACGGAAGAGGTAA-3′. Meanwhile, a pair of primers was selected as the negative control when performing the RT-qPCR assay, whose corresponding amplification product is a part of DNA sequence in the promoter region of HCII gene that is located on chromosome 22 (TMEFF1 is located on chromosome 9). Forward primer F of negative control was as follows: 5′-TTATGTGGTGACCTCAAGAG-3′; reverse primer R was as follows: 5′-TGACGGTTACTGTGTTAGC-3′. Experiments were repeated three times.
Statistical analysis
The study data were analyzed with the SPSS 22.0 software. Student’s t-test and the Chi-squared test were used for comparisons between two independent groups, and one-way ANOVA was used to compare differences among more than two groups. The survival curve was analyzed by Kaplan–Meier and log-rank tests. The relationship with patients was analyzed using Cox model. P<0.05 indicated that the difference was statistically significant.
Ethical approval
All procedures performed in studies involving human participants were in accordance with the ethical standards of the institutional and/or national research committee (the Shengjing Hospital of Chine Medical University, Shenyang, China) and with the 1964 Declaration of Helsinki and its later amendments
Results
Expression of TMEFF1 in various ovarian tissues
High TMEFF1 expression in EOC
TMEFF1 was found mainly in the cell membrane but also in the cytoplasm of cells’ EOC tissue sections. In EOC, the positive expression and high-expression rates for TMEFF1 were 91.25% and 65%, respectively, significantly greater than those in borderline tumor (45.45% and 18.18%), benign tumor (33.33% and 16.67%), and normal ovary groups (26.67% and 6.67%; P<0.05 for all). Although the TMEFF1 expression level in the borderline tumor group was higher than that in the benign tumor and normal ovary groups, pair-wise comparisons between the three groups showed no significant difference (Table 1 and Figure 1A).
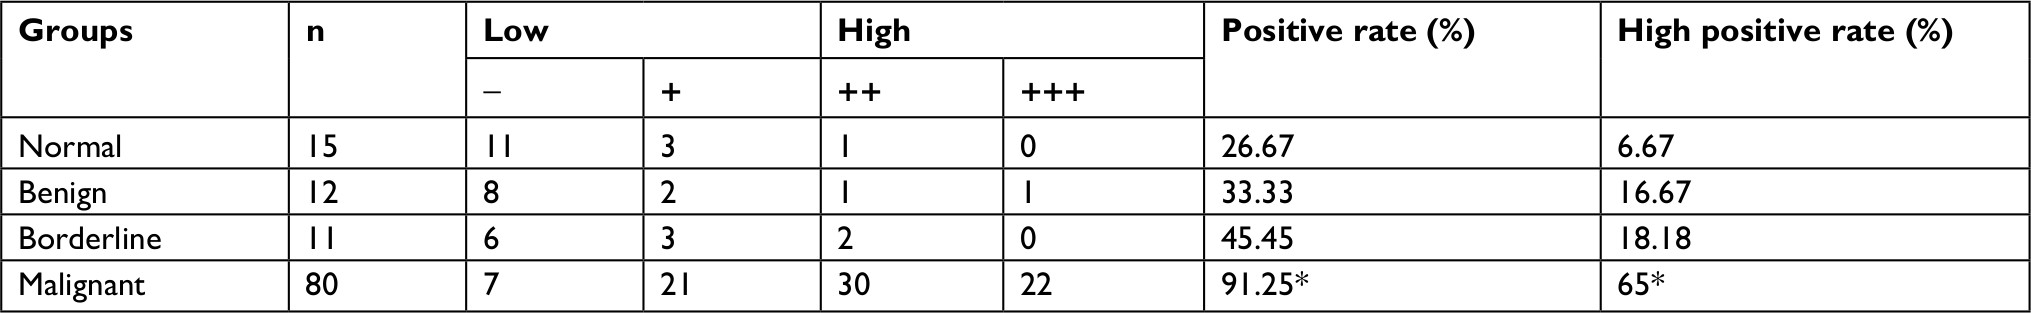 | Table 1 Expression of TMEFF1 in different ovarian serous tissues Note: *P<0.05. |
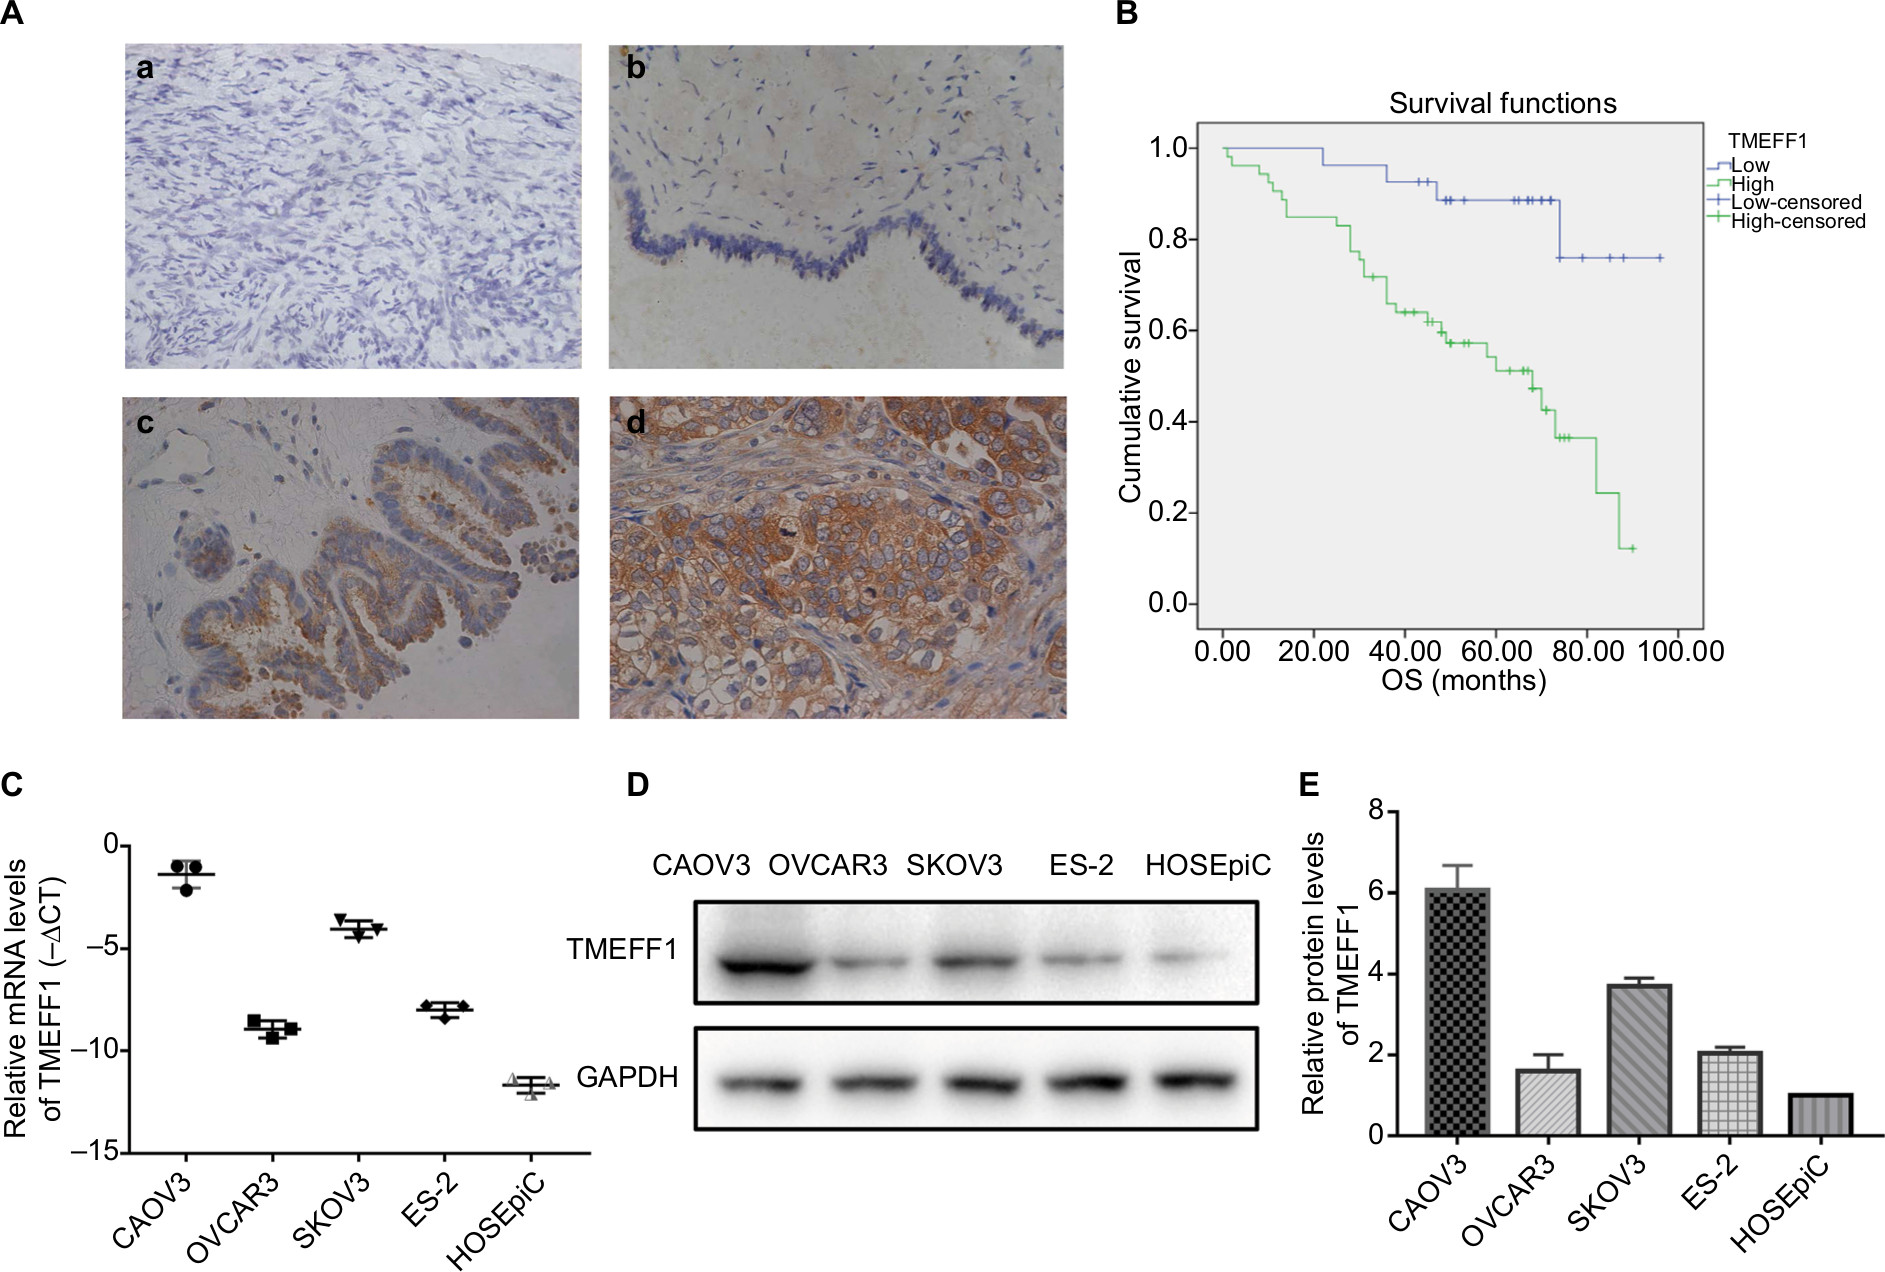 | Figure 1 High expression of TMEFF1 correlates with worse clinical outcomes in ovarian cancer patients and the expression of TMEFF1 in ovarian cancer cell lines. Notes: (A) Expression of TMEFF1 in various types of ovarian tissues: (a) normal ovary; (b) benign epithelial ovarian tumor; (c) borderline epithelial ovarian tumor; and (d) epithelial ovarian cancer (×400). (B) Influence of TMEFF1 expression on the OS of ovarian cancer patients. (C–E) Protein and mRNA expressions of TMEFF1 in four ovarian and one normal ovarian cell lines. Abbreviation: OS, overall survival. |
The correlation between TMEFF1 expression in EOC and clinical pathological parameters
Eighty patients with EOC were randomly divided into two groups according to their TMEFF1 expression level: high expression (++/+++) and low expression (–/+). Statistical analysis of the clinicopathologic data indicated that high expression of TMEFF1 was significantly related to FIGO stage (P=0.024). However, there was no association between its expression and lymph node metastasis, histological type, or differentiation degree (Table 2).
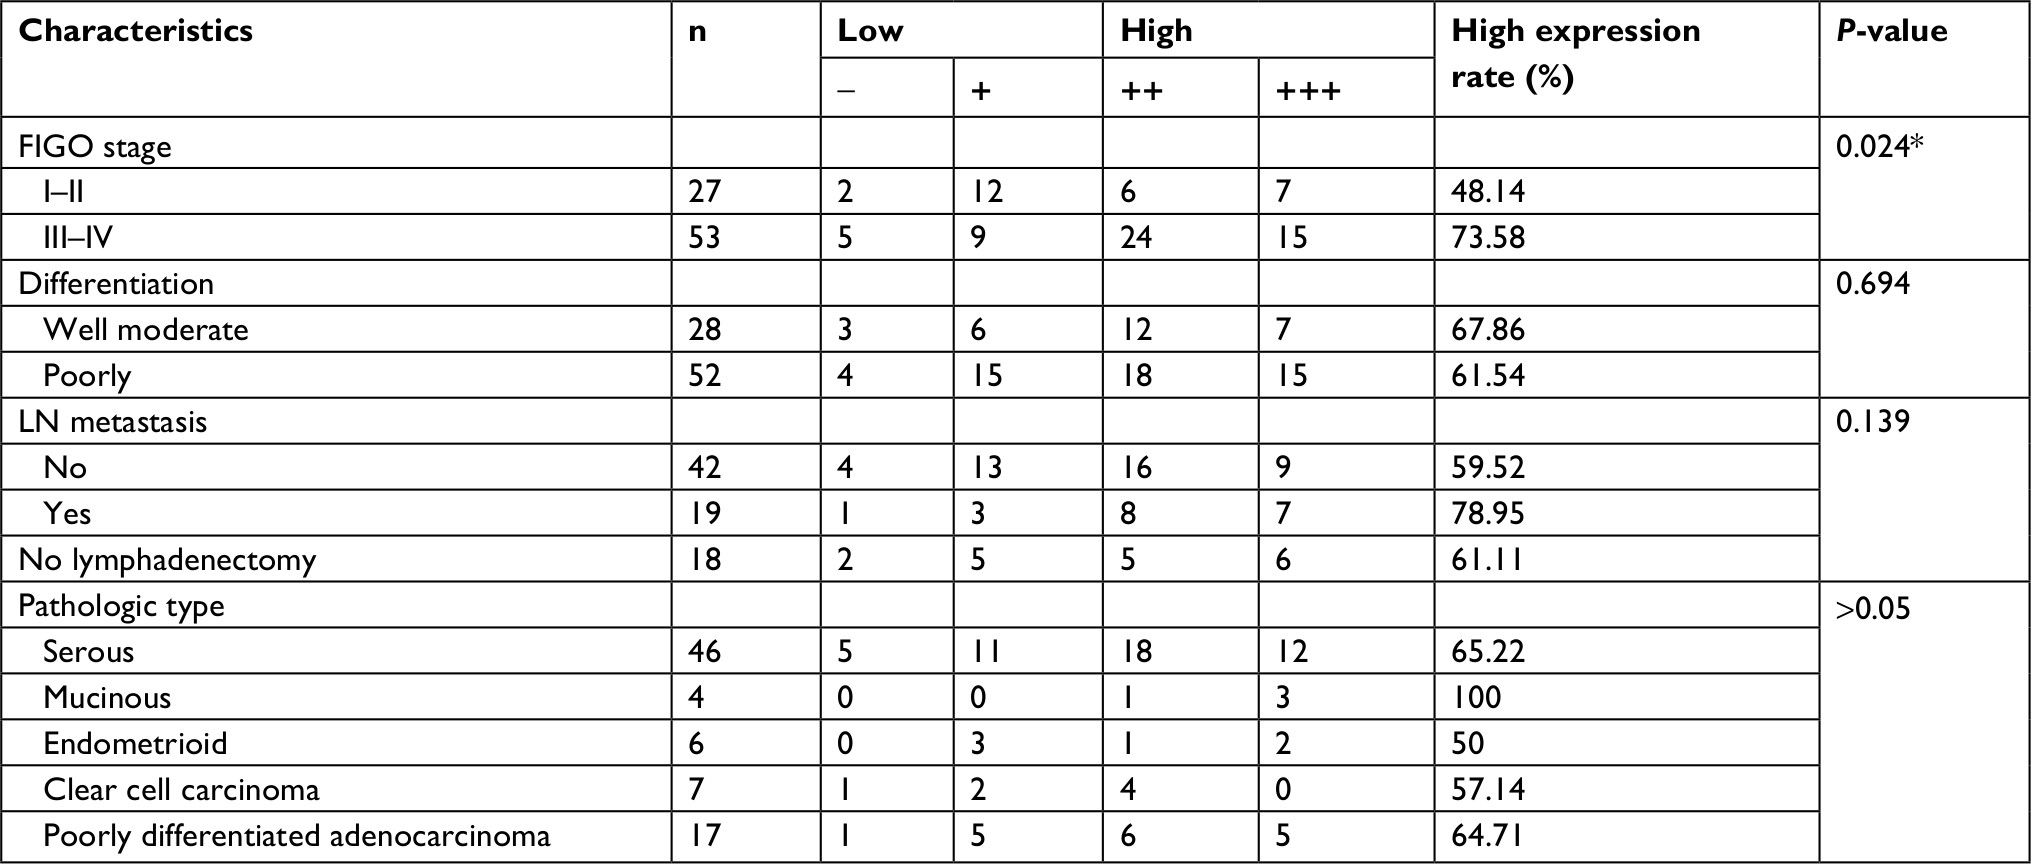 | Table 2 Relationships between TMEFF1 and the clinical pathological parameters in malignant ovarian serous tumors Note: *P<0.05. Abbreviations: FIGO, International Federation of Gynecology and Obstetrics; LN, lymph node. |
Analysis of survival and risk factors for the prognosis of ovarian cancer
Eighty patients with EOC were followed up. The results of follow-up (by August 30, 2017) were analyzed with Kaplan–Meier and log-rank tests. The mortality of the high-expression group was significantly higher than that of the low-expression group. All patients were grouped according to clinical stage, differentiation degree, lymph node metastasis, and pathological type; a pair-wise comparison of mortality showed no significant difference. The relationship between different clinical pathological parameters/indices and the prognosis through Cox regression analysis was explored. The high expression of TMEFF1 was an independent risk factor influencing the overall survival (OS) and prognosis of patients with ovarian cancer: the higher the TMEFF1 expression, the worse the prognosis (P=0.006; Table 3 and Figure 1B).
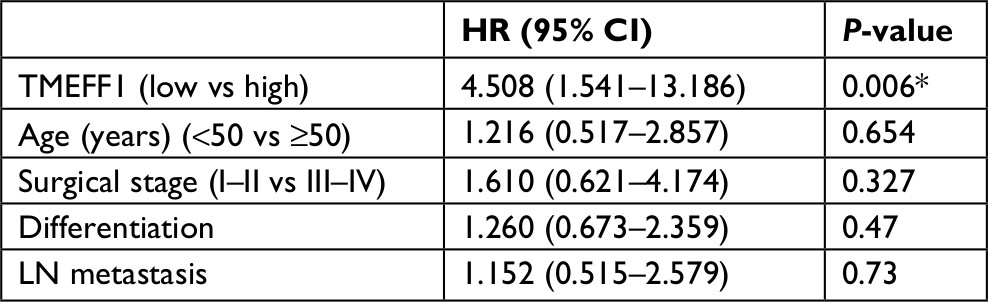 | Table 3 Cox’s regression analysis of prognosis Note: *P<0.01. Abbreviation: LN, lymph node. |
Expression of TMEFF1 in various ovarian cancer cell lines and establishment of ovarian cancer cell line models with stable TMEFF1 expression
TMEFF1 was highly expressed in tumor tissues and was associated with a poor prognosis in ovarian cancer. In our study, TMEFF1 expression in normal ovarian and different ovarian cancer cell lines was detected by RT-qPCR and Western blot. The mRNA and protein expression levels of TMEFF1 in CAOV3 and SKOV3 were higher than those in ES-2 and OVCAR3; however, they were lowest in normal ovarian epithelial cells (HOSEpiC) (Figure 1C–E).
A cell line model for the inhibition of TMEFF1 gene expression was established using CAOV3 and SKOV3 ovarian cancer cells showing high TMEFF1 expression. A cell line model showing stable overexpression of the TMEFF1 gene was made using OVCAR3 and ES-2 ovarian cancer cells with low TMEFF1 expression. The expression level of the TMEFF1 gene was measured by RT-qPCR and Western blot. Compared with the control groups, the mRNA and protein expression levels of TMEFF1 in cells were significantly higher in the overexpression groups but significantly lower in the inhibition groups (Figure 2A–C). Immunocytochemical results were similar to the above results (Figure 2D).
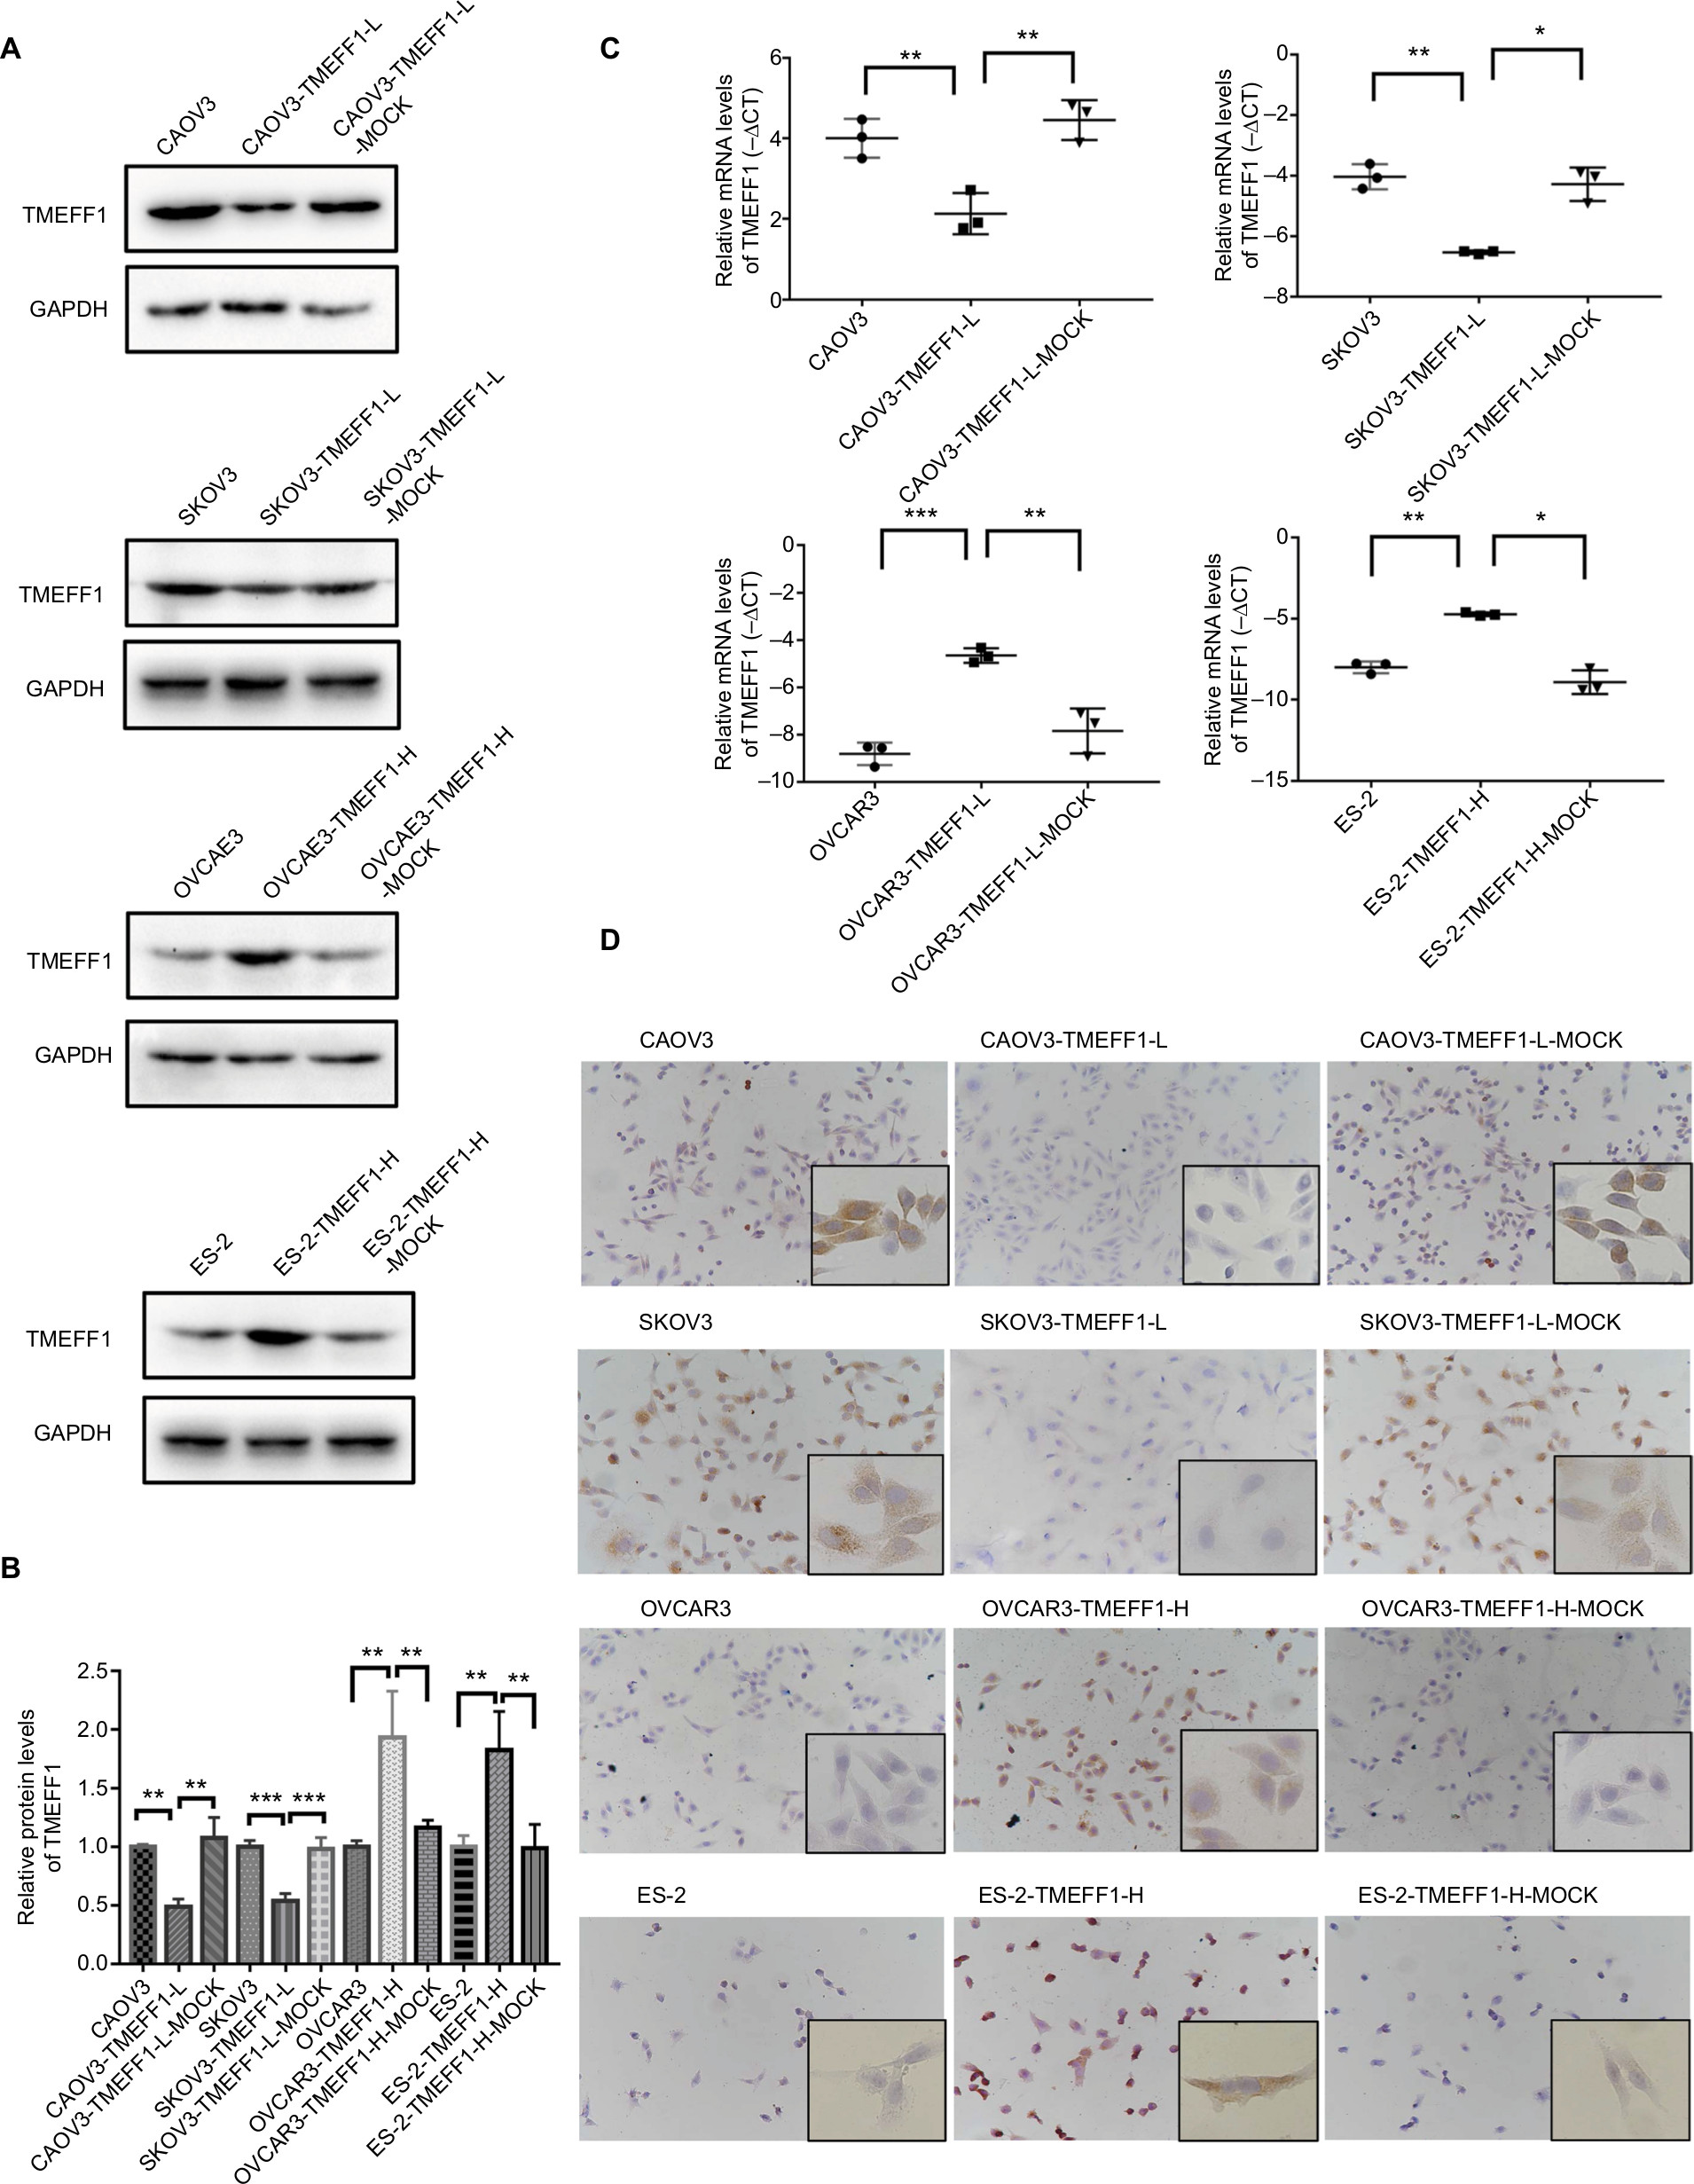 | Figure 2 Detection of the transfection of TMEFF1 in ovarian cancer cell lines. Notes: (A–C) Downregulation of TMEFF1 in CAOV3 and SKOV3 ovarian cancer cell lines, overexpression of TMEFF1 in OVCAR3 and ES-2 ovarian cancer cell lines, and mRNA and protein expressions of TMEFF1. (D) The expression of TMEFF1 was detected via immunocytochemistry in ovarian cancer cells (×200 and ×400). *P<0.05, **P<0.01, and ***P<0.001. |
Influence of differential TMEFF1 expression on the malignant biological behaviors of ovarian cancer cells
Changes in the proliferation, migration, invasion, apoptosis, and cell cycle of CAOV3 and OVCAR3 ovarian cancer cell lines were measured by MTT, flow cytometry, scratch, and transwell assays, before and after the differential expression of the TMEFF1 gene. The MTT assay showed that compared with the control group, the proliferation of cells was significantly higher in the overexpression group but significantly lower in the inhibition group (Figure 3A). The proliferation-related index (proliferating cell nuclear antigen [PCNA]) was detected by Western blot. PCNA expression was increased after the overexpression of TMEFF1 but decreased after the inhibition of TMEFF1 gene expression (Figure 3B and C). Scratch and transwell assays showed that, compared with the control group, the overexpression of TMEFF1 significantly enhanced cell migration and invasion capacities but significantly reduced those in the inhibition group (Figure 3D–G). The apoptotic rate was decreased after the overexpression of TMEFF1 but increased after the inhibition of TMEFF1 expression. When TMEFF1 was overexpressed, the ratio of bcl2/bax increased, indicating that the tumor cells are resistant to apoptosis (Figure 4A–D). In addition, after the overexpression of TMEFF1, the proportion of cells in the G0/G1 phase was significantly decreased and that of cells in S and G2–M phases increased significantly. After the inhibition of TMEFF1 expression, the proportion of cells in the G0/G1 phase was significantly increased and that of cells in S and G2–M phases was significantly decreased (Figure 4E and F). These results strongly suggest that overexpression of TMEFF1 is able to promote the proliferation, invasion, and migration and inhibit the apoptosis of ovarian cancer cells.
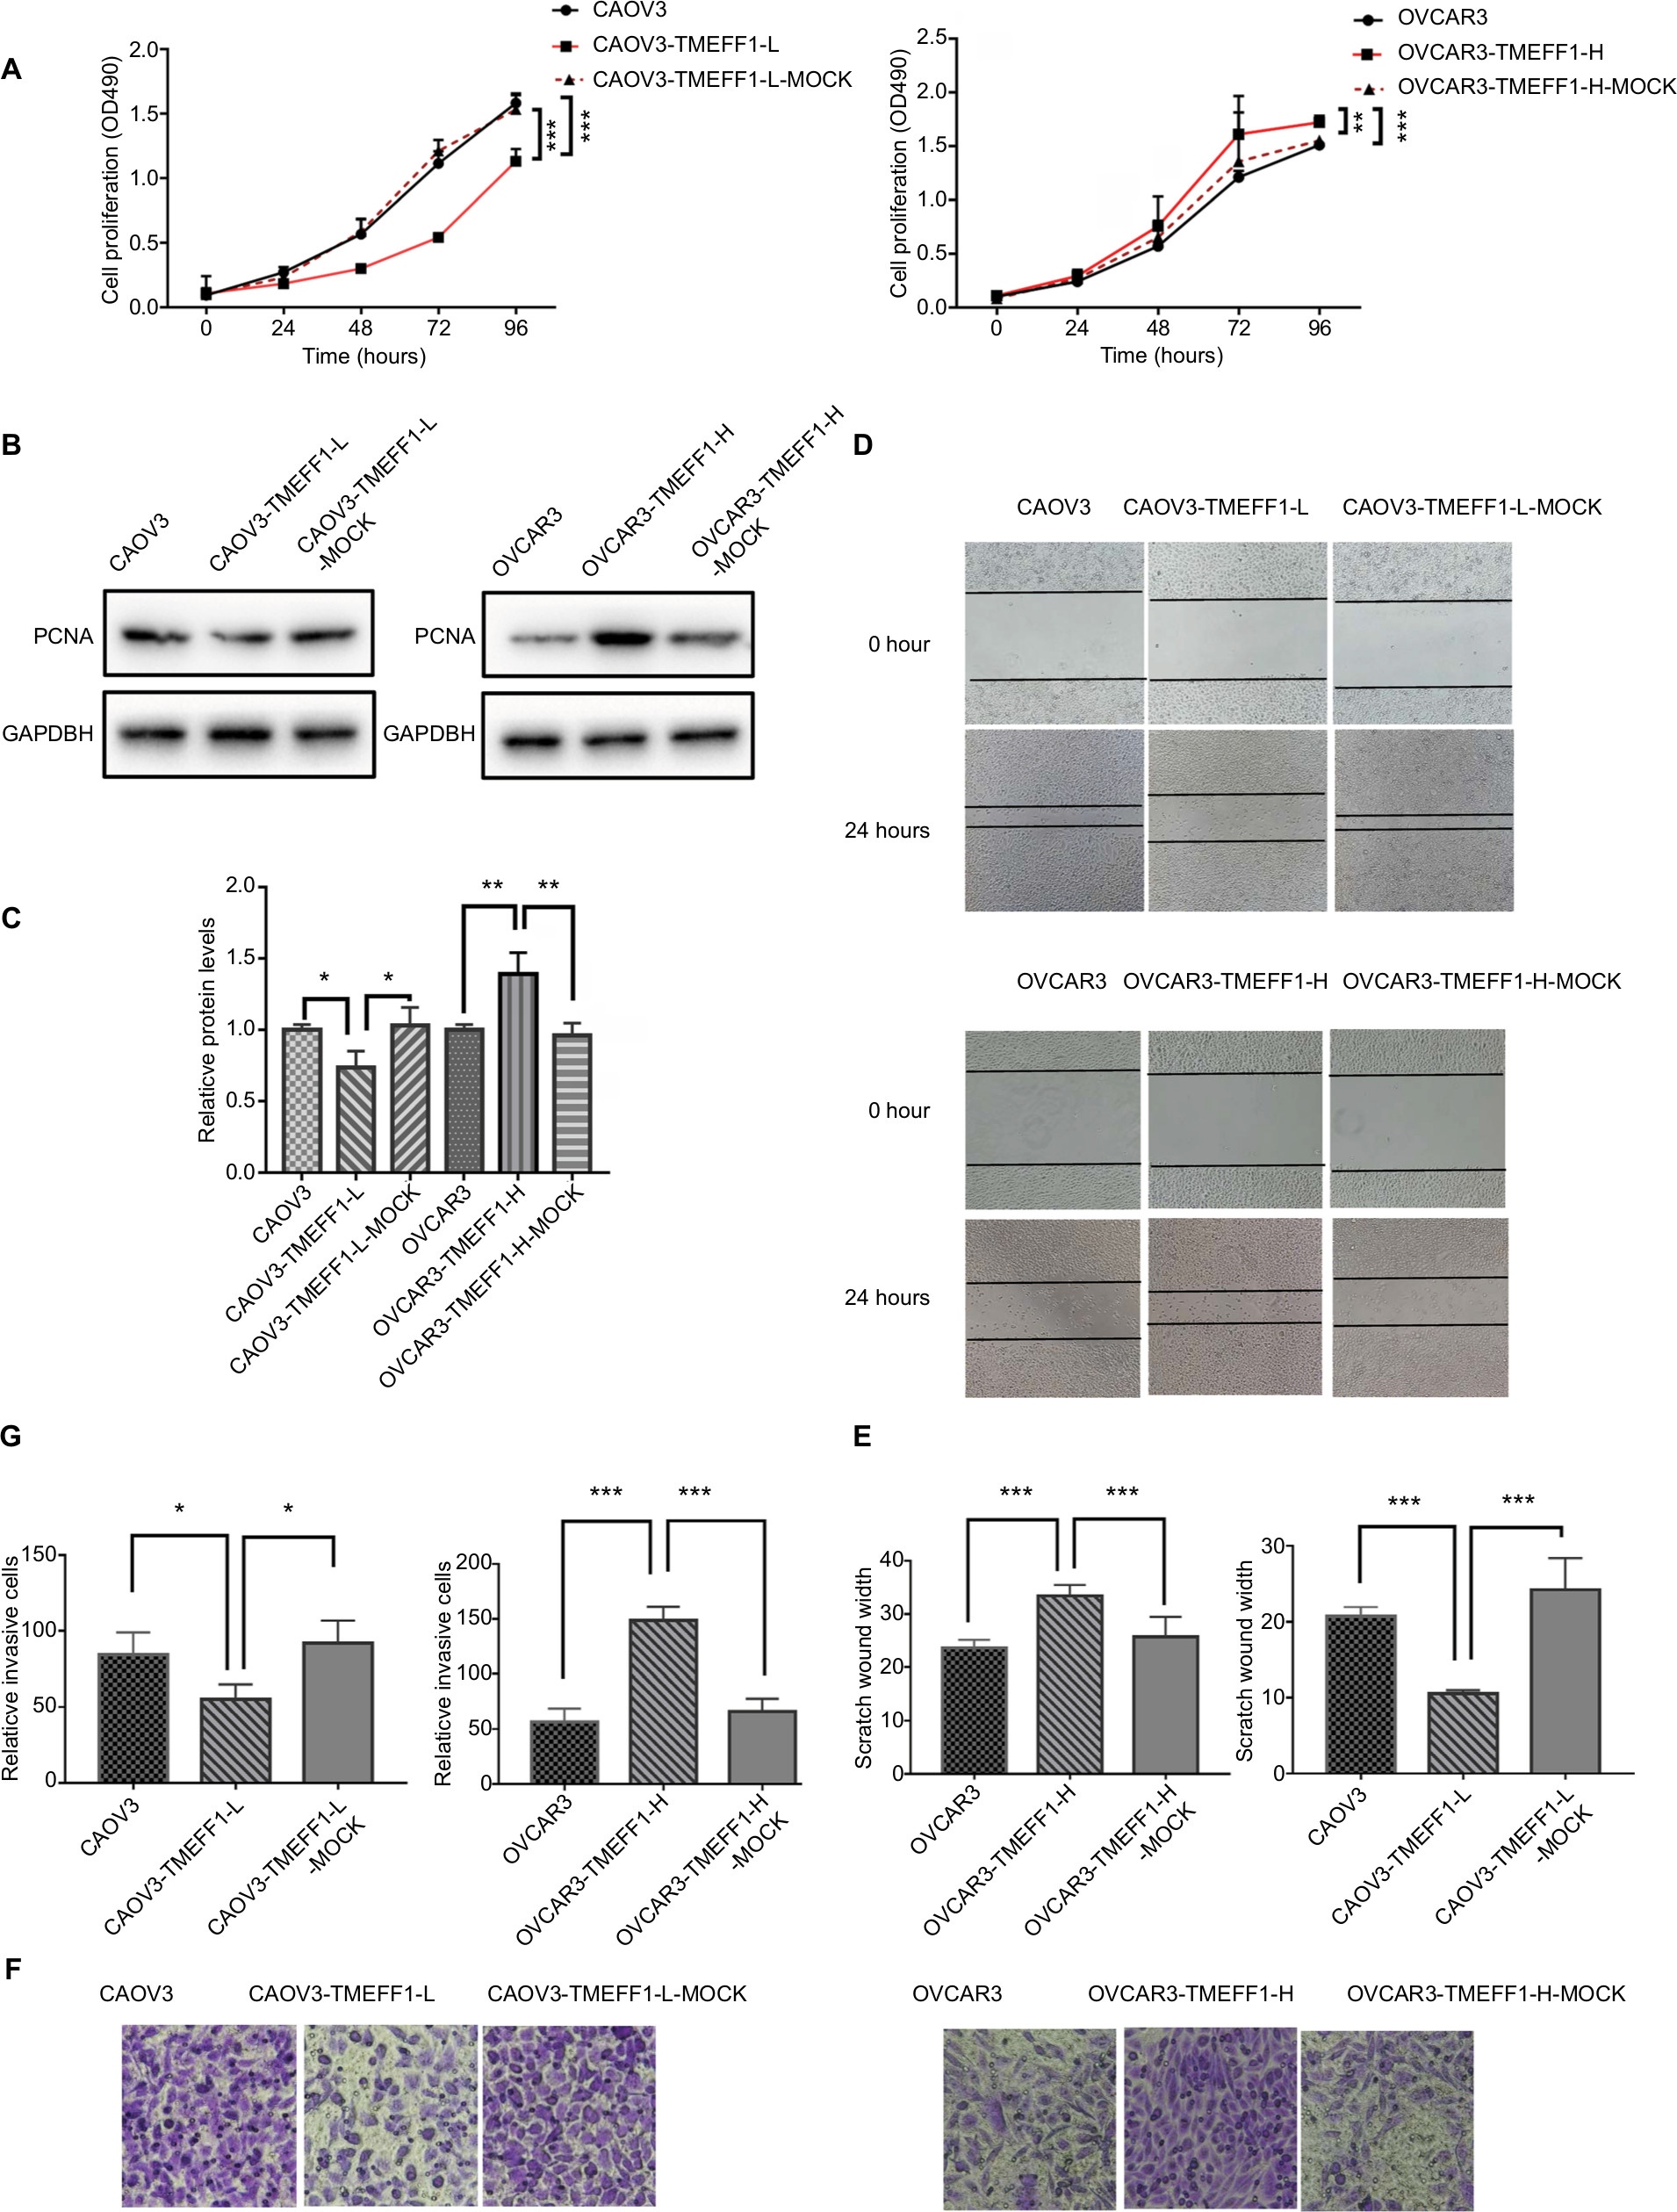 | Figure 3 TMEFF1 promoted proliferation, migration, and invasion in CAOV3 and OVCAR3 ovarian cancer cell lines. Notes: (A–C) Influence of TMEFF1 expression on the proliferation of CAOV3 and OVCAR3 cells and differential expression of PCNA. (D and E) Influence of TMEFF1 expression on the migration of CAOV3 and OVCAR3 cells. (F and G) Influence of TMEFF1 expression on invasion by cells (×400). *P<0.05, **P<0.01, and ***P<0.001. Abbreviation: PCNA, proliferating cell nuclear antigen. |
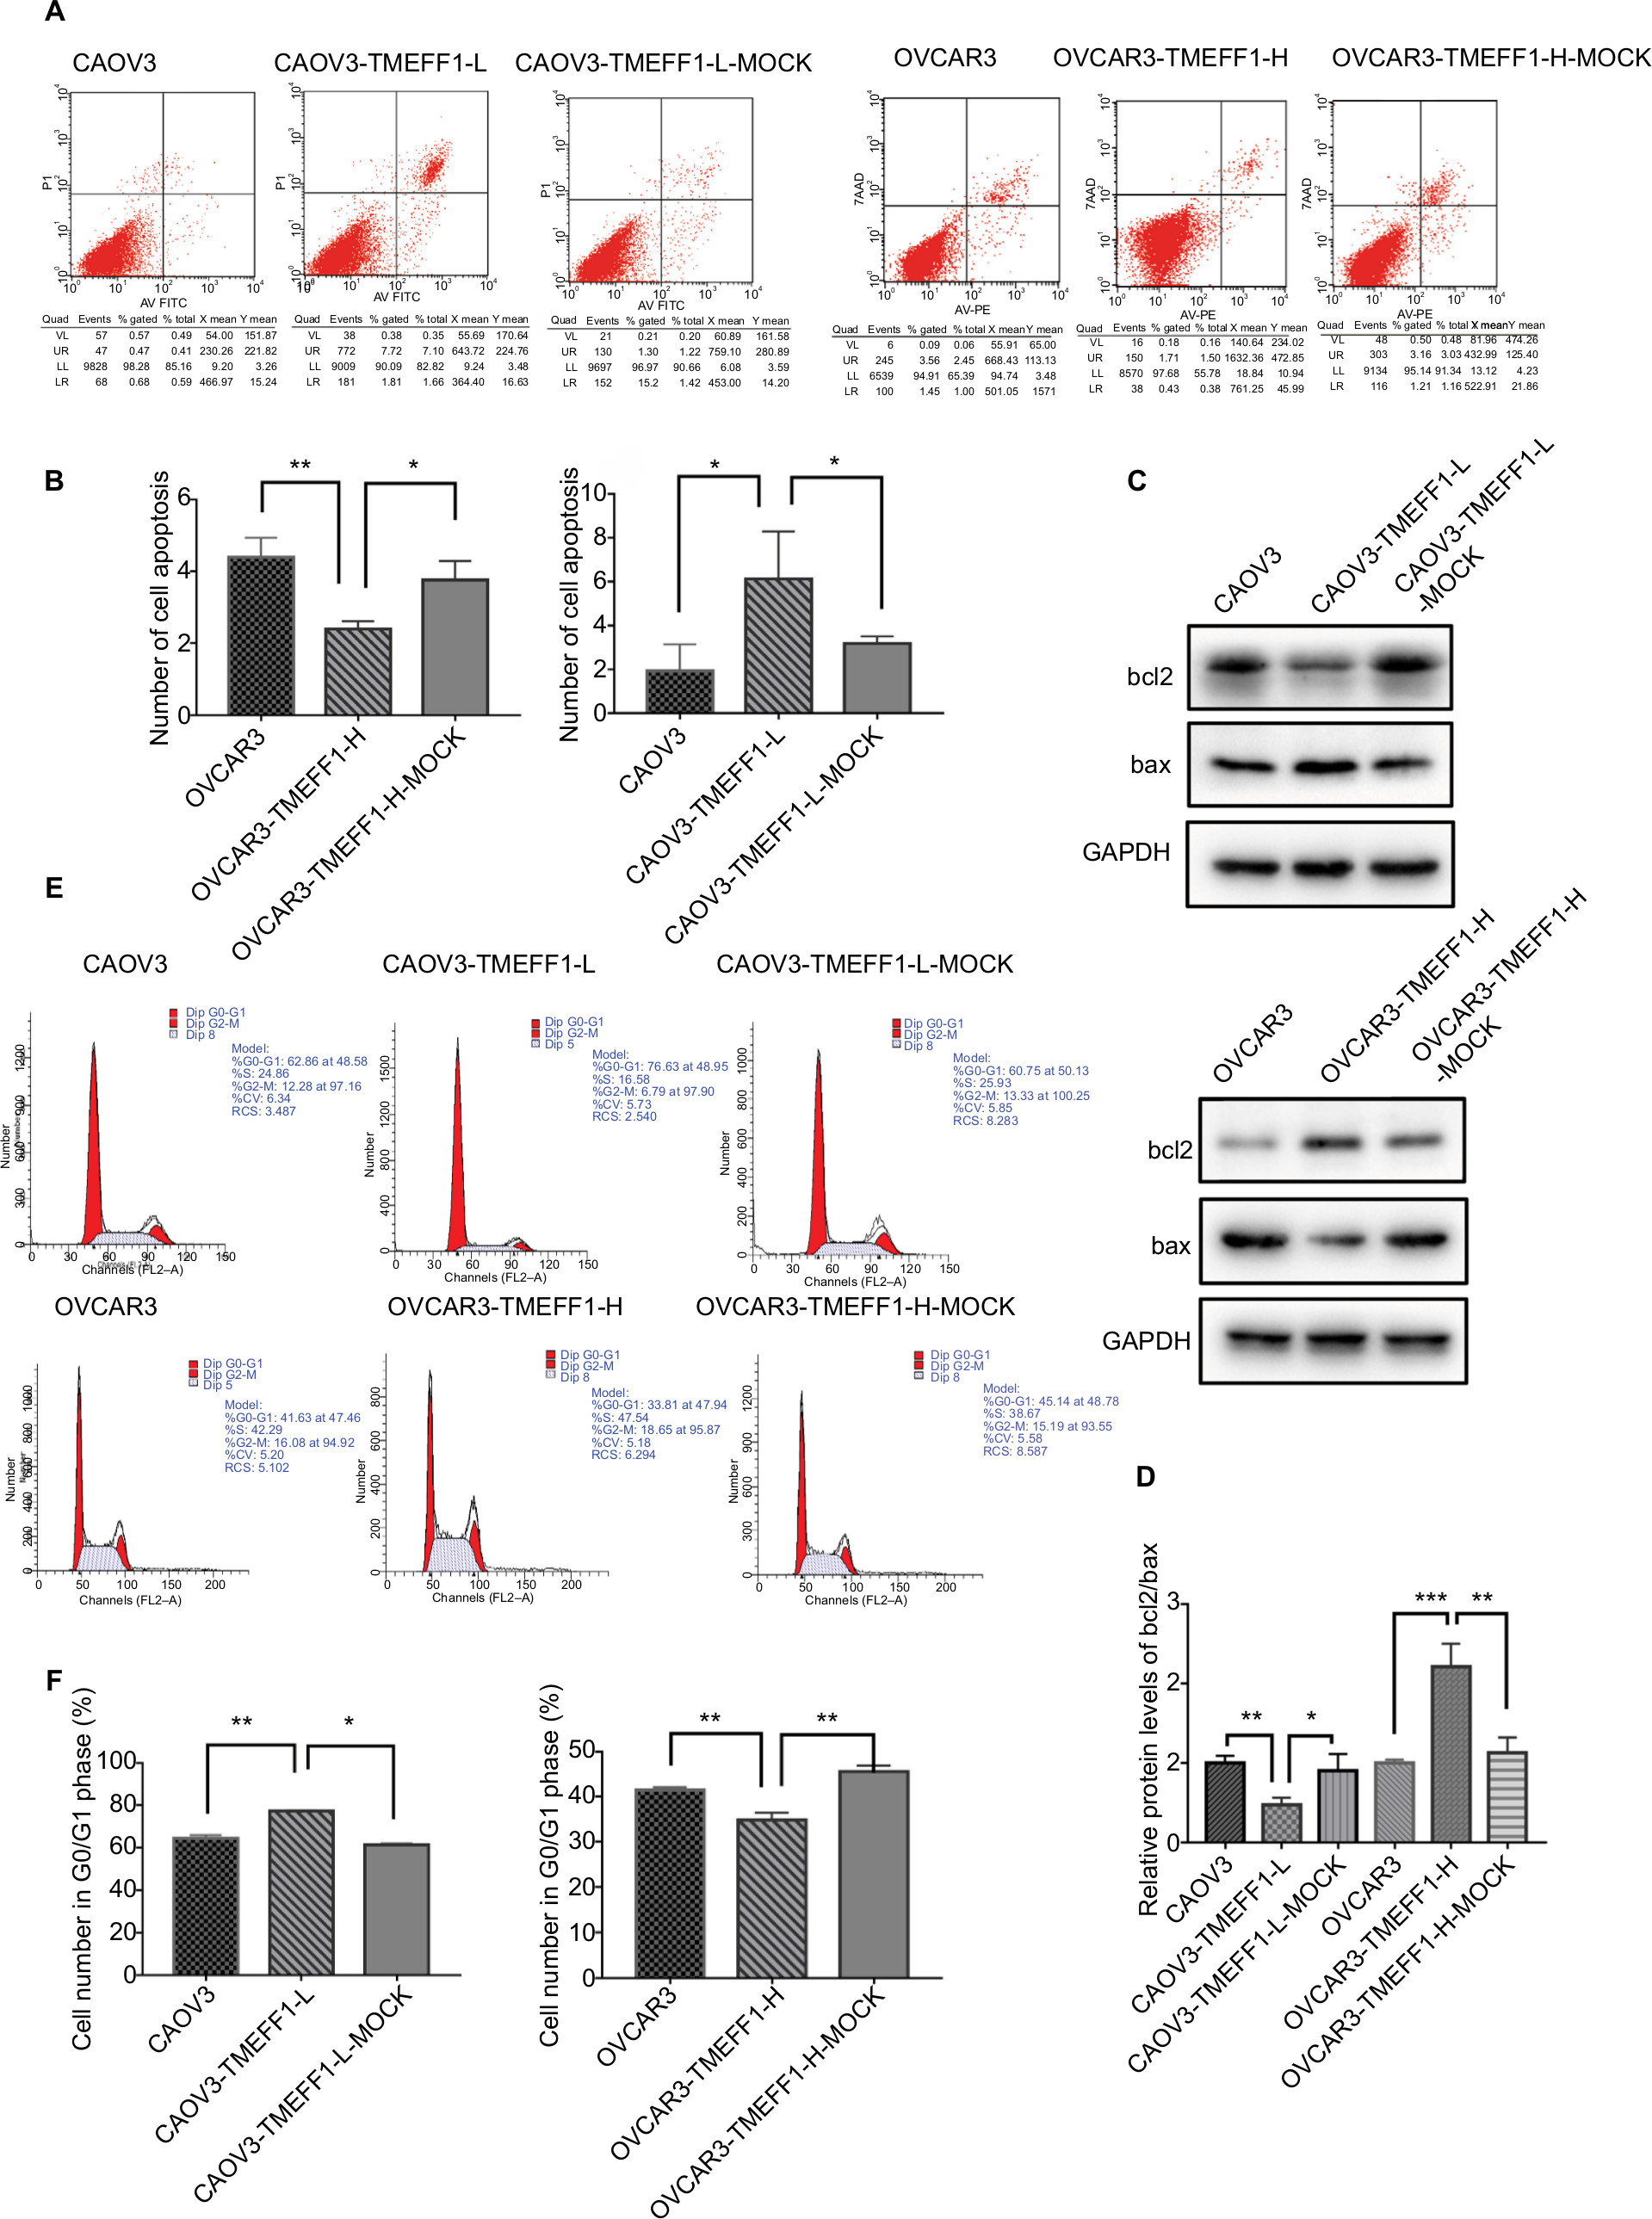 | Figure 4 TMEFF1 influenced apoptosis and cell cycle in CAOV3 and OVCAR3 ovarian cancer cell lines. Notes: (A–D) Influence of TMEFF1 expression on the apoptosis of cells and changes in bcl2/bax expression. (E and F) Influence of TMEFF1 on the cell cycle. *P<0.05, **P<0.01, and ***P<0.001. Abbreviations: 7AAD, 7-aminoactinomycin D; PE, phycoerythrin. |
Changes in the expression of epithelial–mesenchymal transition (EMT)-related proteins (E-cadherin, vimentin, N-cadherin, MMP2, and MMP9) before and after differential TMEFF1 expression
In order to understand the mechanisms involved in the influence of TMEFF1 on the invasion/migration by ovarian cancer cells, changes in the expression of indices (E-cadherin, vimentin, N-cadherin, MMP2, and MMP9) related to EMT were detected by Western blot before and after differential expression of the TMEFF1 gene. After overexpression of the TMEFF1 gene, the expression of an epithelial marker protein (E-cadherin) decreased and that of mesenchymal marker proteins (vimentin and N-cadherin), as well as MMP2 and MMP, increased. After the inhibition of TMEFF1 gene expression, the expression of vimentin, N-cadherin, MMP2, and MMP9 decreased but that of E-cadherin significantly increased (Figure 5A and B). The results indicated that TMEFF1 is involved in the regulation of EMT in ovarian cancer cells.
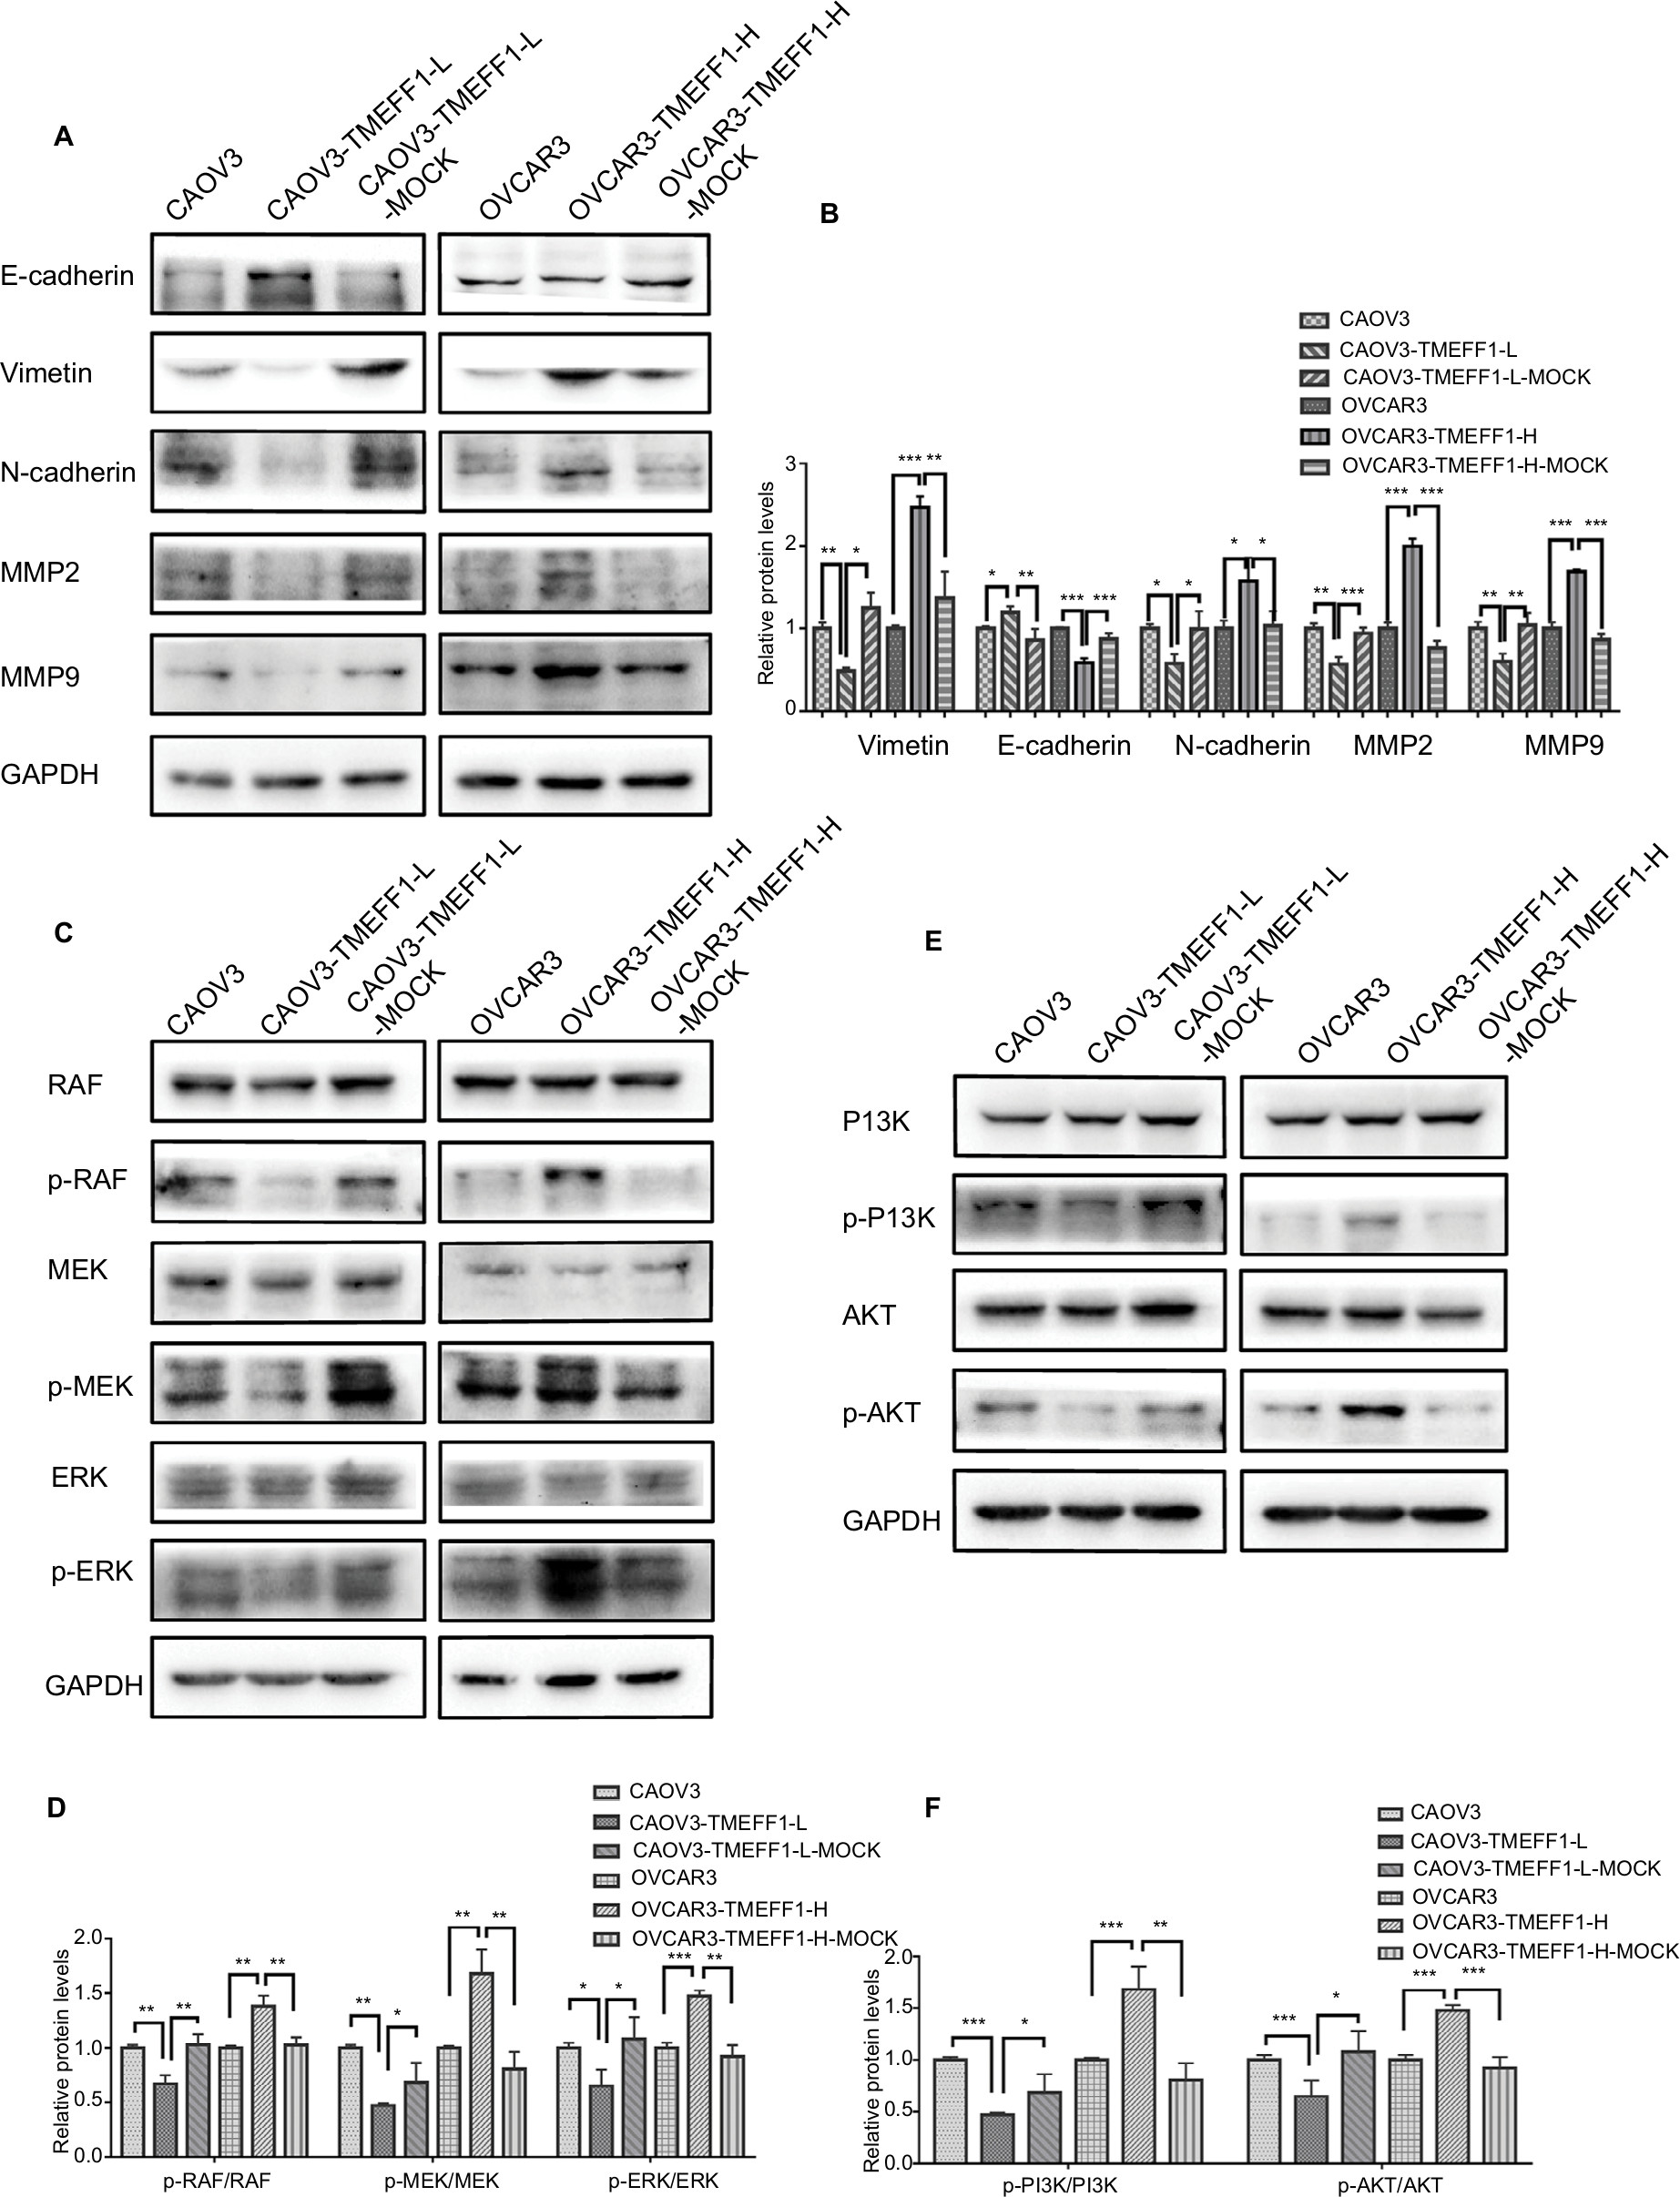 | Figure 5 In CAOV3 and OVCAR3 ovarian cancer cell lines, TMEFF1 activated the MAPK and PI3K/AKT signaling pathways and regulated the expression of EMT-related proteins. Notes: (A and B) In CAOV3 and OVCAR3 cells, TMEFF1 increased the expression of vimentin, N-cadherin, MMP2, and MMP9 but decreased the expression of E-cadherin. (C and D) Phosphorylation changes in MAPK pathway-associated nodal proteins (RAF/MEK/ERK) in CAOV3 and OVCAR3 ovarian cancer cell lines before and after TMEFF1 transfection. (E and F) Phosphorylation changes in PI3K/AKT pathway-associated nodal proteins (PI3K/AKT) after the differential expression of TMEFF1. *P<0.05, **P<0.01, and ***P<0.001. Abbreviation: EMT, epithelial–mesenchymal transition. |
Changes in the expression of proteins (Raf, p-Raf, ERK, p-ERK, MEK, p-MEK, PI3K, p-PI3K, AKT, and p-AKT) before and after differential TMEFF1 expression
The changes in the expression of Raf, p-Raf, ERK, pERK, MEK, pMEK, p-PI3K, PI3K, p-AKT, and AKT in CAOV3 and OVCAR3 cells were detected by Western blot before and after the differential expression of the TMEFF1 gene. Compared with the control group, the expression proportions of p-Raf/Raf, p-MEK/MEK, p-ERK/ERK, p-PI3K/PI3K, and p-AKT/AKT in cells increased after the overexpression of the TMEFF1 gene, but these decreased in CAOV3 cells after inhibition of the TMEFF1 gene (Figure 5C–F). Therefore, TMEFF1 activated MAPK and PI3K/AKT signaling pathways.
Influence of MAPK and PI3K pathway inhibitors on the biological behaviors of TMEFF1 overexpressing ovarian cancer cell lines
In order to further verify the influence of TMEFF1 on MAPK and PI3K signaling pathways, changes in proliferation, invasion, migration, apoptosis, and cell cycle by TMEFF1 overexpressing ovarian cancer cell lines (OVCAR3, OVCAR3-TMEFF1-H, and OVCAR3-TMEFF1-H-Mock) were measured before and after the use of MAPK or PI3K pathway inhibitors. After the addition of MAPK or PI3K pathway inhibitors, proliferation by OVCAR3-TMEFF1-H cells decreased significantly according to an MTT assay (Figure 6A). MAPK or PI3K pathway inhibitors also significantly decreased migration by OVCAR3-TMEFF1-H cells in a scratch assay (Figure 6B and C). In a Transwell invasion assay, MAPK or PI3K pathway inhibitors significantly decreased invasion by OVCAR3-TMEFF1-H cells (Figure 6D and E). The addition of MAPK or PI3K pathway inhibitors significantly increased the apoptosis rate in OVCAR3-TMEFF1-H cells according to Annexin-V-PE/7AAD double-staining flow cytometry (Figure 7A and B). After the addition of PI3K pathway inhibitors, the number of OVCAR3-TMEFF1-H cells in G0/G1 phase increased significantly, but the number of cells in S and G2/M phases decreased significantly according to a cell cycle assay (Figure 7C and D). After the addition of MAPK pathway inhibitors, the number of cells in G0/G1 phase was decreased slightly, but this was not significant (Figure 7D), which differed from the manner in which TMEFF1 influenced the cell cycle. In our view, TMEFF1 was not involved in the regulation of the cell cycle via an MAPK pathway. Therefore, our results suggest that TMEFF1 can activate MAPK and PI3K signaling pathways to affect malignant biological behaviors of ovarian cancer cells (such as proliferation, apoptosis, invasion, and migration), but TMEFF1 regulated the cell cycle only via a PI3K signaling-dependent pathway.
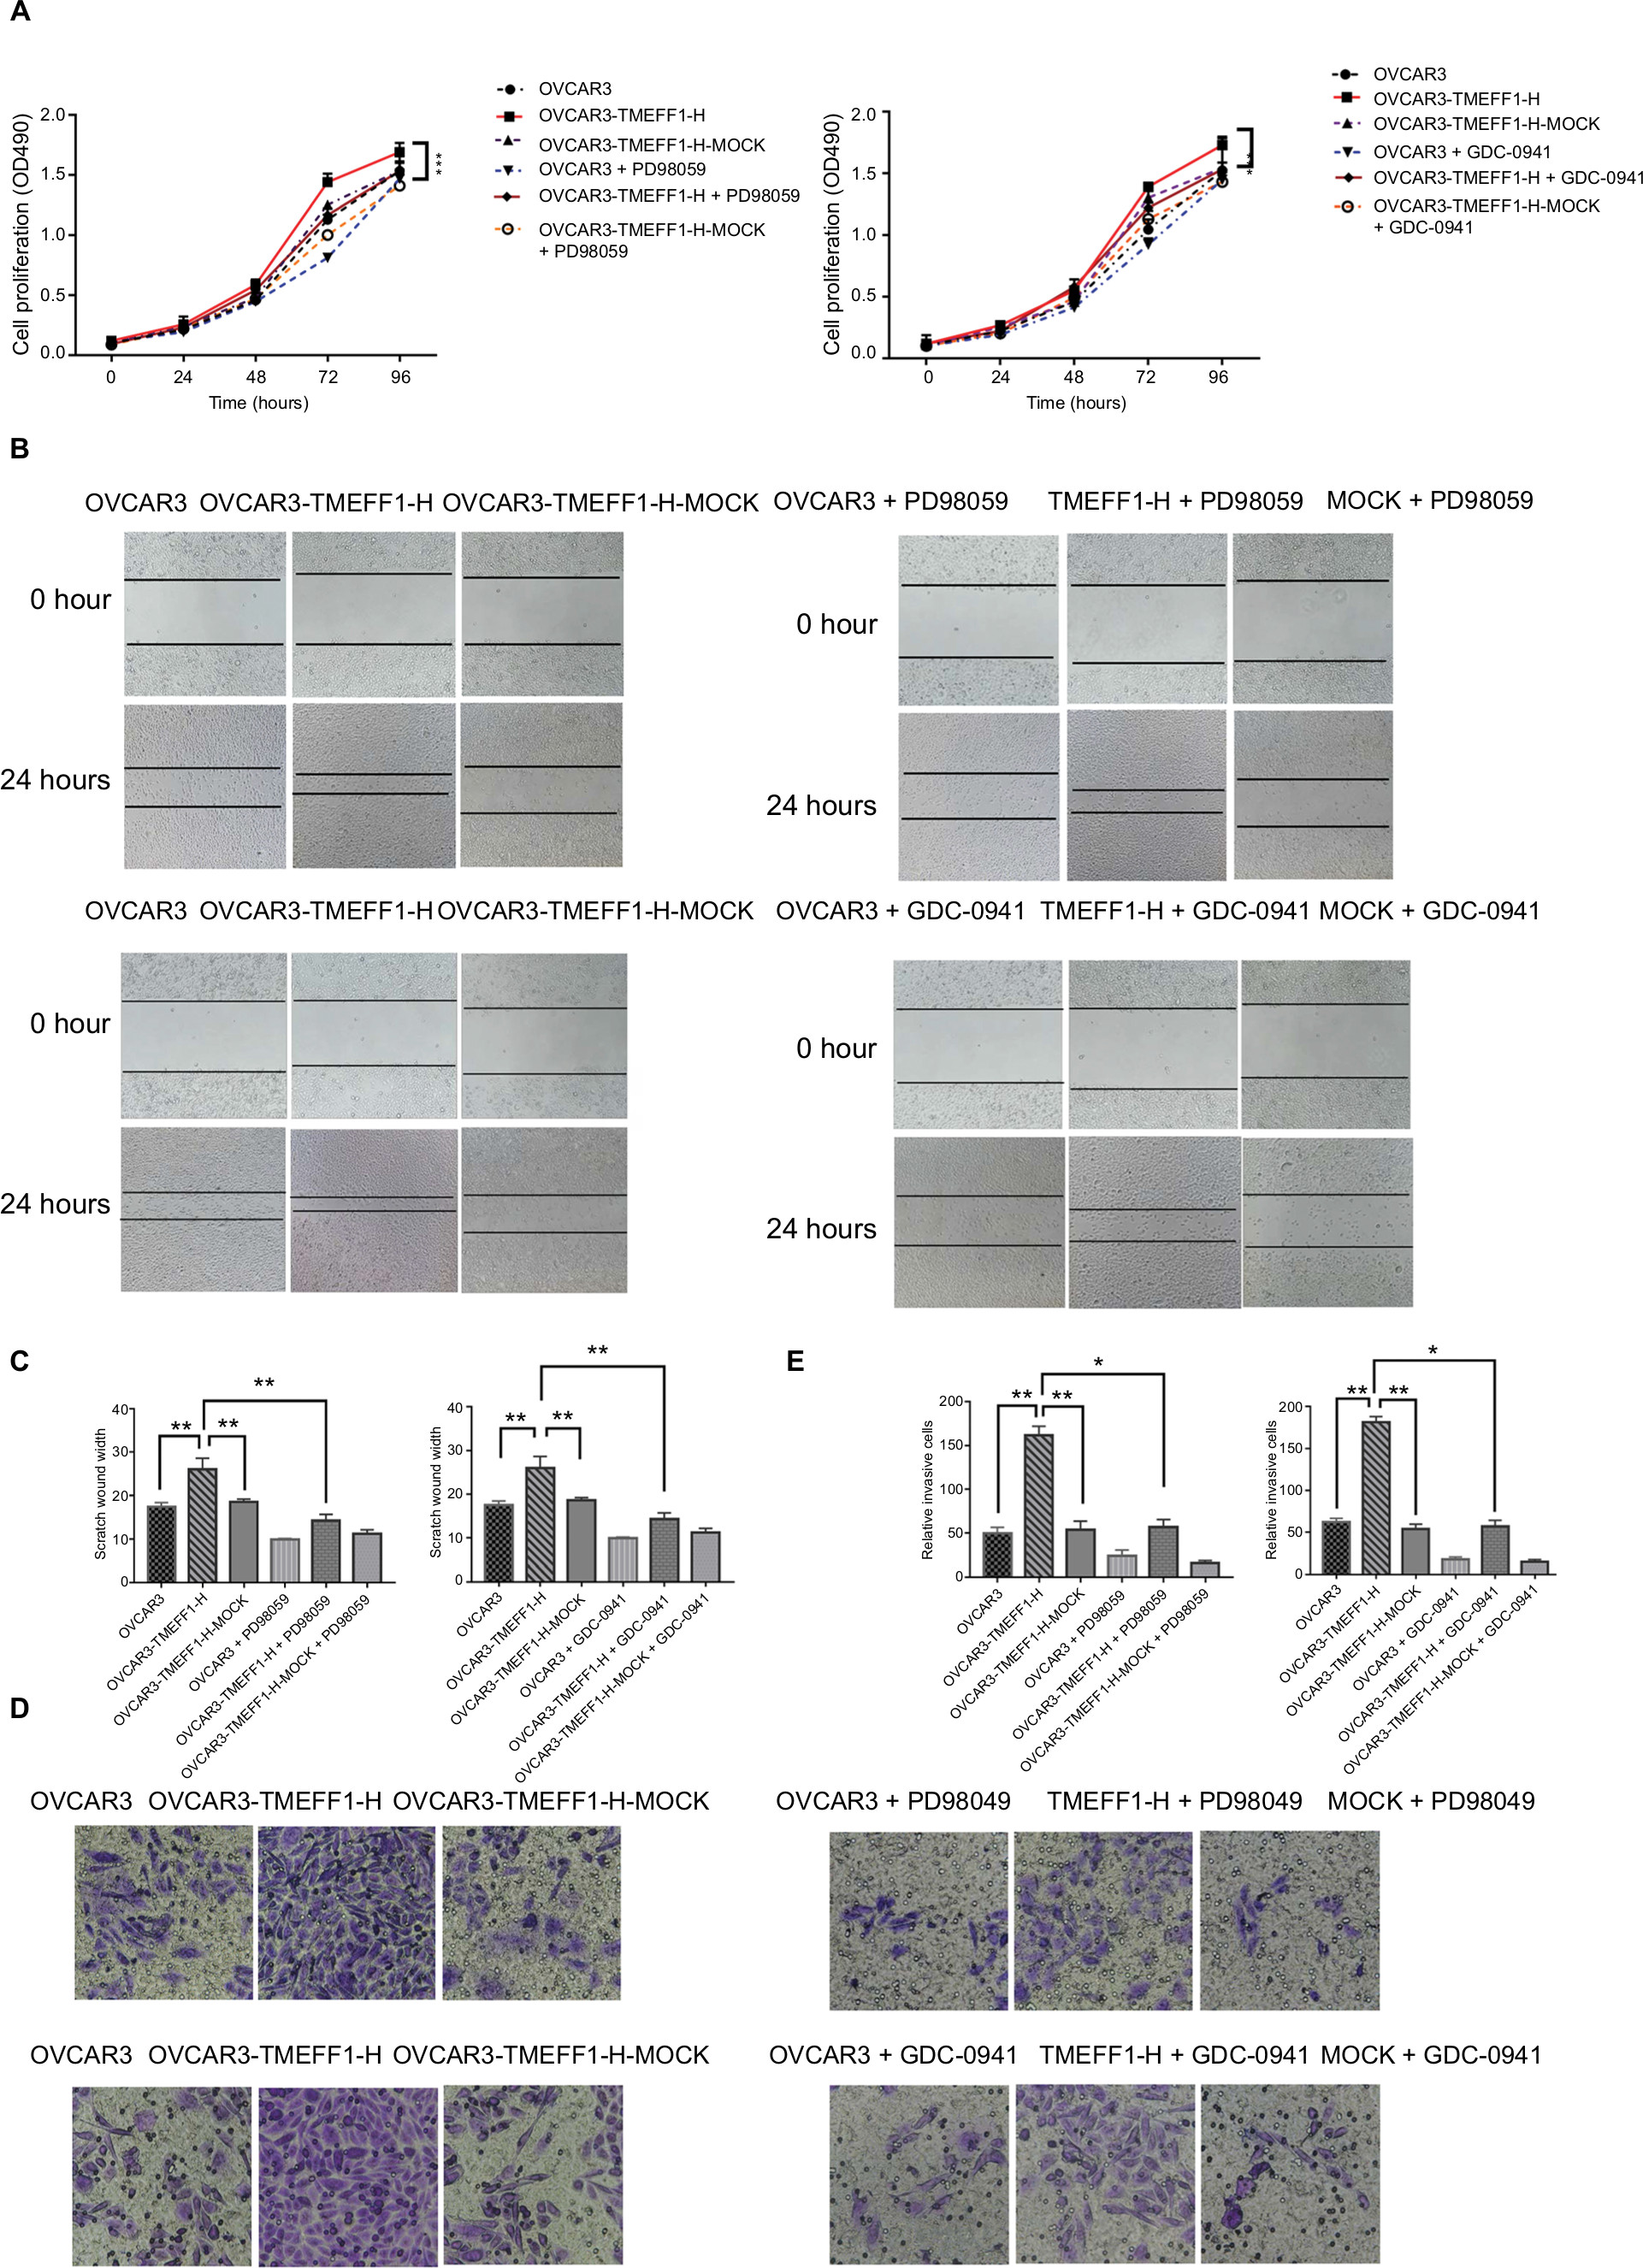 | Figure 6 TMEFF1 promoted proliferation, migration, and invasion in CAOV3 and OVCAR3 ovarian cancer cell lines through MAPK and PI3K/AKT pathways. Notes: (A) Proliferation induced by TMEFF1 in CAOV3 and OVCAR3 cells decreased after the addition of MAPK (PD98059) or PI3K (GDC-0941) pathway inhibitors. (B and C) Migration induced by TMEFF1 decreased after the addition of PD98059 or GDC-0941. (D and E) Invasion induced byTMEFF1 decreased after the addition of PD98059 or GDC-0941 (×400). *P<0.05, **P<0.01, and ***P<0.001. |
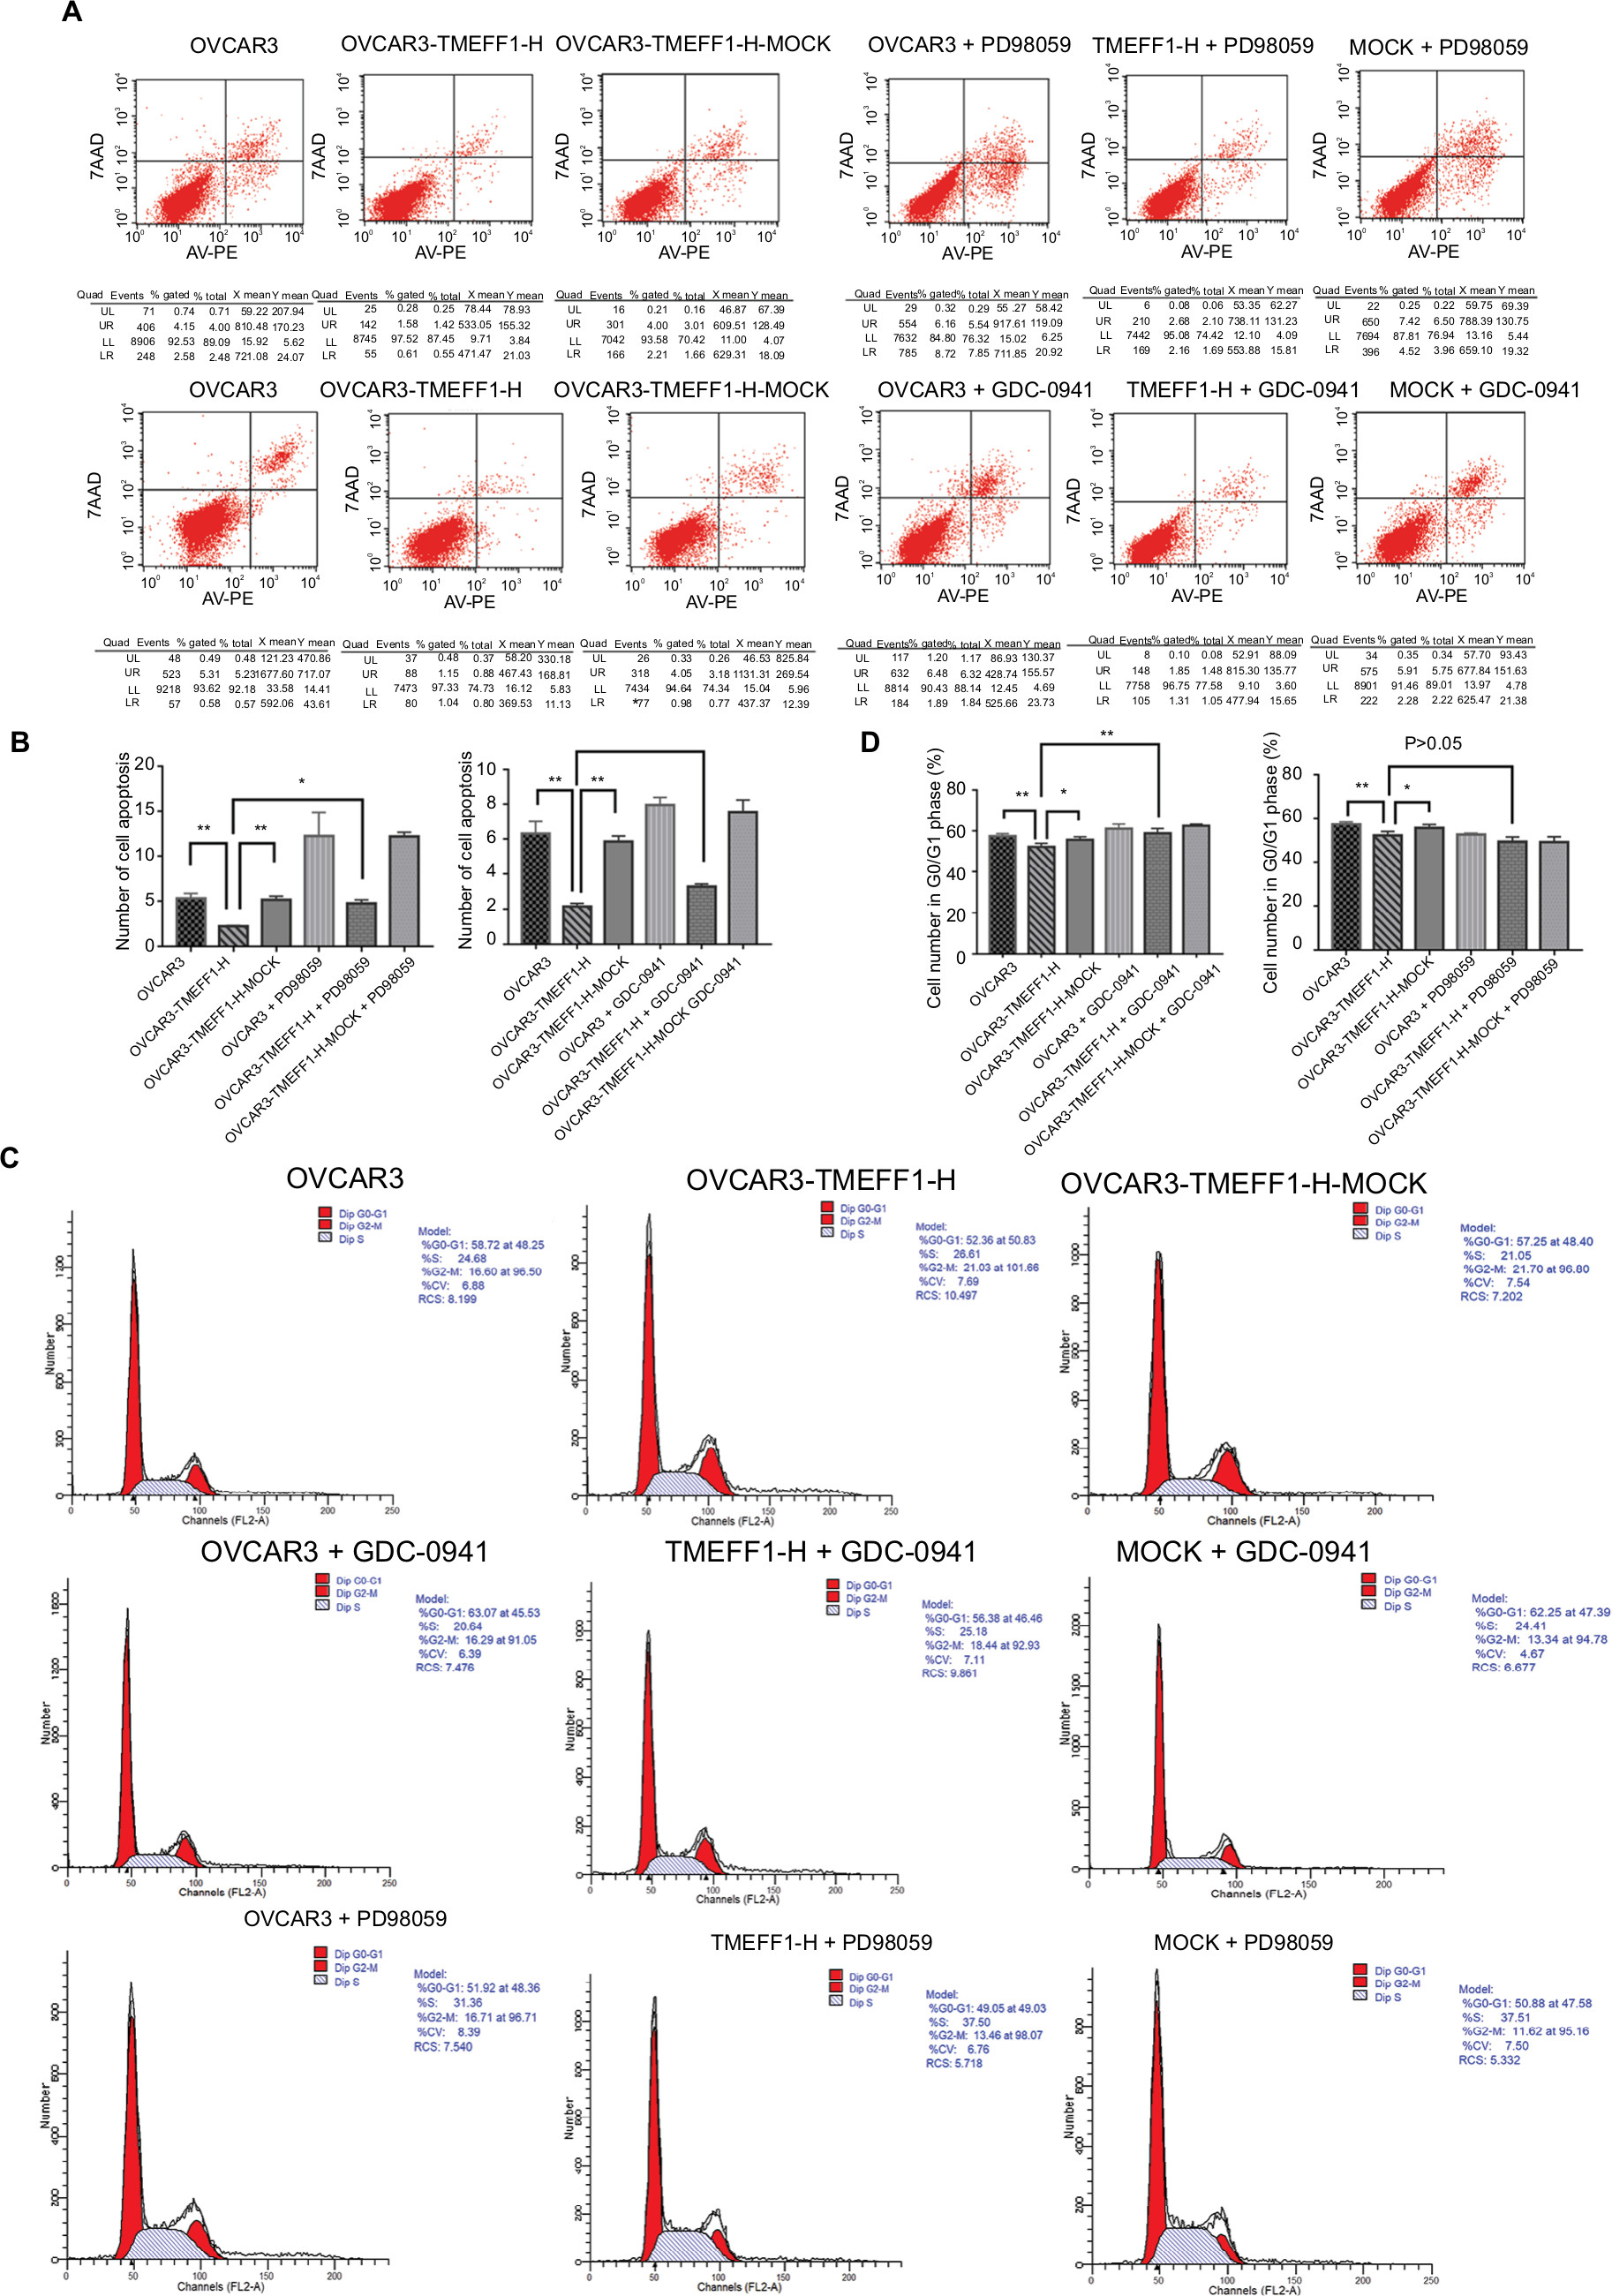 | Figure 7 TMEFF1 influenced apoptosis and cell cycle in CAOV3 and OVCAR3 ovarian cancer cell lines through MAPK and PI3K/AKT pathways. Notes: (A and B) After the addition of PD98059 or GDC-0941, the effect of TMEFF1 in decreasing the apoptosis was suppressed. (C and D) After the addition of GDC-0941, the effects of TMEFF1 in decreasing the proportion of cells in G0/G1 phase and increasing cells in S and G2–M phases were suppressed, which was not found after the addition of PD98059 (P>0.05). *P<0.05, and **P<0.01. Abbreviations: 7AAD, 7-aminoactinomycin D; PE, phycoerythrin. |
Direct regulation of TMEFF1 expression by the transcription factor p53 in an ovarian cancer cell line
Through the analysis using the bioinformatic methods, we found that p53 in ovarian cancer is closely correlated with TMEFF1 and can bind to the forward promoter region of TMEFF1 gene (Figure 8A). As shown by a ChIP assay, the transcription factor, p53, in CAOV3 cells and ES-2 cells bound to the promoter region of TMEFF1 and thus participated in the regulation of TMEFF1 expression (Figure 8B). Changes in TMEFF1 expression in CAOV3 cells and ES-2 cells were detected by Western blot before and after TP53 knockout with siRNA. After the inhibition of TP53 expression, TMEFF1 expression was significantly downregulated (Figure 8C and D).
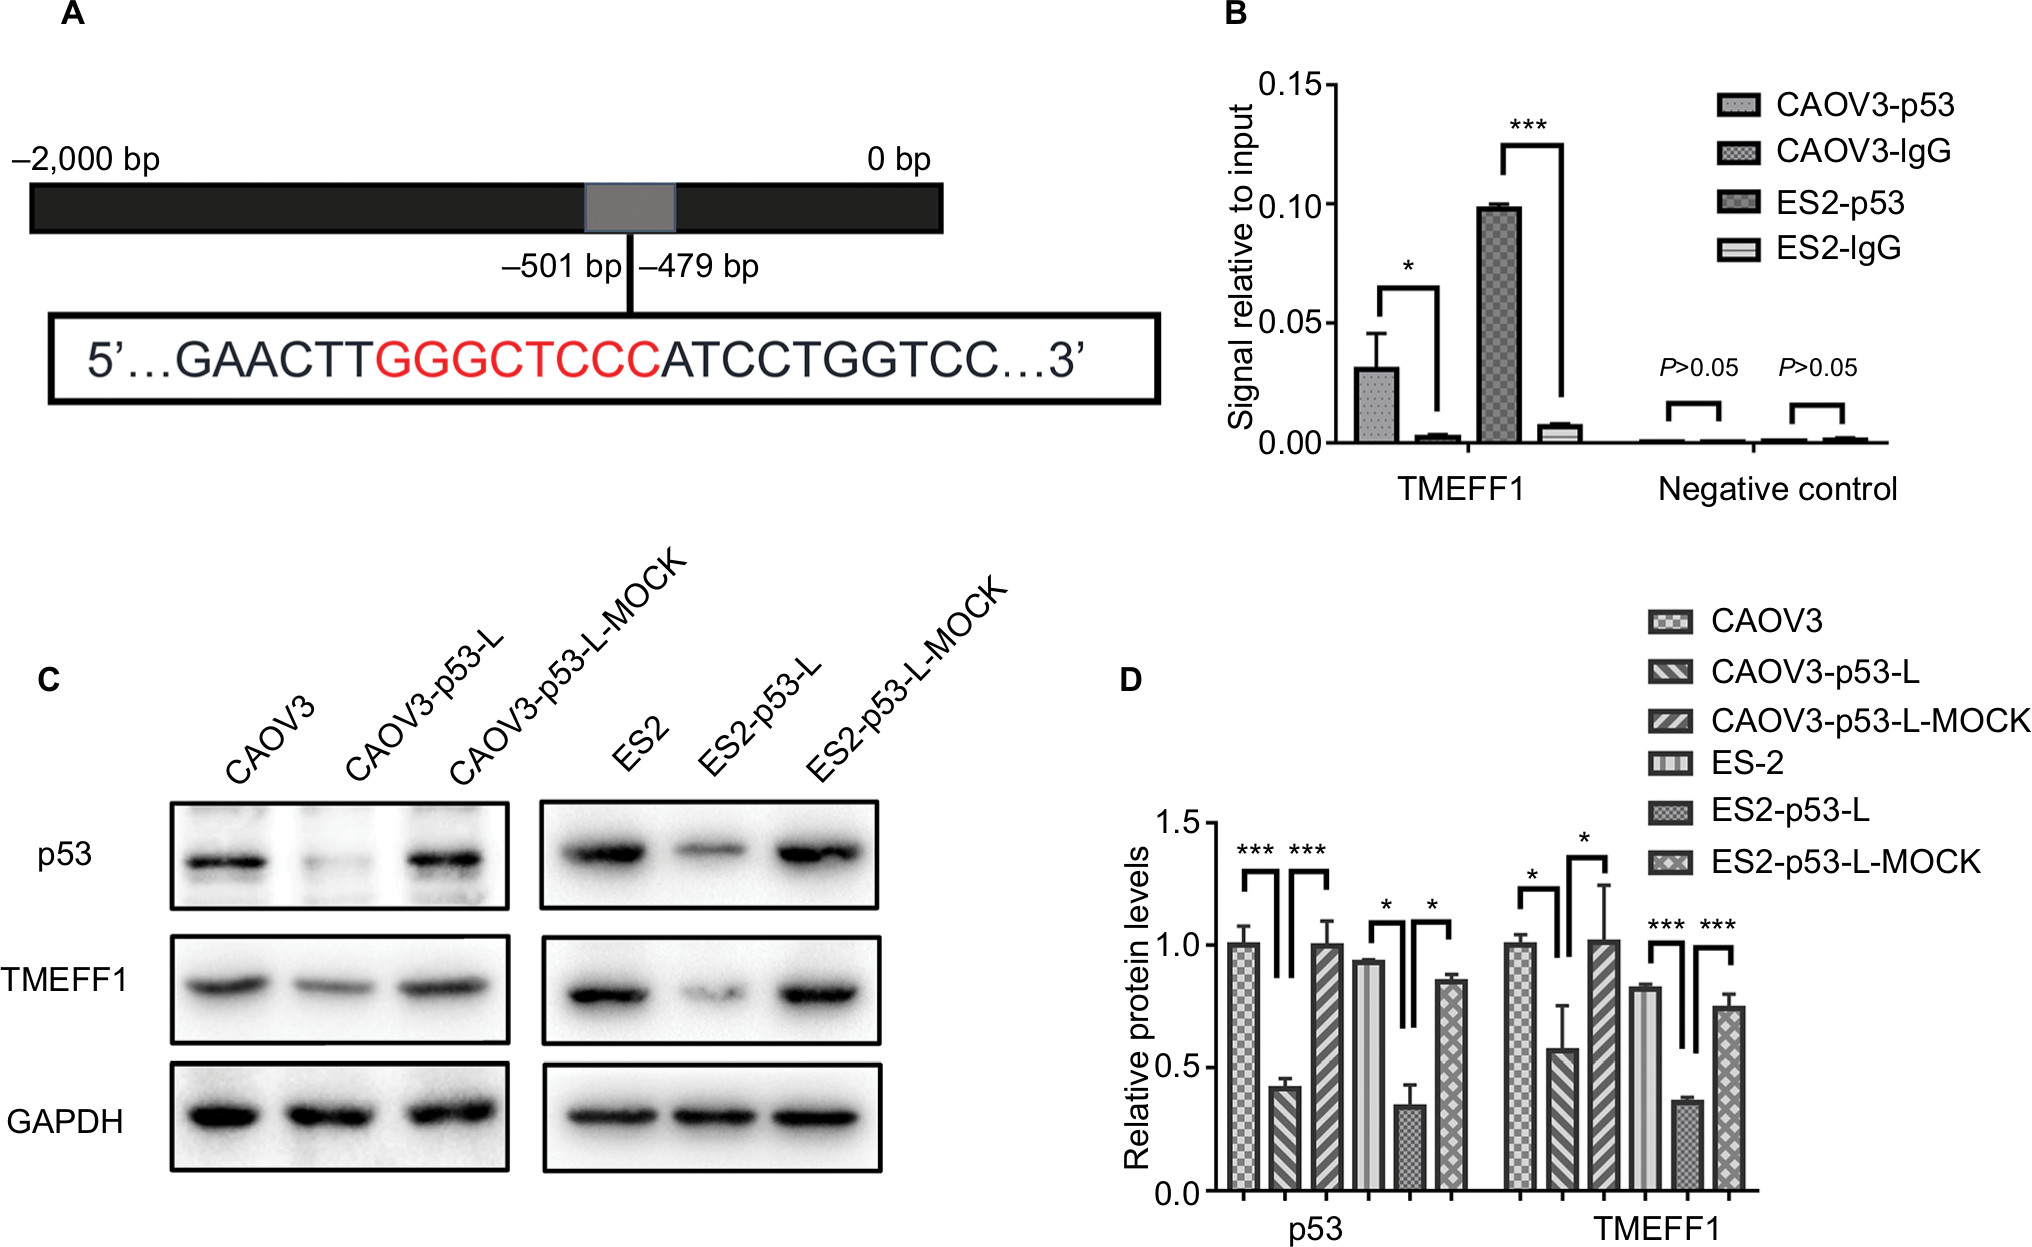 | Figure 8 In ovarian cancer cells, TMEFF1 was regulated by p53. Notes: (A) Predicted p53-binding sites in the promoter region of TMEFF1. (B) The promoter region of TMEFF1 could bind with the transcription factor, p53, in CAOV3 and ES-2 ovarian cancer cell. (C and D) The same change in TMEFF1 expression was observed with the differential expression of p53 (all P>0.05). *P<0.05, and ***P<0.001. |
Discussion
Ovarian cancer is a worldwide problem that causes the highest mortality rate among all gynecological cancers. Exploring new tumor markers and new drug targets to improve early diagnosis and survival is critical to improving OS. TMEFF1, also known as tomoregulin-1 or TR-1, was initially found as a gene that encodes pituitary secretory proteins in Xenopus laevis and, as such, was named X7365.5 Since TMEFF1 was initially found highly expressed in human embryo and nerve tissues, early studies involving human participants mainly concentrated on its involvement in middle- to late-stage development of the embryo and its regulation of the central nervous system.5,10–14
Subsequently, the role of TMEFF1 in tumors was then investigated. Gery et al showed that TMEFF1 expression in brain tumor tissue exhibited a significantly low level compared to normal brain tissues, and tumor cell lines with low TMEFF1 expression are more likely to show a strong proliferative capacity and a malignant profile.6 Similar results were also validated in colon cancer and prostate cancer,8,15 indicating that TMEFF1 plays a role as an anticarcinogenic gene in these tumors. However, the role of TMEFF1 in ovarian cancer has not yet been elucidated. In this study, we found, for the first time, that TMEFF1 was highly expressed in EOC tissues and was significantly related to the FIGO stage. TMEFF1 was an independent risk factor that influenced the prognosis of EOC. We then found that TMEFF1 promoted tumor proliferation, invasion, and migration in ovarian cancer cells and inhibited their apoptosis. All of these results indicated that TMEFF1 is a potentially cancer-promoting gene in ovarian cancer.
We then explored the molecular mechanisms by which TMEFF1 affects the malignant biological behavior of ovarian cancer. Currently, TMEFF1 has been found to be involved in regulating the TGF/BMP pathway. Harms and Chang found that, by binding with the co-receptor, Cripto-1, TMEFF1 interrupted the binding of Cripto-1 to the ALK4 receptor and, thus, inhibited the effects of nodal signals, further mediating the TGF-β signaling pathway to regulate the growth of cells and tissues.13,16 In a recent study, a deficiency of TGF-βR2 in prostate cancer negatively regulated TMEFF1 and thus activated the BMP signaling pathway to influence the prognosis of patients.15 Here, we discovered, for the first time, that TMEFF1 participated in the malignant biological behavior of ovarian cancer by activating the MAPK pathways and the PI3K/AKT pathway. The above results could be related to the EGF region of TMEFF1. The TMEFF1 protein is a single transmembrane protein, and its extracellular region contains an EGF-like functional domain, which is highly homologous to growth factors in the EGF family (except that arginine at site 39 is substituted by histidine)5,17; soluble ligands containing an EGF-like structural domain in the extracellular region can weakly stimulate the phosphorylation of erbB4.18 EGFR mediates the activation of the MAPK signaling pathway and the AKT signaling pathway.19,20 TMEFF1 may activate PI3K/AKT and MAPK signaling pathways by binding with the EGF receptor.
EMT is a biological process in which epithelial cells are transformed into mesenchymal phenotype cells by a specific procedure, which promotes cancer cells to migrate, infiltrate, and spread widely through stromal tissues.21 Ovarian cancer – due to its lack of an anatomical barrier – allows tumor cells to be directly exfoliated into the abdominal cavity and eventually colonized into the peritoneum and omentum. During this process, tumor cells lose tight junctions and adhesions between cells and obtain invasive and migratory abilities. This process is accompanied by changes in EMT-related E-cadherin, TGF-β, EGF, and other proteins and genes.22–24 As one of the core genes regulating EMT, TMEFF1 plays a role in regulating cell differentiation and development during EMT. TMEFF1 was to be a significantly upregulated gene when any one of the EMT-related transcription factors (Snail, Slug, and E47) was expressed at high levels.25 Tumor cells can dynamically carry an intermediate state of hybrid epithelial/mesenchymal to regulate differentiation and function to adapt to the environment. The hybrid EMT state of tumor cells is closely related to metastasis, cell stemness, and proliferation.22,26 In this study, we found that TMEFF1 inhibited the expression of epithelial markers, promoted the expression of mesenchymal markers, and upregulated the MMP2 and MMP9 in ovarian cancer cells with a hybrid EMT state. These results indicated that TMEFF1 participated in the process of promoting the EMT, which may promote the malignant behavior of tumor cells, but the exact mechanism requires further investigation.
Currently, it has been established that the TP53 gene highly correlates with the occurrence and progression of various human tumors and two types (wild-type and mutant-type) have been identified. The wild-type TP53 gene (in normal cells) can participate in various physiological activities of cells, such as regulating the cell cycle and apoptosis, and is involved in DNA metabolism. However, the mutant-type TP53 gene has been found in >50% of human malignant tumors including EOC,27–30 for example, TP53 was respectively mutated at sites 136, 248, 224, and 241 in CAOV3, OVCAR3, OVCAR5, and ES-2 cell lines of EOC, respectively.31,32 The mutant-type TP53 gene not only loses normal physiological functions but also possesses the activity of a cancer gene. It promotes metastasis and chemical resistance, inhibits the activity of p63 and p73, and regulates a range of target genes as a transcription factor.33 MDR-1 was the first discovered target gene of mutant p53 and is widely known for its promotion of tumor chemoresistance.34 Subsequently, other target genes of mutant p53 were found, namely CD95, MSP/Mst1, and NF-κB2, which are closely related to the development and progression of tumors.35–37 In this study, we found that TMEFF1 is a new target gene regulated by the transcription of mutant p53 and may act as an intermediate regulator between mutant 53 and tumor progression.
Our study demonstrated, for the first time, that TMEFF1 is a carcinogenic gene in ovarian cancer and can be regulated by p53 transcription. Through MAPK and PI3K/AKT signaling pathways, TMEFF1 promotes the malignant behavior in EOC. In the future, we plan to carry out in vivo experiments as well. Currently, antitumor target drugs for inhibiting MAPK and PI3K/Akt signaling pathways have been applied in clinical treatment, including Gefitinib, Erlotinib, Osimertinib, Rapamycin, and Everolimus.38–40 However, these have become ineffective in many patients due to acquired drug resistance, so a new drug target is therefore urgently needed. Since TMEFF1 is highly expressed in ovarian cancer and can promote malignant biological behaviors in cancer cells, this suggests that TMEFF1 could be a new chemotherapeutic target for ovarian cancer.
Conclusion
This study showed that TMEFF1 expression was increased in EOC. TMEFF1 promoted the proliferation, invasion, and migration of ovarian cancer cells and inhibited their apoptosis. This indicates that TMEFF1 may play an important role in the occurrence and progression of ovarian cancer and may be considered as a new target for the diagnosis/treatment of this cancer.
Acknowledgments
This work is supported by the National Natural Science Foundation of China (nos 81672590, 81472437, 81602438, and 81402129) and Shengjing Free Researcher Project (no 201303).
Disclosure
The authors report no conflicts of interest in this work.
References
Siegel RL, Miller KD, Jemal A. Cancer statistics, 2017. CA Cancer J Clin. 2017;67(1):7–30. | ||
Fratta E, Coral S, Covre A, et al. The biology of cancer testis antigens: putative function, regulation and therapeutic potential. Mol Oncol. 2011;5(2):164–182. | ||
Salmaninejad A, Zamani MR, Pourvahedi M, Golchehre Z, Hosseini Bereshneh A, Rezaei N. Cancer/testis antigens: expression, regulation, tumor invasion, and use in immunotherapy of cancers. Immunol Invest. 2016;45(7):619–640. | ||
Condomines M, Hose D, Rème T, et al. Gene expression profiling and real-time PCR analyses identify novel potential cancer-testis antigens in multiple myeloma. J Immunol. 2009;183(2):832–840. | ||
Eib DW, Martens GJ. A novel transmembrane protein with epidermal growth factor and follistatin domains expressed in the hypothalamo-hypophysial axis of Xenopus laevis. J Neurochem. 1996;67(3):1047–1055. | ||
Gery S, Yin D, Xie D, Black KL, Koeffler HP. TMEFF1 and brain tumors. Oncogene. 2003;22(18):2723–2727. | ||
Rønneberg JA, Fleischer T, Solvang HK, et al. Methylation profiling with a panel of cancer related genes: association with estrogen receptor, TP53 mutation status and expression subtypes in sporadic breast cancer. Mol Oncol. 2011;5(1):61–76. | ||
Rasmussen SL, Krarup HB, Sunesen KG, Pedersen IS, Madsen PH, Thorlacius-Ussing O. Hypermethylated DNA as a biomarker for colorectal cancer: a systematic review. Colorectal Dis. 2016;18(6):549–561. | ||
Zhu L, Hu Z, Liu J, Gao J, Lin B. Gene expression profile analysis identifies metastasis and chemoresistance-associated genes in epithelial ovarian carcinoma cells. Med Oncol. 2015;32(1):426. | ||
Noelker C, Schwake M, Balzer-Geldsetzer M, et al. Differentially expressed gene profile in the 6-hydroxy-dopamine-induced cell culture model of Parkinson’s disease. Neurosci Lett. 2012;507(1):10–15. | ||
Siegel DA, Huang MK, Becker SF. Ectopic dendrite initiation: CNS pathogenesis as a model of CNS development. Int J Dev Neurosci. 2002;20(3–5):373–389. | ||
Kanemoto N, Horie M, Omori K, Nishino N, Kondo M, Noguchi K, Tanigami A. Expression of TMEFF1 mRNA in the mouse central nervous system: precise examination and comparative studies of TMEFF1 and TMEFF2. Brain Res Mol Brain Res. 2001;86(1-2):48–55. | ||
Chang C, Eggen BJ, Weinstein DC, Brivanlou AH. Regulation of nodal and BMP signaling by tomoregulin-1 (X7365) through novel mechanisms. Dev Biol. 2003;255(1):1–11. | ||
Morais da Silva S, Gates PB, Eib DW, Martens GJ, Brockes JP. The expression pattern of tomoregulin-1 in urodele limb regeneration and mouse limb development. Mech Dev. 2001;104(1–2):125–128. | ||
Zhao W, Tan P, Zhu Q. Tgfbr2 inactivation facilitates cellular plasticity and development of Pten-null prostate cancer. J Mol Cell Biol. 2018;10(4):316–330. | ||
Harms PW, Chang C. Tomoregulin-1 (TMEFF1) inhibits nodal signaling through direct binding to the nodal coreceptor Cripto. Genes Dev. 2003;17(21):2624–2629. | ||
Eib DW, Holling TM, Zwijsen A, et al. Expression of the follistatin/EGF-containing transmembrane protein M7365 (tomoregulin-1) during mouse development. Mech Dev. 2000;97(1–2):167–171. | ||
Uchida T, Wada K, Akamatsu T, et al. A novel epidermal growth factor-like molecule containing two follistatin modules stimulates tyrosine phosphorylation of erbB-4 in MKN28 gastric cancer cells. Biochem Biophys Res Commun. 1999;266(2):593–602. | ||
Wee P, Wang Z. Epidermal growth factor receptor cell proliferation signaling pathways. Cancers. 2017;9(5):E52. | ||
Liu Q, Yu S, Zhao W, Qin S, Chu Q, Wu K. EGFR-TKIs resistance via EGFR-independent signaling pathways. Mol Cancer. 2018;17(1):53. | ||
Gardi NL, Deshpande TU, Kamble SC, Budhe SR, Bapat SA. Discrete molecular classes of ovarian cancer suggestive of unique mechanisms of transformation and metastases. Clin Cancer Res. 2014;20(1):87–99. | ||
Klymenko Y, Kim O, Stack MS. Complex determinants of epithelial: mesenchymal phenotypic plasticity in ovarian cancer. Cancers (Basel). 2017;9(8):E104:104. | ||
Vergara D, Merlot B, Lucot JP, Collinet P, Vinatier D, Fournier I, Salzet M. Epithelial-mesenchymal transition in ovarian cancer. Cancer Lett. 2010;291(1):59–66. | ||
Paget S. The distribution of secondary growths in cancer of the breast. 1889. Cancer Metastasis Rev. 1989;8(2):98–101. | ||
Moreno-Bueno G, Cubillo E, Sarrió D, et al. Genetic profiling of epithelial cells expressing E-cadherin repressors reveals a distinct role for Snail, Slug, and E47 factors in epithelial-mesenchymal transition. Cancer Res. 2006;66(19):9543–9556. | ||
Pastushenko I, Brisebarre A, Sifrim A, et al. Identification of the tumour transition states occurring during EMT. Nature. 2018;556(7702):463–468. | ||
Muller PA, Vousden KH. p53 mutations in cancer. Nat Cell Biol. 2013;15(1):2–8. | ||
Cole AJ, Dwight T, Gill AJ, et al. Assessing mutant p53 in primary high-grade serous ovarian cancer using immunohistochemistry and massively parallel sequencing. Sci Rep. 2016;6:26191. | ||
Kihana T, Tsuda H, Teshima S, Okada S, Matsuura S, Hirohashi S. High incidence of p53 gene mutation in human ovarian cancer and its association with nuclear accumulation of p53 protein and tumor DNA aneuploidy. Jpn J Cancer Res. 1992;83(9):978–984. | ||
Kupryjańczyk J, Thor AD, Beauchamp R, Merritt V, Edgerton SM, Bell DA, Yandell DW. p53 gene mutations and protein accumulation in human ovarian cancer. Proc Natl Acad Sci U S A. 1993;90(11):4961–4965. | ||
Langland GT, Yannone SM, Langland RA, et al. Radiosensitivity profiles from a panel of ovarian cancer cell lines exhibiting genetic alterations in p53 and disparate DNA-dependent protein kinase activities. Oncol Rep. 2010;23(4):1021–1026. | ||
Duran GE, Wang YC, Moisan F, Francisco EB, Sikic BI. Decreased levels of baseline and drug-induced tubulin polymerisation are hallmarks of resistance to taxanes in ovarian cancer cells and are associated with epithelial-to-mesenchymal transition. Br J Cancer. 2017;116(10):1318–1328. | ||
Kastan MB, Berkovich E. p53: a two-faced cancer gene. Nat Cell Biol. 2007;9(5):489–491. | ||
Chin KV, Ueda K, Pastan I, Gottesman MM. Modulation of activity of the promoter of the human MDR1 gene by Ras and p53. Science. 1992;255(5043):459–462. | ||
Zalcenstein A, Stambolsky P, Weisz L, et al. Mutant p53 gain of function: repression of CD95(Fas/APO-1) gene expression by tumor-associated p53 mutants. Oncogene. 2003;22(36):5667–5676. | ||
Vaughan CA, Singh S, Windle B, et al. p53 mutants induce transcription of NF-κB2 in H1299 cells through CBP and STAT binding on the NF-κB2 promoter and gain of function activity. Arch Biochem Biophys. 2012;518(1):79–88. | ||
Zalcenstein A, Weisz L, Stambolsky P, Bar J, Rotter V, Oren M. Repression of the MSP/MST-1 gene contributes to the antiapoptotic gain of function of mutant p53. Oncogene. 2006;25(3):359–369. | ||
Rupertus K, Dahlem C, Menger MD, Schilling MK, Kollmar O. Rapamycin inhibits hepatectomy-induced stimulation of metastatic tumor growth by reduction of angiogenesis, microvascular blood perfusion, and tumor cell proliferation. Ann Surg Oncol. 2009;16(9):2629–2637. | ||
Soria JC, Ohe Y, Vansteenkiste J, et al; FLAURA Investigators. Osimertinib in untreated EGFR-mutated advanced non-small-cell lung cancer. N Engl J Med. 2018;378(2):113–125. | ||
Mir O, Blanchet B, Goldwasser F. Drug-induced effects on erlotinib metabolism. N Engl J Med. 2011;365(4):379–380. |
 © 2019 The Author(s). This work is published and licensed by Dove Medical Press Limited. The full terms of this license are available at https://www.dovepress.com/terms.php and incorporate the Creative Commons Attribution - Non Commercial (unported, v3.0) License.
By accessing the work you hereby accept the Terms. Non-commercial uses of the work are permitted without any further permission from Dove Medical Press Limited, provided the work is properly attributed. For permission for commercial use of this work, please see paragraphs 4.2 and 5 of our Terms.
© 2019 The Author(s). This work is published and licensed by Dove Medical Press Limited. The full terms of this license are available at https://www.dovepress.com/terms.php and incorporate the Creative Commons Attribution - Non Commercial (unported, v3.0) License.
By accessing the work you hereby accept the Terms. Non-commercial uses of the work are permitted without any further permission from Dove Medical Press Limited, provided the work is properly attributed. For permission for commercial use of this work, please see paragraphs 4.2 and 5 of our Terms.