")
Back to Journals » Cancer Management and Research » Volume 10
Tissue transglutaminase 2 expression is epigenetically regulated in human lung cancer cells and prevents reactive oxygen species-induced apoptosis
Authors Lee MY, Wu MF , Cherng SH , Chiu LY, Yang TY, Sheu GT
Received 30 October 2017
Accepted for publication 12 June 2018
Published 23 August 2018 Volume 2018:10 Pages 2835—2848
DOI https://doi.org/10.2147/CMAR.S155582
Checked for plagiarism Yes
Review by Single anonymous peer review
Peer reviewer comments 2
Editor who approved publication: Professor Lu-Zhe Sun
Ming-Yang Lee,1–3 Ming-Fang Wu,4,5 Shur-Hueih Cherng,6 Ling-Yen Chiu,7 Tsung-Ying Yang,8,9 Gwo-Tarng Sheu5,7,10
1Department of Internal Medicine, Ditmanson Medical Foundation Chia-Yi Christian Hospital, Chiayi City, Taiwan; 2Department of Medical Laboratory Science and Biotechnology, Chung Hwa University of Medical Technology, Chiayi City, Taiwan; 3Graduate Institute of Natural Healing Science, Nanhua University, Chiayi City, Taiwan; 4School of Medicine, Chung Shan Medical University, Taichung, Taiwan; 5Divisions of Medical Oncology and Chest Medicine, Chung Shan Medical University Hospital, Taichung, Taiwan; 6Department of Biotechnology, Hung Kuang University, Taichung, Taiwan; 7Institute of Medicine, Chung Shan Medical University, Taichung, Taiwan; 8Division of Chest Medicine, Department of Internal Medicine, Taichung Veterans General Hospital, Taichung, Taiwan; 9Faculty of Medicine, School of Medicine, National Yang-Ming University, Taipei, Taiwan; 10Immunology Research Center, Chung Shan Medical University, Taichung, Taiwan
Purpose: Tissue transglutaminase 2 (TG2) is a stress-regulated protein and associated with cancer cell survival. However, the effects of TG2 expression in human non-small-cell lung cancer (NSCLC) cells on reactive oxygen species (ROS) production and redox homeostasis have not been fully elucidated.
Materials and methods: We investigated the TG2 expression and activity in A549, H1299, H1355, and H460 lung cancer cells by Western blots and quantitative polymerase chain reaction assay. The enzyme-linked immunosorbent assay was used for transglutaminase activity. The epigenetic expression was characterized with histone deacetylase inhibitor trichostatin A and DNA methyltransferase inhibitor 5-Aza treatment. TG2 expression was inhibited by siRNA transfection and the intracellular calcium was measured by Flow-3AM assay, apoptosis was analyzed by Annexin V/propidium iodide assay, and intracellular ROS was detected by fluorescence-activated cell sorting analysis. The ROS scavenger N-acetyl-L-cysteine (NAC) was applied to reduce TG2-knockdown-induced oxidative stress.
Results: Only A549 cells expressing high levels of TG2 correlated with high TG2 activity. The expression of TG2 can be regulated by epigenetic regulation in A549, H1299, and H1355 cells. The data also show that TG2 reduction induces apoptosis in A549 and H1299 cells. Furthermore, increased intracellular ROS and calcium levels were both detected in TG2-reduced cells. Moreover, endoplasmic reticulum stress inhibitor (salubrinal) and antioxidant NAC were able to reduce ROS and calcium levels to recover cell viability. Interestingly, the extrinsic and intrinsic apoptosis pathways were activated with a p53 independence upon TG2 reduction. TG2 reduction not only attenuated AKT activation but also reduced superoxide dismutase 2 (SOD2) expression. Exogenous NAC partially recovered SOD2 expression, indicating that mitochondrial-mediated apoptosis accounts for a part of but not all of the TG2-reduction-related death.
Conclusion: TG2 plays a protection role in NSCLC cell lines. Regardless of the endogenous level of TG2 and p53 status, reduction of TG2 may result in oxidative stress that induces apoptosis. Therefore, target TG2 expression represents a logical strategy for NSCLC management.
Keywords: caspases, oxidative stress, redox homeostasis, NAC, AKT, SOD2
Introduction
Transglutaminases (TGs; EC 2.3.2.13) are a family of enzymes that can bind and hydrolyze GTP and catalyze posttranslational modification of proteins by cross-linking proteins through ε-(γ-glutamyl)-lysine isopeptide bonds or through incorporating primary amines at selected peptide-bound glutamine residues.1 Tissue transglutaminase 2 (TG2) is the calcium-dependent enzyme and is the most diverse and ubiquitous member of the TG family. The functions and regulation of extracellular TG2 have been nicely reviewed.2 Various important functions have been discussed both in the intra- and extracellular environment of TG2, including its role in matrix stabilization, cell adhesion and migration, and cell death and survival. Recently, it has been indicated that the TG2 in closed/GTP-binding/signaling conformation drives cancer cell and cancer survival and that TG2 in the open/cross-linking conformation is associated with cell death.3 Therefore, the opposing roles of TG2 in the regulation of cellular functions as well as cell growth and death have been frequently discussed.4
Multiple studies have shown elevated TG2 expression in many types of cancer cells, including pancreatic carcinoma,5 breast carcinoma,6 ovarian carcinoma,7,8 lung carcinoma,9 and glioblastoma.10 These observations indicate that TG2 may have a prosurvival role in cancer cells.
Interestingly, epigenetic regulation of TG2 expression in several cancer cells has been reported. In a breast cancer cell model, it was shown that CpG islands in the TG2 promoter are hypermethylated; therefore, TG2 expression is epigenetically silenced in less aggressive cell types.11 A very similar observation was made in glioma, where the 5′ flanking region of the TG2 gene was hypermethylated in a panel of cultured human glioma cells and associated with reduced TG2 expression as judged by immunoblotting. Further, culturing glioma cells in the presence of the global DNA demethylating agent 5-aza-2′-deoxycytidine (5-Aza) resulted in re-expression of TG2 in these lines.11,12 Inhibition of TG2 in lung cancer cells by promoter methylation in HCC-95, HCC-1588, and NCI-H23 of non-small-cell lung cancer (NSCLC) lines has also been identified.9
Another mechanism for downregulating TG2 promoter activity involves histone deacetylases (HDACs). Previously, it was shown that in a neuroblastoma model N-myc protein trans-repressed the activity of the TG2 promoter, and hence TG2 expression, by recruiting HDAC1 to an Sp1 binding site onTG2 promoter.13 Also, in those glioma cell lines mentioned above, administration of the HDAC inhibitor Trichostatin A (TSA) resulted in re-expression of TG2.12 These studies have demonstrated how TG2 promoter is regulated by trans-activation, trans-repression, and epigenetics, which may be an indication of the importance of TG2 expression in the cell. TG2 is generally upregulated under stress conditions and it can be categorized as a stress response protein.14
Therefore, we postulate that upregulation in TG2 levels is probably part of a cellular protective response. For example, in an attempt to identify metastasis-associated proteins by proteomic analysis, Jiang et al observed that TG2 was one of the eleven proteins that are selectively amplified in metastatic human lung carcinoma.15 In contrast, downregulation or inhibition of TG2 by siRNA, antisense RNA, ribozyme, or small-molecule inhibitors in ovarian cancer and pancreatic tumors has been shown to increase their sensitivity to chemotherapy-induced cell death and inhibition of invasion, in both in vitro and in animal models. Furthermore, overexpression of TG2 in tumor samples has been strongly associated with metastasis and poor overall patient survival.7,16,17 Together, these observations strongly support that a high level of TG2 confers resistance to chemotherapeutic drugs and promotes the invasion of cancer cells.
Under either physiologic or pathologic conditions, TG2 has been demonstrated to be a stress-induced gene that is upregulated by various stimuli including oxidative stress, ultraviolet radiation, glutamate exposure, calcium influx, and inflammatory cytokines.14 Accumulation of intracellular reactive oxygen species (ROS) generates oxidative stress and needs to be counterbalanced in order to prevent cellular damage. For example, ROS generated by lysophosphatidic acid and transforming growth factor-β in Swiss 3T3 fibroblasts induced TG2 expression. Scavenging of intracellular ROS with N-acetyl-L-cysteine (NAC) and catalase (CAT) largely inhibited the activation of TG2 in response to the agonists.18 These results support the idea that intracellular ROS is essential for the activation of TG2, whereas the possible role of TG2 in the regulation of ROS has not been well examined. As little evidence has been provided of TG2 functions in lung cancer, we hypothesize in the present study that TG2 may actively regulate ROS of lung cancer cells to maintain cancer cell survival.
Initially, we characterized the expression and activity of TG2 in the cell line of NSCLC. Next, we showed the expression of TG2 by epigenetic regulation in the cell line of NSCLC. In addition, we further characterized the association of TG2 and ROS-induced apoptosis. Our findings revealed a novel antiapoptotic pathway involving TG2 and ROS that further support the therapeutic application of TG2 inhibition to improve cancer treatment.
Materials and methods
Chemicals
Z-IETD-FMK and Z-LEHD-FMK were purchased from R&D Systems (Minneapolis, MN, USA). TSA (T8552), NAC (A-7250), salubrinal (SML0951), 5-Aza (A-3656), and N,N-dimethylcasein, streptavidin-alkaline phosphatase were obtained from Sigma-Aldrich Co (St. Louis, MO, USA). EZ-Link® Pentylamine-Biotin was purchased from Pierce (Thermo Fisher Scientific Inc., Waltham, MA, USA). Nitrophenyl phosphate disodium salt hexahydrate (pNPP) was obtained United States Biological (Salem, MA, USA).
Quantitative polymerase chain reaction (q-PCR)
To analyze the mRNA levels of TG2, total RNA was extracted from the cells by TRIzol reagent (Invitrogen, Carlsbad, CA, USA). The purified RNA (2 µg) was reverse-transcribed to cDNA by oligo-dT primers. The forward primer for TG2 was 5′-TATGGCCAGTGCTGGGTCTTCGCC and the reverse primer was 5′-GGCTCCAGGGTTAGGTTGAGCAGG, which amplified a 788 bp DNA fragment. For GAPDH, forward primer (5′-GCCAAGGTCCATGACAAC) and reverse primer (5′-CAGTAGAGGCAGGGATGATGTTC) served as the internal control gene. SYBR green PCR master mix was used for qPCR with an ABI 7500 thermal cycler (Applied Biosystems, Foster City, CA, USA).
Enzyme-linked immunosorbent assay (ELISA) for transglutaminase activity
Transglutaminase activity was measured as previously described.19 Cell lysates were extracted by a buffer containing 100 mM Tris–HCl, pH 8.5, 1 mM sucrose, 2 mM dithiothreitol (DTT), 0.4 mM phenylmethylsulfonyl fluoride, and 0.4% Triton X-100, sonicated for 10 seconds, and loaded into the coated microplates. Briefly, microplates were coated with 10 mg/mL of N, N′-dimethylcasein (200 µL) at 4°C overnight and blocked with nonfat dry milk (0.5% in 100 mM Tris–HCl, pH 8.5) at room temperature (RT) for 45 minutes. After the microplate was washed with Tris–HCl (100 mM Tris–HCl, pH 8.5) twice, the microplate was ready to use. The lysates (50 µL/well) were incubated in a reaction mix (150 µL) containing 100 mM Tris, pH 8.5, 20 mM CaCl2, 40 mM DTT, and 2 mM 5-(biotinamido) pentylamine with gentle shaking for 30 minutes at RT. The reaction mixtures were withdrawn and stopped by 200 mM EDTA (200 µL × 2), followed by washing with Tris–HCl (100 mM Tris–HCl, pH 8.5) twice. The streptavidin-alkaline phosphatase (250 µg/mL), which was 150-fold diluted in nonfat dry milk (0.5% in 100 mM Tris–HCl, pH 8.5), was aliquoted (250 µL) into the microplate and incubated for 1 hour in RT, followed by washing with Triton-X-100 (0.01%) and Tris–HCl (100 mM, pH 8.5) to remove unbound streptavidin-alkaline phosphatase. The substrate pNPP was diluted in buffer (100 mM Tris–HCl, 0.1 M NaCl, 5 mM MgCl2, pH 9.5) – 1 mg/mL and 100 µL were applied into each well for 20 minutes at RT and light was avoided to develop color followed by stopping with 3M NaOH (50 µL). The absorbance of 405 nm was measured by an ELISA plate reader.
Inhibition of TG2 by siRNA transfection
Human adenocarcinoma A549 and H1299 cells were purchased from the American Type Culture Collection (Manassas, VA, USA) and maintained as previously described.20 BEAS-2B cells (an SV40-immortalized human bronchial epithelial cell line, also purchased from American Type Culture Collection) were kindly provided by Professor JL Ko.21 A549 (1×10⁵ cells) or H1299 cells (8×10⁴ cells) were seeded in six-well plates for 16 hours. The siRNAs (30 pmol, Sigma, SASI_Hs02_00338000 or SASI_Hs01_00035265) for TG2 (NM_004613) were transfected with Lipofectamine RNAiMAX reagent (Invitrogen, Carlsbad, CA, USA) for 6 hours and then replaced with fresh culture medium and incubated as time indicated. The cells were dissociated by trypsin/EDTA solution and harvested with RIPA buffer for Western blot analysis. Similar procedures were applied to siNC (universal NC control siRNA).
Measurement of intracellular calcium by Flow-3AM assay
A549 (1×10⁵ cells) or H1299 cells (8×10⁴ cells) were seeded in six-well plates for 16 hours. Cells were pretreated with or without 10 mM NAC for 1 hour followed by siRNA transfection and incubated with fresh medium/NAC as time indicated. At the end of the exposure period, cells were trypsinized and resuspended with 0.5 mL PBS and then incubated for 30 minutes in Hank’s buffered salt solution (HBSS) with 3 µM Flow-3AM (Invitrogen). After staining, cells were washed with HBSS twice, placed in HBSS containing 5% FBS, and analyzed by flow cytometry.
Annexin V/propidium iodide (PI) assay for apoptosis analysis
A549 (1×10⁵ cells) or H1299 cells (8×10⁴ cells) were seeded in six-well plates for 16 hours. Cells were pretreated with or without 10 mM NAC for 1 hour, followed by siRNA transfection, and incubated with fresh medium/NAC as time indicated. These cells were trypsinized and resuspended with 0.5 mL PBS. They were then incubated for 30 minutes in binding buffer with PI and Annexin V (FITC Annexin V Apoptosis Detection Kit 1, BD Biosciences, San Jose, CA, USA), followed by analysis with flow cytometry.
Detection of intracellular ROS by fluorescence-activated cell sorting analysis
A549 (1×10⁵ cells) or H1299 cells (8×10⁴ cells) were seeded in six-well plates for 16 hours. Cells were pretreated with or without 10 mM NAC for 1 hour, followed by siRNA transfection, and incubated with fresh medium/NAC as time indicated. Cells were then washed with PBS, trypsinized, and washed twice with PBS. They were then resuspended with 0.5 mL PBS. This was followed by adding 10 µM of 2′, 7′-dichlorodihydro-fluorescein diacetate (D399, H2DCFDA, Invitrogen) fluorescent probe for 30 minutes. Cells were then immediately analyzed by a flow cytometer.
Western blot analysis
The relevant procedures have been described in a previous report.20 Proteins were reacted with one of the following: The anti-TG2 antibody (Clones CUB 7402+TG100) purchased from Thermo Fisher Scientific Inc. The anti-cleaved-PARP (#5625), anti-GRP78 (#3177), anti-t-Akt (#9272), anti-p-Akt Ser473 (#9271), anti-p-ERK (#4370), anti-p-p70S6K Thr389 (#9234), anti-p21 anti-Total H3, and anti-acetyl H3 purchased from Cell Signaling (Danvers, MA, USA). Anti-β-actin (AC-40) obtained from Sigma-Aldrich Co. The anti-P53 antibody purchased from Dako (Glostrup, Denmark). Anti-mouse immunoglobulin G purchased from Calbiochem (San Diego, CA, USA). Anti-SOD2 (Santa Cruz Biotechnology, sc-18503).
Clonogenic cell survival assay
A549 cells were seeded in six-well plates (150 cells/well). After 24 hours of incubation, cells were transfected with the indicated siRNA and eventually cultured for 10 and 20 days. The colonies formed were fixed with ice-cold methanol for 30 minutes and then stained with 20% Giemsa. Survival fractions were calculated by normalization to the appropriate control groups.
Statistical analysis
All values are presented as mean±SD. Data were compared between groups using Student’s t-test and P-value <0.05 was considered statistically significant.
Results
Expression of TG2 in NSCLC cell lines
To compare the expression level of TG2 in lung cancer cell lines, the mRNAs of TG2 were measured by q-PCR (Figure 1A), and the results show that the quantities of TG2 mRNAs in A549 cells were the highest when compared with H1299, H1355, and H460 cells. The activities of TGs were coordinately determined by the ELISA method and the A549 cells also have the highest transglutaminase activities (Figure 1B). The protein levels of TG2 analyzed by Western blot analysis further demonstrated that A549 cells have the highest levels of TG2 protein (Figure 1C).
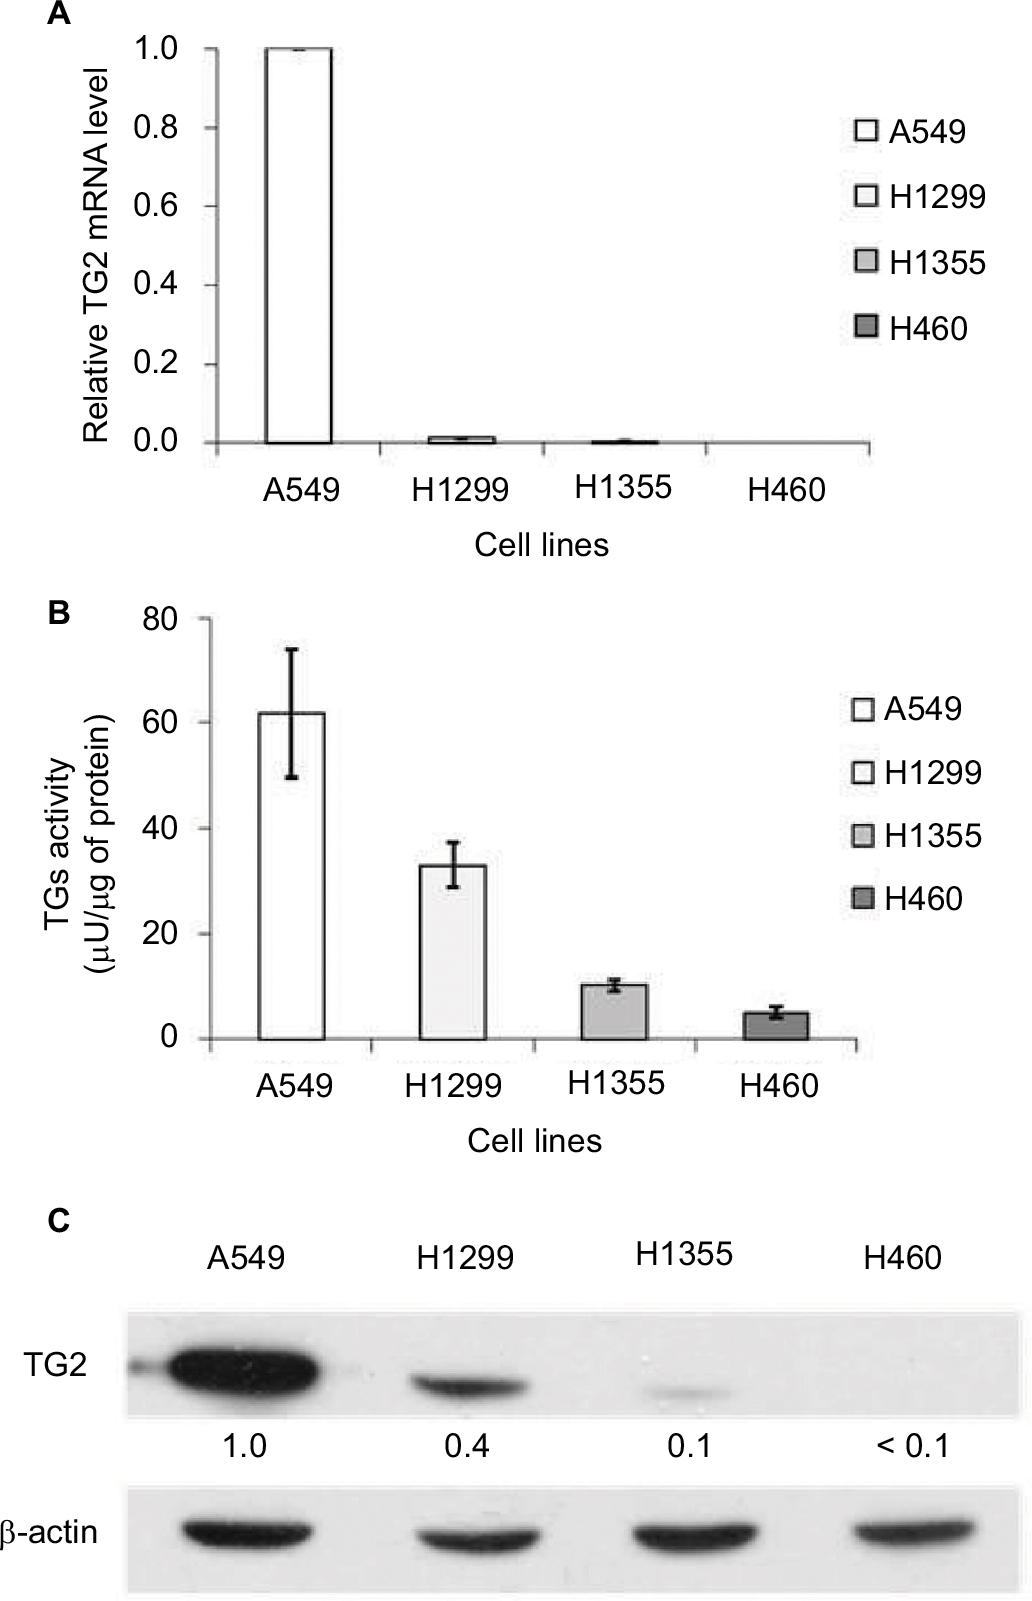 | Figure 1 Correlation between TG2 expression and activity in lung cancer cells. Notes: (A) Comparison of the TG2 mRNA expression levels in lung cancer cell lines by quantitative polymerase chain reaction. (B) The activities of TGs were determined by the colorimetric enzyme-linked immunosorbent assay method utilizing the transglutaminase activity of coagulation factor XIIIa as a reference. (C) Western blot analysis of the TG2 expression in the A549, H1299, H1355, and H460 lung cancer cell lines. Abbreviation: TG2, tissue transglutaminase 2. |
Epigenetic upregulation of TG2 expression by TSA and 5-Aza
It is intriguing that TG2 has limited expression in lung cancer cells, except in A549 cells. Could the gene of TG2 be activated in these lung cancer cells? As downregulating TG2 promoter activity involves HDACs, as reported by Liu et al,13 we tested if TSA, the HDAC inhibitor, can induce TG2 expression in A549 and H1299 cells. The mRNA levels of TG2 increased up to fourfold in A549 and H1299 cells (Figure 2A) by TSA induction. We also analyzed the TG2 mRNA levels in H1355 cells and the TG2 transcripts increased up to threefold by TSA treatment. The protein levels of TG2 were increased by 24 hours of TSA treatment in A549 and H1299 cells to approximately two- to threefold (Figure 2B) with evidently acetylated H3 levels. Furthermore, epigenetic methylation as a means to silence TG2 expression in various cancers has also been demonstrated,9,11,12 so we applied DNA methyltransferase inhibitor 5-Aza to A549, H1299, and H1355 cells to determine if gene of TG2 has been transcriptionally repressed by DNA methylation. The TG2 transcripts were increased in all three cell lines treated with 5-Aza (Figure 2C). The levels of TG2 proteins were increased approximately twofold in A549 and H1299 (Figure 2D). Apparently, TG2 expression in these lung cancer cells can be upregulated by epigenetic mechanisms of histone modification and DNA methylation.
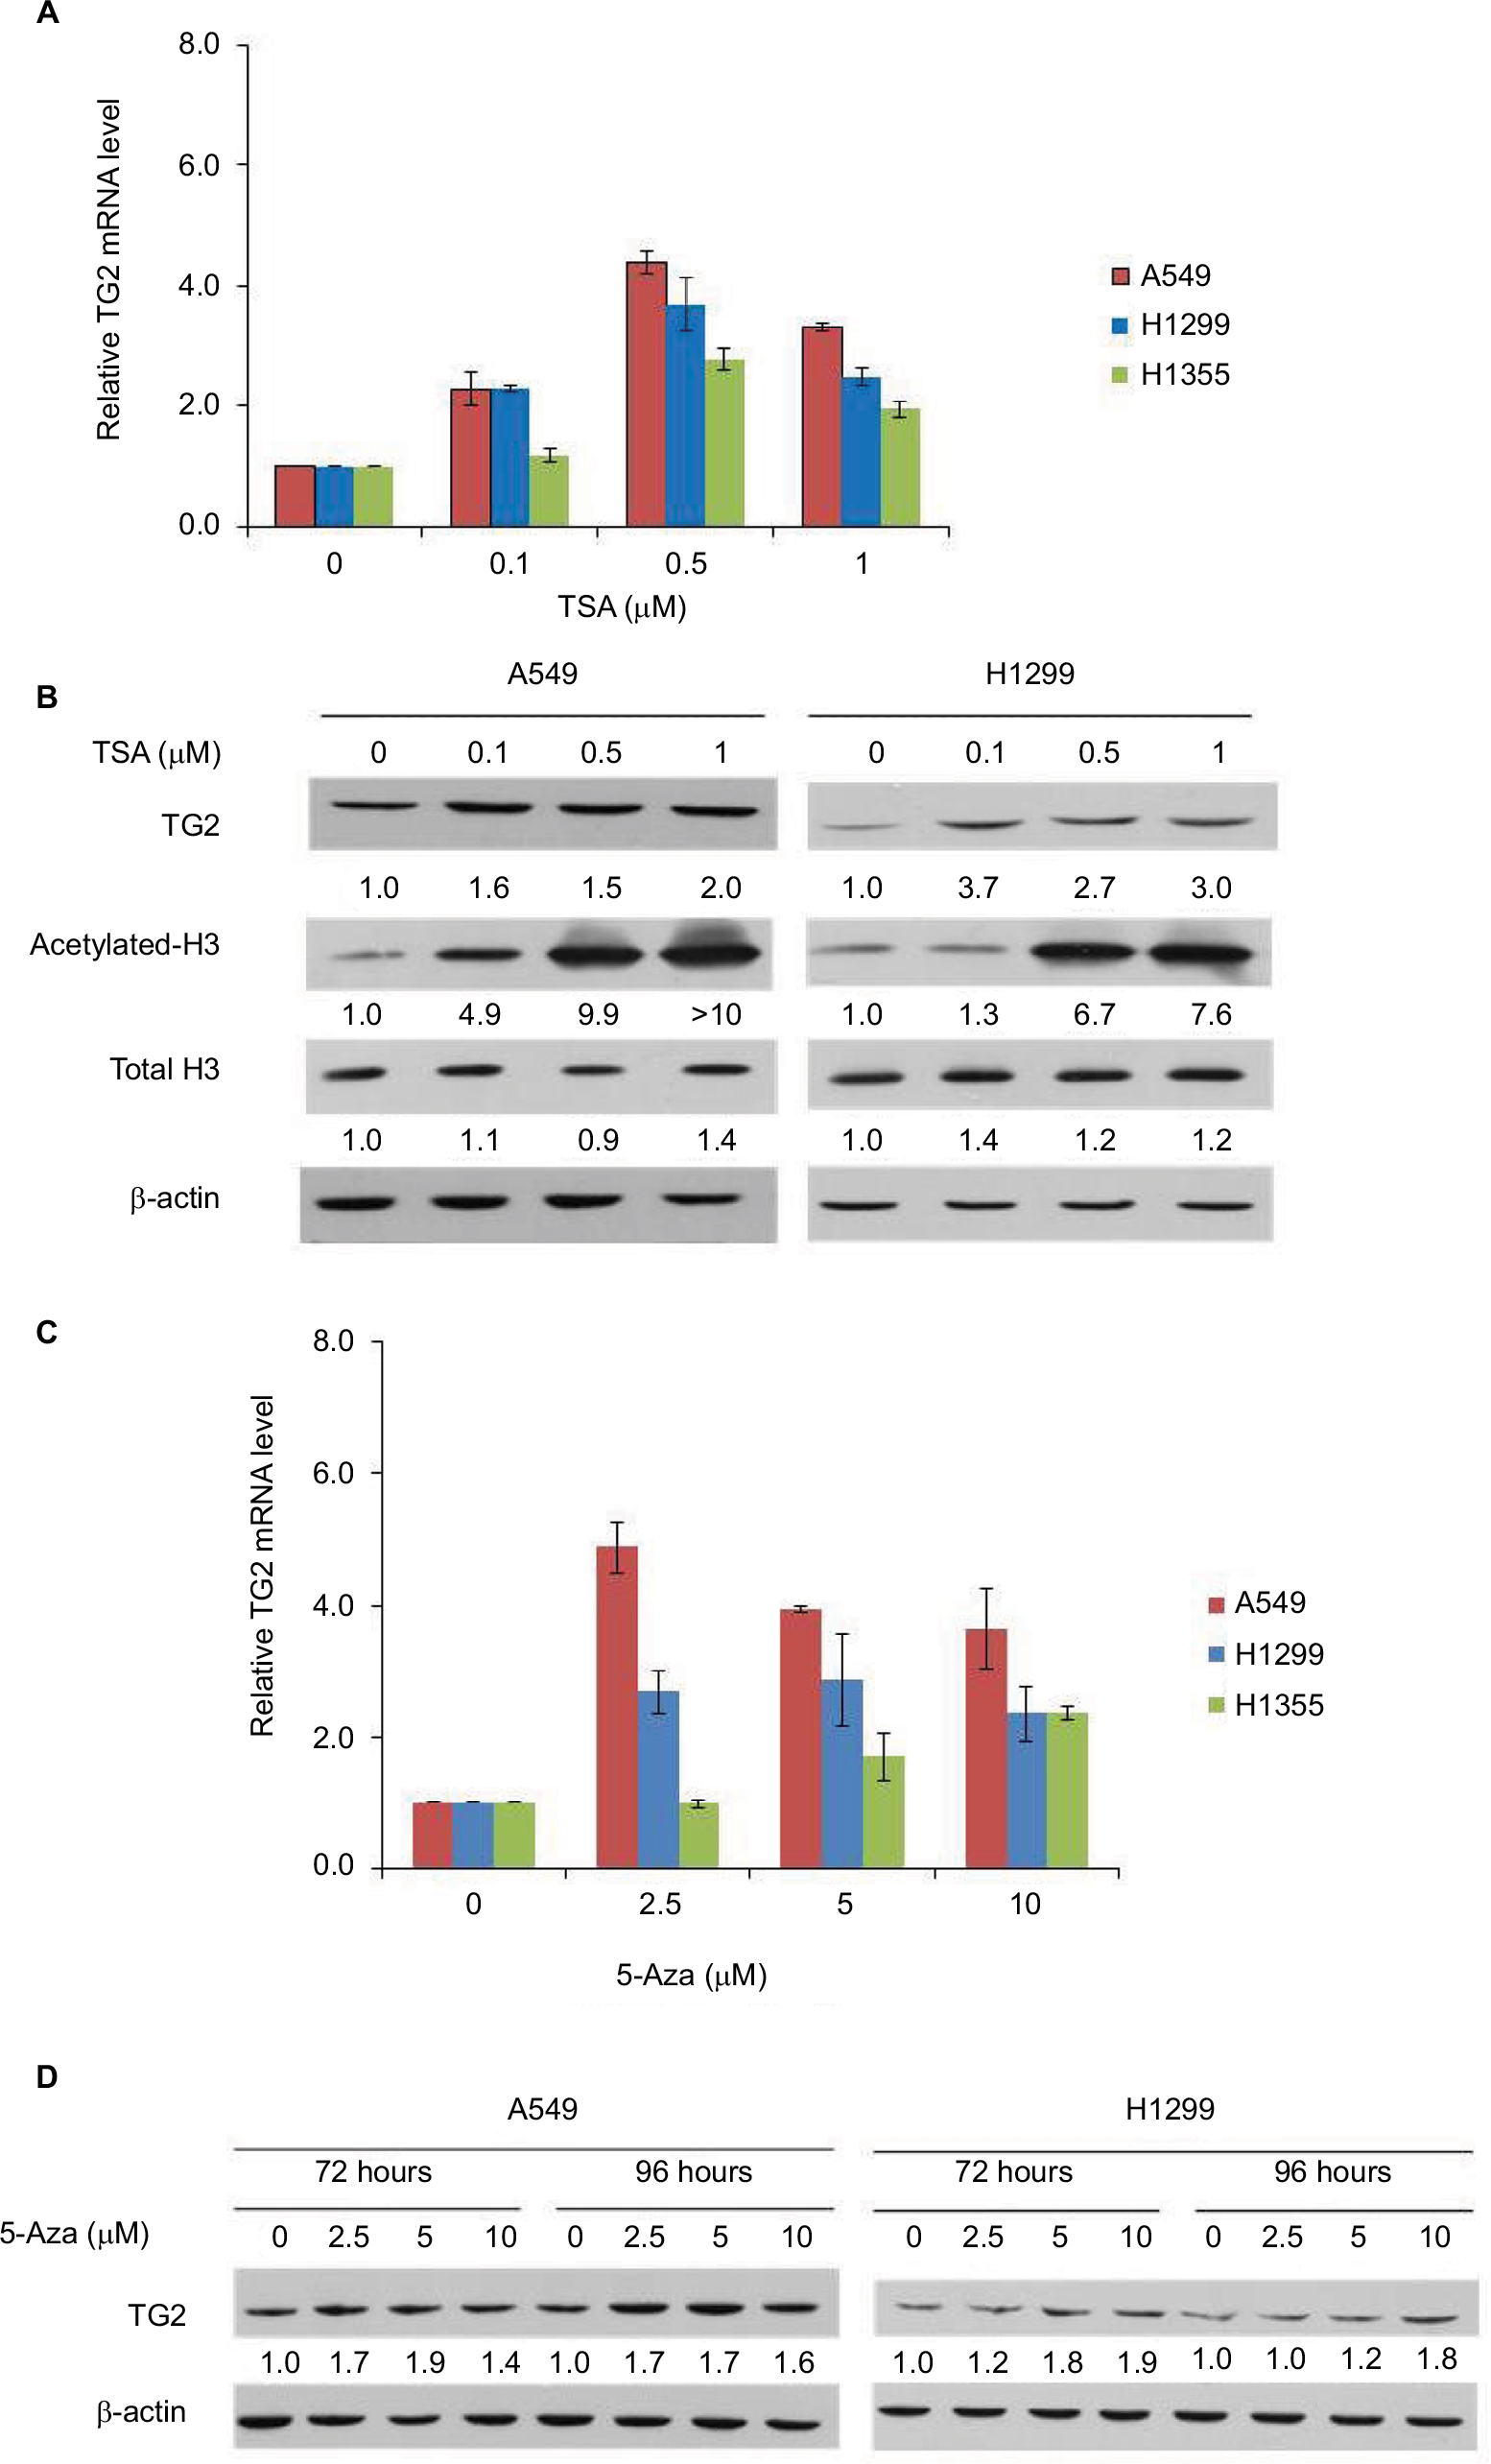 | Figure 2 The effects of TSA and 5-Aza on TG2 expression. Notes: (A) The mRNA of TG2 was determined by q-PCR and normalized as the relative increase with 24 hours of TSA treatment in A549, H1299, and H1355 cells. (B) Characterization of the TSA-mediated concentration-dependent responses by Western blots on A549 and H1299 cells with TG2 expression and acetylated-H3. (C) TG2 mRNAs were determined by q-PCR with 72 hours of 5-Aza treatment. (D) Western blot analysis of TG2 on A549 and H1299 cells with 72 and 96 hours of 5-Aza (10 µM) treatment. Abbreviations: 5-Aza, 5-aza-2′-deoxycytidine; q-PCR, quantitative polymerase chain reaction; TG2, tissue transglutaminase 2; TSA, trichostatin A. |
TG2-reduction-induced apoptosis is associated with both extrinsic and intrinsic apoptotic pathways
To characterize the function of TG2 in A549 cells, we applied interference RNA into A549 cells to reduce TG2 expression. As shown in Figure 3A, after siTG2 RNA transfection, the TG2 protein levels were significantly reduced up to 72 hours, as detected on Western blots. Apoptosis-mediated cleavage of poly (ADP-ribose) polymerase 1 (PARP-1) by capase-3 produced an 89 kDa C-terminal fragment (cleaved PARP, containing the catalytic domain), which served as the molecular marker on immunoblots. The cleaved PARP levels were significantly increased in cells with TG2 reduction, and both p53 and p21 levels were correspondingly increased, thus confirming that the apoptosis pathway is associated with TG2 reduction. The endoplasmic reticulum (ER) stress marker GRP78 protein22 levels were also upregulated by TG2 reduction, which indicates that excessive ER stress may have occurred. The mechanisms of how TG2 expression affects the viability of A549 cells were characterized by Annexin V/PI staining flow cytometry analysis with TG2 reduction (Figure 3B). The amount of apoptotic A549 cells (early plus late phases) induced by siTG2 reduction was increased after 48 hours of siTG2 transfection and reached its maximum at 96 hours, significantly. The proliferation ability of A549 cells was dramatically inhibited by TG2 knockdown, which was evaluated by clonogenic cell survival assay (Figure 3C). To further characterize the antiapoptotic activity of TG2, transfection of siTG2 RNA into H1299 cells also resulted in elevated cleaved PARP levels (Figure 3D). TG2-reduction-induced apoptosis of A549 and H1299 cells was involved with activation of caspases 8 and 9, as assessed by the appearance of the respective cleaved active caspases (Figure 3E). Can TG2 knockdown induce apoptosis of normal cells? To answer this question, SV40-immortalized human bronchial epithelial cell line BEAS-2B cells were transfected with siTG2 RNA and analyzed by Annexin V/PI staining flow cytometry analysis (Figure 3F) as well as Western blot analysis (Figure 3G). The data demonstrate that apoptosis was not induced when TG2 expression was reduced in BEAS-2B cells.
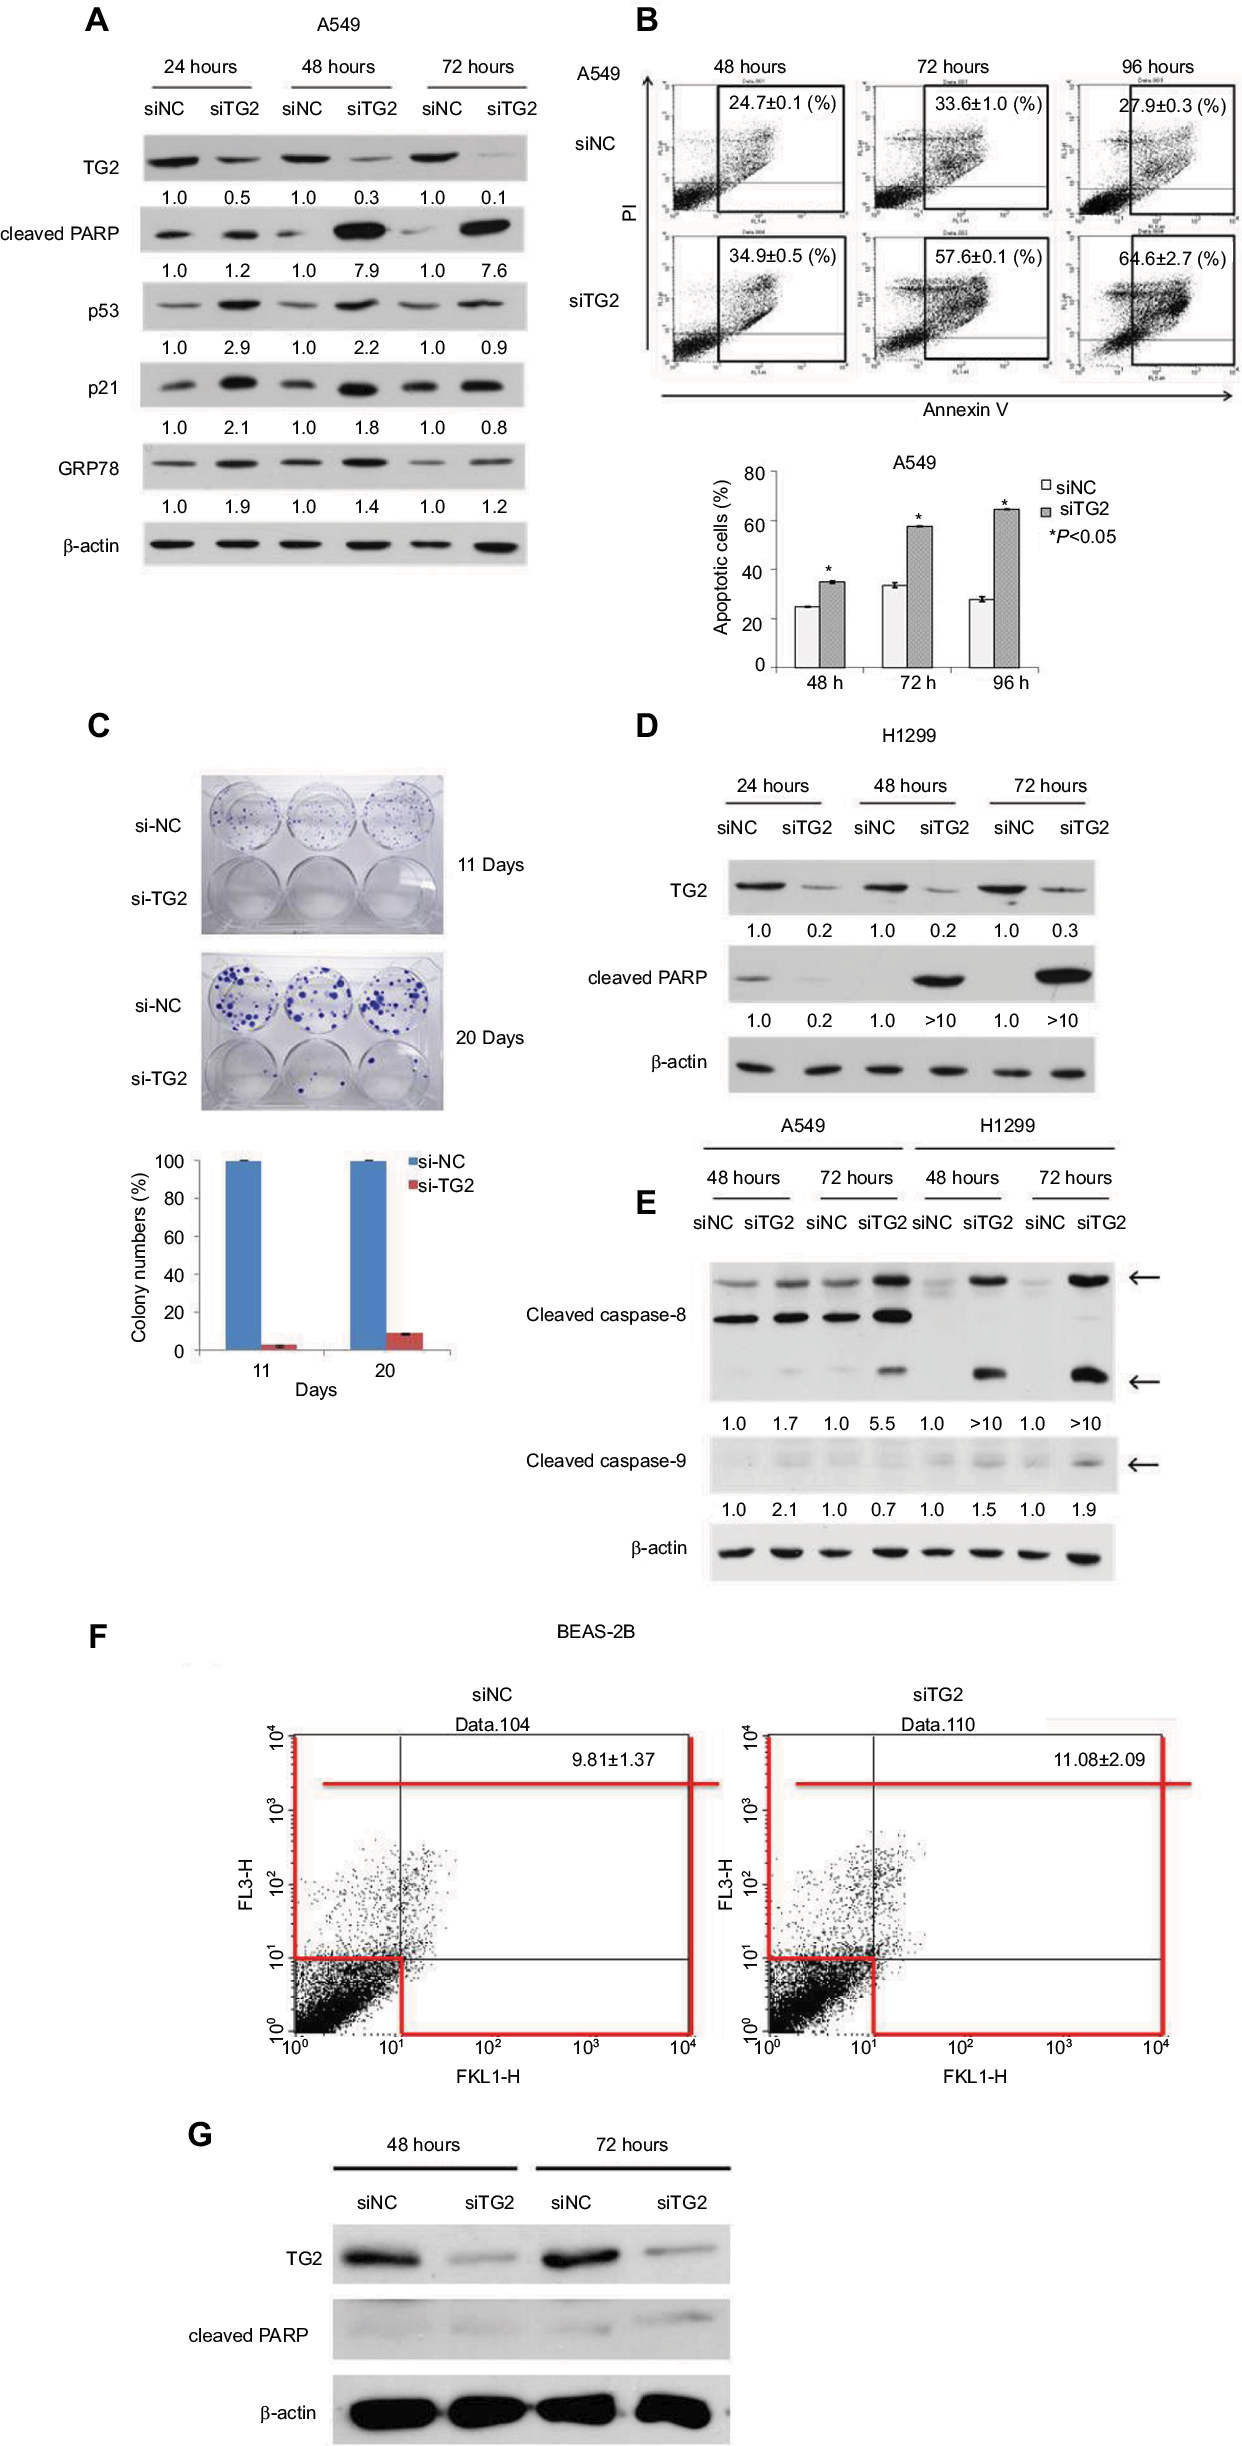 | Figure 3 The effects of reduced TG2 expression on apoptosis. Notes: (A) Western blot analysis of TG2, cleaved PARP, p53, p21, and GRP78 proteins on A549 cells after 24, 48, and 72 hours of siRNA transfection. (B) Flow cytometry analysis of apoptotic cells was conducted by Annexin V/PI staining of siRNA-transfected A549 cells and quantitated. (C) Clonogenic cell survival assay of siTG2 RNA transfection on A549 cells for 11 and 20 days to evaluate cell proliferation and quantitation of colonies formation. (D) Western blot analysis of TG2 and cleaved PARP proteins on H1299 cells after 24, 48, and 72 hours of siRNA transfection. (E) Western blot analysis of cleaved caspases on A549 and H1299 cells after 24, 48, and 72 hours of siRNA transfection. (F) Human BEAS-2B cells (1×10⁵ cells) were transfected with siTG2 RNA for 5 hours then replaced with fresh culture medium and incubated for 72 hours followed by Annexin V/PI assay. (G) Western blot analysis of TG2 and cleaved PARP proteins on BEAS-2B cells after 72 hours of siRNAs transfection. Abbreviations: PI, propidium iodide; TG2, tissue transglutaminase 2. |
TG2 knockdown in lung cancer cells upregulates ER stress and apoptosis that is independent of p53 status
To demonstrate that the association of the activities of both caspases in TG2-reduction-induced apoptosis is p53-independent, the inhibitor of caspase-8 (Z-IETD-FMK) was added prior to siRNA transfection of A549 cells (wild-type p53) and H1299 cells of the TP53-null genotype followed by Annexin V/PI staining flow cytometry analysis (Figure 4A). Inhibition of caspase-8 partially reduces apoptosis associated with TG2 knockdown. The upregulated cleaved PARP levels from siTG2-transfected A549 and H1299 cells were significantly reduced when Z-IETD-FMK was added (Figure 4B). Similar conditions were performed with caspase-9 inhibitor (Z-LEHD-FMK) (Figure 4C) and the results showed a significant reduction of apoptosis when caspase-9 was inhibited. The levels of cleaved PARP were also reduced when compared to siTG2-transfected cells without prior Z-LEHD-FMK treatment (Figure 4D). As it was detected that the expression of the ER stress marker GRP78 was upregulated when TG2 expression was reduced (Figure 3A), we further examined the association of TG2 knockdown with ER stress. Salubrinal is a specific inhibitor of ER-stress-induced apoptosis that targets eukaryotic translation initiation factor 2 α-subunit (eIF2α) dephosphorylation.23 Lung cancer cells were pretreated with salubrinal followed by siTG2 transfection and the percentage of induced apoptosis was evaluated by flow cytometry (Figure 4E). The apoptosis induced by TG2 knockdown was significantly reduced by salubrinal. The protein levels of GRP78 were reduced with salubrinal treatments (Figure 4F) that suggest that TG2 regulates the ER stress-induced apoptosis of lung cancer cells.
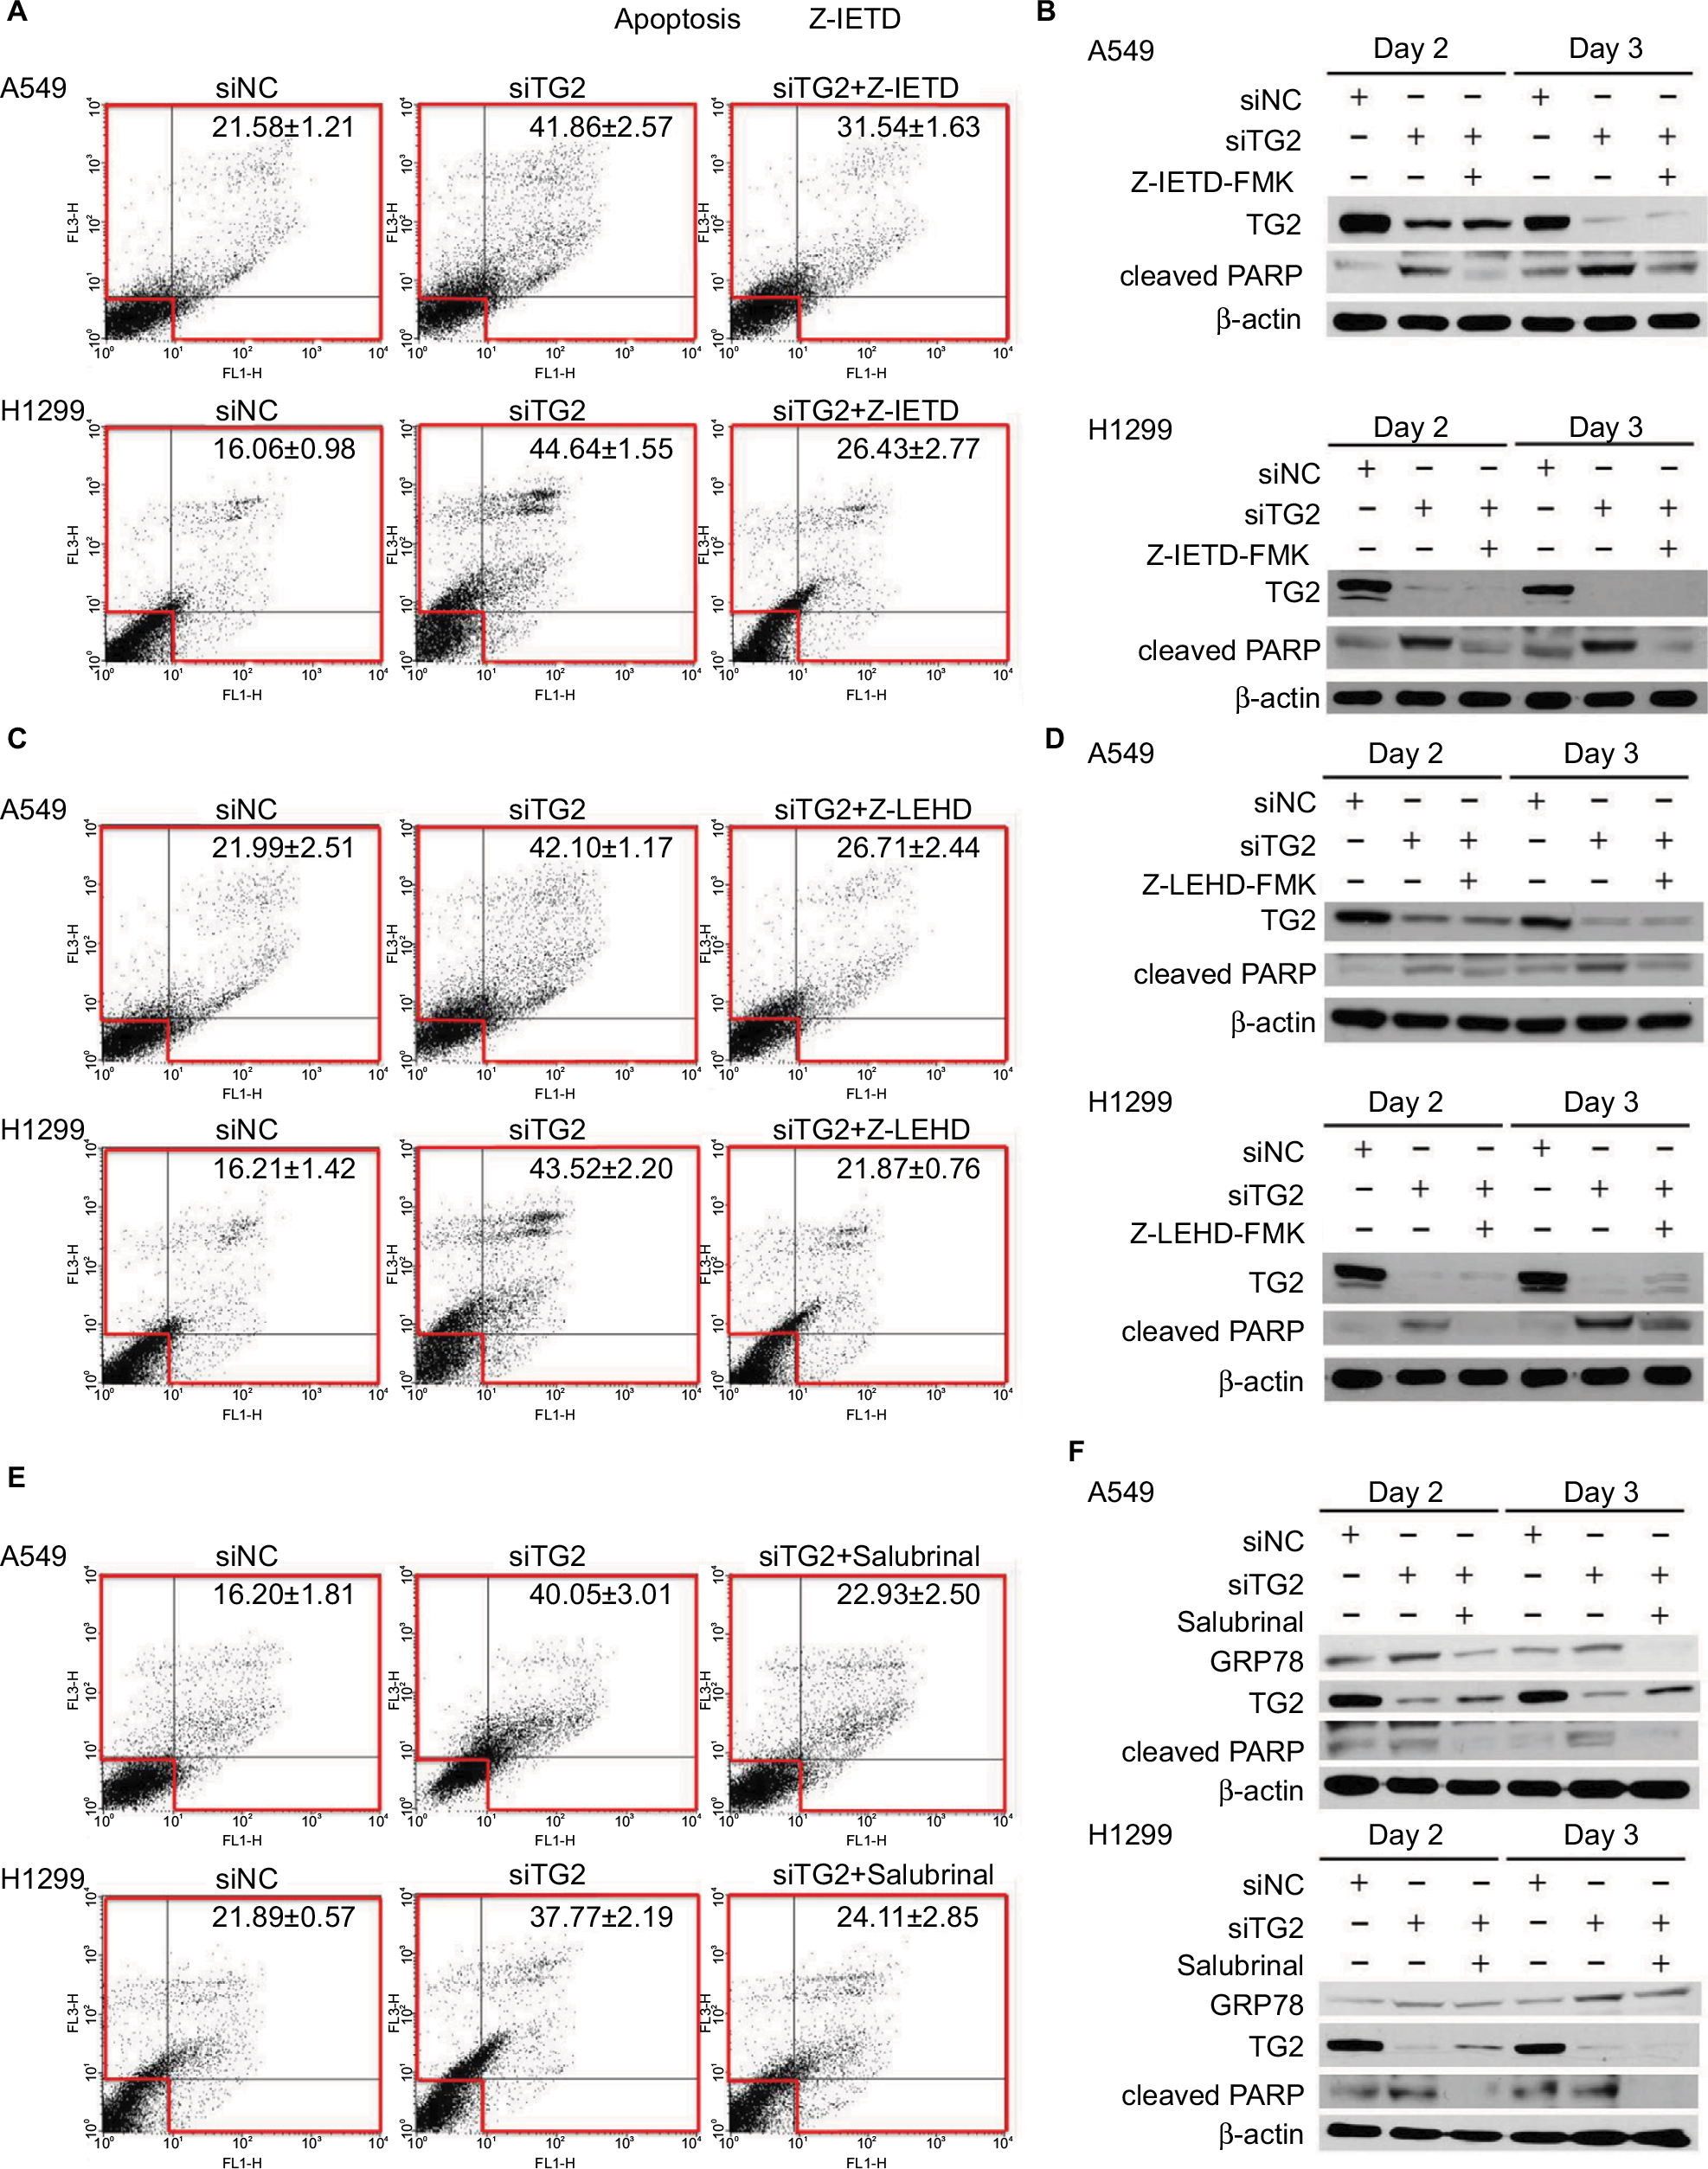 | Figure 4 Association of the extrinsic and intrinsic apoptosis pathways with endoplasmic reticulum stress induced by TG2 knockdown. Notes: (A) The inhibitor of caspase-8 (Z-IETD-FMK, 20 µM) was added prior to siRNA transfection of A549 and H1299 cells and incubated for 72 hours followed by Annexin V/PI assay. (B) Western blot analysis of TG2 and cleaved PARP proteins with caspase-8 inhibition. (C, D) The caspase-9 inhibitor (Z-LEHD-FMK, 20 µM) was also added prior to siRNA transfection and analyzed. (E) Salubrinal (30 µM) was added prior to siRNA transfection of A549 and H1299 cells followed by Annexin V/PI assay. (F) Western blot analysis of TG2, cleaved PARP, and GRP78 proteins with ER stress inhibition. Abbreviations: ER, endoplasmic reticulum; PI, propidium iodide; TG2, tissue transglutaminase 2. |
Reduction of TG2 in lung cancer cells resulted in ROS-induced apoptosis
The caspase-dependent apoptosis induced by TG2 reduction was further investigated to determine the mechanism mediated by TG2. According to previous reports, oxidative stress induces TG2 expression.14 Therefore, we hypothesized that TG2 may have a counterbalance effect on high levels of ROS. When A549 and H1299 cells were transfected with siTG2 RNA for 48 hours, the intracellular ROS levels were elevated when compared with siNC RNA. Preincubation of the antioxidant NAC restored the lower ROS levels even with siTG2 RNA transfection, whereas preincubation of NAC with siNC RNA has a similar ROS level as siNC RNA (Figure 5A). The significance of ROS-mediated cell death was further demonstrated in Figure 5B, which showed A549 and H1299 cells transfected with siTG2 RNA for 60 hours with or without NAC and analyzed by Annexin V/PI assay. The results showed that NAC prevented the siTG2 RNA transfection-induced cell death (early, late, and necrosis) significantly in A549 and H1299 cells. The correlation of ROS and calcium homeostasis was also investigated (Figure 5C) under the same conditions as in Figure 5A. When A549 and H1299 cells were transfected with siTG2 RNA up to 48 hours, intracellular calcium levels were increased. The application of NAC maintained the original calcium levels, suggesting that ROS and calcium homeostasis are parts of TG2-regulated cellular activities.
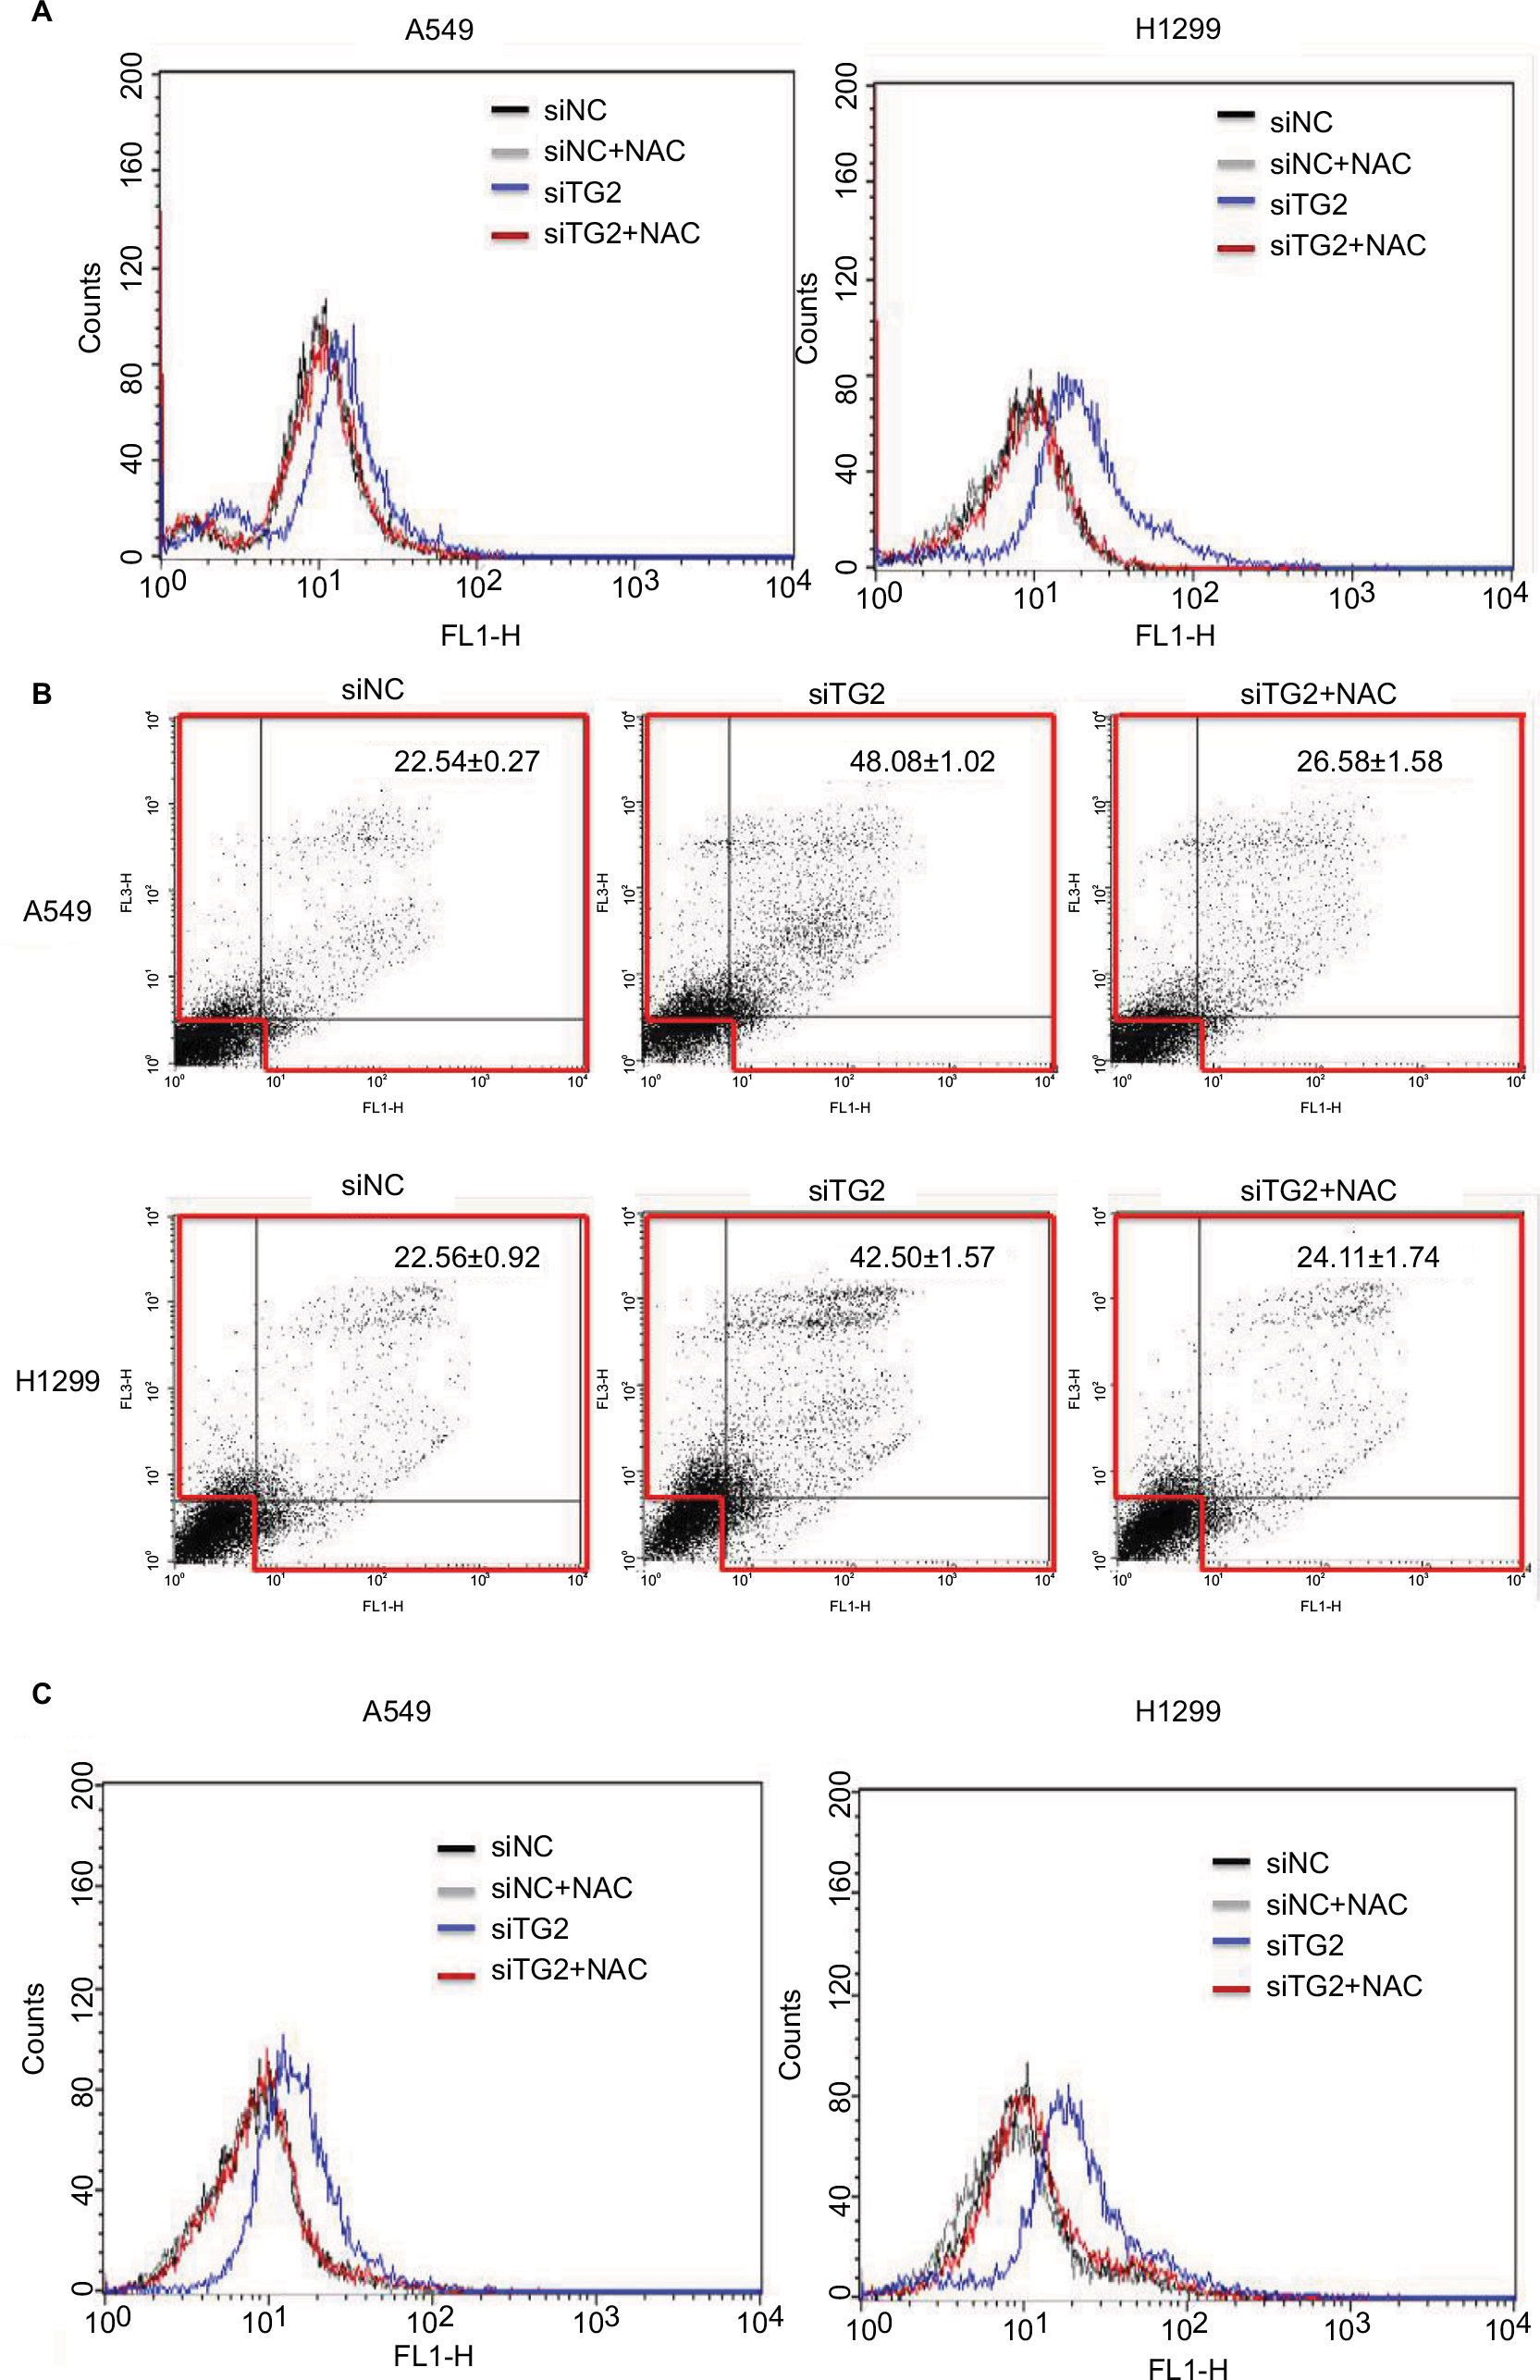 | Figure 5 The effects of antioxidant NAC on TG2-reduced lung cancer cells. Notes: (A) With or without preincubation of NAC (10 mM, 1 hour) followed by siRNA transfection, then incubated with fresh medium/NAC, intracellular reactive oxygen species were detected by H2DCFDA fluorescence-activated cell sorting analysis after 48 hours of transfection. (B) Annexin V/propidium iodide assay for NAC-associated antiapoptosis on TG2-reduced A549 and H1299 cells after 60 hours of transfection. (C) Intracellular calcium levels of siRNA control (siNC), siNC + NAC, siTG2, and siTG2 + NAC were analyzed by Flow-3AM assay with 48 hours of transfection. Abbreviations: NAC, N-acetyl-L-cysteine; TG2, tissue transglutaminase 2. |
Superoxide dismutase 2 (SOD2) expression correlated with TG2 reduction, NAC only partially restored SOD2 expression
The elevated ROS and calcium levels associated with apoptosis indicate that mitochondrial SOD2, also known as manganese-dependent superoxide dismutase, may have been downregulated when TG2 expression was inhibited. Therefore, SOD2 expression was examined under the same conditions as in Figure 5B followed by immune blot analysis. When A549 and H1299 cells were transfected with siTG2 RNA, reduced SOD2 expression levels were detected at 36 hours of TG2 inhibition. After 60 hours of TG2 inhibition, the expression of SOD2 maintained low levels (Figure 6A). When NAC was preadded with the transfected cells, the cell death was prevented (Figure 5B) and cleaved PARP levels were correspondingly reduced, but SOD2 expression only partially increased (Figure 6A). As SOD2 confers protection against cell death by eliminating mitochondrial ROS,24 these results indicate that SOD2-associated mitochondrial ROS are only part of TG2-reduction-regulated apoptosis.
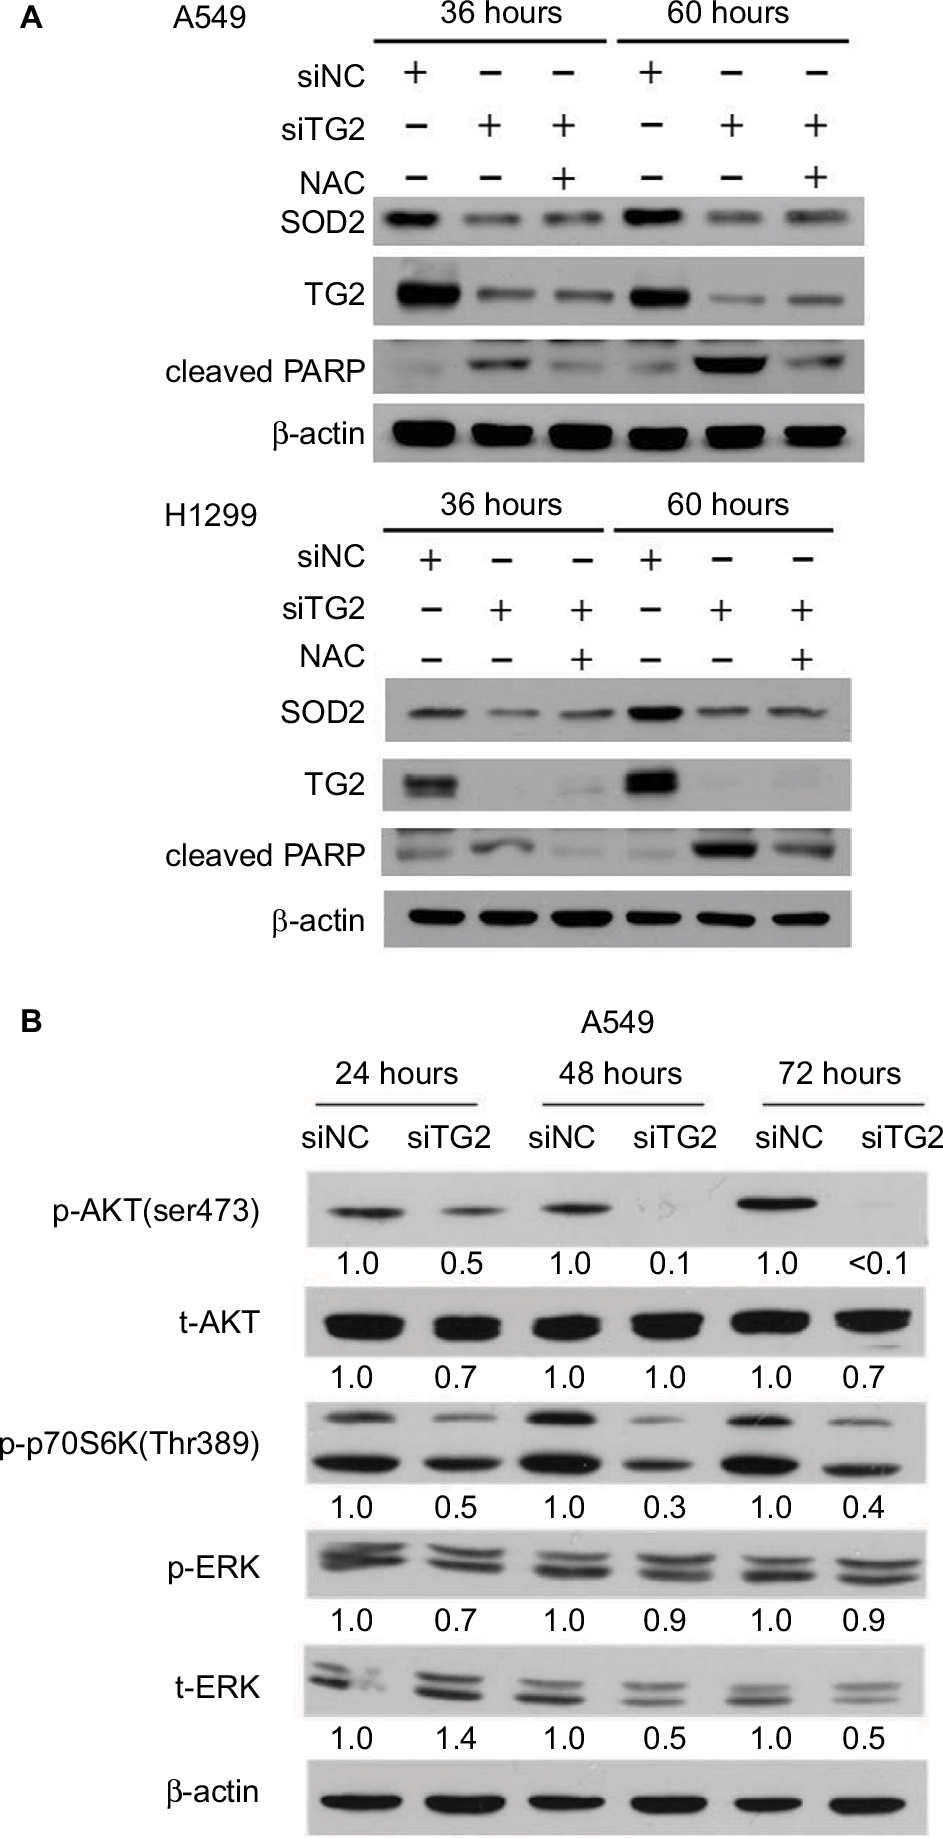 | Figure 6 TG2 associated with SOD2 expression and AKT/mammalian target of rapamycin/p70S6K signaling pathway activation. Notes: (A) Western blot analysis of the association of SOD2 with TG2 expression with or without N-acetyl-L-cysteine after 36 and 60 hours of siRNA transfection on A549 and H1299 cells. (B) Western blot analysis of the AKT/mTOR/p70S6K signaling pathway on A549 cells after 24, 48, and 72 hours of siRNA transfection. Abbreviations: SOD2, superoxide dismutase 2; TG2, tissue transglutaminase 2. |
AKT/mTOR/p70S6K signaling pathway is regulated by TG2 for proliferation
The AKT kinases pathway is associated with cell proliferation mechanism and has been demonstrated to be activated or inhibited by ROS.25 To identify the mechanism of TG2-reduction-associated cell death in A549 cells, we further analyzed the protein lysates on Western blots (Figure 6B). The AKT-Ser473 and p70S6K-Thr389 phosphorylated levels were significantly reduced with the lowest level detected in cells harvested at 72 hours after siTG2 transfection. The phosphorylated ERK levels were not significantly altered under the same conditions, while the total ERK level might have been reduced when TG2 expression was reduced by siTG2 transfection.
Discussion
Cancer cells develop an antioxidant system consisting of ROS scavenging enzymes such as CAT, glutathione peroxidases, and SODs, as well as antioxidant agents like nicotinamide adenine dinucleotide phosphate and glutathione. The antioxidant capacities of cancer cells increase with elevating ROS levels, potentially as a survival adaptation, with significant changes in the antioxidant defense system in NSCLC and SCLC patients.26 The balance between ROS production and elimination maintains cellular redox homeostasis, which also affects calcium homeostasis, and is essential and vital to cell survival.27 However, under the situation of imbalance in redox status, depending on the magnitude of ROS encountered, high levels of ROS can induce apoptosis. Among the known ROS/calcium homeostasis regulators, the role of TG2 has been indicated as a responder in that intracellular ROS is essential for the activation of TG2, but little is known of the role of TG2 in the regulation of redox homeostasis. In this report, we demonstrated that TG2 regulates ER stress and maintains redox homeostasis for lung cancer cell proliferation regardless of the endogenous TG2 level through the AKT/mTOR/p70S6K signaling pathway. Downregulation of TG2 expression may inhibit ROS scavenging enzymes and cumulate oxidative stress to induce apoptotic cell death, as we proposed in Figure 7.
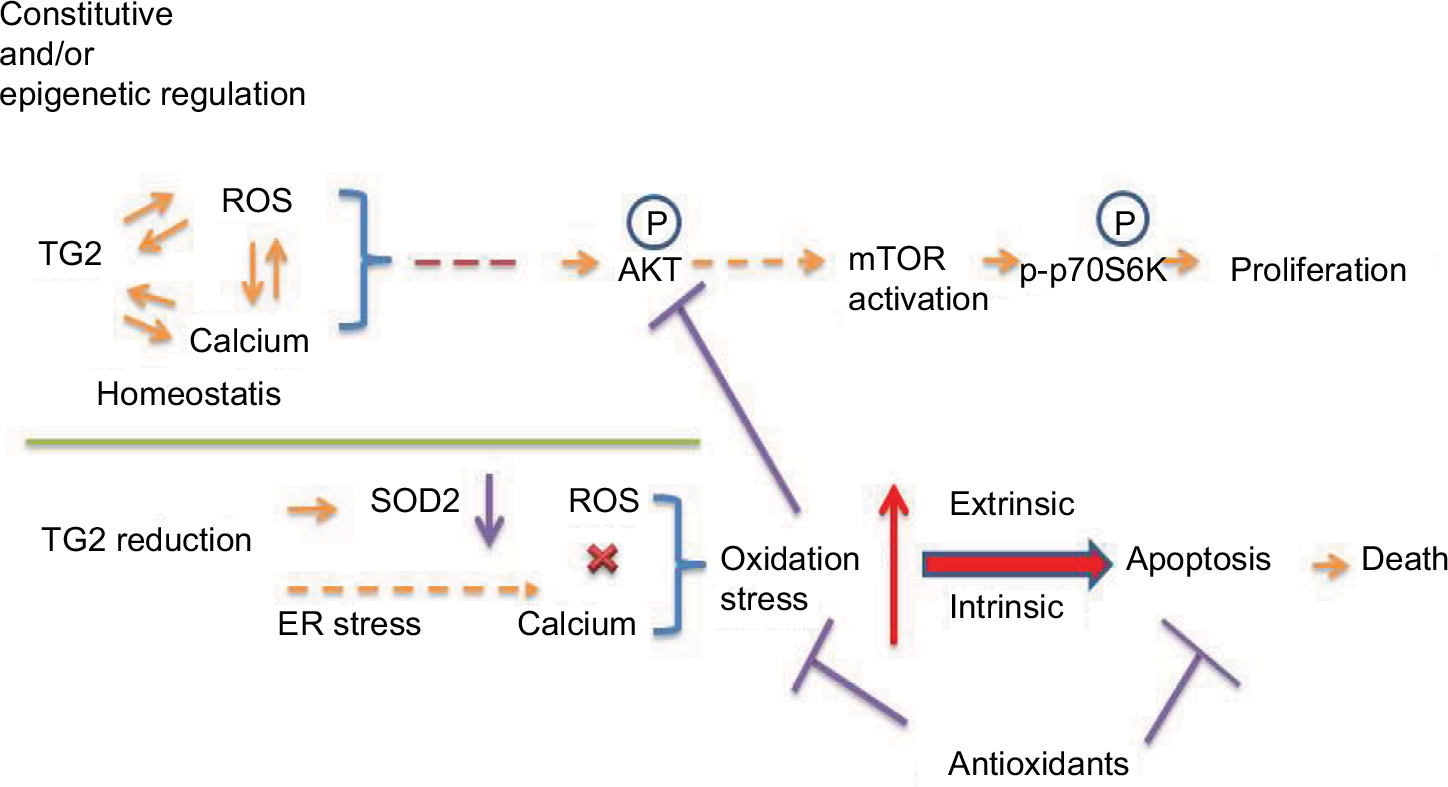 | Figure 7 Proposed regulation of cellular proliferation and death by TG2 in NSCLC. Notes: TG2 expression can be regulated epigenetically in NSCLC to maintain redox homeostasis and through AKT activation for proliferation. Knockdown of TG2 expression induces ER stress and disrupts the redox homeostasis and produces oxidative stress that activates intrinsic and extrinsic apoptotic pathways, resulting in cell death. Although SOD2 generally responds to oxidative stress, knockdown of TG2 expression is associated with SOD2 downregulation and loss of protection. The antioxidants should be carefully administrated when TG2 is targeted for inhibition. Abbreviations: ER, endoplasmic reticulum; mTOR, mammalian target of rapamycin; NSCLC, non-small-cell lung cancer; ROS, reactive oxygen species; TG2, tissue transglutaminase 2. |
TG2 expression is constitutive in many different cell types, and depending on the cell type, TG2 can be regulated by several transcriptional activators, such as cytokines, retinoid, vitamin D, and steroid hormones.14 Although A549 cells already constitutively express high levels of TG2, TSA and 5-Aza are able to further upregulate TG2 expression (Figures 1 and 2). Low levels of TG2 expression in other NSCLC cell lines (H1299 and H1355) can also be upregulated by TSA and 5-Aza; these data indicate that TG2 expression in NSCLC are partly mediated by epigenetic regulation. Increasing evidence suggests that oxidative stress globally influences chromatin structure, DNA methylation, and enzymatic and nonenzymatic posttranslational modifications of histones and DNA-binding proteins.28 To cope with the rising ROS, for lung cancer cells to survive, we postulate that TG2 may epigenetically adjust to provide protection, resulting in cancer cell proliferation and allowing the disease to progress and develop resistance to apoptosis. It is interesting to note that H460 cells have no TG2 expression (Figure 1) and we have not been able to detect the epigenetic upregulation of TG2 transcription (data not shown). Therefore, TG2 is not the only modulator for cancer cells to maintain redox homeostasis.
Elevated ROS can directly affect the caspase function in the intrinsic and extrinsic death receptor apoptotic pathways.29 The possible link between TG2 and the death receptor apoptotic pathway has been previously reported. In a prior study, silencing of TG2 by siRNA led to a significant increase in TRAIL-mediated lung cancer cell death through upregulation of death receptor 5.30 Our data have demonstrated that TG2 knockdown resulted in ER stress upregulation, and it has been reported that persistent ER stress built up intracellular DR5 protein, driving ligand-independent DR5 activation and apoptosis engagement through caspase-8.31 Therefore, it is possible that upregulation of death receptor 5 may also be associated in our proposed model.
We addressed the role of TG2 in NSCLC cells by preventing ROS-induced apoptosis. Recently, inhibition of TG2 by siRNA-induced apoptosis has been reported in the gastric carcinoma cell line MKN-45.32 According to the findings, the knockdown of TG2 had an analogous apoptosis-inducing effect, as in the knockdown of CAT. These data were explained by the possible lack of TG2 in the cell membrane for CAT attachment, which should reactivate intercellular ROS-dependent apoptosis-inducing signaling. Whether CAT expression was downregulated by siTG2 RNA was not reported. In contrast, we demonstrated that the SOD2 expression was downregulated by knockdown of TG2 in NSCLC, indicating that TG2 may regulate the expression of ROS scavenging enzymes to maintain redox homeostasis.
The serine/threonine kinase AKT is known as a proto-oncogene. It is activated by extracellular signals through PI3K signaling and is downregulated by PTEN. AKT mediates carcinogenesis mainly through promoting cell survival and inhibiting apoptosis.33 ROS not only activates the prosurvival PI3K/AKT signaling pathway33 but can inhibit the PI3K/AKT signaling pathway in A549 cells.34 The inhibition of AKT phosphorylation by ROS has also been demonstrated in different cancer cells, including human breast cancer cell lines (T47D and MCF-7),35 cervical carcinoma cells,36 and prostate cancer cells (PC3).37 According to the above reports and our data, we conclude that the TG2–ROS–AKT axis is critical for lung cancer cell proliferation.
Many cancer patients take antioxidant nutritional supplements during cancer therapy to attenuate treatment toxicities and wish to improve long-term outcomes, but the safety of antioxidant use during cancer treatment is a controversial issue.38,39 Our data indicate that in order to survive, lung cancer cells have to cope with the excess ROS, and successful cancer cells combat this stress by TG2-regulated signaling pathway to neutralize ROS. Therefore, antioxidant nutritional supplements may actually promote cancer growth as it has been demonstrated in mouse model of melanomas.40
Conclusion
Compared to normal cells, rapid growth cancer cells are able to adapt to altered redox homeostasis and can develop alternative metabolic pathways that make them less sensitive to chemotherapy and radiation. As cancer cells are closer to the threshold of ROS toxicity, interrupting redox homeostasis may be a potential target to inhibit tumor metastasis and mitigate drug resistance. This could be achieved by inhibition of ROS detoxification or stimulation of ROS production.41 Our data suggest that TG2 acts as a main redox homeostasis modulator in NSCLC to prevent oxidative-stress-induced cell death. Inhibition of TG2 expression stimulates ROS production and altered redox homeostasis over the threshold of ROS toxicity, and therefore, permits cancer cell death.
Acknowledgments
This study was supported by CSMU-CYCH-103-03 to GT Sheu and MOST-105-2632-B-040-003 to MF Wu from the Ministry of Science and Technology, Taipei, Taiwan. LY Chiu is supported by MOST-106-2811-B-040-008.
Disclosure
The authors report no conflicts of interest in this work.
References
Lorand L, Graham RM. Transglutaminases: crosslinking enzymes with pleiotropic functions. Nat Rev Mol Cell Biol. 2003;4(2):140–156. | ||
Belkin AM. Extracellular TG2: emerging functions and regulation. FEBS J. 2011;278(24):4704–4716. | ||
Eckert RL, Fisher ML, Grun D, Adhikary G, Xu W, Kerr C. Transglutaminase is a tumor cell and cancer stem cell survival factor. Mol Carcinog. 2015;54(10):947–958. | ||
Tatsukawa H, Furutani Y, Hitomi K, Kojima S. Transglutaminase 2 has opposing roles in the regulation of cellular functions as well as cell growth and death. Cell Death Dis. 2016;7(6):e2244. | ||
Verma A, Wang H, Manavathi B, et al. Increased expression of tissue transglutaminase in pancreatic ductal adenocarcinoma and its implications in drug resistance and metastasis. Cancer Res. 2006;66(21):10525–10533. | ||
Mehta K, Fok J, Miller FR, Koul D, Sahin AA. Prognostic significance of tissue transglutaminase in drug resistant and metastatic breast cancer. Clin Cancer Res. 2004;10(23):8068–8076. | ||
Hwang JY, Mangala LS, Fok JY, et al. Clinical and biological significance of tissue transglutaminase in ovarian carcinoma. Cancer Res. 2008;68(14):5849–5858. | ||
Satpathy M, Cao L, Pincheira R, Emerson R, Bigsby R, Nakshatri H, Matei D. Enhanced peritoneal ovarian tumor dissemination by tissue transglutaminase. Cancer Res. 2007;67(15):7194–7202. | ||
Park KS, Kim HK, Lee JH, et al. Transglutaminase 2 as a cisplatin resistance marker in non-small cell lung cancer. J Cancer Res Clin Oncol. 2010;136(4):493–502. | ||
Yuan L, Siegel M, Choi K, et al. Transglutaminase 2 inhibitor, KCC009, disrupts fibronectin assembly in the extracellular matrix and sensitizes orthotopic glioblastomas to chemotherapy. Oncogene. 2007;26(18):2563–2573. | ||
Ai L, Kim WJ, Demircan B, et al. The transglutaminase 2 gene (TGM2), a potential molecular marker for chemotherapeutic drug sensitivity, is epigenetically silenced in breast cancer. Carcinogenesis. 2008;29(3):510–518. | ||
Dyer LM, Schooler KP, Ai L, et al. The transglutaminase 2 gene is aberrantly hypermethylated in glioma. J Neurooncol. 2011;101(3):429–440. | ||
Liu T, Tee AE, Porro A, et al. Activation of tissue transglutaminase transcription by histone deacetylase inhibition as a therapeutic approach for Myc oncogenesis. Proc Natl Acad Sci U S A. 2007;104(47):18682–18687. | ||
Ientile R, Caccamo D, Griffin M. Tissue transglutaminase and the stress response. Amino Acids. 2007;33(2):385–394. | ||
Jiang D, Ying W, Lu Y, et al. Identification of metastasis-associated proteins by proteomic analysis and functional exploration of interleukin-18 in metastasis. Proteomics. 2003;3(5):724–737. | ||
Verma A, Mehta K. Tissue transglutaminase-mediated chemoresistance in cancer cells. Drug Resist Updat. 2007;10(4–5):144–151. | ||
Verma A, Guha S, Diagaradjane P, et al. Therapeutic significance of elevated tissue transglutaminase expression in pancreatic cancer. Clin Cancer Res. 2008;14(8):2476–2483. | ||
Lee ZW, Kwon SM, Kim SW, et al. Activation of in situ tissue transglutaminase by intracellular reactive oxygen species. Biochem Biophys Res Commun. 2003;305(3):633–640. | ||
Slaughter TF, Achyuthan KE, Lai TS, Greenberg CS. A microtiter plate transglutaminase assay utilizing 5-(biotinamido)pentylamine as substrate. Anal Biochem. 1992;205(1):166–171. | ||
Chiu LY, Ko JL, Lee YJ, Yang TY, Tee YT, Sheu GT. L-type calcium channel blockers reverse docetaxel and vincristine-induced multidrug resistance independent of ABCB1 expression in human lung cancer cell lines. Toxicol Lett. 2010;192(3):408–418. | ||
Wu CH, Hsiao YM, Yeh KT, et al. Upregulation of microRNA-4417 and its target genes contribute to nickel chloride-promoted lung epithelial cell fibrogenesis and tumorigenesis. Sci Rep. 2017;7(1):15320. | ||
Li J, Lee AS. Stress induction of GRP78/BiP and its role in cancer. Curr Mol Med. 2006;6(1):45–54. | ||
Wang R, Sun DZ, Song CQ, et al. Eukaryotic translation initiation factor 2 subunit α (eIF2α) inhibitor salubrinal attenuates paraquat-induced human lung epithelial-like A549 cell apoptosis by regulating the PERK-eIF2α signaling pathway. Toxicol In Vitro. 2018;46:58–65. | ||
Che M, Wang R, Li X, Wang HY, Zheng XFS. Expanding roles of superoxide dismutases in cell regulation and cancer. Drug Discov Today. 2016;21(1):143–149. | ||
Tan PL, Shavlakadze T, Grounds MD, Arthur PG. Differential thiol oxidation of the signaling proteins Akt, PTEN or PP2A determines whether Akt phosphorylation is enhanced or inhibited by oxidative stress in C2C12 myotubes derived from skeletal muscle. Int J Biochem Cell Biol. 2015;62:72–79. | ||
Kaynar H, Meral M, Turhan H, Keles M, Celik G, Akcay F. Glutathione peroxidase, glutathione-S-transferase, catalase, xanthine oxidase, Cu-Zn superoxide dismutase activities, total glutathione, nitric oxide, and malondialdehyde levels in erythrocytes of patients with small cell and non-small cell lung cancer. Cancer Lett. 2005;227(2):133–139. | ||
Zhao Y, Hu X, Liu Y, et al. ROS signaling under metabolic stress: cross-talk between AMPK and AKT pathway. Mol Cancer. 2017;16(1):79. | ||
Kreuz S, Fischle W. Oxidative stress signaling to chromatin in health and disease. Epigenomics. 2016;8(6):843–862. | ||
Moloney JN, Cotter TG. ROS signalling in the biology of cancer. Semin Cell Dev Biol. 2018;80:50–64. | ||
Frese-Schaper M, Schardt JA, Sakai T, Carboni GL, Schmid RA, Frese S. Inhibition of tissue transglutaminase sensitizes TRAIL-resistant lung cancer cells through upregulation of death receptor 5. FEBS Lett. 2010;584(13):2867–2871. | ||
Lu M, Lawrence DA, Marsters S, et al. Opposing unfolded-protein-response signals converge on death receptor 5 to control apoptosis. Science. 2014;345(6192):98–101. | ||
Bauer G. siRNA-based analysis of the abrogation of the protective function of membrane-associated catalase of tumor cells. Anticancer Res. 2017;37(2):567–582. | ||
Manning BD, Cantley LC. AKT/PKB signaling: navigating downstream. Cell. 2007;129(7):1261–1274. | ||
Yin Y, Sui C, Meng F, Ma P, Jiang Y. The omega-3 polyunsaturated fatty acid docosahexaenoic acid inhibits proliferation and progression of non-small cell lung cancer cells through the reactive oxygen species-mediated inactivation of the PI3K/Akt pathway. Lipids Health Dis. 2017;16(1):87. | ||
Wang M, Shu ZJ, Wang Y, Peng W. Stachydrine hydrochloride inhibits proliferation and induces apoptosis of breast cancer cells via inhibition of Akt and ERK pathways. Am J Transl Res. 2017;9(4):1834–1844. | ||
Zhang L, Huo X, Liao Y, Yang F, Gao L, Cao L. Zeylenone, a naturally occurring cyclohexene oxide, inhibits proliferation and induces apoptosis in cervical carcinoma cells via PI3K/AKT/mTOR and MAPK/ERK pathways. Sci Rep. 2017;7(1):1669. | ||
Posadino AM, Phu HT, Cossu A, et al. Oxidative stress-induced Akt downregulation mediates green tea toxicity towards prostate cancer cells. Toxicol In Vitro. 2017;42:255–262. | ||
Harris IS, Brugge JS. Cancer: the enemy of my enemy is my friend. Nature. 2015;527(7577):170–171. | ||
Chikara S, Nagaprashantha LD, Singhal J, Horne D, Awasthi S, Singhal SS. Oxidative stress and dietary phytochemicals: role in cancer chemoprevention and treatment. Cancer Lett. 2018;413:122–134. | ||
Piskounova E, Agathocleous M, Murphy MM, et al. Oxidative stress inhibits distant metastasis by human melanoma cells. Nature. 2015;527(7577):186–191. | ||
Gorrini C, Harris IS, Mak TW. Modulation of oxidative stress as an anticancer strategy. Nat Rev Drug Discov. 2013;12(12):931–947. |
 © 2018 The Author(s). This work is published and licensed by Dove Medical Press Limited. The full terms of this license are available at https://www.dovepress.com/terms.php and incorporate the Creative Commons Attribution - Non Commercial (unported, v3.0) License.
By accessing the work you hereby accept the Terms. Non-commercial uses of the work are permitted without any further permission from Dove Medical Press Limited, provided the work is properly attributed. For permission for commercial use of this work, please see paragraphs 4.2 and 5 of our Terms.
© 2018 The Author(s). This work is published and licensed by Dove Medical Press Limited. The full terms of this license are available at https://www.dovepress.com/terms.php and incorporate the Creative Commons Attribution - Non Commercial (unported, v3.0) License.
By accessing the work you hereby accept the Terms. Non-commercial uses of the work are permitted without any further permission from Dove Medical Press Limited, provided the work is properly attributed. For permission for commercial use of this work, please see paragraphs 4.2 and 5 of our Terms.