")
Back to Journals » Nutrition and Dietary Supplements » Volume 12
Time to Death and its Predictor Among Children Under Five Years of Age with Severe Acute Malnutrition Admitted to Inpatient Stabilization Centers in North Shoa Zone, Amhara Region, Ethiopia
Authors Ashine YE, Ayele BA , Aynalem YA , Yitbarek GY
Received 9 February 2020
Accepted for publication 31 July 2020
Published 15 September 2020 Volume 2020:12 Pages 167—177
DOI https://doi.org/10.2147/NDS.S249045
Checked for plagiarism Yes
Review by Single anonymous peer review
Peer reviewer comments 2
Editor who approved publication: Dr Chandrika J Piyathilake
Yonatan Eshete Ashine,1 Belete Achamyelew Ayele,2 Yared Asmare Aynalem,3 Getachew Yideg Yitbarek4
1Department of Nutrition, North Wollo Zone Health Office, Amhara Regional Health Bureau, Woldia, Ethiopia; 2Wogeda Primary Hospital, Amhara Regional Health Bureau, South Gondar, Ethiopia; 3Department of Nursing, College of Health Sciences, Debre Berhan University, Debre Birhan, Ethiopia; 4Department of Biomedical Sciences (Medical Physiology), College of Health Sciences, Debre Tabor University, Debre Tabor, Ethiopia
Correspondence: Yonatan Eshete Ashine; Getachew Yideg Yitbarek Email [email protected]; [email protected]
Background: Severe acute malnutrition (SAM) is the leading cause of child mortality in developing nations. In Ethiopia, despite the presence of clinical management protocols, under-five mortality is still high. Moreover, many of the predictors for mortality during inpatient care were not well addressed. Therefore, the aim of the current study was to determine the time to death and its predictors among children under five with severe acute malnutrition.
Patients and Methods: A 48-month retrospective cohort study was carried out among 346 children under five from 6 to 59 months of SAM. Data were collected from patient charts by using simple random sampling and entered in EpiData 3.1 and analyzed with STATA 14. A Kaplan–Meier curve and long rank test were used to estimate the survival time and compare survival curves between variables. A Cox proportional hazard model was fitted to identify predictors. Variable with P-value < 0.05 with 95% confidence interval was considered as significant for this study.
Results: A total of 346 children were followed with an incidence rate of 5.5 deaths per 1000 person-day observation (95%CI: 3.5– 8.5). During the follow-up, 212 (61%) were males, 20 (5.8%) had died. This study also showed that males were nearly twice as likely to die than females. Sepsis (AHR: 1.62; 95%CI: 1.10– 2.37), hospital admission (AHR: 2.29; 95%CI: 1.43– 3.65), presence of edema, (AHR: 1.81; 95%CI: 1.2– 2.19), TB (AHR: 1.62; 95%CI: 1.10– 2.37) and breast feeding (AHR: 0.41; 95%CI: 0.29– 2.37) were predictors of mortality.
Conclusion: The overall mean survival time and death was in line with the minimum SPHERE standard. The main predictors of death were having edema, sepsis, hospital admission and breast feeding status at admission. Therefore, it should be better to treat patients with TB, sepsis, edema according to SAM national protocol and promote breast feeding practice.
Keywords: censored, malnutrition, predictors, time to death, Ethiopia
Background
Severe acute malnutrition (SAM) is defined as a very low weight for height, visible severe wasting or the presence of nutritional edema and mid upper arm circumference (MUAC) less than 11.5 cm in children aged under five.1 Under-nutrition makes major contribution to global disease burden, which is responsible, directly or indirectly, for 35% of deaths among children under five. Developmental, economic, social, and medical impacts of global burdens of malnutrition are serious and lasting for individuals and their family, community, and countries.2–5
The majority of children with SAM should be managed in hospital as the alteration in their physiology and metabolic function predisposes them to complications. Therefore, successful management of SAM patient, based on appropriate WHO management guidelines is mandatory.5,6 It puts children at greater risk of dying from common infections, delays recoveries, weakens their immune system and has a direct effect on a child's mortality as it compromises immune function, increases susceptibility to infectios disease, hastens the progression, severity, and duration of diseases (like diarrhea, acute upper respiratory infection, TB, HIV), increases energy requirement, reduces appetite and nutrient absorption.7,8,9
Globally, only one in five children with severe acute malnutrition went to treatment and around 155 million children live with stunted growth and wasted bodies, respectively. A report of UNICE shows that severely stunted and wasted children have four and nine times higher risk of mortality than nonmalnourished children, respectively.10
Nutrition-related factors contribute to about 45% of death in children under five in low and middle income countries.11 In Africa 59 and 19 million children live with stunting and wasting in that order which indicates that Africa is the only region where the number of stunted children has risen. This indicated that SAM remains the top killer disease for children under five years.12 In developing countries especially in East Africa 24 million children are living with SAM.13 The death rate after admission is also higher (46%) in Zambia.14
Despite the existence of an inpatient program both at hospitals and health centers with a common protocol, there is a higher mortality rate on this continent which has been attributed to either comorbidities, severity of disease during admission, delayed diagnosis, treatment initiation and poor adherence to guidelines.7,15,16
Ethiopia remains in a situation where under nutrition is the cause of half of its under-fives childhood death.17 Ministry of Health of Ethiopia established SC in the health facilities to decrease SAM-related morbidity and mortalities of children aged less than five years. Despite this, mortalities due to SAM are still high. and little is known about the time to death and its determinants from SAM, particularly in children underfive admitted to inpatient therapeutic feeding centers (ITFCs). Even previous studies could not assess and address the cases and many of the predictors for mortality during inpatient care, which necessitated the need for further study in the area. Thus, this study aimed to assess the time to death and its predictors among children under five with severe acute malnutrition admitted to inpatient stabilization center in North Shoa Zone, Amhara Region, Ethiopia.
Methods
Study Area and Period
The study was conducted at the stabilizing center (SC) of health institutes from January 20, 2017 to January 20, 2019, North Shoa, North east Ethiopia. The zone has a total population of 2.6 million with 90 health centers, one referral hospital and eight district hospitals. There are 16 SCs (two district hospitals and 14 health centers) that offer inpatient service based on the national SAM management protocol guideline.
Population and Eligibility Criteria
The source populations were those children aged between 6 and 59 months with a diagnosis of SAM and admitted to a stabilizing (therapeutic) feeding unit in North Shoa. Children from 6 to 59 months with SAM admitted to stabilizing/therapeutic feeding units at selected health institutions during the study period were the study population. Children admitted based solely on laboratory test (albumin test) results were excluded from the study. All children's charts and documentation for the previous 48 months were included in the study while those with incomplete charts were excluded.
Sample Size Determination and Sampling Procedure
The sample size was determined using Epi Info™ version 7.0.1 double population proportion exposure difference formula by considering major determinant variables (HIV/ADIS, vitamin A and edema). We considered edema as an independent determinant since it gives maximum sample size relative to other variables. Finally, by using one to three ratios of the case to control (1:3), a 95% level of confidence, with a power of 80% and adding a 10% nonresponse rate, the total sample size was 346.
Among the 16 SCs that offer inpatient service, four of them (DebreBirhan, and Debresina hospitals, Shewarobit and Keyet health centers) were selected randomly using lottery method. After that the study area was grouped into two strata based on the level of care they provide (hospital and health center). Proportional allocation was done for four randomly selected SCs and computer-generated simple random sampling technique was used to select individual’s records from the SC. Finally, the selected medical charts were assessed based on the predetermined eligibility criteria (Figure 1).
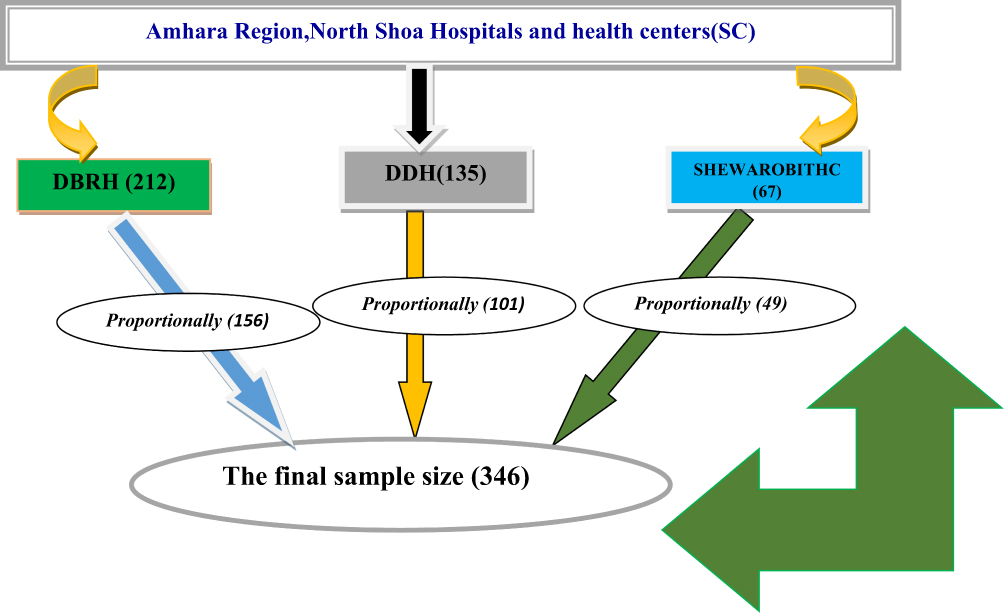 |
Figure 1 Schematic diagram showing the sampling procedure of children aged under five admitted with severe acute malnutrition in stabilizing centers in North Shoa, Amhara Region, Ethiopia. |
Operational Definition
ensored: are those cases that were alive and who are defaulters, not recovered, lost to follow-up at the end of the study.
Complete record: if age in months, sex of the child, admission date and time, SAM type, type of major complications, discharged date and treatment outcomes are well recorded.
Defaulter: patient that is absent for two consecutive weighings (two days in inpatient).
Time to death: time to occurrence of death measured from admission to date of event and coded as zero (death) and otherwise one.
Data Collection Procedure
A data extraction tool was developed from standard treatment protocol for the management of SAM, registration log book, monitoring multichart and reviewing related literature to collect the required individual information from the relevant documents; consists of the following data: patient related data (age, sex, residence), anthropometric measurements (height, weight, MUAC, edema), comorbidities, and types of severe acute malnutrition.
Data Quality Control
Data quality was assured by designing a proper data abstraction tool. The data collector and supervisor were experienced health professionals who were trained in SAM management protocol. Two days training were given concerning the data abstraction tool and data collection process both for data collectors and supervisors. During the data collection time, close supervision and monitoring was carried out by supervisors and investigators to ensure the quality of the data. Daily evaluation of the data for completeness and accuracy were done. Consistency was examined through random selection of cards by the principal investigator.
Data Processing and Analysis
Before analysis, data were cleaned, edited, and coded using EpiData version 3.1. After this data were entered using EpiData version 3.1 and analyzed using STATA 14. Life table analysis was used to estimate cumulative proportion of survival among children with SAM at different time points, Kaplan–Meier was used for comparison of different categories of independent variables and Cox regression was also used to determine the association of independent variables with time to death. First bivariable Cox regression analysis was computed for each predictor variable with time to death. Then variables with P-value <0.25 were included in the multivariable Cox proportional hazard model.
The Cox proportional hazard regression model assumption was checked using Schoenfeld residual test and variables having a P-value >0.05 were considered as fulfilling the assumption. Multicollinearity among independent variables was checked for variance inflation factor and it was less than 10. Variables with a P-value <0.05 with 95%CI and AHR which did not include one was considered as a significant factor.
Results
Sociodemographic and Anthropometry Characteristics
Out of 346 randomly selected SAM records, the data of 253 (73%) were extracted from hospital and 93 (27%) from health center-based stabilization centers. Sixty percent of the children enrolled in the study were males and 262 (75.75%) were under the age of two years. The mean age of the cohort at the time of admission was 18.2 months with SD  0.46 months. In addition, almost 83% of children admitted with SAM had MUAC of <11.5. The majority 324 (93.6%) of the children were newly admitted, 10 (2.8%), readmission, and 12 (3.5%) returned after default (Table 1).
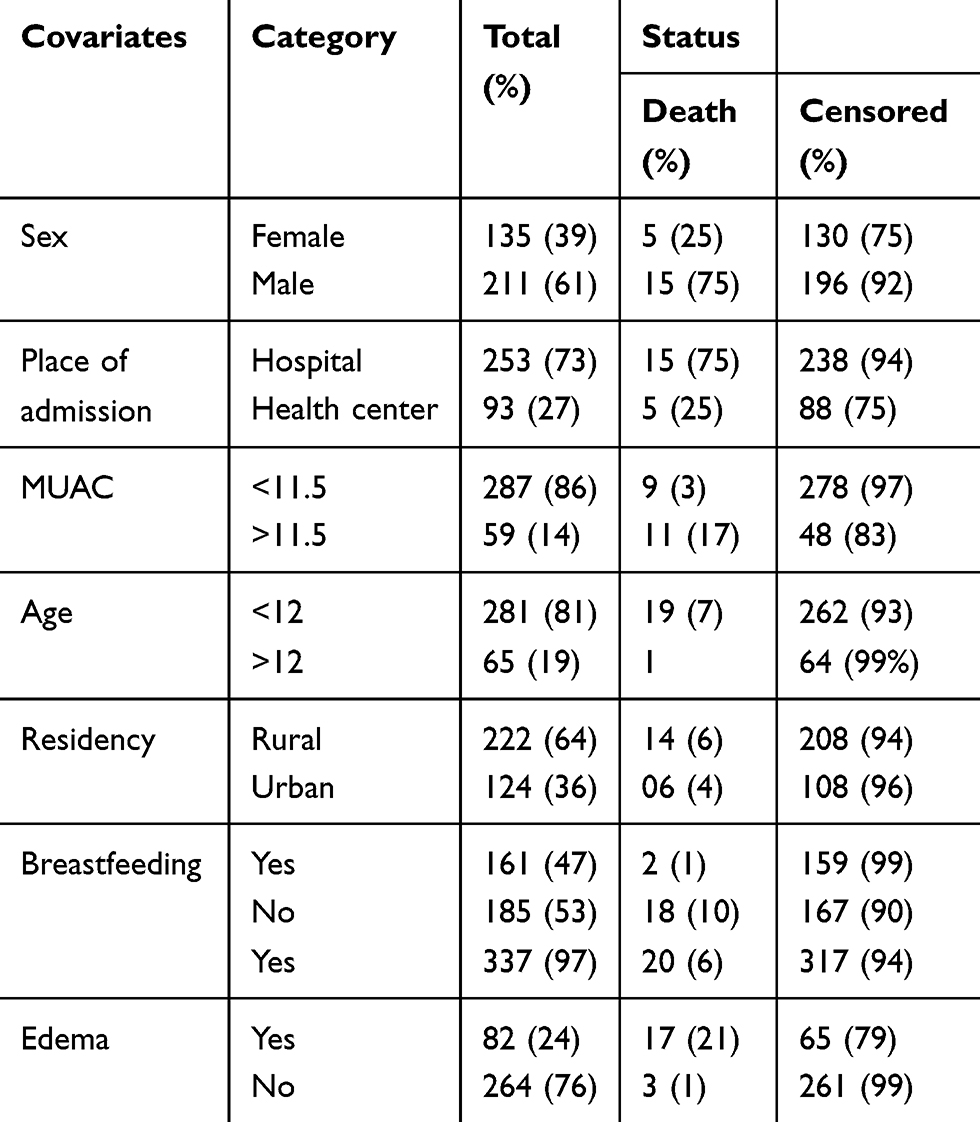 |
Table 1 Sociodemographic Characteristics of Children Under Five with Severe Acute Malnutrition |
Clinical Condition and Comorbidity Patterns at Admission
From the total 346 children admitted with SAM 267 (77%), 220 (63%), and 245 (71%) of the study participants had diarrhea, fever, cough, respectively at admission (Table 2).
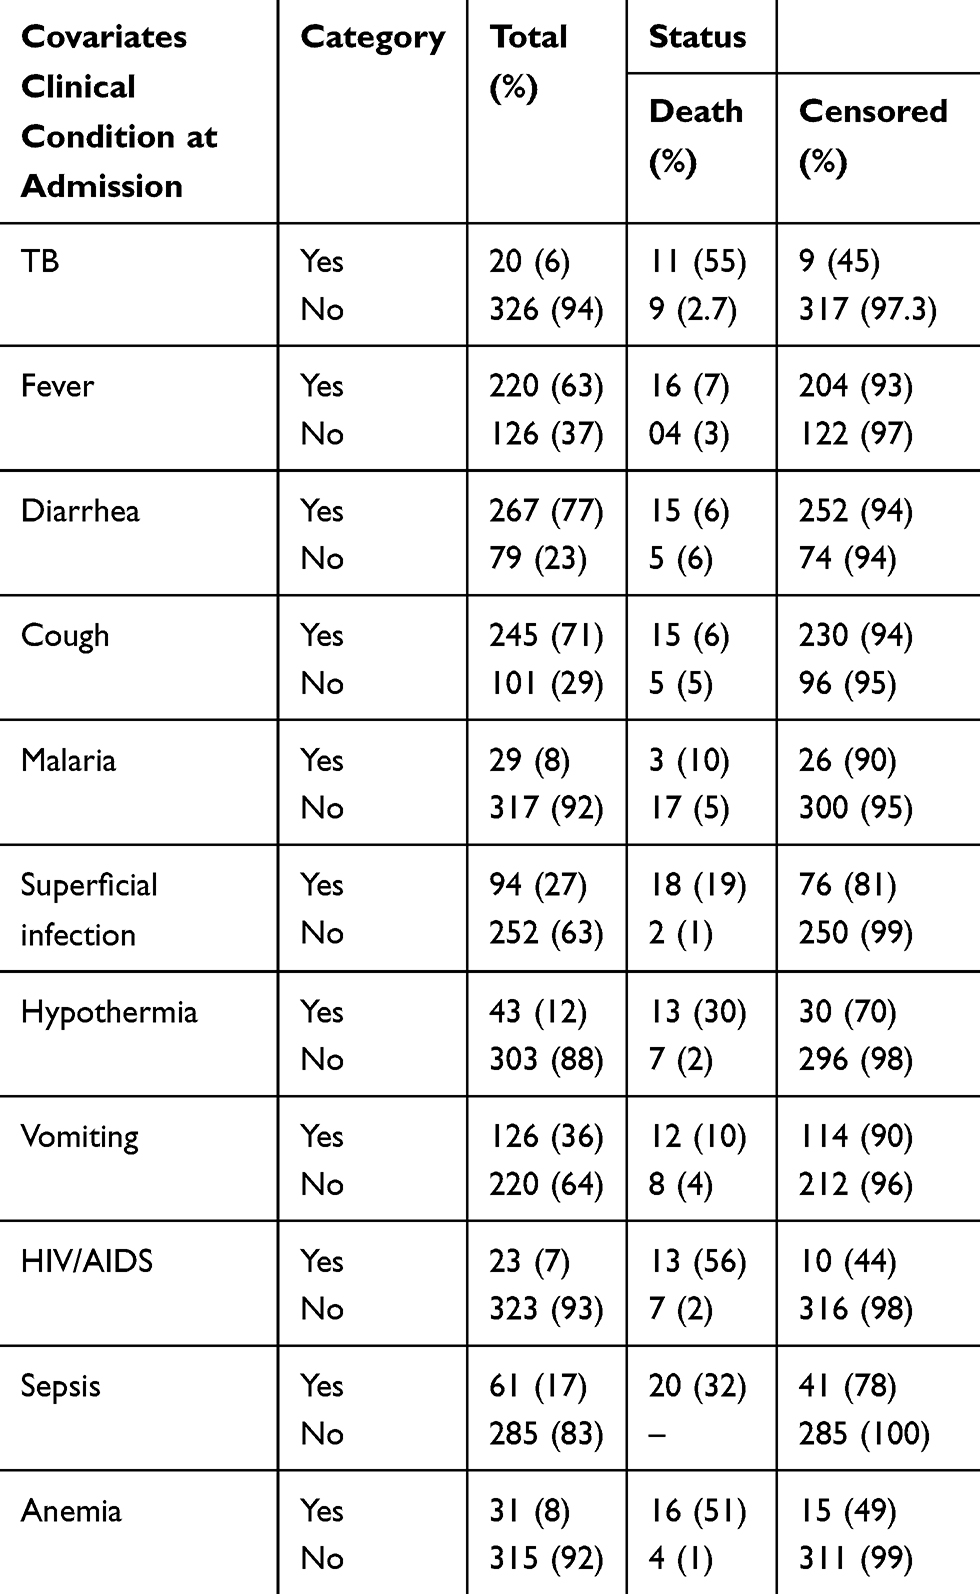 |
Table 2 Types of Comorbidities for Children Under Five with Severe Acute Malnutrition |
Routine and Special Medication Provision
The most common treatments provided according to protocol were; amoxicillin and gentamycin for 369 (94%) and 290 (89%) of children, respectively. While others 211 (54%), 157 (46%), and 145 (37%) of the participants were treated with folic acid, vitamin A and albendazole, respectively (Figure 2).
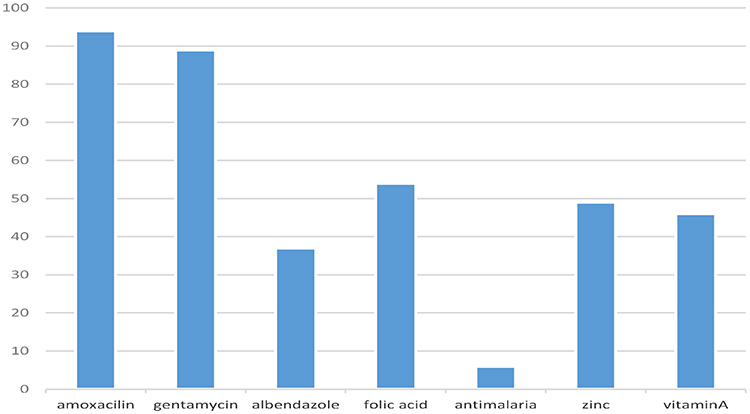 |
Figure 2 Medication provision for SAM children. |
Time to Death of Children Under Five
A total of 346 children under five with SAM that were admitted to a therapeutic unit have been followed from 0 to 39 days. The mean survival time was significantly different for predictor variables. The median survival time was undetermined, because the largest observed analysis time was censored. The survivor function did not reach zero; in such a case, the mean is the best estimate of survival time. The overall mean stay was 36 (95%CI: 34.3–37.7) days with a minimum and the maximum follow-up time of one and 39 days. In this study, 20 (5.8%) of the study participants died during the follow-up period (Table 2). From those children included in the analysis, 326 (94.2%) were censored. The total extent of follow-up was 3688 person-days, with an incidence rate of 5.5 deaths per 1000 person-days observation (95%CI: 3.5–8.5). This study also showed that male children are nearly twice as likely as female children to die (7.1 deaths compared with 3.2 deaths per 1000 live births).
The overall Kaplan–Meier estimate also showed that the probability of survival of children under five with SAM is high in the first days of admission, which falls relatively as follow-up time increases (Figure 3). But after 20 days of follow-up, there was no significant change observed. During the first three days of their stay, a maximum (99.4%) probability of survival was observed with a standard error of 0.005 (95%CI: 0.97–0.99). At the thirteenth day of stay the probability of survival was also found to be 99.6% with a standard error of 0.02 (95%CI: 0.150–0.24.), and at 39 days of stay, the overall probability of survival of children under five with SAM was 90% with a standard error of 0.33% (95%CI: 0.7947–0.9544) (Figure 3).
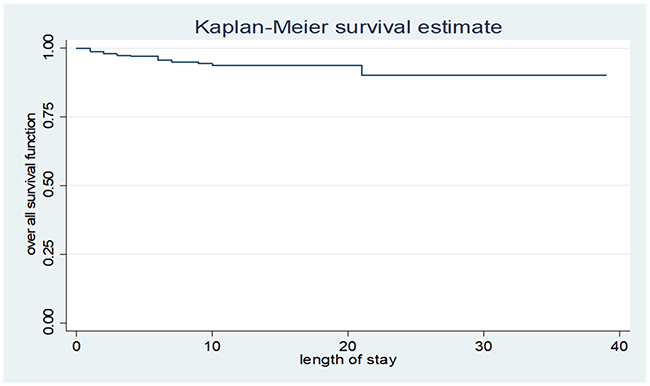 |
Figure 3 Overall Kaplan–Meier survival estimate for children under five with SAM. |
This life table showed that cumulative probability of staying in the program was 94% at third day, 58% at sixth day, 29% at ninth day, 2.6% at twelfth day, and zero percent at 33 days of admission (Table 3).
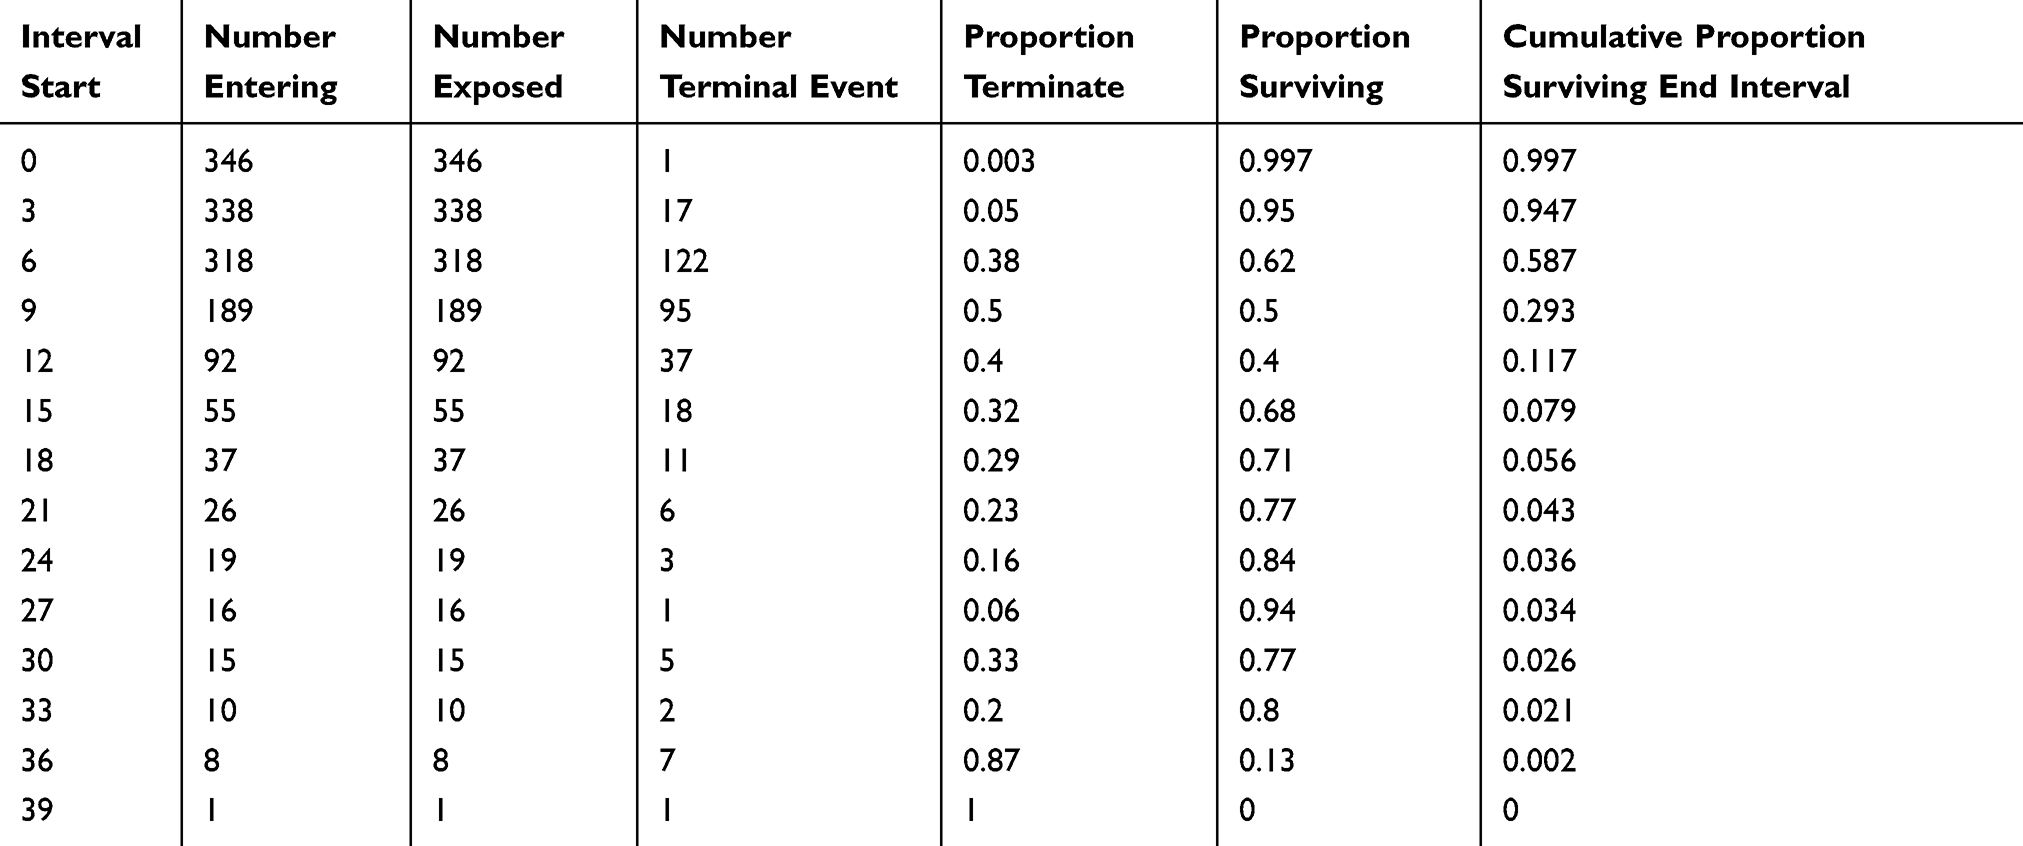 |
Table 3 Life Table for Time to Death and Its Predictors for Children Under Five with Severe Acute Malnutrition |
Survival Function and Comparison of Survivorship Functions for Different Categorical Variables
The Kaplan–Meier estimator survival curve gives the estimate of survivor function among different groups of covariates to make comparisons. Separate graphs of the estimates of the Kaplan–Meier survivor functions were constructed for different categorical covariates as described below;
The mean survival time for child who developed edema had been lower with 30 months as compared with those without edema with mean of 38 months and the difference was significant (P-value <0.001), (time to death of 82 children with edema and 264 children without edema was compared. Kaplan–Meier survival curve for edema at admission illustrated earlier death than that of children not having edema at admission) (Figure 4).
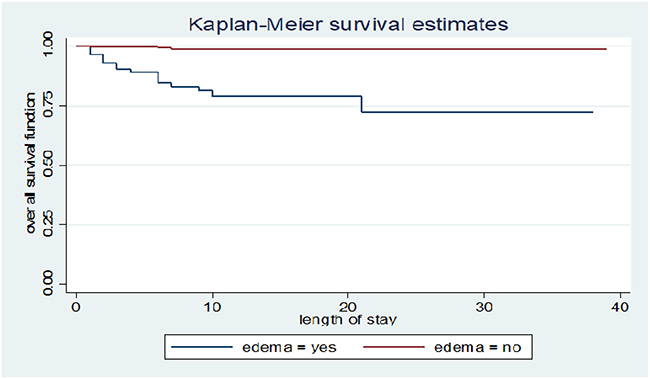 |
Figure 4 Kaplan–Meier survival curve, comparison of survival time with indifferent categories of edema. |
Kaplan–Meier survival curve for breastfeeding status at admission also illustrated that time to death of children with breastfeeding was better than that of children without breastfeeding at admission (Figure 5).
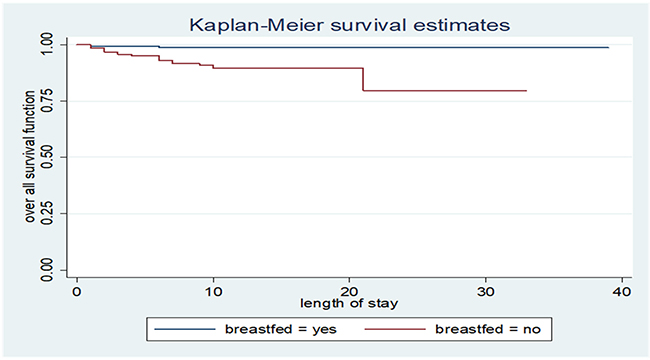 |
Figure 5 Kaplan–Meier survival curve, comparison of survival time with indifferent categories of breast feeding status. |
Time to death of children with categories of admission status was compared. Kaplan–Meier survival curve for children admission status illustrated that the death of new admission is better than that of children with repeat and defaulter status at admission (Figure 6).
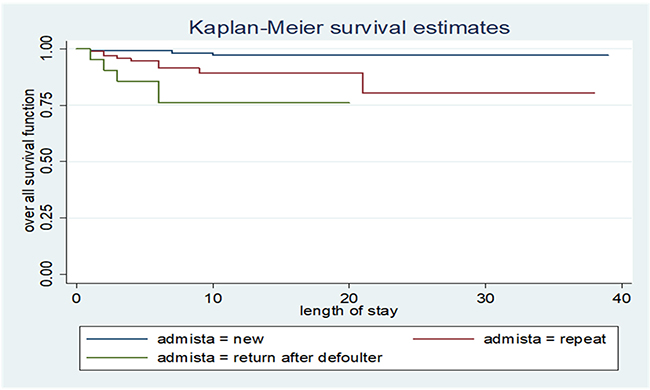 |
Figure 6 Kaplan–Meier survival curve, comparison of survival time with indifferent categories of admission status. |
Furthermore, to test equality of survival curves of different categorical explanatory variables Cochran–Mantel–Haenszel log rank test was performed. The test statistics which is obtained from log rank test showed that there is a significant difference in survival function (curve) for different categorical variables as shown in Table 3.
Therefore, based on this statistical test procedure all covariants listed in the table below except residence and sex of children aged from 6 to 59 months are statistically significant (P-value <0.05) (Table 4).
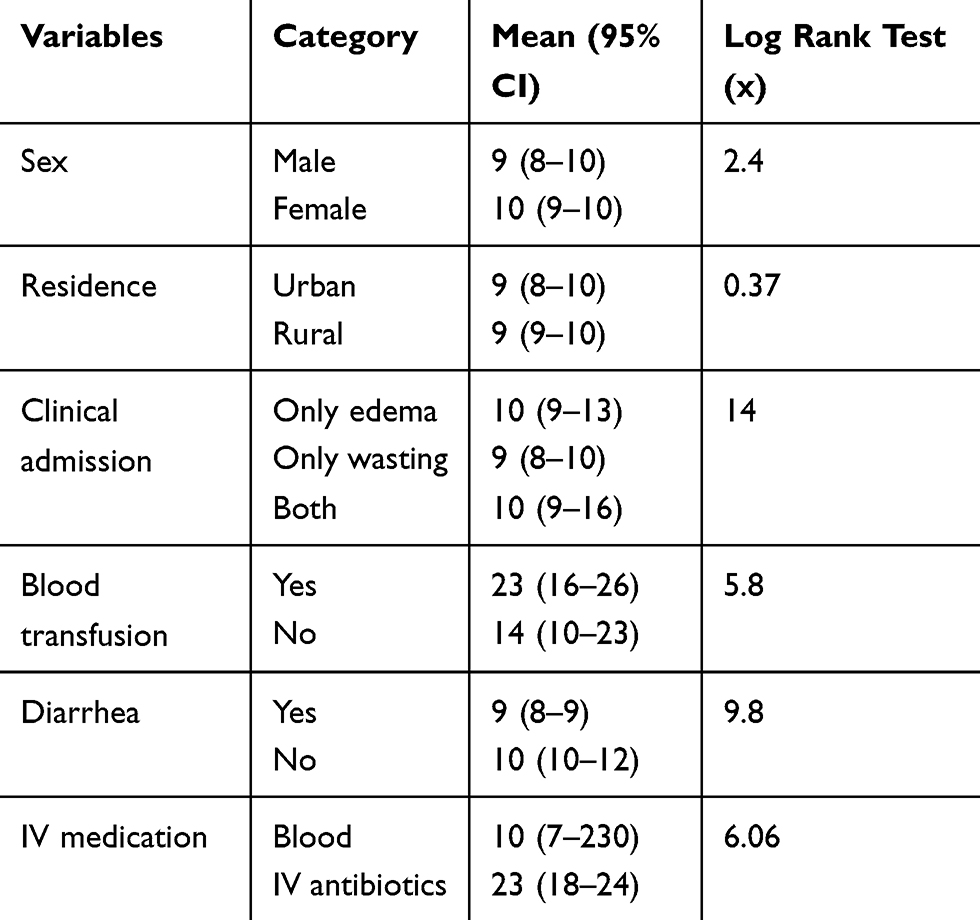 |
Table 4 Mean Survival Time and Log Rank Test of Children Under Five with Severe Acute Malnutrition |
Cox Proportional Hazard Regression Results of Predictors
The relationship between the baseline variables and the risk of mortality was analyzed using bivariable Cox proportional hazard regression model. The results of bivariable analysis showed that factors including edema, admission status, being male, living in rural area, presence of edema, HIV/ADIS, hospital admission, hypothermia, sepsis, TB, NG tube, severe dehydration were significantly associated with mortality of children aged from 6–59 months with SAM, but, presence of edema, breastfeeding, place of admission and having sepsis were found to be strong predictors of mortality in the multivariate analysis.
The result of multivariable analysis showed that children with SAM admitted to SCs who had TB 1.62 times more likely to die compared to those who did not have TB (AHR: 1.62; 95%CI: 1.10–2.37). The risk of mortality among children with SAM admitted to SCs from the hospital were 2.29 times higher compared to health center (AHR=2.29). As the results indicate children with SAM who had edema at admission, were 1.81 times at greater hazard of death compared to children with SAM without edema (HR: 1.81; 95%CI: 1.2–2.19). Finally, children with SAM who had breastfeeding at admission were found to be 59% less likely to die than those children who had not been breastfed (AHR: 0.41; 95%CI: 0.29–0.58) (Table 5).
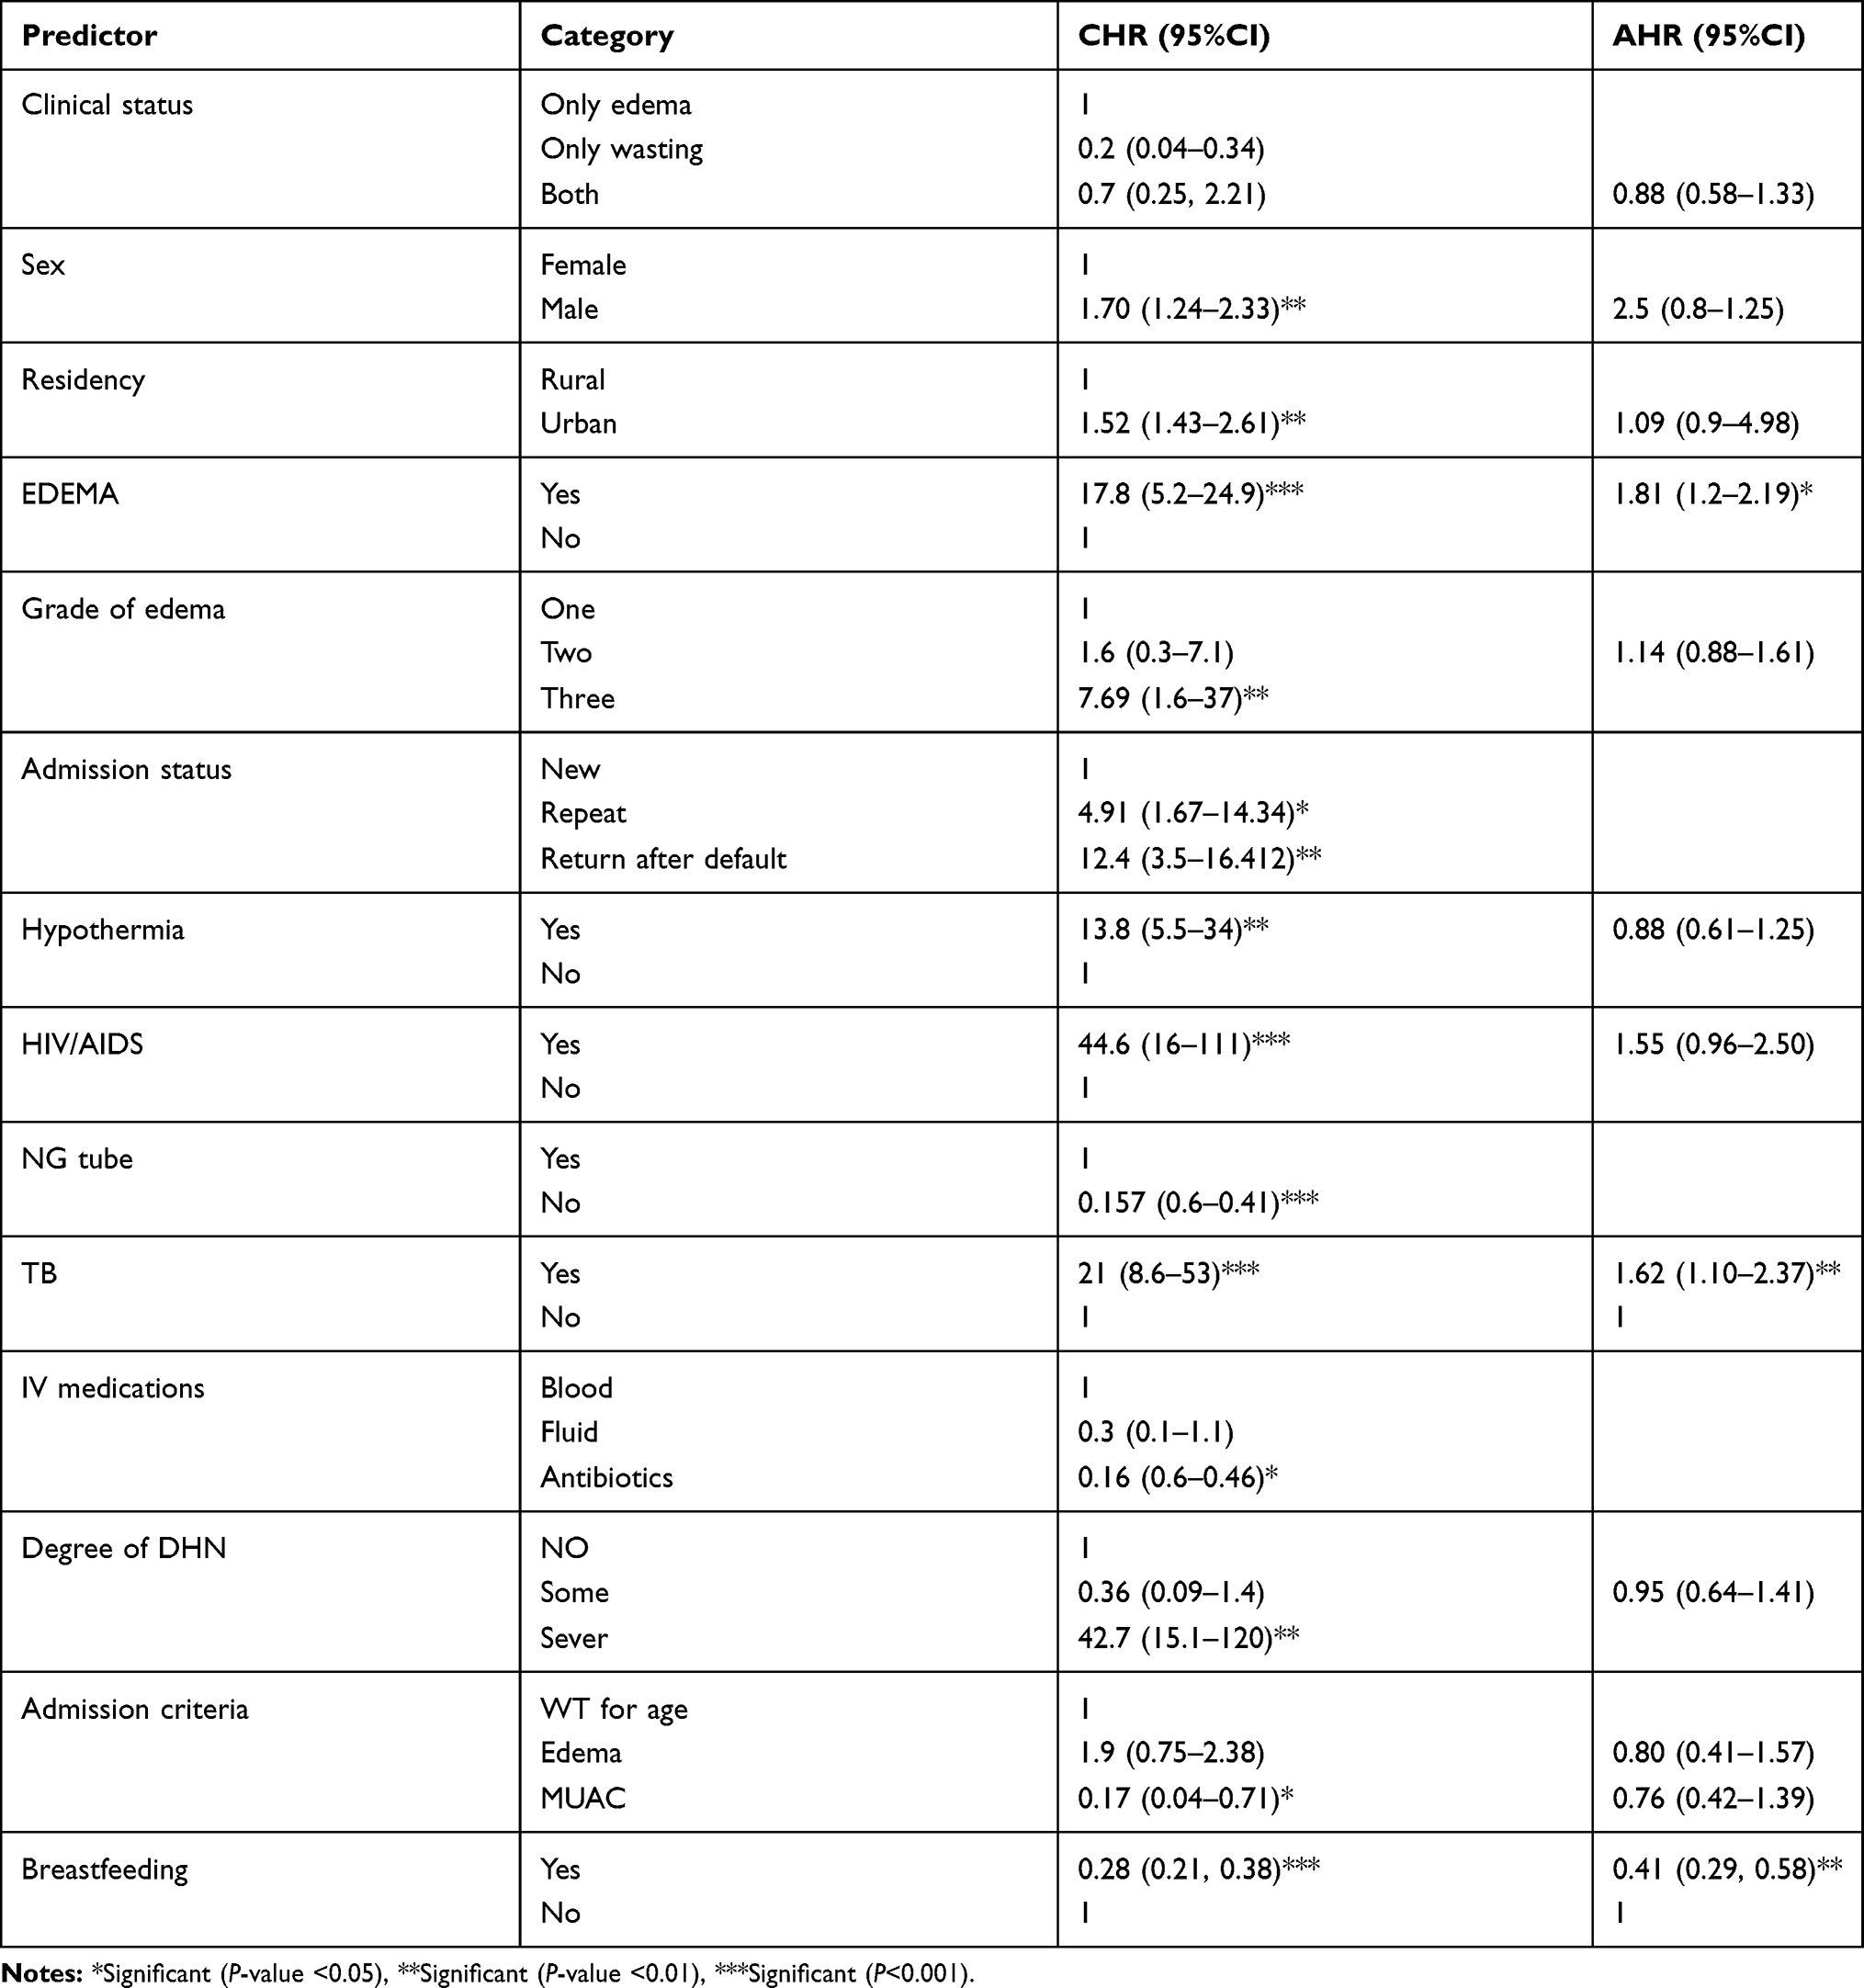 |
Table 5 Results of the Bivariable and Multivariable Cox Regression Analysis Among Children Aged 6–59 Months with Severe Acute Malnutrition Admitted to Stabilization Center in Selected Hospitals and Health Centers, 2019, Ethiopia |
Proportional Hazards Assumption
Testing the proportional hazard assumption is vital for interpretation and use of fitted proportional hazard models. Therefore, in this study goodness-of-fit (GOF), particularly the Schoenfeld residuals proportional hazard assumption test for the individual covariates and global tests was used (Table 6). We observed that each covariate had a P-value >0.05 and all of covariates simultaneously (global for Cox proportional hazard P-value=0.40 >0.05) met the proportional hazard assumption.
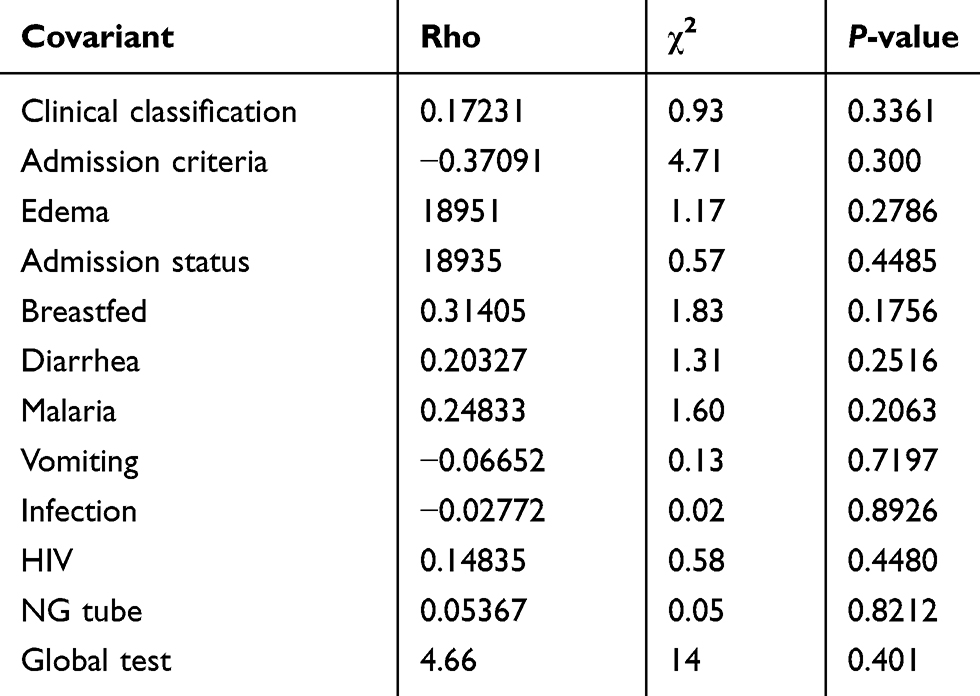 |
Table 6 Schoenfeld Residuals Test Result |
Discussion
This study aimed to assess the time to death and its predictors among children underfive with severe acute malnutrition admitted to a stabilization center of selected health centers and hospitals. This study found that the overall mean survival time was 36 (95%CI: 34.3– 37.7) days.
In this study, the presence of edema, breastfeeding, place of admission and having sepsis have been found strong predictors of mortality in the multivariable analysis.
The cumulative probability of survival at the end of 1 and 3 days, 13, and 39 days was 99%, 99.6% and 90%, respectively with the overall mean stay of 36 days (95%CI: 34.3–37.7). This is in line with previous studies in Tigray and Mekele in which the survival at hospital SCs ranged from 19.5 to 77 days.17 This is due to the fact that improved treatment and care in the SC center practically shortens the average length of stay of the children in hospital. Furthermore, this study revealed that 20 (5.8%) of children died during the period of follow-up. This is consistent with findings from different parts of Ethiopia (Woldia hospital, Northwest, Felgehiwote, Jimma University Specialized Hospital (JUSH), Kenya, Wolega and Raya Alamata) and minimum SPHERE standard of 10% of mortality.5,8,12,13,18-21 However, the finding of this study was lower than studies in Sekota 20% and Uganda 24%.18,22 The possible explanation could be attributed to lower defaulter rate in the current study compared to the previous studies.
Adjusting for other variables, children with SAM who had TB were 1.62 times more likely to die compared to those who did not have TB. This was in agreement with the finding of a study conducted in Jimma University Specialized Hospital, Wolaita, and Tigray.18 The hazard rate of death among children with edema at admission was 1.81 times higher as compared to children with no edema at admission. This is in line with a study conducted in Jimma University Specialized Hospital.7,12,23,24 This could be explained by the fact that management of children with SAM will be difficult and complicated when admitted with comorbid illnesses. Children who develop sepsis at admission were 1.62 times at risk of earlier death compared with children who did not have sepsis at admission. This is in line with previous studies done in Ethiopia, Sekota, Wolaita, Uganda, and Kenya.9,12,19,25 This could be due to the fact that severely malnourished children are more prone to infections due to the immunosuppressive effect of malnutrition and the loss of the protective mucosal barrier in the gastrointestinal tract.9,24
In addition, this study showed that those children who had been admitted at hospitals were at higher risk of death than those who had been admitted at health centers. This is supported by previous study in Gondar. The difference in death rate among institutions could be attributed to the level of illness of the patients admitted to the institution in which hospital admissions are usually from health center referral due to severe complications. Children who were fed breast milk at admission had been found less likely to die from SAM than those children who were not breastfed at admission (AHR: 0.41). This could be due to the fact that breast milk consists of immunologic and antibacterial factors that provide protection against various diseases. This is in line with a study in Tigray.2
Limitation of the Study
The study determined the mean survival time and death among children with SAM. This study did not include controls for comparison, which is a limitation.
Conclusion
The overall mean survival time and death was in line with the minimum SPHERE standard. The main predictors of death for severely malnourished children were, having edema, sepsis, hospital admission and breastfeeding status at admission. Sound diagnosis and close follow-up should be given to patients with complications (sepsis, tuberculosis, edema) in SCs according to the national protocol.
Abbreviations
MUAC, mid upper arm circumference; SAM, severe acute malnutrition, SC, stabilization center.
Data Sharing Statement
Data will be available upon request from the corresponding author.
Ethics Approval and Consent to Participate
This study was conducted in accordance with the Declaration of Helsinki. Ethical clearance was obtained from the Institutional Review Board of the School of Graduate Studies, College of Health Science, Wollo University. Following this, the study setting (SC clinic) was informed about the objectives. Written consent was obtained from each participant (from their parent or guardian before the start of interview) and participant’s anonymity and confidentiality were kept. Privacy and confidentiality was also assured. After obtaining informed consent (written) data were collected.
Acknowledgments
The authors would like to express their appreciation to Wollo University for funding this research project. They would like to extend their deepest gratitude to all study participants and data collectors for their willingness and cooperation in this study.
Author Contributions
All authors made substantial contributions to conception and design, acquisition of data, or analysis and interpretation of data; took part in drafting the article or revising it critically for important intellectual content; gave final approval of the version to be published; and agree to be accountable for all aspects of the work.
Disclosure
The authors report no conflicts of interest in this work.
References
1. Degefie AAAFDSAGUDT, Sirak S-UDTGJUDMHAD, (SC-US). Hwadht, Unicef. Protocol for the Management of Severe Acute Malnutrition; 2007.
2. Abeje AT, Gudayu TW, Malefia YD, Befftu BB. Analysis of hospital records on treatment outcome of severe acute malnutrition: the case of Gondar University Tertiary Hospital. Pediatr Ther. 2016;6(2):1–5.
3. Shanka NA, Lemma S, Abyu DM. Recovery rate and determinants in treatment of children with severe acute malnutrition using outpatient therapeutic feeding program in Kamba District, South West Ethiopia. J Nutr Disorders Ther. 2015;5:155. doi:10.4172/2161-0509.1000155
4. Girma M, Tirore TM. Survival status and factors associated with treatment outcome of severely malnourished children admitted to Ayder referral hospital: a cross-sectional study. BMC Nutr. 2017;3(1):1–9.
5. Bachou H, Tumwine JK, Mwadime RK, Tylleskär T. Risk factors in hospital deaths in severely malnourished children in Kampala, Uganda. BMC Pediatr. 2006;6(1):7.
6. Ethiopia, Ministry of Health E. Success factors for women’s and children’s health. Available from: http://www.who.int/pmnch/successfactors/en/.
7. Jarso H, Workicho A. Survival status and predictors of mortality in severely malnourished children admitted to Jimma University Specialized Hospital from 2010 to 2012, Jimma, Ethiopia: a retrospective longitudinal study. BMC Pediatr. 2015;15:76.
8. Desyibelew HD, Fekadu A, Woldie H. Recovery rate and associated factors of children age 6 to 59 months admitted with severe acute malnutrition at inpatient unit of Bahir Dar FelegeHiwot Referral hospital therapeutic feeding unite, northwest Ethiopia. PLoS One. 2007;12:e0171020. doi:10.1371/journal.pone.0171020
9. Maitland K, Berkley JA, Shebbe M, Peshu N, English M. Children with severe malnutrition: can those c the WHO protocol? PLoS Med. 2006;3(12):e500.
10. Estimates UWWBGJCM. Levels and Trends in Child Malnutrition.
11. Unicef. Malnutrition. New York, NY: Unicef; 2020.Available from: https://data.unicef.org/topic/nutrition/malnutrition/.
12. Oumer A, Mesfin F, Demena M. Survival status and predictors of mortality among children aged 0–59 months with severe acute malnutrition admitted to stabilization Center at Sekota Hospital Waghemra Zone. East Afr J Health Biomed Sci. 2016;1(1):13–22.
13. Mena MB, Billoro BB. Treatment outcome of severe acute malnutrition and its determinants among pediatric patients in West Ethiopia. Int J Pediatr. 2018;2018:1–7. doi:10.1155/2018/8686501
14. Munthali T, Jacobs C, Sitali L, Dambe R, Michelo C. Mortality and morbidity patterns in under-five children with severe acute malnutrition (SAM) in Zambia: a five-year retrospective review of hospital-based records (2009–2013). Arch Public Health. 2015;73(1):23. doi:10.1186/s13690-015-0072-1
15. Girum T, Muktar E, Worku A. Comparative analysis of the survival status and treatment outcome of under-five children admitted with severe acute malnutrition among hospital-based and health center based stabilization centers, South Ethiopia. Open Public Health J. 2018;11:209–220. doi:10.2174/1874944501811010209
16. Teferi E, Lera M, Sita S, Bogale Z, Datiko DG, Yassin MA. Treatment outcome of children with severe acute malnutrition admitted to therapeutic feeding centers in Southern Region of Ethiopia. Brief Commun. 2013.
17. Yohannes T, Laelago T, Ayele M, Tamrat T. Mortality and morbidity trends and predictors of mortality in under-five children with severe acute malnutrition in Hadiya zone, South Ethiopia: a four-year retrospective review of hospital-based records (2012–2015). BMC Nutr. 2017;3(1):18. doi:10.1186/s40795-017-0135-5
18. Chane T, Oljira L, Atomesa GE, Agedew E. Treatment outcome and associated factors among under-five children with severe acute malnutrition admitted to therapeutic feeding unit in Woldia Hospital, North Ethiopia. J Nutr Food Sci. 2014;4:329. doi:10.4172/2155-9600.1000329
19. Gebremichael DY. Predictors of nutritional recovery time and survival status among children with severe acute malnutrition who have been managed in therapeutic feeding centers, Southern Ethiopia: retrospective cohort study. BMC Public Health. 2015;15:1267. doi:10.1186/s12889-015-2593-5
20. Degebasa Z, Marama T, Addisu A. Magnitude and treatment outcome of severe acute malnutrition of 6–59 months children in Raya Alamata Woreda, Tigray Region, Ethiopia from 2011–2015. Science. 2017;5:30–37.
21. Worku AE. Determinant of Severe Acute Malnutrition among Children Aged 6–59 Months in Konso, Southern Ethiopia: Case Control Study. Insight Medical Publishing Group; 2016.
22. Awoke A. Determinants of severe acute malnutrition among under five children in rural EnebsieSarmidr District, East Gojjam Zone, North West Ethiopia, 2016. BMC Nutr. 2018;4(1):4.
23. Bekele AK. Factors Associated with Treatment Outcomes of Under-five Children with Severe Acute Malnutrition Admitted to Therapeutic Feeding Unit of Yirgalem Hospital. OMICS Int. 2017.
24. Gebremichael M, Bezabih A, Tsadik M. Treatment Outcomes and Associated Risk Factors of Severely Malnourished under Five Children Admitted to Therapeutic Feeding Centers of Mekelle City, Northern Ethiopia. OALibJ. 2014;1(4):1–9. doi:10.4236/oalib.1100446
25. Bekele AK. Factors associated with treatment outcomes of under-five children with severe acute malnutrition admitted to therapeutic feeding unit of Yirgalem Hospital. OMICS Int. 2018.
 © 2020 The Author(s). This work is published and licensed by Dove Medical Press Limited. The full terms of this license are available at https://www.dovepress.com/terms.php and incorporate the Creative Commons Attribution - Non Commercial (unported, v3.0) License.
By accessing the work you hereby accept the Terms. Non-commercial uses of the work are permitted without any further permission from Dove Medical Press Limited, provided the work is properly attributed. For permission for commercial use of this work, please see paragraphs 4.2 and 5 of our Terms.
© 2020 The Author(s). This work is published and licensed by Dove Medical Press Limited. The full terms of this license are available at https://www.dovepress.com/terms.php and incorporate the Creative Commons Attribution - Non Commercial (unported, v3.0) License.
By accessing the work you hereby accept the Terms. Non-commercial uses of the work are permitted without any further permission from Dove Medical Press Limited, provided the work is properly attributed. For permission for commercial use of this work, please see paragraphs 4.2 and 5 of our Terms.