")
Back to Journals » International Journal of Nanomedicine » Volume 11
Time-dependent toxicity of cadmium telluride quantum dots on liver and kidneys in mice: histopathological changes with elevated free cadmium ions and hydroxyl radicals
Authors Wang M, Wang J, Sun H, Han S, Feng S, Shi L, Meng P, Li J, Huang P , Sun Z
Received 2 January 2016
Accepted for publication 8 March 2016
Published 25 May 2016 Volume 2016:11 Pages 2319—2328
DOI https://doi.org/10.2147/IJN.S103489
Checked for plagiarism Yes
Review by Single anonymous peer review
Peer reviewer comments 2
Editor who approved publication: Professor Lei Yang
Mengmeng Wang,1,2,* Jilong Wang,1,2,* Hubo Sun,1,2 Sihai Han,3 Shuai Feng,1 Lu Shi,1 Peijun Meng,1,2 Jiayi Li,1,2 Peili Huang,1,2 Zhiwei Sun1,2
1Department of Toxicology and Sanitary Chemistry, School of Public Health, Capital Medical University, 2Beijing Key Laboratory of Environmental Toxicology, Capital Medical University, Beijing, 3College of Food and Bioengineering, Henan University of Science and Technology, Luoyang, People’s Republic of China
*These authors contributed equally to this work
Abstract: A complete understanding of the toxicological behavior of quantum dots (QDs) in vivo is of great importance and a prerequisite for their application in humans. In contrast with the numerous cytotoxicity studies investigating QDs, only a few in vivo studies of QDs have been reported, and the issue remains controversial. Our study aimed to understand QD-mediated toxicity across different time points and to explore the roles of free cadmium ions (Cd2+) and hydroxyl radicals (·OH) in tissue damage. Male ICR mice were administered a single intravenous dose (1.5 µmol/kg) of CdTe QDs, and liver and kidney function and morphology were subsequently examined at 1, 7, 14, and 28 days. Furthermore, ·OH production in the tissue was quantified by trapping ·OH with salicylic acid (SA) as 2,3-dihydroxybenzoic acid (DHBA) and detecting it using a high-performance liquid chromatography fluorescence method. We used the induction of tissue metallothionein levels and 2,3-DHBA:SA ratios as markers for elevated Cd2+ from the degradation of QDs and ·OH generation in the tissue, respectively. Our experimental results revealed that the QD-induced histopathological changes were time-dependent with elevated Cd2+ and ·OH, and could recover after a period of time. The Cd2+ and ·OH exhibited delayed effects in terms of histopathological abnormalities. Histological assessments performed at multiple time points might facilitate the evaluation of the biological safety of QDs.
Keywords: quantum dot, cadmium ion, metallothionein, hydroxyl radical, toxicity
Introduction
The integration of emerging nanotechnology with a great diversity of nanosize materials has created tremendous excitement in biology and medicine. Quantum dots (QDs) composed of group II–VI or III–V elements are of great interest, due to their tunable optical properties, including high photoluminescence quantum yield, narrow and tunable emission spectra, and good photostability.1–3 Over the past decade, tremendous research efforts have been devoted to producing high-quality QDs by optimizing the synthetic procedures, functionalizing the QD surfaces to enhance biocompatibility, and coupling the QDs to agents with complementary functions (eg, targeting molecules or therapeutic agents), with an ultimate goal of using QDs in clinical applications.4,5 However, cadmium (Cd), which is known to induce toxicity in humans (including hepatic, renal, neurologic, and/or genetic toxicity),6,7 is the most abundant component of QDs. Therefore, a complete understanding of the toxicity of QDs is of great importance and a prerequisite for their application in humans.
In vitro models have been extensively used to study the cytotoxic effects of Cd-based QDs. These studies have shown that QDs undergo design-dependent intracellular localization and can cause cytotoxicity that can be ascribed to the following mechanisms: 1) the degradation of the QDs and consequent release of free Cd ions (Cd2+)8–10 and 2) the generation of reactive oxygen species (ROS), including superoxide anion (·O2−) and hydroxyl radicals (·OH).11–13 At high levels of oxidative stress, the antioxidant defense system is overwhelmed by the excessive ROS, which eventually leads to mitochondrial malfunction and ultimately cell death.14 However, in contrast to the sufficient number of QD-cytotoxicity studies, only a few in vivo studies have been reported,15,16 and the results of these studies are rather inconsistent, due to the wide variation in both and the types of QDs (in terms of size, shape, surface charge, and surface coverage) that have been tested and the animal models in which they have been tested. For example, King-Heiden et al and Truong et al studied QD toxicity in zebrafish and showed that the toxicity was influenced by the QD coating and surface ligands.17,18 Liu et al studied the toxicity of QDs in a mouse model and suggested that both acute and chronic QD exposure might cause significant impairment of the liver of mice, as reflected by morphological alterations to the hepatic lobules and increased oxidative stress.19
In contrast, Su et al performed a histological analysis of the organs of female BALB/c mice at 80 days postinjection and demonstrated that there was no overt toxicity from the QDs in mice.20 Additionally, Hauck et al observed no alterations in animal behavior, weight, or hematological markers relative to controls, and thus demonstrated that CdSe/ZnS QDs were not harmful to Sprague Dawley rats with either short- (<7 days) or long-term (>80 days) exposure.21 Furthermore, Ye et al studied male rhesus macaques and found that the standard hematological and biochemical markers used to investigate the potential toxicity of QDs in rhesus macaques were within normal ranges over 90 days of monitoring after an intravenous injection of 25 mg/kg of phospholipid micelle-encapsulated CdSe/CdS/ZnS QDs (0.81 mg of Cd per kg).22 No signs of inflammation or injury were observed, which indicated that the toxicity of QDs in vivo was minimal with appropriate formulations and doses.
Are QDs toxic? In terms of in vitro and in vivo studies, different dosing conditions provide one explanation for apparent discrepancies regarding toxicity. Under culture conditions, cells experience a constant QD dose. However, in vivo systems are extremely complicated, and the interactions of QDs with biological components, such as proteins and cells, might alter the concentration of the QDs. Therefore, an organ-specific dose might not be sufficiently high to induce detectable toxicity. For in vivo studies, regardless of the wide variation in the types and doses of QDs, we suggest that another possible problem is related to the time points of histological and biochemical analyses. If histological changes recovered over time, it would be difficult to observe the QD-induced histopathological abnormalities at the later and final time points. The aim of this study was thus to understand the toxic effects of QDs in vivo across a range of time points and to explore the biological effects of QD-derived free Cd2+ and ·OH generation.
In both previous and current studies, we and others have demonstrated that the liver and kidneys appear to be the major organs of QD deposition after intravenous administration; it has also been found that the liver and kidneys are the major accumulation sites for QDs in the circulation.20,23,24 In the present study, we examined histological changes in the liver and kidneys of mice at 1, 7, 14, and 28 days after CdTe QD exposure. Furthermore, we used the tissue metallothionein (MT) level as a marker of elevated Cd2+ in the tissue and examined the ·OH levels in the liver and kidneys at the same four time points using a high-performance liquid chromatography (HPLC) fluorescence-detection method.25
Materials and methods
Characteristics of the CdTe QDs
Thioglycolic acid-stabilized CdTe QDs were prepared by Nanjing University. Prior to use in our experiments, the CdTe QD stock solutions were centrifuged at 650 g for 15 minutes at room temperature to remove large aggregates. The supernatants were then dialyzed for 4 hours through a 10 kDa cellulose membrane (Sigma-Aldrich, St Louis, MO, USA) against a 0.1% solution of thioglycolate (sodium salt; Sigma-Aldrich) at pH 8.3 to remove any free Cd, Te, and other small molecules from the solutions.23 The stock solutions were then further dialyzed for 2 hours against distilled water (pH 8.3) to remove the unbound thioglycolate. The size distributions and surface characteristics of the CdTe QDs were analyzed using transmission electron microscopy (JEM-1400; JEOL, Tokyo, Japan). Moreover, their fluorescence spectra, peak wavelengths, and fluorescence intensities were measured using a fluorescence spectrometer (RF-5301; Shimadzu, Kyoto, Japan). The concentrations of Cd in the stock solutions were quantitatively measured using inductively coupled plasma (ICP) mass spectrometry (7500ce; Agilent Technologies, Santa Clara, CA, USA).23 Prior to being injected into the mice, the CdTe QD solutions were freshly dissolved in phosphate-buffered saline (PBS) (pH 7.4) and sonicated for 5 minutes to disperse the CdTe QD particles evenly throughout the solutions. The final concentrations of the solutions were adjusted to 5 μmol/mL (calculated based on the molar mass of the Cd).
Animals
Healthy male ICR mice (six weeks old) were purchased from Beijing (Military Medical Science Academy of the People’s Liberation Army). The mice were housed in a ventilated, temperature-controlled, and standardized sterile animal room with a 12-hour day/night cycle at China Capital Medical University. The mice were allowed to acclimate to the animal room for 7 days prior to experimentation. All procedures used in this study were performed in accordance with animal-welfare protocols that had been approved by the Capital Medical University Animal Care and Use Committee (2011-X-072).
Animal treatment
Mice weighing between 32.1 and 33.6 g were administered the CdTe QD solutions via tail-vein injections of 1.5 μmol/kg (dose calculated based on the molar mass of Cd).24 The mice in the control group were injected with an equivalent volume of normal saline. Preliminary observations of food intake, fur, behavior, mental status, urine, and feces were conducted daily for each mouse. At the predetermined time points (1, 7, 14, and 28 days), six mice from each exposed group were anesthetized using isoflurane. Retro-orbital blood was collected into Eppendorf tubes containing heparin (10 μL, 500 IU/mL) for hematology and blood biochemistry, and these samples were analyzed immediately. The mice were then killed by cervical dislocation, and the liver and kidneys were collected. Some pieces were immediately fixed in 4% formaldehyde (Jiancheng Bioengineering Institute, Nanjing, People’s Republic of China) for the subsequent evaluation of histopathological alterations and immunohistochemical analyses. Other tissues samples were stored at −80°C for measurements of MT levels in the homogenates of the tissues. For free ·OH detection, the mice were injected with sodium salicylate (8 mg/kg, freshly prepared; Sigma-Aldrich) via the tail vein 30 minutes prior to tissue collection. Sets of control mice were also killed at the predetermined times (1, 7, 14, and 28 days) in strict accordance with the procedures used for the exposed mice.
Immunohistochemistry and histopathology assays
Formalin-fixed tissues (n=6) were embedded in paraffin and sliced into 5.0 μm sections. For the evaluation of the histopathological alterations, the sections were stained with hematoxylin and eosin. The stained sections were examined for necrosis, apoptosis, inflammation, and vascular changes in the liver and renal tissues. These sections were examined using a light microscope (BX51; Olympus, Tokyo, Japan), and the histopathological features of the different groups were compared. For the immunohistochemical staining for MT, a horseradish peroxidase (HRP)/diaminobenzidine-detection immunohistochemistry kit (ab80436; Abcam, Cambridge, UK) was used according to the manufacturer’s protocol. The formalin-fixed paraffin-embedded tissue sections were rehydrated. After antigen retrieval (1 g/L in PBS, pH 7.8; Sigma-Aldrich) for 30 minutes in a domestic pressure cooker and blocking of the nonspecific binding sites with a protein-blocking solution, the sections were incubated with an anti-MT antibody (1:100 dilution of monoclonal mouse IgG1, ab12228; Abcam) overnight at 4°C. For the negative controls, the sections were immersed in PBS instead of the specific antibody. Next, a mouse-specific HRP conjugate was applied, and the sections were incubated for 15 minutes at room temperature. Diaminobenzidine was applied to the tissue sections, which were then counterstained with hematoxylin.26 Then, the slides were rinsed in water and mounted with cover slips for microscopic examination (Olympus IX-70).
Levels of MT
Saline volumes of nine times the masses of the liver and kidney samples were added to each tube. The tissues were cut up as rapidly as possible in an ice bath and poured into the tubes for homogenization using a FastPrep-24 at speed 6 for 40 seconds (MP Biomedicals, Santa Ana, CA, USA). The 10% homogenates were centrifuged (4°C, 600 g, 10 minutes; Eppendorf), and the supernatants were collected. The levels of MT were measured in the homogenates of the tissues using a competitive double-antibody enzyme-linked immunosorbent assay (ELISA) kit (Wuhan Bioengineering Institute, Wuhan, People’s Republic of China) according to the manufacturer’s protocol.27 In brief, 30 μL of a standard MT solution diluted from 0.5 to 500 ng/mL with PBS-T (PBS with 0.02% Tween 20) or the supernatant and 50 μL of MT antibody (primary antibody) were added to each well of an MT-coated microtiter plate. PBS-T was used as the blank for the reaction. The plate was incubated for 1 hour at 4°C. After incubation, the wells were washed three times with washing buffer (PBS with 0.01% Tween 20), and 100 μL of HRP-conjugated goat antirabbit IgG antibody was added per well. After the incubation, the supernatant was removed, the plate washed three times with 350 μL of PBS per well, and 100 μL of the color substrate 3,3′,5,5′-tetramethylbenzidine (TMB) added and allowed to react for 10 minutes for color development. After the reaction was stopped with 50 μL of 2 mol/L sulfuric acid, the absorbance was read at 450 nm.28
·OH trapping and HPLC measurement
Salicylic acid (SA), 2,3-dihydroxybenzoic acid (DHBA), and 2,5-DHBA were assayed according to the method reported by Yamamoto et al and Tsai et al, with some modifications.29,30 A mixed standard solution of SA, 2,3-DHBA, and 2,5-DHBA was diluted with acetate. The diluted solution was then filtered through a 0.22 μm membrane, and 10-μL samples were assayed using an HPLC system with a G1310A pump (Agilent Technologies) and a G1321A fluorescence detector (Agilent Technologies). Reverse-phase HPLC analyses were performed using an Eclipse Plus C18 column (100×4.6 mm, 3.5 μm; Agilent Technologies). The column temperature was room temperature, the excitation wavelength was 310 nm, and the emission wavelength was 440 nm. The mobile phase consisted of acetonitrile:30 mmol/L acetate, pH 4.75 (v:v; 30:70), and the flow rate was 0.7 mL/min. For the determination of 2,3-DHBA, 2,5-DHBA, and SA in the liver and kidney tissues, ~0.5 g of liver (wet weight) and ~0.3 g of kidney tissue from each mouse were rinsed with ice-cold, sterile saline to remove any remaining traces of blood, and were then homogenized with 3× volume:weight of ice-cold 10% (v:v) perchloric acid containing 1 mmol/L ethylenediaminetetraacetic acid–2Na and 100 μmol/L sodium pyrosulfite. These homogenates were centrifuged at 9,000 g for 10 minutes at 4°C. The resulting 500 μL supernatants were extracted and analyzed as described earlier. Moreover, blank homogenate samples of the liver and kidneys from the mice that were not treated with salicylate were assayed.
Statistical analyses
Data are expressed as mean ± standard deviation. The statistical analyses were performed using two-way analysis of variance, and Student’s t-test was performed to make multiple comparisons among the different groups. Differences between groups with P-values ≤0.05 were considered significant.
Results
Characteristics of CdTe QDs
Transmission electron microscopy was used to evaluate the shape and morphology of the CdTe QDs used in this study (Figure 1A). In addition, the analysis using the nanoparticle-size analyzer suggested that the diameter of the CdTe QDs was ~3–4 nm. The evaluation of the fluorescence spectrum indicated that the maximal emission was at 620 nm following excitation at 490 nm (Figure 1B). The concentration of the CdTe QD stock solution was 5 μmol/mL (calculated based on the molar mass of the Cd).
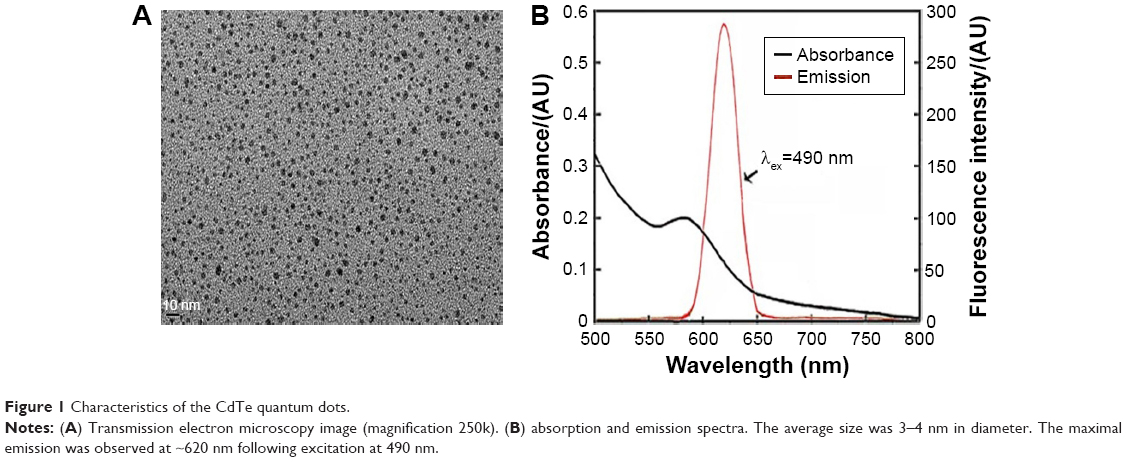 | Figure 1 Characteristics of the CdTe quantum dots. |
Hematology and clinical chemistry assay
The hematological and clinical chemistry parameters are shown in Table 1. All of the hematological parameters obtained from the treated mice exhibited trends that were similar to those of the controls, with the exceptions of white blood cell (WBC), granulocyte (Grn), and lymphocyte (Lym) counts. Significant increases in WBC, Lym, and Grn concentrations were observed over the entire period, reaching maxima at 7 or 14 days and then decreasing by 28 days. With respect to the liver and kidney function markers, ALT, AST, and creatinine values increased slightly over time, but the differences did not reach statistical significance. Additionally, no abnormalities in eating, drinking, breathing, autonomic movements, behavior, or responses to various stimuli were observed. All of the animals survived until the end of the experimental period.
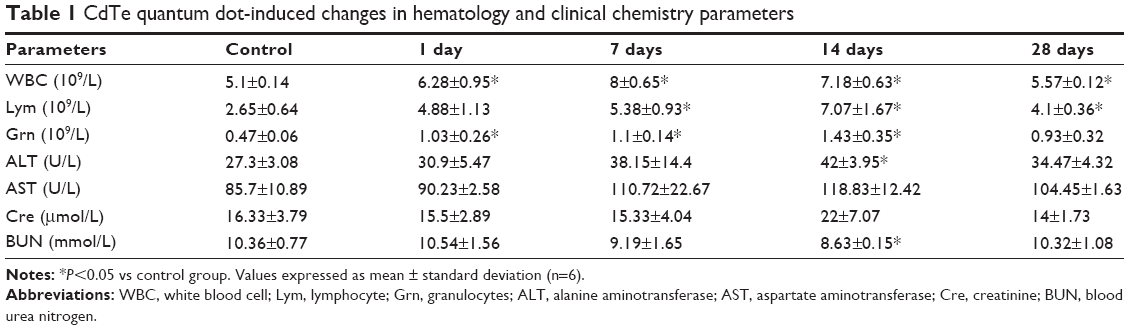 | Table 1 CdTe quantum dot-induced changes in hematology and clinical chemistry parameters |
Histopathology assays and immunohistochemistry
The liver and kidney tissues from the control group exhibited normal histological structures (Figure 2A and H). The liver cells formed wheel-shaped arrays along the central veins with well-arranged liver cell cords, normal hepatic sinusoids, and large, round, central nuclei with no inflammatory cell infiltration or necrosis. The kidney cells exhibited normal forms with clear glomerular and renal tubular structures, little cell proliferation, a narrow mesangial area, and open capillaries that were full of red blood cells. No abnormal pathological findings were observed. After exposure to the CdTe QDs, the mice in the experimental groups exhibited significant changes in liver (Figure 2B–D) and kidney (Figure 2I–K) tissue morphology, and the changes gradually increased over time. The forms of the cells around the central vein in the hepatic lobules were more normal than those in the rim, where the cells exhibited hydropic degeneration. At 14 days, severe diffuse hydropic degeneration accompanied by a ballooning degeneration was observed (Figure 2D). At 28 days, the liver sections exhibited binucleate regenerating liver cells, slight degrees of sinusoidal dilation, and less inflammatory cell infiltration around the central veins (Figure 2E). The kidney cells exhibited obvious renal tubular disorders with different degrees of edema and hyperemia. At 14 days, severe tubular and serious cloudy swelling led to cellular rupture along with renal tubule disruption (Figure 2K). At 28 days, the kidney sections exhibited regeneration and a moderately restored state with a slight infiltration of interstitial inflammatory cells (Figure 2L). In brief, the histopathological changes progressed from mild, to moderate, to severe, to moderate, indicating that these histopathological abnormalities are reversible.
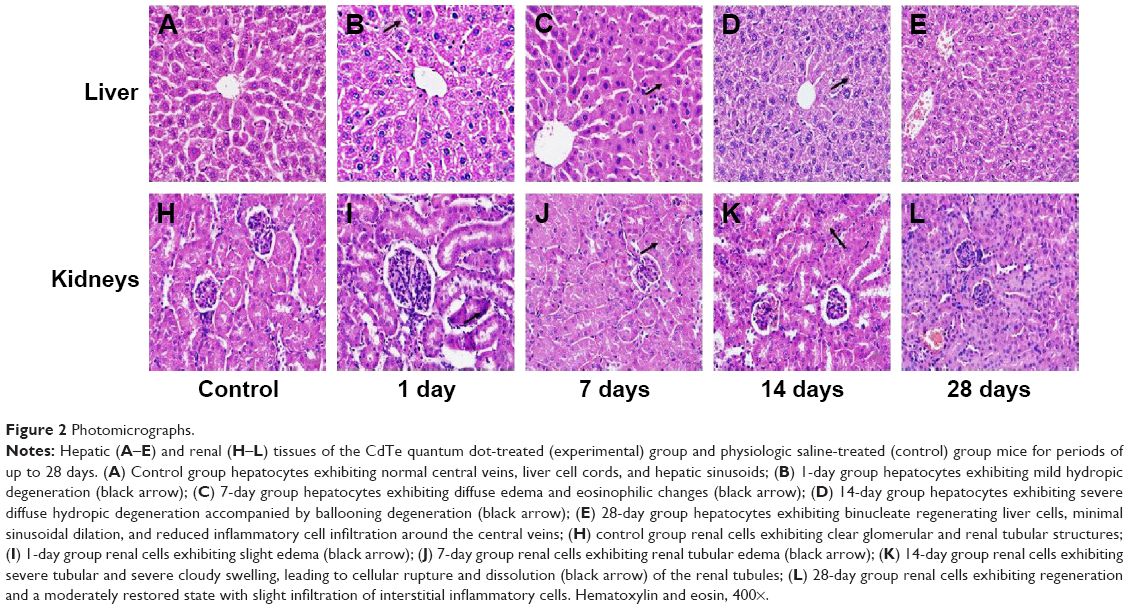 | Figure 2 Photomicrographs. |
Time-course study of MT-level changes
The results of the MT ELISA analyses of the liver and kidneys of the mice exposed to CdTe QDs are shown in Figure 3. The elevations in MT expression in the QD-treated mice persisted through 28 days. Notably, at 1 day, the MT levels reached their peak values of 6.98 and 21.27 ng/g in the liver and kidneys, respectively, which were 2.5-fold and 2.1-fold greater than the levels observed in the liver and kidneys of the controls. With regard to the liver, from day 7 to 28, the MT levels did not vary significantly (4.07–4.92 ng/g); however, in the kidneys, the high level of renal MT was maintained for the first 21 days (17.85–21.27 ng/g) after the CdTe QD treatment. Thereafter, the renal concentrations of MT decreased, and the values dropped to 12.32 ng/g. The elevated MT expression was further confirmed by the positive and strong MT immunostaining in many hepatocytes and in the epithelial cells of the proximal convoluted tubules at 1 day after CdTe QD exposure (Figure 4).
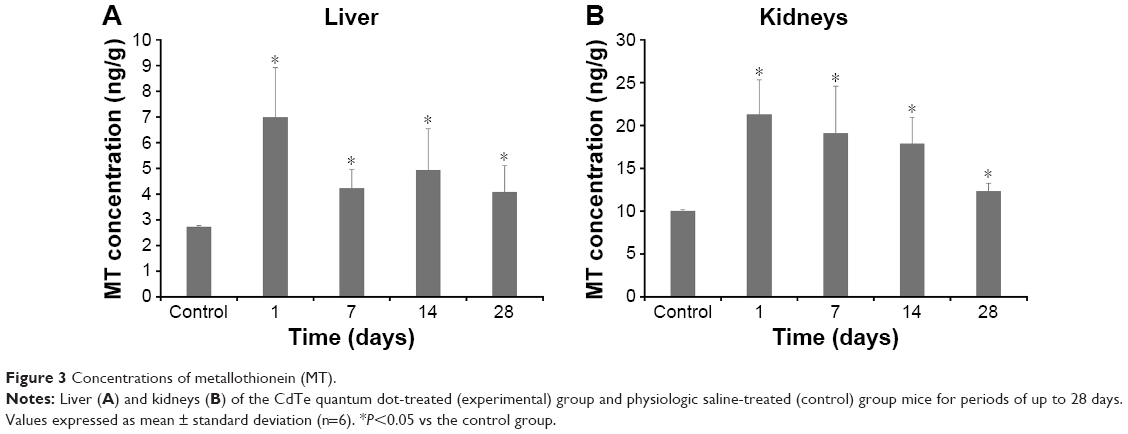 | Figure 3 Concentrations of metallothionein (MT). |
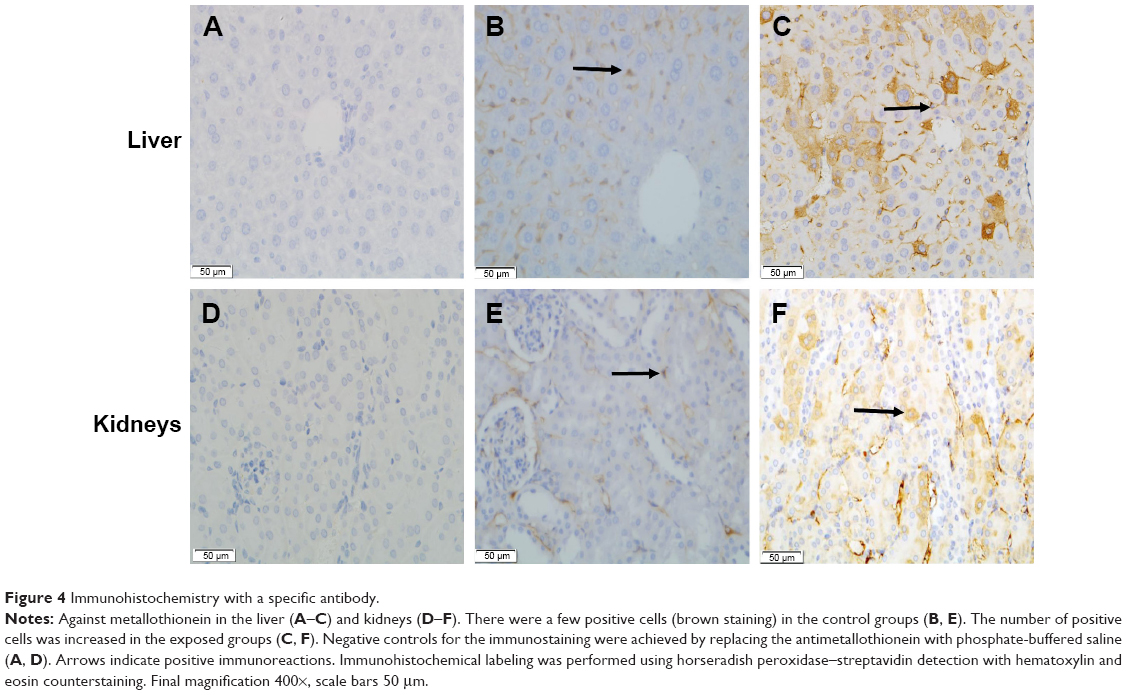 | Figure 4 Immunohistochemistry with a specific antibody. |
Time-course study of ·OH-level changes
Figure 5 shows typical chromatograms of standard solutions of 2,3-DHBA, 2,5-DHBA, and SA (Figure 5A), as well as chromatograms of homogenates of mouse liver (Figure 5B and D) and kidneys (Figure 5C and E) before and after SA injection. The 2,3-DHBA and 2,5-DHBA were well separated, with the following retention times: 2,3-DHBA, 6.1 minutes; and 2,5-DHBA, 7.7 minutes. No interfering peaks were observed in the blank homogenate samples (Figure 5B and C). Because the level of 2,3-DHBA depends on the level of SA, to reduce the interanimal variabilities in SA distribution and metabolism, we present the concentrations of 2,3-DHBA as the 2,3-DHBA:SA ratios to reduce the individual differences among mice.29 Figure 6 summarizes the 2,3-DHBA:SA ratios in the liver (Figure 6A) and kidneys (Figure 6B) during the 28-day period. At 1 day postinjection, the 2,3-DHBA:SA ratios in both the liver and kidneys (P<0.05) were significantly elevated compared with those in the control mice. At 7 days, the 2,3-DHBA:SA ratios reached their peak values and then significantly decreased from 14 to 28 days. The 2,3-DHBA:SA ratios in the kidneys were also significantly higher than those in the liver were at the same time points, which indicates that the generation of ·OH in the kidneys was higher than that in the liver.
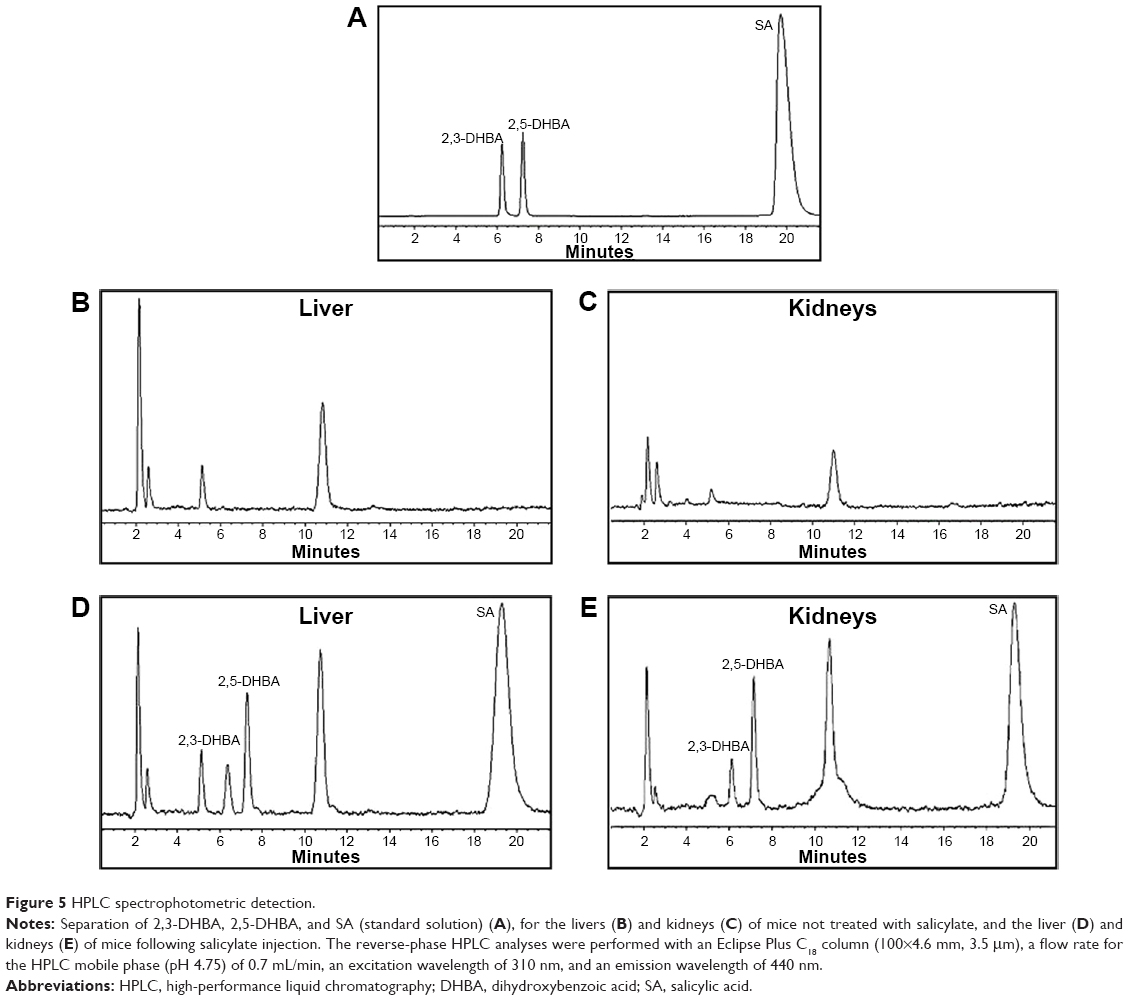 | Figure 5 HPLC spectrophotometric detection. |
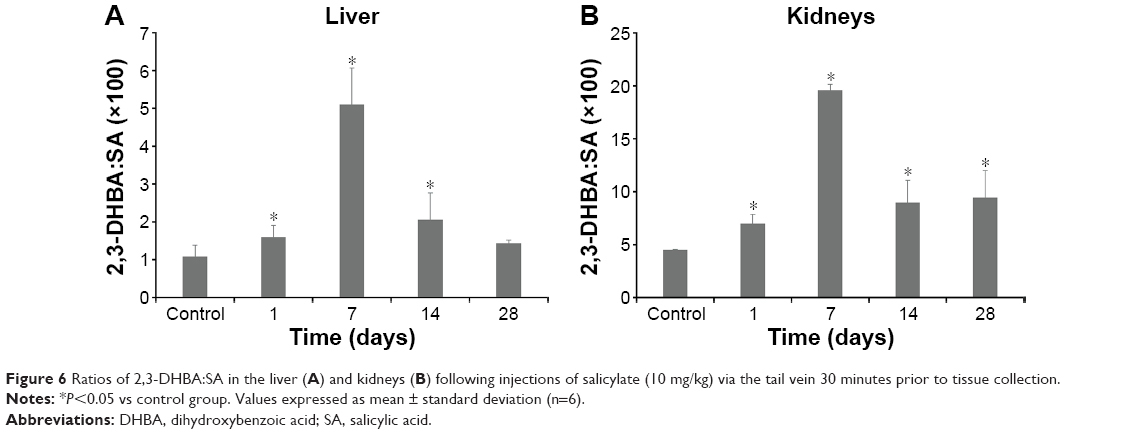 | Figure 6 Ratios of 2,3-DHBA:SA in the liver (A) and kidneys (B) following injections of salicylate (10 mg/kg) via the tail vein 30 minutes prior to tissue collection. |
Discussion
The data reported in this paper demonstrated that QD-induced tissue damage is time-dependent and reversible. Our conclusion is based on the evidence of the histological and biochemical analyses at different time points (1, 7, 14, and 28 days). Significant increases in WBC, Lym, and Grn concentrations were observed over the entire period, reaching maxima at 7 or 14 days and then decreasing by 28 days. During the same time periods, histopathological changes progressed from mild, to moderate, to severe, to moderate. Numerous cell studies exist regarding the toxic mechanisms of QDs through Cd2+ derived from QD degradation and ROS. However, there is little direct evidence that degradation of QDs and generation of ROS are associated with QD-induced tissue damage. Therefore, in the present study, we determined the degradation of the QDs and generation of ROS in tissues at different time points to explore the relationships of QD degradation and ROS generation with the toxicity of QDs in vivo.
In both previous and current studies, we and others have demonstrated that QDs can degrade in vivo.23–25 When QDs degrade (ie, surface atoms are lost and QDs decrease in size), blue shifts in the fluorescence-excitation spectra and decreases in the quantum yield are observed.31 However, using fluorescence intensity to quantify QDs in tissues has been deemed to be problematic, due to the high and variable background fluorescence that results from the tissues. Other evidence for QD degradation is the release of Cd2+. ICP atomic emission spectrometry and ICP mass spectrometry are highly sensitive methods that can be used to detect most elements. However, these analytical methods both detect different forms of Cd and cannot distinguish free Cd2+ or the bound “Cd complex” of the QDs; therefore, these methods cannot determine whether the QDs are degraded or the degree of degradation of the QDs in vivo.
MT is a family of ubiquitous, nonenzymatic proteins characterized as having low molecular weight and being cysteine-rich and heat-stable. Numerous studies exist regarding the induction of MT by Cd. In recent years, it has been demonstrated that the concentration of MT increases with the progressive accumulation of Cd in tissues. MT may serve as a very sensitive biomarker when an animal is exposed to Cd stress.32 Furthermore, Lin et al reported that only free Cd2+ dissociated from QDs, not QDs themselves, could induce MT production in tissues.25 Therefore, an elevation in MT expression can be used as a good biological index of QD degradation in vivo. To reduce the effects of other metals on MT expression, CdTe QDs were selected in the present study rather than core–shell-structured CdTe/ZnS QDs. Our results showed that MT increased significantly in the liver and kidney tissues at the predetermined time points (1, 7, 14, and 28 days). These results confirmed that QDs were indeed degraded in vivo.23,25
ROS can damage important biomolecules and subsequently inflict harmful effects on an organism. The three major types of ROS are ·O2−, H2O2, and ·OH, a highly reactive species that can modify purine and pyrimidine bases and cause strand breaks that result in DNA damage.33 In previous studies of nanoparticle-mediated oxidative stress, ROS production has typically been deduced based on changes in antioxidant systems, eg, enzyme activities and lipid-peroxidation levels. There is still relatively little direct evidence available demonstrating ROS generation.
SA has been used as a trapping agent for the detection of ·OH in vivo.30,34,35 The attacks of ·OH on SA produce 2,3-DHBA, 2,5-DHBA, and catechol due to decarboxylation. 2,5-DHBA can be produced by enzymatic pathways through the cytochrome P450s.36 In contrast, 2,3-DHBA is reported to be formed solely by direct ·OH attack.37 Therefore, measurement of 2,3-DHBA appears to be a useful indicator of in vivo ·OH formation. In some studies, concentrations of 2,3-DHBA in tissues were measured following the administration of acetyl-SA (ASA) to mice. Considering that salicylate has fewer pharmacological effects than ASA does, we administered sodium salicylate injections via the tail vein rather than intraperitoneal injections of ASA. The salicylate dosage used in our study was based on studies by Coudray et al38 and Grootveld and Halliwell,39 which showed that concentrations of salicylate in plasma between 0.4 mmol/L and 1 mmol/L are able to capture some ·OH without any toxicity. We determined the time of salicylate administration (30 minutes after salicylate injection) by trial and error. To assess the liver and kidney injuries due to salicylate, we measured hematological parameters, serum AST and ALT activities, and serum creatinine and blood urea nitrogen concentrations 30 minutes after the salicylate injection. The results revealed that the fairly low doses of injected salicylate did not significantly affect the functions of the liver or kidneys, consistent with previous experimental findings related to ASA.38 Our results showed that ·OH increased significantly in the liver and kidney tissues during the 28-day period. The direct evidence for the generation of ·OH confirmed that QDs indeed induced ROS generation in vivo.
In the present study, we first evaluated the association of QD degradation and ROS generation with the toxicity of QDs in vivo. We found that these parameters (Cd2+ and ·OH) and histological changes exhibited different patterns over the 28-day period. The released Cd2+ increased significantly at 1 day. Although ROS are often implicated in Cd toxicology, ·OH generation was not significantly elevated at 1 day, but an increase was observed at 7 days. In contrast, severe damage to the liver and kidneys was observed as late as 14 days and was able to recover by 28 days. The delayed effects of Cd2+ and ·OH on tissue damage imply that many experimental variables may have influenced QD toxicity in vivo.
Following the QD exposure, the Cd2+ released from the QDs-induced MT production. Increased MT can bind Cd in the cytosol, reducing the amount of Cd available to critical organelles. MT proteins are also rich in sulfhydryl groups that can trap the Cd-generated ROS in cells.40,41 This might be the reason that only slight histological changes were observed at 1 day, whereas ·OH generation was significantly elevated at 7 days rather than at 1 day. Degradation of MT proteins is also an important aspect of MT regulation.40 When MT proteins are degraded or depleted, ·OH generation increases, a critical concentration of Cd reaches the liver or kidneys, and hepatotoxicity or renal injury occurs. With QD elimination through bile or urine, the levels of Cd2+ and ·OH gradually decrease, and the injuries to the liver and kidneys begin to recover. In summary, the QD-induced histopathological changes and the underlying mechanisms in vivo might include cellular defense mechanisms and tissue-adaptive mechanisms, which need to be more completely elucidated in the future.
Conclusion
The experimental results provide new information regarding the toxicity of QDs in vivo. Specifically, CdTe QDs can undergo degradation, release Cd2+, and produce ·OH in tissues. The QD-induced histopathological changes are time-dependent, and the histopathological abnormalities are reversible. From the data obtained in this study, we suggest that the underlying mechanisms after low-dose QD exposure in vivo seem to include cellular defense mechanisms and tissue-adaptive mechanisms, in which the initial induction of MT induced by Cd2+ can diminish the Cd-induced oxidative stress. Overall, these results imply that histological assessments should be performed at multiple time points, and the temporal analyses of the potential toxic effects of QDs might contribute to evaluation of the biological safety of QDs.
Acknowledgments
We gratefully acknowledge the financial support of the National Natural Science Foundation of China (81273131, 81573201, 31471658), the Beijing Natural Science Foundation Program, and the Scientific Research Key Program of Beijing Municipal Commission of Education (KZ201510025027).
Disclosure
The authors report no conflicts of interest in this work.
References
Yong KT, Law WC, Hu R, et al. Nanotoxicity assessment of quantum dots: from cellular to primate studies. Chem Soc Rev. 2013;42:1236–1250. | ||
Li J, Chang X, Chen X, et al. Toxicity of inorganic nanomaterials in biomedical imaging. Biotechnol Adv. 2014;32:727–743. | ||
Li J, Zhu JJ. Quantum dots for fluorescent biosensing and bio-imaging applications. Analyst. 2013;138:2506–2515. | ||
Biju V, Itoh T, Ishikawa M. Delivering quantum dots to cells: bioconjugated quantum dots for targeted and nonspecific extracellular and intracellular imaging. Chem Soc Rev. 2010;39:3031–3056. | ||
Zrazhevskiy P, Sena M, Gao X. Designing multifunctional quantum dots for bioimaging, detection, and drug delivery. Chem Soc Rev. 2010;39:4326–4354. | ||
Sharma B, Singh S, Siddiqi NJ. Biomedical implications of heavy metals induced imbalances in redox systems. Biomed Res Int. 2014;2014:640754. | ||
Bertin G, Averbeck D. Cadmium: cellular effects, modifications of biomolecules, modulation of DNA repair and genotoxic consequences (a review). Biochimie. 2006;88:1549–1559. | ||
Su Y, Hu M, Fan C, et al. The cytotoxicity of CdTe quantum dots and the relative contributions from released cadmium ions and nanoparticle properties. Biomaterials. 2010;31:4829–4834. | ||
Kirchner C, Javier AM, Susha AS, et al. Cytotoxicity of nanoparticle-loaded polymer capsules. Talanta. 2005;67:486–491. | ||
Kirchner C, Liedl T, Kudera S, et al. Cytotoxicity of colloidal CdSe and CdSe/ZnS nanoparticles. Nano Lett. 2005;5:331–338. | ||
Tang S, Cai Q, Chibli H, Allagadda V, Nadeau JL, Mayer GD. Cadmium sulfate and CdTe-quantum dots alter DNA repair in zebrafish (Danio rerio) liver cells. Toxicol Appl Pharmacol. 2013;272:443–452. | ||
Katsumiti A, Gilliland D, Arostegui I, Cajaraville MP. Cytotoxicity and cellular mechanisms involved in the toxicity of CdS quantum dots in hemocytes and gill cells of the mussel Mytilus galloprovincialis. Aquat Toxicol. 2014;153:39–52. | ||
Zhao Y, Lin K, Zhang W, Liu L. Quantum dots enhance Cu2+-induced hepatic L02 cells toxicity. J Environ Sci (China). 2010;22:1987–1992. | ||
Ambrosone A, Mattera L, Marchesano V, et al. Mechanisms underlying toxicity induced by CdTe quantum dots determined in an invertebrate model organism. Biomaterials. 2012;33:1991–2000. | ||
Ho CC, Chang H, Tsai HT, et al. Quantum dot 705, a cadmium-based nanoparticle, induces persistent inflammation and granuloma formation in the mouse lung. Nanotoxicology. 2013;7:105–115. | ||
Roberts JR, Antonini JM, Porter DW, et al. Lung toxicity and biodistribution of Cd/Se-ZnS quantum dots with different surface functional groups after pulmonary exposure in rats. Part Fibre Toxicol. 2013;10:5. | ||
King-Heiden TC, Wiecinski PN, Mangham AN, et al. Quantum dot nanotoxicity assessment using the zebrafish embryo. Environ Sci Technol. 2009;43:1605–1611. | ||
Truong L, Moody IS, Stankus DP, Nason JA, Lonergan MC, Tanguay RL. Differential stability of lead sulfide nanoparticles influences biological responses in embryonic zebrafish. Arch Toxicol. 2011;85:787–798. | ||
Liu W, Zhang S, Wang L, et al. CdSe quantum dot (QD)-induced morphological and functional impairments to liver in mice. PloS One. 2011;6:e24406. | ||
Su Y, Peng F, Jiang Z, et al. In vivo distribution, pharmacokinetics, and toxicity of aqueous synthesized cadmium-containing quantum dots. Biomaterials. 2011;32:5855–5862. | ||
Hauck TS, Anderson RE, Fischer HC, Newbigging S, Chan WC. In vivo quantum-dot toxicity assessment. Small. 2010;6:138–144. | ||
Ye L, Yong KT, Liu L, et al. A pilot study in non-human primates shows no adverse response to intravenous injection of quantum dots. Nat Nanotechnol. 2012;7:453–458. | ||
Liu N, Mu Y, Chen Y, et al. Degradation of aqueous synthesized CdTe/ZnS quantum dots in mice: differential blood kinetics and biodistribution of cadmium and tellurium. Part Fibre Toxicol. 2013;10:37. | ||
Han Y, Xie GY, Sun ZW, et al. Plasma kinetics and biodistribution of water-soluble CdTe quantum dots in mice: a comparison between Cd and Te. J Nanopart Res. 2011;13:5373–5380. | ||
Lin CH, Chang LW, Chang H, et al. The chemical fate of the Cd/Se/Te-based quantum dot 705 in the biological system: toxicity implications. Nanotechnology. 2009;20:215101. | ||
Wang L, Chen DW, Wang H, Liu Z. Effects of lead and/or cadmium on the expression of metallothionein in the kidney of rats. Biol Trace Elem Res. 2009;129:190–199. | ||
Prado J, Pifarré P, Giralt M, Hidalgo J, García A. Metallothioneins I/II are involved in the neuroprotective effect of sildenafil in focal brain injury. Neurochem Int. 2013;62:70–78. | ||
Nakajima K, Kodaira T, Kato M, et al. Development of an enzyme-linked immunosorbent assay for metallothionein-I and -II in plasma of humans and experimental animals. Clin Chim Acta. 2010;411:758–761. | ||
Yamamoto H, Watanabe T, Mizuno H, et al. In vivo evidence for accelerated generation of hydroxyl radicals in liver of Long-Evans Cinnamon (LEC) rats with acute hepatitis. Free Radic Biol Med. 2001;30:547–554. | ||
Tsai LY, Lee KT, Liu TZ. Evidence for accelerated generation of hydroxyl radicals in experimental obstructive jaundice of rats. Free Radic Biol Med. 1998;24:732–737. | ||
Derfus AM, Chan WC, Bhatia SN. Probing the cytotoxicity of semiconductor quantum dots. Nano Lett. 2004;4:11–18. | ||
Figueira E, Branco D, Antunes SC, Gonçalves F, Freitas R. Are metallothioneins equally good biomarkers of metal and oxidative stress? Ecotoxicol Environ Saf. 2012;84:185–190. | ||
Matés JM, Segura JA, Alonso FJ, Márquez J. Roles of dioxins and heavy metals in cancer and neurological diseases using ROS-mediated mechanisms. Free Radic Biol Med. 2010;49:1328–1341. | ||
Schapira RM, Ghio AJ, Effros RM, Morrisey J, Dawson CA, Hacker AD. Hydroxyl radicals are formed in the rat lung after asbestos instillation in vivo. Am J Respir Cell Mol Biol. 1994;10:573–579. | ||
Teismann P, Ferger B. The salicylate hydroxylation assay to measure hydroxyl free radicals induced by local application of glutamate in vivo or induced by the Fenton reaction in vitro. Brain Res Brain Res Protoc. 2000;5:204–210. | ||
Tabatabaei AR, Abbott FS. LC/MS analysis of hydroxylation products of salicylate as an indicator of in vivo oxidative stress. Free Radic Biol Med. 1999;26:1054–1058. | ||
Halliwell B, Kaur H. Hydroxylation of salicylate and phenylalanine as assays for hydroxyl radicals: a cautionary note visited for the third time. Free Radic Res. 1997;27:239–244. | ||
Coudray C, Talla M, Martin S, Fatôme M, Favier A. High-performance liquid-chromatography electrochemical determination of salicylate hydroxylation products as an in-vivo marker of oxidative stress. Anal Biochem. 1995;227:101–111. | ||
Grootveld M, Halliwell B. Aromatic hydroxylation as a potential measure of hydroxyl-radical formation in vivo: identification of hydroxylated derivatives of salicylate in human body fluids. Biochem J. 1986;237:499–504. | ||
Klaassen CD, Liu J, Choudhuri S. Metallothionein: an intracellular protein to protect against cadmium toxicity. Annu Rev Pharmacol Toxicol. 1999;39:267–294. | ||
Thomas JP, Bachowski GJ, Girotti AW. Inhibition of cell membrane lipid peroxidation by cadmium- and zinc-metallothioneins. Biochim Biophys Acta. 1986;884:448–461. |
 © 2016 The Author(s). This work is published and licensed by Dove Medical Press Limited. The full terms of this license are available at https://www.dovepress.com/terms.php and incorporate the Creative Commons Attribution - Non Commercial (unported, v3.0) License.
By accessing the work you hereby accept the Terms. Non-commercial uses of the work are permitted without any further permission from Dove Medical Press Limited, provided the work is properly attributed. For permission for commercial use of this work, please see paragraphs 4.2 and 5 of our Terms.
© 2016 The Author(s). This work is published and licensed by Dove Medical Press Limited. The full terms of this license are available at https://www.dovepress.com/terms.php and incorporate the Creative Commons Attribution - Non Commercial (unported, v3.0) License.
By accessing the work you hereby accept the Terms. Non-commercial uses of the work are permitted without any further permission from Dove Medical Press Limited, provided the work is properly attributed. For permission for commercial use of this work, please see paragraphs 4.2 and 5 of our Terms.