")
Back to Journals » International Journal of Nanomedicine » Volume 14
Time-dependent degradation of carbon nanotubes correlates with decreased reactive oxygen species generation in macrophages
Authors Yang M, Zhang M , Nakajima H , Yudasaka M, Iijima S, Okazaki T
Received 21 December 2018
Accepted for publication 8 March 2019
Published 24 April 2019 Volume 2019:14 Pages 2797—2807
DOI https://doi.org/10.2147/IJN.S199187
Checked for plagiarism Yes
Review by Single anonymous peer review
Peer reviewer comments 2
Editor who approved publication: Dr Thomas Webster
Mei Yang,1 Minfang Zhang,1 Hideaki Nakajima,1 Masako Yudasaka,1,2 Sumio Iijima,2 Toshiya Okazaki1
1Nanotube Application Research Center, National Institute of Advanced Industrial Science and Technology (AIST), Tsukuba, Ibaraki 305-8565, Japan; 2Faculty of Science & Technology, Meijo University, Tempaku-ku, Nagoya 468-8502, Japan
Introduction and objective: With the increase in carbon nanotube-based products on the commercial market, public concern regarding the possible toxicity of these nanomaterials has attracted much attention. Although previous studies found no obvious toxicity related to carbon nanotubes (CNTs), their safety has not been established because long-term evaluation is still needed. In vitro assays are used to understand the toxicity of nanomaterials. However, the data published so far were generated in short-term assays in which cells are continuously exposed to CNTs. Therefore, the objective of this study is to quantitatively assess the relative long-term cytotoxicity and degradation of CNTs after uptake by macrophages.
Methods: We used macrophage cell line of RAW 264.7 and primary rat Kupffer cells to investigate macrophage uptake of CNTs as well as their quantity changes up to a relatively late time point after uptake (7 days) by measuring optical absorbance in the near infrared region and Raman spectra of CNTs in the cell lysates. The time-dependent cytotoxicity was evaluated by measuring reactive oxygen species (ROS), glutathione, cell viability, and caspase 3/7 activity in 1–7 days.
Results: CNTs were degraded by approximately 25–30% within first 4 days after uptake; however, and no additional degradation occurred for the remainder of the 7-day test period. Generation of ROS by macrophages decreased as CNT degradation occurred, returning to control levels by Day 7. In the meantime, the glutathione level gradually recovered over time. There were no changes in cell viability or caspase 3/7 activation during CNT degradation.
Conclusion: These results confirm that degradation of CNTs by macrophages is associated with ROS generation. The data also suggest that CNT cytotoxicity decreases as they are degraded.
Keywords: carbon nanomaterials, biodegradation, cytotoxicity, cellular uptake
Introduction
Because of their unique physical and chemical properties, CNTs have numerous potential applications in many fields.1–3 Increasing production and use of CNTs in consumer products means that direct or indirect exposure is also increasing; therefore, the biosafety of these nanomaterials is an area of growing public concern. Previous studies show that CNTs injected into live animals accumulate mainly inside macrophages in the lung, liver, or spleen.4 While some in vivo studies did not observe any obvious toxic effects of CNTs,5,6 others show that a few types of CNT might induce pulmonary toxicity.7,8 The long-term toxicity of these materials still needs to be clarified. In vitro studies are generally used to assess toxicity because they are quicker than animal studies, less costly, and can provide more information about the underlying molecular mechanisms.9 Short-term in vitro toxicity studies demonstrate that CNTs may induce cell death, generation of ROS, genotoxicity, and inflammation.10–12 However, the cytotoxicity assays used in these studies were generally limited to cell lines that were exposed to CNTs continuously. Long-term cytotoxicity studies, especially those that evaluate changes in toxicity after CNT uptake, are lacking.
CNTs are thought to be degraded by peroxidases such as horseradish peroxidase,13 myeloperoxidase (MPO),14 and lactoperoxidase.15 Biodegradation of CNTs by neutrophils,14 macrophages,16 and even primary microglial cells17 has been studied. Importantly, it is reported that biodegraded nanotubes do not induce an inflammatory response when aspirated into the lungs of mice.14 However, biodegradation of CNTs by neutrophils or activated macrophages has only been studied within relatively short time periods (less than 24 h).14,16 By contrast, cytotoxicity studies are generally performed by co-incubating phagocytes with CNTs for 24 h or more.10,11 Studies conducted at relatively long time points after cellular uptake, and after some degradation of the CNTs has occurred, would be helpful to better understand their long-term toxicity. One long-term Raman spectroscopy-based study on degradation indicated that the structure of functionalized multi-walled CNTs (MWNTs) was damaged over time after uptake by primary microglial cells;17 however, no quantitative data on CNT degradation have been reported, and that study did not include any toxicity data.
To understand the relative long-term toxicity of CNTs after uptake by macrophages, we investigated CNT biodegradation and cytotoxicity for up to 7 days after uptake by two types of macrophage: the mouse macrophage cell line RAW 264.7 and primary rat Kupffer cells. Changes in the amount of intracellular CNTs over the 7 days were measured using our previously published optical absorption method18 and cytotoxicity was evaluated by measuring ROS, glutathione, cell viability, and caspase 3/7 activity. Over the 7-day test period, CNTs were partially degraded by macrophages. In addition, the cytotoxicity of CNTs decreased as degradation occurred.
Material and methods
CNT dispersion
In this study, we used single-walled carbon nanotubes (SWNTs) which were obtained using the super-growth method (SG-CNTs).19 The diameter of these SG-CNTs is about 1–5 nm, with the surface areas over 800 m2/g, and the metal impurities (Fe) in the sample is less than 0.5%. For cell experiment, SG-CNTs (52 mg) were dispersed in 50 mL of an aqueous solution of BSA (10 mg/mL) by sonication with a homogenizer (VC-750, Sonics & Materials, Newtown, CT, USA) for 5 h. Then, the dispersion was centrifuged at 1450× g for 30 min, and the supernatant was passed through a 40 µm filter to remove undispersed large particles. The concentration of SG-CNTs was estimated using the weight of the lyophilized SG-CNT/BSA dispersion (5 mL) and the weight of the BSA solution (5 mL) used for dispersion. The final concentration of SG-CNTs was adjusted to approximately 1 mg/mL and they were stored at 2–4 °C as a stock.
SG-CNT degradation by macrophages
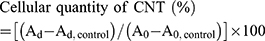
Two types of cells were used in this study. Murine RAW 264.7 macrophages cell line was obtained from the European Collection of Cell Cultures, and rat Kupffer cells (catalog no. RTKCCS) were purchased from ThermoFisher Scientific (Waltham, MA, USA). All cells were cultured as a monolayer at 37 °C in a humidified atmosphere containing 5% CO2. Cells were maintained in RPMI 1640 containing 10% fetal bovine serum, 100 U/mL penicillin, and 100 µg/mL streptomycin (all from ThermoFisher Scientific). First, RAW 264.7 and Kupffer cells were seeded into 6-well plates at 2.7×10⁵ and 1.95×10⁵ cells/well, respectively. After pre-incubation for 24 h, SG-CNTs were added to each well (final concentration, 50 µg/mL). After 24 h, the culture medium was removed, the cells were rinsed twice with PBS to remove the free SG-CNTs, and 3 mL of fresh medium was added to each well. This time point was considered Day 0. Then, the cells were incubated and analyzed on Days 1, 4, and 7. At each time point, the cell medium were removed and cells were lysed with 1 ml of a 1:1 mixture of CelLytic-M (Sigma-Aldrich Co, St Louis, MO, USA) and 5% sodium dodecylbenzenesulfonate (SDBS) at room temperature for 15 min. The recovered cell medium was centrifuged at 2000× g for 10 min and the precipitate was mixed with lysate obtained from the same wells. The precipitate was collected because it might contain CNTs transported out of the cells. For the Day 7 time point, the culture medium was replaced with fresh medium on Day 4. The removed culture medium was kept and mixed with the medium collected on Day 7. In addition, cells incubated with medium without CNTs were used as controls for every time point. Mixtures of cell lysate and the precipitate from collected culture medium were sonicated for 10 min with a horn-typed sonicator (300W, VC-750, Sonics and Materials). After sonication, transparent solutions were obtained and their absorbance at 750 nm (Ad) was measured with a UV-Vis-NIR spectrophotometer (Lambda 19, PerkinElmer Inc., Waltham, MA, USA). The intracellular quantities of SG-CNTs were estimated as the optical absorbance at 750 nm (Ad) after subtraction of the average values of the control samples (Ad, control) at each time point. The relative quantities of SG-CNTs in cells at each time point were calculated as a percentage using the following formula, where A0 represents the absorbance on Day 0:
For microscopy experiments, cells (3.6×10⁵ cells/well) were incubated with SG-CNTs (50 µg/mL) in glass-bottomed dishes for 24 h. After discarding the medium containing the SG-CNT solution, cells were washed twice with PBS and fresh culture medium was added. The cells were observed under a laser scanning confocal microscope (LSM 5 PASCAL, Carl Zeiss Meditec AG, Jena, Germany).
For Raman mapping, cells were treated with SG-CNTs for 24 h, washed, and then incubated with fresh medium for 0, 1, 4, and 7 days, as described above. At each time point, the cells were washed twice with PBS and fixed with 2.5% glutaraldehyde for 1 h. The fixed cells were measured on a confocal Raman microscope (inVia, Renishaw, Gloucestershire, UK) equipped with a 532 nm excitation laser. The samples were scanned at 200 µm (W) ×150 µm (H), with 5 µm steps. The Raman intensities of the G-bands at about 1592 cm−1 were recorded and mapped to the corresponding microscopy images. In addition, the Raman spectra of the cell lysates at each time point were also measured over the range of 1000–1800 cm−1, after drying at room temperature. The G- and D-band intensity ratios were obtained from the each of above Raman spectra.
ROS detection
ROS production was determined using the oxidation-sensitive fluorescent dye H2DCF (Thermo Fisher Scientific). Briefly, cells were seeded into 12-well plates at a density of 1.1–3.5×10⁵ cells/well) and incubated for 24 h before being treated with SG-CNTs. After co-incubation with 50 µg/mL SG-CNTs for 24 h the cells were incubated with fresh medium for 1, 4, and 7 days. As positive controls, cells were exposed to 200 µM pyocyanin (Cayman Chemical Company, Ann Arbor, MI, USA) for 3 h. At each time point, the cells were washed twice with PBS and then incubated with 2 mL of 10 µM H2DCF-DA at 37 °C for 30 min. After discarding the H2DCF-DA, cells were washed three times with PBS and then lysed using CelLytic-M reagent containing a protease inhibitor cocktail (Nacalai Tesque, Kyoto, Japan). The lysate was then centrifuged at 18,000× g for 10 min at 4 °C. The fluorescence of the resulting supernatant was measured using a microplate reader (F200, Tecan, Kawazaki, Japan) at excitation and emission wavelengths of 488 nm and 525 nm, respectively. The fluorescence intensity was normalized to the amount of protein and the relative amount of ROS was calculated as a percentage of the fluorescence intensity of the controls.
Total glutathione assay
Cells were plated, treated with SG-CNTs for 24 h, and then further incubated in fresh medium for 1–7 days, as described above. At each time point, the cells were detached with trypsin-EDTA, washed with ice-cold PBS, and centrifuged at 200× g for 10 min. The cell pellets were resuspended in 80 µL of 10 mmol/L HCl and frozen and thawed twice to rupture the cell membrane. Then, 20 µL of 5% 5-sulfosalicylic acid was added and the samples were centrifuged at 8000× g for 10 min. The supernatants were diluted 10-fold and stored at −80 °C for analysis. The amount of glutathione was quantified using a total glutathione quantification kit (Dojindo Molecular Technologies, Kumamoto, Japan). The percentage of glutathione was calculated relative to the amount obtained from control cells not treated with SG-CNTs.
Cell viability
The cytotoxicity of SG-CNTs to macrophage cells was determined using the cell proliferation reagent WST-1 (Roche Diagnostics, Mannheim, Germany) and a Bradford protein assay. For the WST-1 assay, cells were seeded on 96-well plates at a density of 2.2×10⁴ cells/well. After incubation for 24 h, the culture medium was replaced with 100 µL of culture medium containing 50 µg/mL SG-CNTs. After incubation for a further 24 h at 37 °C, the cells were rinsed twice with PBS and incubated with fresh medium for 1, 4, and 7 days. As a positive control, cells were exposed to 1 µg/mL actinomycin D (Thermo Fisher Scientific) for 24 h. At each time point, the medium in each well was replaced with 100 µL of culture medium containing 10% (v/v) WST-1 reagent. The absorbance of WST-1-derived formazan was measured at 450 nm (reference wavelength, 620 nm) using a Model 680 microplate reader (Bio-Rad Laboratories Inc., Hercules, CA, USA). The relative cell viability was calculated using the following equation, where Ablank is the absorbance of cell medium containing WST-1 and Acontrol is the absorbance of cells without SG-CNT treatment:

For the Bradford assay, cells were seeded on a 24-well plate at a density of 1.6×10⁵ cells/well in a final volume of 1 mL/well. After incubation for 24 h, the culture medium was replaced with 1 mL of culture medium containing 50 µg/mL SG-CNTs. After incubation for 24 h at 37 °C, the medium was removed and the cells were rinsed twice with PBS and incubated with fresh medium for 1, 4, and 7 days. At each time point, cells were lysed in CelLytic-M reagent containing a protease inhibitor cocktail (Nacalai Tesque). The lysate was centrifuged at 18,000× g for 10 min at 4 °C to remove SG-CNTs. In a 96-well plate, 20 µL of supernatant was mixed with 250 µL of Bradford reagent. The plates were incubated at room temperature for 10 min and the optical absorbance at 595 nm was measured using a plate reader (F200, Tecan). The quantity of protein relative to that of the control cells not treated with SG-CNTs was calculated.
Caspase 3/7 activity assay
Cells were seeded on 96-well plates at a density of 2.2×10⁴ cells/well. After pre-incubation for 24 h, the culture medium was replaced with 100 µL of culture medium containing 50 µg/mL SG-CNTs. After incubation for a further 24 h at 37 °C, the culture medium was removed and the cells were rinsed twice with PBS and incubated with fresh medium for 1, 4, and 7 days. As a positive control, cells were exposed to 1 µg/mL actinomycin D (Thermo Fisher Scientific) for 3 h. At each time point, the cells were incubated for 30 min at room temperature with 100 µL of cell culture medium and 100 µl of Caspase-Glo 3/7 reagent (Promega Corporation. Fitchburg, WI, USA). The cell lysates were then centrifuged at 18,000× g for 10 min to remove SG-CNTs. Supernatants (100 µL) were transferred to white-walled 96-well plates and the luminescence of each sample was measured using a luminometer (F200, Tecan). The results were normalized to the amount of total protein and the amount of active caspase 3/7 in non-SG-CNT-treated cells.
Statistical analysis
All data are expressed as the mean ± SD. Statistical analyses were performed using Prism software (GraphPad Software, Inc., La Jolla, CA, USA). Data were analyzed by one-way analysis of variance followed by Dunnett’s multiple comparisons test. P-values <0.05 were considered significant.
Results
Characteristics of SG-CNT dispersion
SG-CNTs dispersed in aqueous BSA solution were homogenous, and DLS measurements showed that the particles measured 70–150 nm (Figure S1A). transmission electron microscopy (TEM) images showed small bundles of SG-CNTs without large aggregates (Figure S1B); the lengths and diameters of the SG-CNTs bundles were estimated at 100–400 nm and 3–7 nm, respectively.
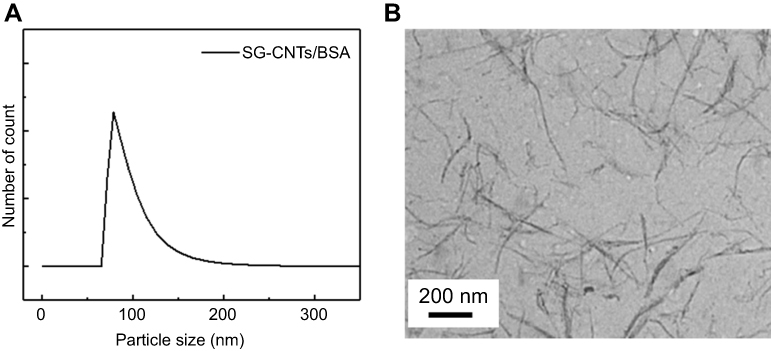 | Figure S1 (A) DLS measurement of the SG-CNT dispersion. (B) TEM image of SG-CNTs obtained by observation of one drop of SG-CNT dispersion on a TEM grid after drying at room temperature.Abbreviations: DLS, dynamic light scattering; SG-CNT, super-growth carbon nanotube; TEM, transmission electron microscopy. |
Biodegradation of SG-CNTs in RAW 264.7 and kupffer cells
To confirm uptake of CNTs by macrophages, RAW 264.7 cells were incubated for 24 h with medium containing SG-CNTs at 50 µg/mL, which was the highest concentration of SG-CNTs that did not induce obvious cell death in our previous study.20 After cellular uptake, the amount of SG-CNTs degraded by macrophages was estimated on Days 0, 1, 4, and 7.
Figure 1A shows microscopy images of RAW 264.7 cells at 0–7 days after uptake of SG-CNTs. SG-CNTs were clearly engulfed by the RAW 264.7 cells and appeared as black spots inside the cells at Day 0. The SG-CNTs appeared to be within the lysosomes of engulfing macrophages, as reported in our previous study.20 The black spots representing SG-CNTs inside the RAW 264.7 cells decreased after incubation for an additional 1–7 days, suggesting that some of the SG-CNTs were degraded by the RAW 264.7 cells. To quantify the amount of SG-CNT degradation by macrophages, the SG-CNTs in the cell lysate were measured using the optical absorption method.18 As shown in Figure 1B, the amount of SG-CNTs decreased by about 30% from Day 0 to Day 1; almost no further degradation occurred between Day 4 and Day 7. As shown in the inset picture in Figure 1B, degradation of SG-CNTs in macrophages is clearly indicated by the lighter black color of the lysates at Day 7 compared to Day 0.
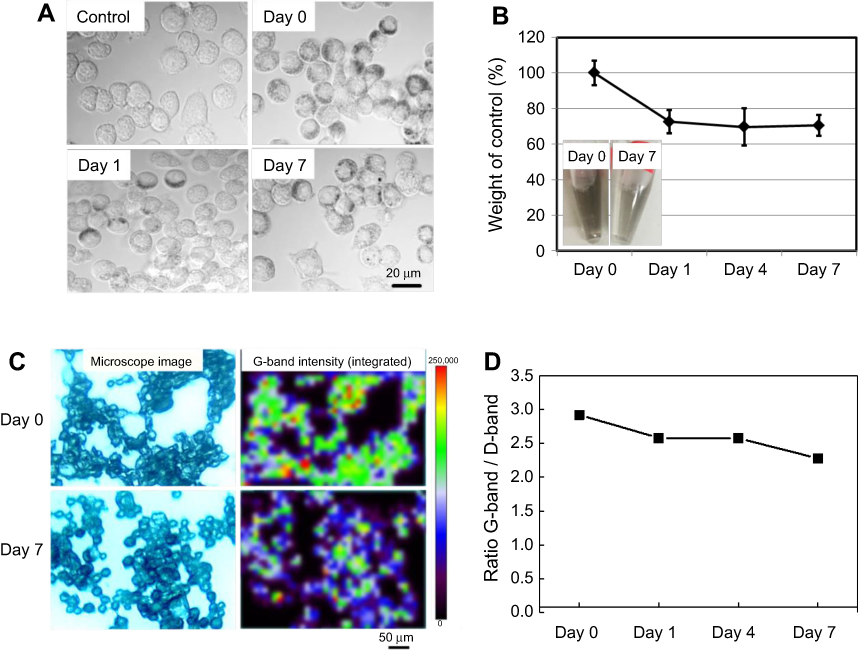 | Figure 1 Degradation of SG-CNTs in RAW 264.7 macrophages. (A) DIC images of control RAW 264.7 cells incubated with SG-CNTs for 24 h (Day 0), and images taken on Day 1 and Day 7, obtained by confocal microscopy. CNTs appear as black spots. (B) The intracellular SG-CNT levels in RAW 264.7 cells at the indicated time points were estimated from the optical absorbance of the cell lysate at 750 nm. Data represent the percentages of SG-CNTs relative to the starting concentration (Day 0) and are expressed as the mean ± SD of three independent replicates. The insets show the cell lysates at Day 0 and Day 7. (C) Microscopy Raman mapping images of G-band intensities of SG-CNTs in RAW 264.7 cells fixed with glutaraldehyde at Day 0 and Day 7 (right), along with the corresponding microscopy images (left). (D) The ratio of G-band and D-band intensities for cell lysates obtained at each time point.Abbreviations: DIC, differential interference contrast; SG-CNT, super-growth carbon nanotube. |
Raman spectroscopy is a powerful approach for investigating the structures of CNTs.21 The Raman G-band at about 1590 cm−1 and the D-band at about 1350 cm−1 indicate intact CNTs and defective CNTs, respectively. The Raman mapping images of the G-band intensities of intracellular SG-CNTs within RAW 264.7 cells are shown in Figure 1C. The G-band intensity decreased from Day 0 to Day 7, indicating that the quantity of intact CNTs in RAW 264.7 cells decreased. Furthermore, the ratio of the G-band to the D-band also decreased over time (Figure 1D), indicating that a larger proportion of the remaining SG-CNTs was damaged at Day 7 than at Day 0.
Similar behavior was observed in primary Kupffer cells. Although Kupffer cells took up fewer SG-CNTs than RAW 264.7 cells, the black spots indicating SG-CNTs inside Kupffer cells also decreased after 7 days (Figure 2A). The levels of SG-CNTs in cell lysates decreased by about 25% between Day 0 and Day 4 and did not significantly decrease further by Day 7 (Figure 2B). The degradation of SG-CNTs by Kupffer cells was therefore similar to that of RAW 264.7 cells. Because Kupffer cells don’t proliferate, a long-time observation was carried out up to 26 days (FigureS2). The result showed that about 50% amount of oxidized SG-CNTs was degraded by kupffer cells in 5 days and no further significantly change for further incubation from 5 days to 26 days.
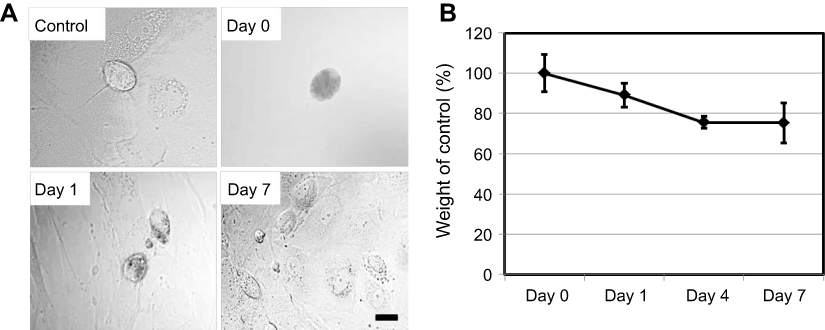 | Figure 2 Degradation of SG-CNTs in Kupffer cells. (A) Confocal microscopy DIC images of control Kupffer cells and cells incubated with SG-CNTs for 24 h (Day 0), and on Day 1 and Day 7. CNTs appear as black spots. Scale bar, 20 µm. (B) The intracellular SG-CNT levels in Kupffer cells at various time points were estimated from the optical absorbance of cell lysate at 750 nm. Data represent the percentage of SG-CNTs relative to the starting concentration and are expressed as the mean ± SD of three independent replicates.Abbreviations: DIC, differential interference contrast; SG-CNT, super-growth carbon nanotube. |
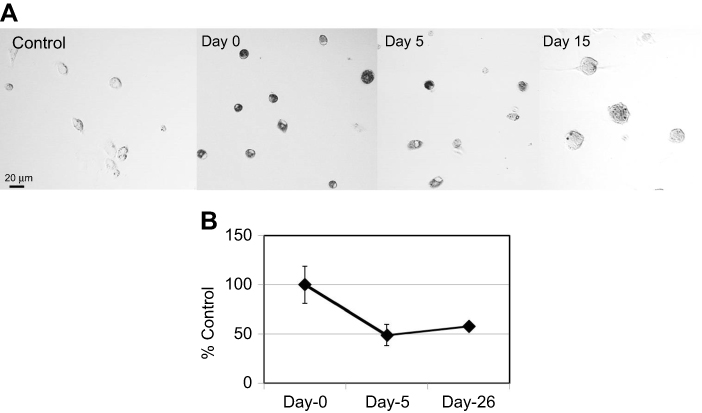 | Figure S2 Degradation of ox-SG-CNTs in Kupffer cells. (A) Confocal microscopy DIC images of control Kupffer cells and that incubated with ox-SG-CNTs for 24 h (Day 0), and at Day 5 and Day 15. CNTs appear as black spots. Scale bar, 20 µm. (B) The intracellular ox-SG-CNT levels in Kupffer cells at various time points were estimated from the optical absorbance of cell lysate at 750 nm. Data represent the percentage of SG-CNTs relative to the starting concentration and are expressed as the mean ± SD of three independent replicates.Abbreviations: DIC, differential interference contrast; ox-SG-CNT, super-growth carbon nanotubes after treatment with H2SO4/HNO3 for about 40 min at 70oC. |
Cytotoxicity in macrophages decreases after SG-CNT uptake
Cell viability
The WST-1 assay determines mitochondrial activity based on a colorimetric analysis of a formazan dye derived from the cleavage of tetrazolium rings by mitochondrial dehydrogenase enzymes, which reflects cell viability. The WST-1 assay results (Figure 3A) showed no significant reduction in viability of either type of macrophage up to 7 days after SG-CNT uptake. The Bradford assay results (Figure 3B) also indicated that the total protein content of the cells were not much different from control cells after uptake of SG-CNTs.
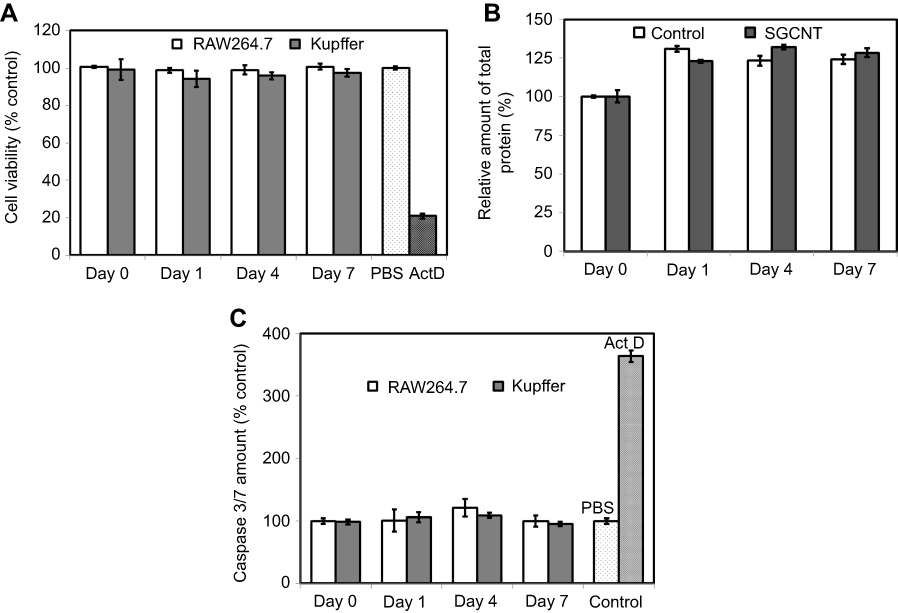 | Figure 3 Cytotoxicity assay of RAW 264.7 and Kupffer cells. RAW 264.7 or Kupffer cells were incubated with SG-CNTs for 24 hrs and washed (Day 0). Cell viability was assessed after 1–7 days of further incubation without adding additional SG-CNTs to the medium. (A) WST-1 assay results. As a positive control, cells were exposed to 1 µg/mL Act D for 24 h. Data were normalized to the viability of control cells (non-CNT-treated) at each time point and represent the mean ± SD of five replicates. (B) Bradford assay results. The data were normalized to the protein concentration in control cells (non-CNT-treated) at Day 0 and represent the mean ± SD of five replicates. (C) Caspase 3/7 activity of RAW 264.7 and Kupffer cells. As a positive control, cells were treated with 1 µg/mL Act D for 3 h. Data were normalized to the activity in control cells (non-CNT-treated) at each time point and represent the mean ± SD of five replicates.Abbreviations: Act D, actinomycin D; SG-CNT, super-growth carbon nanotube. |
Apoptosis of macrophage cells after SG-CNT uptake was studied by measurement of caspase 3/7 activity at each time point. Caspase 3/7 activity in both RAW 264.7 and Kupffer cells was not affected significantly by uptake of SG-CNTs (Day 0) or by further incubation for 7 days (Figure 3C), suggesting that uptake of SG-CNTs by macrophages did not induce apoptosis.
Generation of ROS and glutathione
ROS generation by RAW 264.7 and Kupffer cells was evaluated after SG-CNT uptake (Figure 4A). The amount of ROS generated by RAW 264.7 and Kupffer cells increased by approximately 2.8- and 2.2-fold, respectively, after SG-CNT uptake (compared with control cells). ROS generation decreased significantly during the incubation period and reached levels observed in non-SG-CNT-treated control cells by 7 days. The decrease in ROS generation by both RAW 264.7 and Kupffer cells correlated well with the decrease in intracellular SG-CNT content (Figures 1B and 2B).
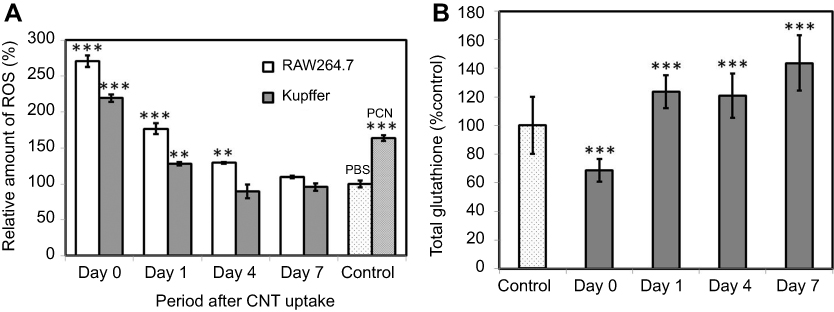 | Figure 4 (A) ROS generation in RAW 264.7 and Kupffer cells. Positive control cells treated with 200 µM PCN for 3 h. Data represent the ROS level relative to that of control cells (non-CNT-treated) at each time point and are expressed as the mean ± SD of three independent replicates. (B) Total glutathione levels in RAW 264.7 macrophages after SG-CNT uptake. Data represent the glutathione level relative to that of control cells (non-CNT-treated) at each time point, and are expressed as the mean ± SD of three independent replicates. **P<0.01 and ***P<0.001 versus control cells.Abbreviations: PCN, pyocyanin; SG-CNT, super-growth carbon nanotube. |
To further confirm the decrease in ROS generation after uptake of SG-CNTs, total glutathione, which reflects a cell’s ability to resist oxidation, was measured. At Day 0 after SG-CNT uptake, the total glutathione level dropped to about 68% of the level in control cells (without SG-CNT uptake). Glutathione levels recovered gradually to about 120% and 140% of control levels at Day 4 and Day 7, respectively (Figure 4B), corresponding with the decrease in ROS levels (Figure 4A).
Discussion
When CNTs are administered systemically they are initially internalized by macrophages. Activated macrophages rapidly generate ROS through the nicotinamide adenine dinucleotide phosphate (NADPH) oxidase pathway to degrade internalized foreign objects, which is known as a respiratory burst.22 Recently, the possibility of CNT biodegradation by macrophages was confirmed by many studies.16,23–25 Mechanistic studies show that after activation by CNTs, the NADPH oxidase complex assembles at the phagolysosomal membrane and transfers electrons to oxygen to form superoxide anions, which are then catalyzed by superoxide dismutase to form H2O2. The enzymes such as MPO further combines H2O2Cl- to produce hypochlorite, which plays a crucial role in degradation of CNTs.23,25,26 In addition, Hou et al found that the respiratory burst inducer phorbol myristate acetate would accelerate biodegradation of SWNT while co-incubated with N-acetyl-L-cysteine (NAC), a ROS scavenger, significantly inhibited the SWNT degradation in RAW 264.7.16 ROS induced damages in MWNT and the treatment with NAC induced a decrease in hole surface area and number of holes per surface unit were also proved by the observation using the liquid-cell TEM.23 Our results indicate that uptake of SG-CNTs induced ROS generation by macrophages, but that the amount of ROS generation decreased with increasing incubation time (Figure 4A). The decrease in ROS showed a trend similar to the decrease in SG-CNTs within macrophages (Figures 1B and 2B), suggesting that ROS were involved in degradation of SG-CNTs. In addition, because the ROS level returned to normal after partial degradation of internalized CNTs, complete degradation of SG-CNTs by the macrophages used in this study could not be achieved.
By contrast, excessive ROS accumulation leads to cellular injury, including damage to DNA, proteins, and lipid membranes, which collectively is known as oxidative stress.27,28 It is commonly accepted that cytotoxicity caused by nanoparticles such as CNTs is largely due to oxidative stress.29 Cytotoxicity assays show that excessive CNTs induce ROS generation,30 leading to lysosome membrane damage31,32 and cell death. No study has examined whether ROS generation induced by CNT uptake is sustained over the long term. Although one report shows that degraded CNTs induced less inflammation when injected into tissue,14 the long-term cytotoxicity of CNTs after cellular uptake is still not clear. Our results show for the first time that ROS generation by macrophages decreases as CNTs are degraded, suggesting that degraded CNTs are less cytotoxic.
Furthermore, the glutathione level gradually recovered over time (Figure 4B). Glutathione is a major intracellular low-molecular-weight thiol compound that plays a critical role in defense against oxidative stress in mammalian cells. Elgrabli et al also reported that after exposure to MWNTs for 24 h, expression of glutathione S-transferase mRNA increased, suggesting that the cells had begun to regulate ROS production.23 Here, we found that the decrease in glutathione (Figure 4B) reflected an increase in ROS generation at early time points (Figure 4A). Recovery of glutathione production at later time points suggested that the balance between ROS generation and antioxidant defenses had been re-established. Because the SG-CNTs became structurally damaged (Figure 1D), and because carboxylic groups are induced after partial degradation of CNTs by ROS-mediated oxidation,33 the remaining residues of CNTs would be more hydrophilic and more biocompatible, which might explain the decrease in ROS levels as SG-CNT degradation decreased. In addition, recent studies have shown that SWNTs could inhibit the heat shock protein 90 (HSP90)34 and that inhibition of HSP90 could reduce the NADPH oxidases.35 This might be another reason for the regulation of ROS levels following the CNT exposure. Our results indicate that when macrophages engulf CNTs at a small enough dose to avoid acute cytotoxicity, long-term toxicity is also avoided. Although the toxicity and biodegradation behaves of CNTs might be influenced by their physicochemical properties, the results obtained in this study could explain in vivo test results indicating that some SWNTs and MWNTs persist in the macrophages of living animals for several months or even years without obvious adverse effects such as inflammation.6,36
Conclusion
In conclusion, we used macrophage cell line of RAW 264.7 and primary rat Kupffer cells to investigate the intracellular degradation of CNTs and the cytotoxicity of SG-CNTs at relatively late time points after uptake. The results showed that about 25–30% of the CNTs taken up by macrophages were degraded within the first 4 days, and that the remaining CNTs continued to accumulate structural damage throughout the rest of the test period. Degradation of CNTs within macrophages was consistent with the levels of ROS and total glutathione. Despite this, CNTs induced a low amount of cytotoxicity, and caspase 3/7 activity did not increase. These data suggest that at early time points after CNT uptake, ROS are consumed to promote CNT degradation and that the residues of CNTs that remain inside macrophages for at least several days no longer induce cytotoxicity. This result may impact our understanding of the long-term safety of CNTs.
Acknowledgment
This work was supported in part by a KAKENHI Grant-in-Aid for Scientific Research B from the Japan Society for the Promotion of Science (17H02742) and by the Zeon Corporation.
Disclosure
The authors report no conflicts of interest in this work.
References
1. De Volder MFL, Tawfick SH, Baughman RH, Hart AJ. Carbon nanotubes: present and future commercial applications. Science. 2013;339(6119):535–539. doi:10.1126/science.1222453
2. Baughman RH, Zakhidov AA, Heer WA. Carbon nanotubes-the route toward applications. Science. 2002;297(5582):787–792. doi:10.1126/science.1060928
3. Yang W, Thordarson P, Gooding JJ, Ringer SP, Braet F. Carbon nanotubes for biological and biomedical applications. Nanotechnology. 2007;18(41):412001. doi:10.1088/0957-4484/18/49/495102
4. Jacobsen NR, Møller P, Clausen PA, et al. Biodistribution of carbon nanotubes in animal models. Basic Clin Pharmacol Toxicol. 2017;121(Suppl 3):30–43. doi:10.1111/bcpt.12705
5. Schipper ML, Nakayama-Ratchford N, Davis CR, et al. A pilot toxicology study of single-walled carbon nanotubes in a small sample of mice. Nat Nanotechnol. 2008;3(4):218–221. doi:10.1038/nnano.2008.68
6. Yang ST, Wang X, Jia G, et al. Long-term accumulation and low toxicity of single-walled carbon nanotubes in intravenously exposed mice. Toxic Lett. 2008;181(3):182–189. doi:10.1016/j.toxlet.2008.07.020
7. Lam CW, James JT, McCluskey R, Hunter R. Pulmonary toxicity of single-wall carbon nanotues in mice 7 and 90 days after intratracheal instillation. Toxicol Sci. 2004;77(1):126–134. doi:10.1093/toxsci/kfg243
8. Madani SY, Mandel A, Seifalian AM. A concise review of carbon nanotube’s toxicology. Nano Rev. 2013;4:21521. doi:10.3402/nano.v4i0.21521
9. Scholz S, Sela E, Blaha L, et al. A European perspective on alternatives to animal testing for environmental hazard identification and risk assessment. Requl Toxicol Pharmacol. 2013;67(3):506–530. doi:10.1016/j.yrtph.2013.10.003
10. Ali-Boucetta H, Al-Jamal KT, Müller KH, et al. Cellular uptake and cytotoxic impact of chemically functionalized and polymer-coated carbon nanotubes. Small. 2011;7(22):3230–3238. doi:10.1002/smll.201101004
11. Patholla A, Knighten B, Tchounwou P. Multi-walled carbon nanotubes induce cytotoxicity, genotoxicity and apoptosis in normal human dermal fibroblast cells. Ethn Dis. 2010;20(1Suppl 1):
12. Liu Y, Zhao Y, Sun B, Chen C. Understanding the toxicity of carbon nanotubes. Acc Chem Res. 2013;46(3):702–713. doi:10.1021/ar300028m
13. Allen BL, Kichambare PD, Gou P, et al. Biodegradation of single-walled carbon nanotubes through enzymatic catalysis. Nano Lett. 2008;8(11):3899–3903. doi:10.1021/nl802315h
14. Kagan VE, Konduru NV, Feng W, et al. Carbon nanotubes degraded by neutrophil myeloperoxidase induce less pulmonary inflammation. Nat Nanotechnol. 2010;5(5):354–359. doi:10.1038/nnano.2010.44
15. Andón FT, Kapralov AA, Yanamala N, et al. Biodegradation of single-walled carbon nanotubes by eosinophil peroxidase. Small. 2013;9(16):2721–2729. doi:10.1002/smll.201202508
16. Hou J, Wan B, Yang Y, Ren X-M, Guo L-H, Liu J-F. Biodegradation of single-walled carbon nanotubes in macrophages though respiratory burst modulation. Int J Mol Sci. 2016;17(3):409. doi:10.3390/ijms17030409
17. Bussy C, Hadad C, Prato M, Bianco A, Kostarelos K. Intracellular degradation of chemically functionalized carbon nanotubes using a long-term primary microglial culture model. Nanoscale. 2016;8:590–601. doi:10.1039/C5NR06625E
18. Zhang M, Zhou X, Iijima S, Yudasaka M. Small-sized carbon nanohorns enabling cellular uptake control. Small. 2012;8(16):2524–2531. doi:10.1002/smll.201200013
19. Hata K, Futaba DN, Mizuno K, Namai T, Yumura M, Iijima S. Water-assisted highly efficient synthesis of impurity-free single-walled carbon nanotubes. Science. 2004;306(5700):1362–1364. doi:10.1126/science.306.5698.956a
20. Zhang M, Yang M, Morimoto T, et al. Size-dependent cell uptake of carbon nanotubes by macrophages: a comparative and quantitative study. Carbon. 2018;127:93–101. doi:10.1016/j.carbon.2017.10.085
21. Dresselhaus MS, Dresselhaus G, Saito R, Jorio A. Raman spectroscopy of carbon nanotubes. Phys Rep. 2005;409(2):47–99. doi:10.1016/j.physrep.2004.10.006
22. Babior BM, Lambeth JD, Nauseef W. The neutrophil NADPH oxidase. Arch Biochem Biophys. 2002;397(2):342–344. doi:10.1006/abbi.2001.2642
23. Elgrabli D, Dachraoui W, Ménard-Moyon C, et al. Carbon nanotube degradation in macrophages: live nanoscale monitoring and understanding of biological pathway. ACS Nano. 2015;9(10):10113–10124. doi:10.1021/nn507282f
24. Kagan VE, Kapralov AA, St Croix CM, et al. Lung macrophages “digest” carbon nanotubes using a superoxide/peroxynitrite oxidative pathway. ACS Nano. 2014;8(6):5610–5621. doi:10.1021/nn406484b
25. Ding Y, Tian R, Yang Z, Chen J, Lu N. NADPH oxidase-dependent degradation of single-walled carbon nanotubes in macrophages. J Mater Sci Mater Med. 2017;28(1):7.
26. Vlasova II, Sokolov AV, Chekanov AV, Kostevich VA, Vasilyev VB. Myeloperoxidase-induced biodegradation of single-walled carbon nanotubes is mediated by hypochlorite. Bioorg Khim. 2011;37(4):510–521.
27. Schieber M, Chandel NS. ROS function in redox signaling and oxidative stress. Curr Biol. 2014;24(10):R453–R462. doi:10.1016/j.cub.2014.03.034
28. Cross CE, Halliwell B, Borish ET, et al. Oxygen radicals and human disease. Ann Int Med. 1987;107(4):526–545. doi:10.7326/0003-4819-107-4-526
29. Shvedova AA, Pietroiusti A, Fadeel B, Kagan VE. Mechanisms of carbon nanotube-induced toxicity: focus on oxidative stress. Toxicol Appl Pharmacol. 2012;261(2):121–133. doi:10.1088/0957-4484/18/49/495102
30. Nel A, Xia T, Mädler L, Li N. Toxic potential of materials at the nanolevel. Science. 2006;311(5761):622–627. doi:10.1126/science.1114397
31. Wan B, Wang ZX, Lv QY, et al. Single-walled carbon nanotubes and graphene oxides induceautophagosome accumulation and lysosome impairment in primarilycultured murine peritoneal macrophages. Toxicol Lett. 2013;221(2):118–127. doi:10.1016/j.toxlet.2013.06.208
32. Yang M, Zhang M, Tahara Y, et al. Lysosomal membrane permeabilization: carbon nanohorn-induced reactive oxygen species generation and toxicity by this neglected mechanism. Toxicol Appl Pharmacol. 2014;280(1):117–126. doi:10.1016/j.taap.2014.07.022
33. Allen BL, Kotchey GP, Chen Y, et al. Mechanistic investigations of horseradish peroxidase-catalyzed degradation of single-walled carbon nanotubes. J Am Chem Soc. 2009;131(47):17194–17205. doi:10.1021/ja9083623
34. Ong LC, Tan YF, Tan BS, et al. Single-walled carbon nanotubes (SWCNTs) inhibit heat shock protein 90 (HSP90) signaling in human lung fibroblasts and keratinocytes. Toxicol Appl Pharmacol. 2017;329:347–357. doi:10.1016/j.taap.2017.06.024
35. Chen F, Pandey D, Chadli A, et al. Hsp90 regulates NADPH oxidase activity and is necessary for superoxide but not hydrogen peroxide production. Antioxid Redox Signal. 2011;14(11):2107–2119. doi:10.1089/ars.2010.3669
36. Sato Y, Yokoyama A, Nodasaka Y, et al. Long-term biopersistence of tangled oxidized carbon nanotubes inside and outside macrophages in rat subcutaneous tissue. Sci Rep. 2013;3:2516. doi:10.1038/srep02516
Supplementary materials
Characteristics of SG-CNT dispersion
To characterize the SG-CNT dispersion, we determined particle sizes of SG-CNT dispersion by dynamic light scattering (DLS) (FPAR-1000, Otsuka Electronics, Osaka, Japan). The result showed that the particles measured 70–150 nm (Figure S1A). SG-CNTs dispersed in BSA solution were observed under a TEM (Topcon EM-002B, Tokyo, Japan). For TEM observation, the SG-CNT dispersion was dropped onto a TEM grid with a carbon film coating. The lengths and diameters of the SG-CNTs bundles were estimated from TEM image (Figure S1B) to be at 100–400 nm and 3–7 nm, respectively.
Biodegradation of oxidized SG-CNTs (ox-SG-CNTs) in kupffer cells
As-grown SG-CNTs (24.5 mg) were oxidized by 48 mL of concentrated sulfuric acid: nitric acid at a ratio of 3:1 at 70 °C for 40 min, after diluting the solution with deionized water, the SG-CNTs were filtered and washed with pure water for five times until the pH of the filtrate was neutral. Then the obtained SG-CNTs were indicated as ox-SG-CNTs. These ox-SG-CNTs dispersed well in water after with a homogenizer (VC-750, Sonics & Materials, Newtown, CT, USA) for 10 min.
Kupffer cells were incubated with ox-SG-CNTs (50 µg/mL) for 24 hrs and washed (Day 0). The degradation protocol is the same as SG-CNTs mentioned in the method part. Because Kupffer cells don’t proliferate, a long-time observation was carried out up to 26 days. After uptake of ox-SG-CNT, we can found that the cells became black color representing ox-SG-CNTs inside the kupffer cells. The black color of cells was faded after uptake for 5 days and 15 days, suggesting that the ox-SG-CNTs were degraded by the kupffer cells (Figure S2A). Quantitative measurement by using optical absorbance at 750 nm showed that about 50% of ox-SG-CNTs were degraded from Day 0 to Day 5. The amount of ox-SG-CNTs did not significantly decrease further to Day 26 (Figure S2B).
 © 2019 The Author(s). This work is published and licensed by Dove Medical Press Limited. The full terms of this license are available at https://www.dovepress.com/terms.php and incorporate the Creative Commons Attribution - Non Commercial (unported, v3.0) License.
By accessing the work you hereby accept the Terms. Non-commercial uses of the work are permitted without any further permission from Dove Medical Press Limited, provided the work is properly attributed. For permission for commercial use of this work, please see paragraphs 4.2 and 5 of our Terms.
© 2019 The Author(s). This work is published and licensed by Dove Medical Press Limited. The full terms of this license are available at https://www.dovepress.com/terms.php and incorporate the Creative Commons Attribution - Non Commercial (unported, v3.0) License.
By accessing the work you hereby accept the Terms. Non-commercial uses of the work are permitted without any further permission from Dove Medical Press Limited, provided the work is properly attributed. For permission for commercial use of this work, please see paragraphs 4.2 and 5 of our Terms.